Embed Size (px)
Citation preview

Grade 7 Mathematics Curriculum Outcomes 29
Outcomes with Achievement Indicators
Unit 1
Grade 7 Mathematics
Unit 1
Patterns and Relations
Estimated Time: 21 Hours
[C] Communication [PS] Problem Solving
[CN] Connections [R] Reasoning
[ME] Mental Mathematics [T] Technology
and Estimation [V] Visualization

Grade 7 Mathematics Curriculum Outcomes 30
Outcomes with Achievement Indicators
Unit 1
Unit 1: Patterns and Relations
Grade 7 Math Curriculum Guide 31
Unit 1 Overview
Introduction
Students will develop their ability to explore a variety of situations involving patterns and change.
Students will explore three different ways to represent change - words, tables, and graphs. They will then
move into symbolic representation using simple expressions & equations. The big ideas in this unit are:
• Words and symbols can be used to describe patterns.
• A variable is a symbol that acts as a place holder. It can represent a number or a set of numbers.
• Algebraic expressions are used to describe patterns. Any term in a pattern can be found by
replacing the variable with the term number the student is trying to find.
• The relationship between the term in a pattern and its term number is called a relation.
• Relations can be represented either symbolically, or as tables, or graphically. They can be used
to model situations and solve problems related to those situations.
• A statement of equality between two expressions is called an equation.
Context The students have used number patterns to explore the rules of divisibility. They will extend this
technique and explore divisibility for this entire list; 2, 3, 4, 5, 6, 8, 9.
The students will be introduced to the concept of variables and how to create expressions from
uncomplicated situations and basic statements. They will learn that a variable is a place holder and, as
such, can be replaced. A value can then be determined for the expression. Patterns will be represented by relations and these relations will be used to make predictions and/or solve
problems. Connections will be made between representing relations in three ways; symbolically,
graphically, and in tabular form. Students will determine which method is best for each relation as it
pertains to making predictions or solving problems.
Students will extend this knowledge of expressions and create equations. They will learn that the solution
to an equation is the number that can be used to replace the variable and make the equation a true
statement. To help find solutions to equations students will learn to model and solve equations using
algebra tiles.
Why are these concepts important?
Being able to identify and extend patterns is critical to:
• Problem solving
• Algebraic reasoning
Using variables, employing algebraic reasoning and solving equations are all concepts that can successfully be developed in conjunction with each other. These concepts will be extremely useful in the
student’s future study of math, science, social studies, etc. The ability to reason logically and model
situations to solve problems is a skill that can be utilized in all walks of life and a great many trades and
professions.
“A mathematician, like a painter or a poet, is a maker of patterns. If his patterns are more permanent
than theirs, it is because they are made with ideas.” Godfrey Harold Hardy (1877 - 1947)

Strand: Number
Grade 7 Mathematics Curriculum Outcomes 32
Outcomes with Achievement Indicators
Unit 1
General Outcome: Develop Number Sense
Specific Outcome
It is expected that students will:
7N1 Determine and explain
why a number is divisible by
2, 3, 4, 5, 6, 8, 9 or 10, and
why a number cannot be
divided by 0. [C, R]
Achievement Indicators:
Elaborations: Suggested Learning and Teaching Strategies
In earlier grades, students have built their understanding of
sequences and number patterns. These patterns are used to
develop the rules of division of larger numbers. It is assumed
that students can:
• recognize number patterns in tables
• extend a table of values using a pattern
• describe the relationships among terms in a table
Exploration of the divisibility rules serves as an excellent
opportunity to extend number sense. Instruction should be
organized so that the students can arrive at the divisibility rules
themselves. For example, see the Explore, p.6 of the student
text. Knowledge of divisibility rules will provide a valuable
tool for mental arithmetic and general development of
operation sense.
Students may have been exposed to the divisibility rules for 2,
5, and 10 since they are simple number patterns. A list of
divisibility rules can be found in the Student Text on p.12.
An alternate rule for divisibility by 8 is that a number is
divisible by 8 if the number is divisible by 4 and the resulting
quotient is even. For 92, think 92 ÷ 4 = 23, since 23 is not
even, 92 is not divisible by 8.
It is important for students to notice that a number divisible by
8, for example, is also divisible by 4 and by 2. In general, if a
number is divisible by another number then it is also divisible
by the factors of that number. The converse of this is not
always true. For example, 24 is divisible by 3 and 6. But it is
not divisible by 18 (3 x 6) since 3 and 6 have 3 as a common
factor. This should be seen as a problem solving opportunity
for students.
It is also important to learn how to test for divisibility on a
calculator. That is, students should realize that the test for
divisibility on a calculator involves dividing to see if the
quotient is a whole number. For example, to find if 276 is
divisible by 8, have students use a calculator to calculate
276 ÷ 8. Since the calculator shows 34.5, it tells them that 276
is not divisible by 8.
7N1.1 Determine if a
given number is divisible
by 2, 3, 4, 5, 6, 8, 9 or 10,
and explain why.
Strand: Number
Grade 7 Mathematics Curriculum Outcomes 33
Outcomes with Achievement Indicators
Unit 1
General Outcome: Develop Number Sense
Suggested Assessment Strategies
Paper and Pencil
1. Once you know that a particular number is divisible by 3 and 5,
how does this help you in determining whether it is divisible by
15? Explain, using an example.
2. Have students create 5 numbers that are divisible by both 2 and
10. Are all these numbers also divisible by 20? Explain.
3. A number is divisible by both 3 and 6. Must it be divisible by
18? Explain.”
4. Ask students to complete the number by filling in each blank
with a digit. Ask them to explain, using divisibility rules, how
they know their answers are correct.
A. 26_ is divisible by 10
B. 154_ is divisible by 2
C. _6_ is divisible by 6
D. 26_ is divisible by 3
E. 1_ 2 is divisible by 9
F. 15_ is divisible by 4
5. There will be 138 people at a party. Can the host fill tables of 5?
Tables of 6? Etc. Support your answer by using divisibility
rules.
Informal Observation
1. Play “Divisibility Challenge” (Master 1.6 in Teacher Resource)
with the class once all the divisibility rules have been
discovered. Note: When extending the game to the 10-sided die
rolling, if a student rolls a 7 then they will have to re-roll since
we have not covered the divisibility rule for 7.
2. Try the divisibility rule matching game which can be found at
the Oswego City School District (http://www.oswego.org/):
http://www.oswego.org/ocsd-
web/match/dragflip.asp?filename=slanedivrules
Resources/Notes
Math Makes Sense 7
Lesson 1.1
Lesson 1.2
Unit 1: Patterns and
Relations
TR: ProGuide, pp. 4–7 &
8–11
Master 1.10, 1.12, 1.22
Master 1.13, 1.23
CD-ROM Unit 1 Masters
ST: pp. 6–9 & 10–13
Practice and HW Book
pp. 4–5 & 6–8
Strand: Number
Grade 7 Mathematics Curriculum Outcomes 34
Outcomes with Achievement Indicators
Unit 1
General Outcome: Develop Number Sense
Specific Outcome
It is expected that students will:
7N1 Determine and explain
why a number is divisible by
2, 3, 4, 5, 6, 8, 9 or 10, and
why a number cannot be
divided by 0. [C, R]
(Cont’d)
Achievement Indicators:
Elaborations: Suggested Learning and Teaching Strategies
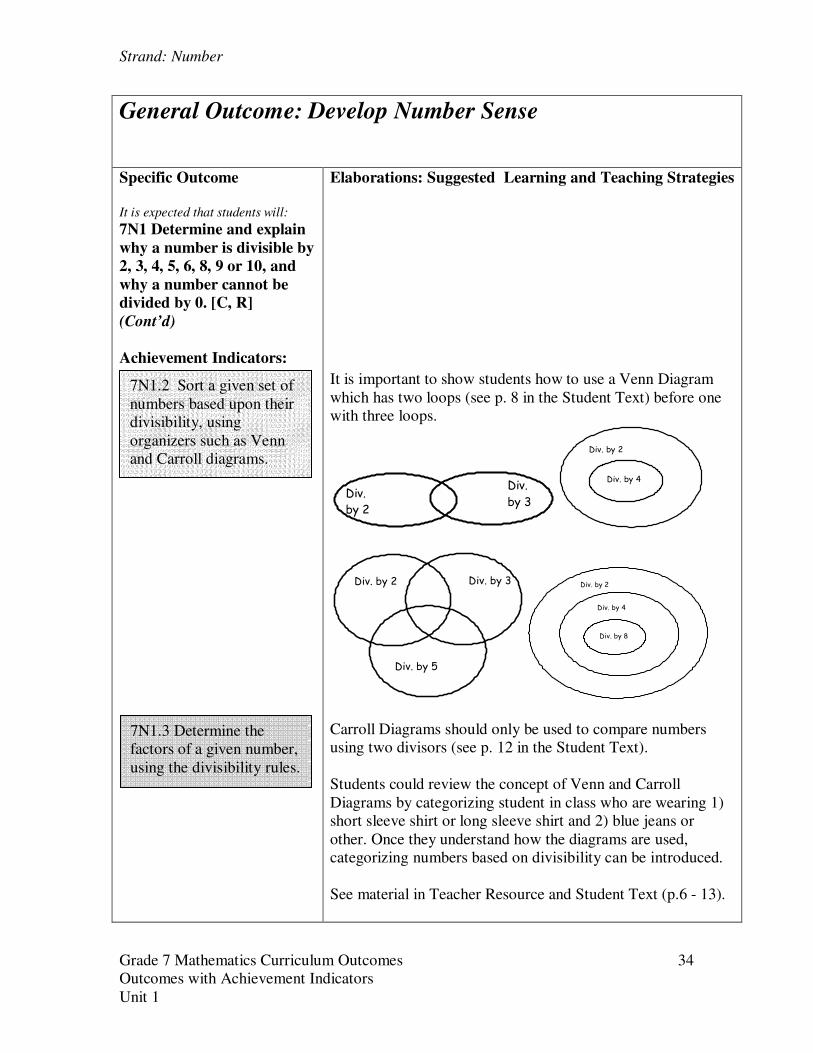
It is important to show students how to use a Venn Diagram
which has two loops (see p. 8 in the Student Text) before one
with three loops.
Div.
by 2
Div.
by 3
Div. by 2
Div. by 4
Div. by 2 Div. by 3
Div. by 5
Div. by 2
Div. by 4
Div. by 8
Carroll Diagrams should only be used to compare numbers
using two divisors (see p. 12 in the Student Text).
Students could review the concept of Venn and Carroll
Diagrams by categorizing student in class who are wearing 1)
short sleeve shirt or long sleeve shirt and 2) blue jeans or
other. Once they understand how the diagrams are used,
categorizing numbers based on divisibility can be introduced.
See material in Teacher Resource and Student Text (p.6 - 13).
7N1.3 Determine the
factors of a given number,
using the divisibility rules.
7N1.2 Sort a given set of
numbers based upon their
divisibility, using
organizers such as Venn
and Carroll diagrams.
Strand: Number
Grade 7 Mathematics Curriculum Outcomes 35
Outcomes with Achievement Indicators
Unit 1
General Outcome: Develop Number Sense
Suggested Assessment Strategies
Paper and Pencil
1. Create a Carroll diagram or a Venn diagram to sort the
following numbers based on the divisibility rules for 3 and 5:
6, 8, 10, 15, 18, 25, 26, 36, 40, 45, 120.
Extension: Which numbers are also divisible by 15?
2. Create a Carroll or Venn diagram to sort the numbers according
to divisibility by 6 and 9.
30 79 162 3996 23517 31974
3. A. Have students choose a number that is divisible by both 6
and 9. What is the smallest number, other than 1, by which
the chosen number is divisible?
B. Repeat for other chosen numbers.
C. Have students conjecture as to what is the smallest divisor
for any number divisible by both 6 and 9.
Presentation/Portfolio
The principal of Great School is trying to determine the number of
classes of Grade seven students she can have in her school. Use the
divisibility rules to determine the possible number of classes if
there are 240 Grade seven students.
Journal/Portfolio
1. Which statements are true? For those statements that are false,
provide an example to verify your answer.
A. All numbers divisible by 6 are divisible by 3.
B. Some, but not all, numbers divisible by 6 are divisible by
3.
C. No numbers divisible by 6 are divisible by 3.
D. All numbers divisible by 3 are divisible by 6.
E. Some, but not all, numbers divisible by 3 are divisible by
6.
F. No numbers divisible by 3 are divisible by 6.
2. Each of Eli’s four friends has a code number. Keile’s number is
divisible by 3, 5, and 8. Max’s number is divisible by 2 and 3.
Jennifer’s number is divisible by 4 and 5, but not 3. Ben’s
number is divisible by 3 and 5, but not 8. Eli receives a
message signed with the code number 5385 from one of his four
friends. Who sent the message?
Resources/Notes
Math Makes Sense 7
Lesson 1.1
Lesson 1.2
(continued)
Math Makes Sense 7
Lesson 1.1
Lesson 1.2
(continued)
Strand: Number
Grade 7 Mathematics Curriculum Outcomes 36
Outcomes with Achievement Indicators
Unit 1
General Outcome: Develop Number Sense
Specific Outcome
It is expected that students will:
7N1 Determine and explain
why a number is divisible by
2, 3, 4, 5, 6, 8, 9 or 10, and
why a number cannot be
divided by 0. [C, R]
(Cont’d)
Achievement Indicators
Elaborations: Suggested Learning and Teaching Strategies
To avoid an arbitrary rule for not being able to divide by 0, use
the repeated subtraction meaning of division. For example
with 20 ÷ 5 we can say 20 – 5 – 5 – 5 – 5 = 0. You can
subtract 5 four times from 20 until you get to 0, so 20 ÷ 5 = 4.
So, for 6 ÷ 0, ask how many times can you subtract 0 from 6
before you get to 0? There is no answer; you will never get to
0 (6 – 0 – 0 – 0 = 6). So, 6 ÷ 0 is undefined.
Alternately:
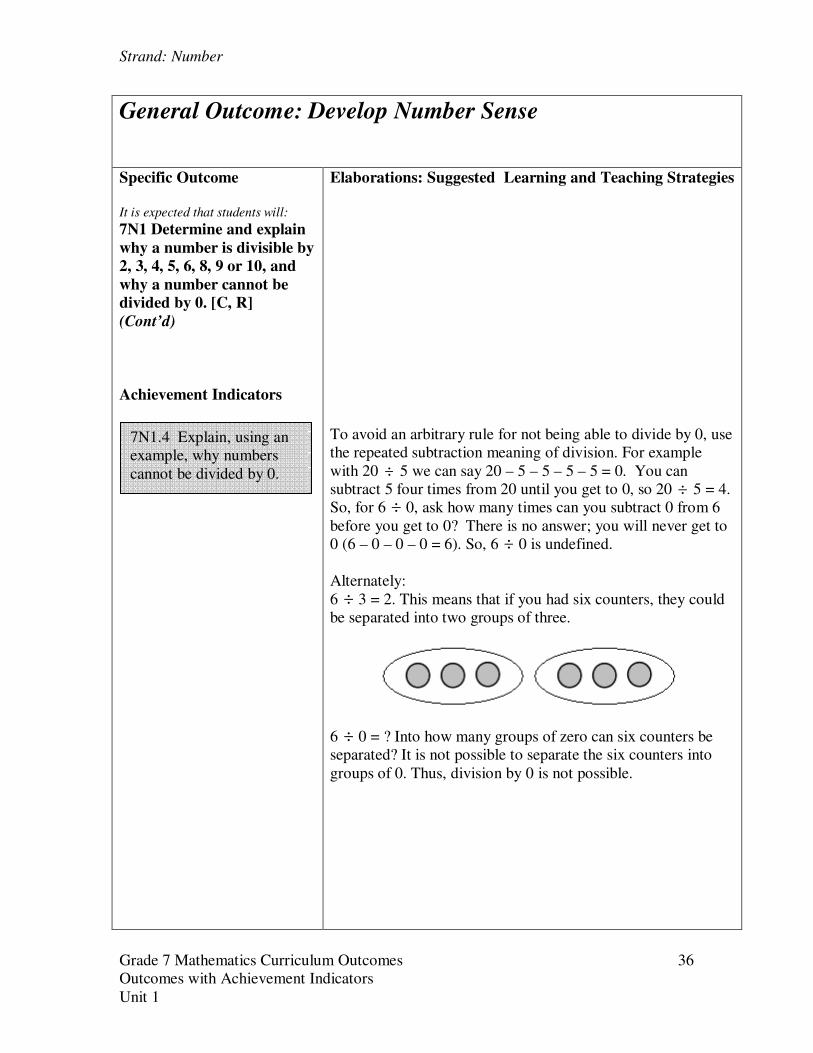
6 ÷ 3 = 2. This means that if you had six counters, they could
be separated into two groups of three.
6 ÷ 0 = ? Into how many groups of zero can six counters be
separated? It is not possible to separate the six counters into
groups of 0. Thus, division by 0 is not possible.
7N1.4 Explain, using an
example, why numbers
cannot be divided by 0.
Strand: Number
Grade 7 Mathematics Curriculum Outcomes 37
Outcomes with Achievement Indicators
Unit 1
General Outcome: Develop Number Sense
Suggested Assessment Strategies
Presentation/Portfolio
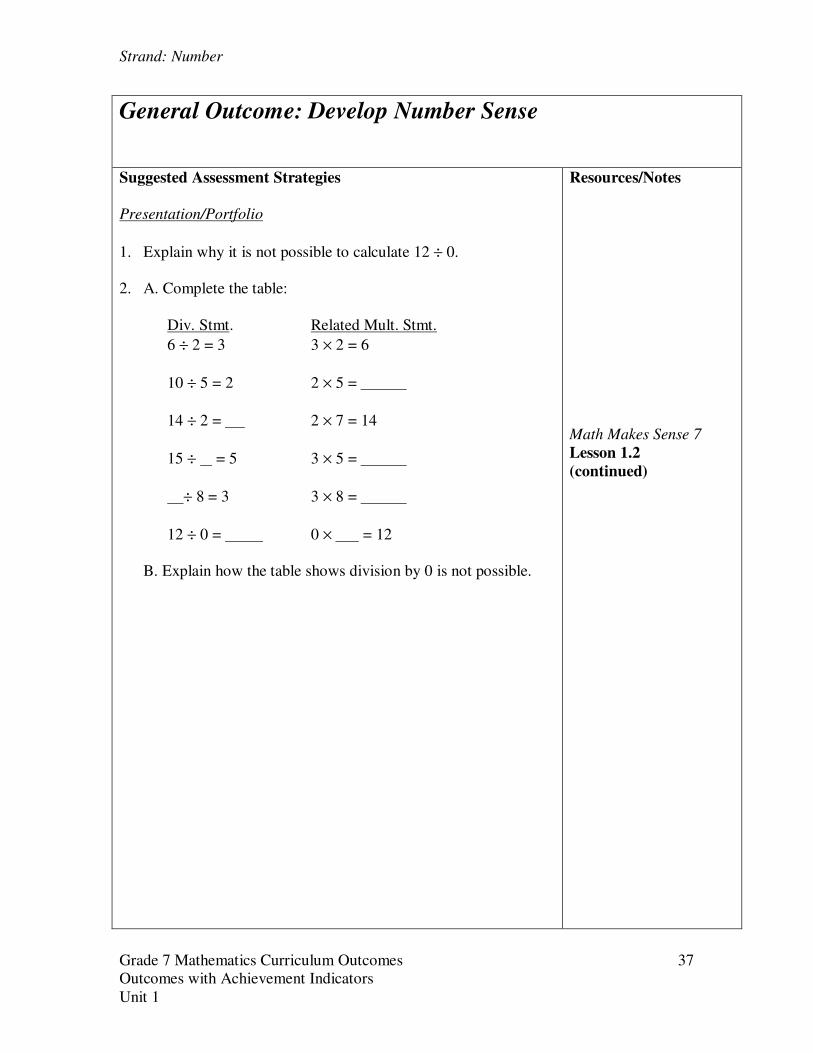
1. Explain why it is not possible to calculate 12 ÷ 0.
2. A. Complete the table:
Div. Stmt. Related Mult. Stmt.
6 ÷ 2 = 3 3 × 2 = 6
10 ÷ 5 = 2 2 × 5 =
14 ÷ 2 = 2 × 7 = 14
15 ÷ = 5 3 × 5 =
÷ 8 = 3 3 × 8 =
12 ÷ 0 = 0 × = 12
B. Explain how the table shows division by 0 is not possible.
Resources/Notes
Math Makes Sense 7
Lesson 1.2
(continued)
Strand: Patterns and Relations (Patterns)
.
Grade 7 Mathematics Curriculum Outcomes 38
Outcomes with Achievement Indicators
Unit 1
General Outcome: Represent algebraic expressions in
multiple ways.
Specific Outcome
It is expected that students will:
7PR4 Explain the difference
between an expression and
an equation. [C, CN]
Achievement Indicators
Elaborations: Suggested Learning and Teaching Strategies
Students do not need to distinguish between expressions and
equations at this time because it will be addressed in Unit 6.
Note that students will need to identify constant term,
numerical coefficient, and variables in both an expression and
an equation. In Lesson 1.3, the focus should be on identifying
these in expressions only.
Students will need to be able to define variable. Additionally,
they should be able to tell what the variable represents in a
given context.
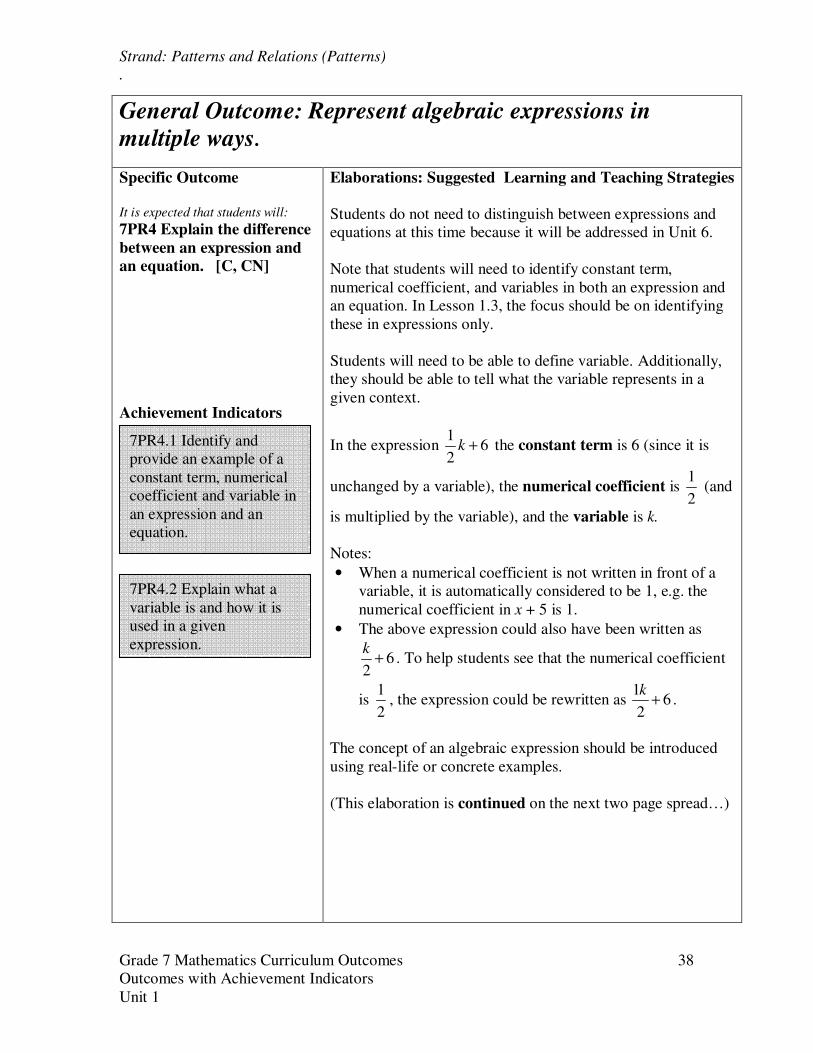
In the expression 1
62
+k the constant term is 6 (since it is
unchanged by a variable), the numerical coefficient is 1
2 (and
is multiplied by the variable), and the variable is k.
Notes:
• When a numerical coefficient is not written in front of a
variable, it is automatically considered to be 1, e.g. the
numerical coefficient in x + 5 is 1.
• The above expression could also have been written as
62
k+ . To help students see that the numerical coefficient
is 1
2, the expression could be rewritten as
16
2
k+ .
The concept of an algebraic expression should be introduced
using real-life or concrete examples.
(This elaboration is continued on the next two page spread…)
7PR4.1 Identify and
provide an example of a
constant term, numerical
coefficient and variable in
an expression and an
equation.
7PR4.2 Explain what a
variable is and how it is
used in a given
expression.
Strand: Patterns and Relations (Patterns)
.
Grade 7 Mathematics Curriculum Outcomes 39
Outcomes with Achievement Indicators
Unit 1
General Outcome: Represent algebraic expressions in
multiple ways.
Suggested Assessment Strategies
Paper and Pencil
1. Write an algebraic expression that has a variable h, numerical
coefficient 4 and constant term 11.
2 A grocer has 40 loaves of brown bread on hand orders w white
loaves of bread. She sells her white loaves for $2.00 each.
Describe in words what each of the following expressions
represents.
A. w + 40 (Answer: Total number of loaves of bread
she has)
B. 2w (Answer: amount of money she takes in for
selling all the loaves of white bread).
Portfolio
1. Ask students to create a classroom chart with the following
headings:
Algebraic
Expression
Expression
in Words Variable
Numerical
Coefficient Constant
3b + 1
One more
than 3 times
a number
b 3 1
y + 6
Have students continue to add examples to the chart each day.
Resources/Notes
Math Makes Sense 7
Lesson 1.3
Unit 1: Patterns and
Relations
TR: ProGuide, pp. 14–17
Master 1.14, 1.24
CD-ROM Unit 1 Masters
ST: pp. 16–19
Practice and HW Book
pp. 9–11
Strand: Patterns and Relations (Patterns)
.
Grade 7 Mathematics Curriculum Outcomes 40
Outcomes with Achievement Indicators
Unit 1
General Outcome: Represent algebraic expressions in
multiple ways.
Specific Outcome
It is expected that students will:
7PR4 Explain the difference
between an expression and
an equation. [C, CN]
Achievement Indicators
Elaborations: Suggested Learning and Teaching Strategies
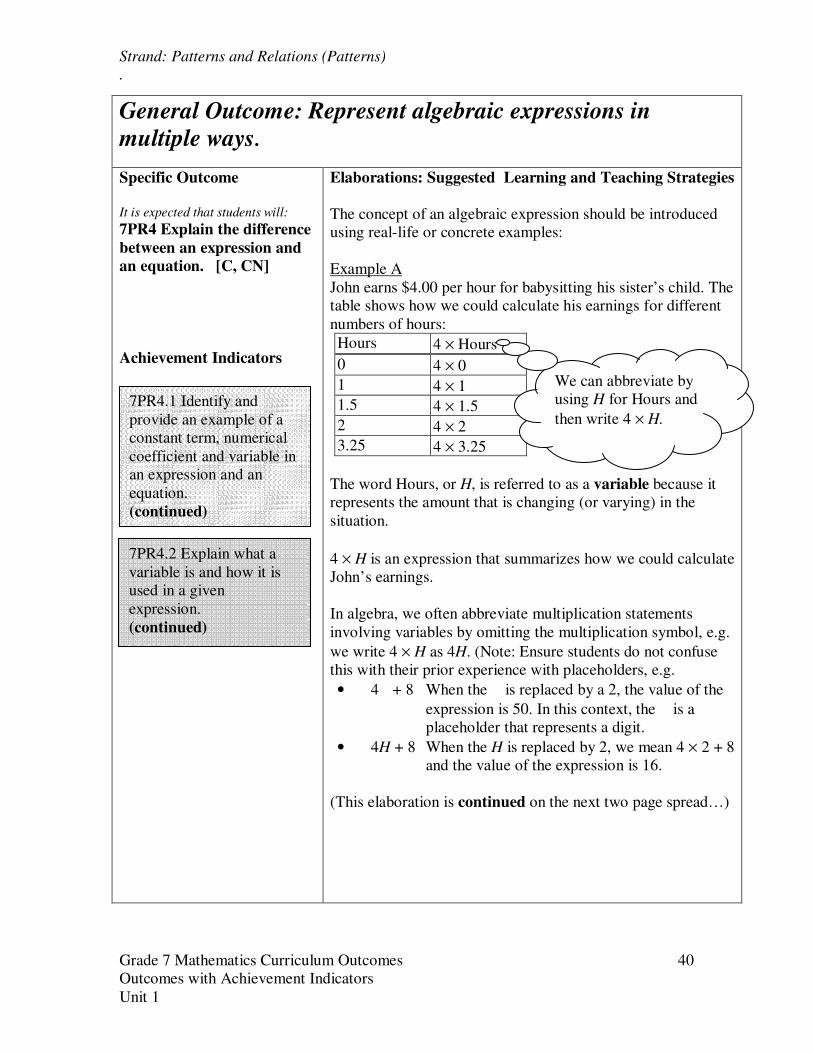
The concept of an algebraic expression should be introduced
using real-life or concrete examples:
Example A
John earns $4.00 per hour for babysitting his sister’s child. The
table shows how we could calculate his earnings for different
numbers of hours:
Hours 4 × Hours
0 4 × 0
1 4 × 1
1.5 4 × 1.5
2 4 × 2
3.25 4 × 3.25
The word Hours, or H, is referred to as a variable because it
represents the amount that is changing (or varying) in the
situation.
4 × H is an expression that summarizes how we could calculate
John’s earnings.
In algebra, we often abbreviate multiplication statements
involving variables by omitting the multiplication symbol, e.g.
we write 4 × H as 4H. (Note: Ensure students do not confuse
this with their prior experience with placeholders, e.g.
• 4� + 8 When the � is replaced by a 2, the value of the
expression is 50. In this context, the � is a
placeholder that represents a digit.
• 4H + 8 When the H is replaced by 2, we mean 4 × 2 + 8
and the value of the expression is 16.
(This elaboration is continued on the next two page spread…)
7PR4.1 Identify and
provide an example of a
constant term, numerical
coefficient and variable in
an expression and an
equation.
(continued)
7PR4.2 Explain what a
variable is and how it is
used in a given
expression.
(continued)
We can abbreviate by
using H for Hours and
then write 4 × H.
Strand: Patterns and Relations (Patterns)
.
Grade 7 Mathematics Curriculum Outcomes 41
Outcomes with Achievement Indicators
Unit 1
General Outcome: Represent algebraic expressions in
multiple ways.
Suggested Assessment Strategies
Resources/Notes
Math Makes Sense 7
Lesson 1.3
(continued)

Strand: Patterns and Relations (Patterns)
.
Grade 7 Mathematics Curriculum Outcomes 42
Outcomes with Achievement Indicators
Unit 1
General Outcome: Represent algebraic expressions in
multiple ways.
Specific Outcome
It is expected that students will:
7PR4 Explain the difference
between an expression and
an equation. [C, CN]
Achievement Indicators
Elaborations: Suggested Learning and Teaching Strategies
The concept of an algebraic expression should be introduced
using real-life or concrete examples:
Example B
For a certain cell phone plan, a customer pays an initial fee of
$10.00 plus an additional fee of $0.05 per text message. One
month, John sent 15 messages on his phone, Daisy sent 3
messages, Judy sent 200. The table shows how to calculate
each person’s costs:
Messages 0.05 × Messages + 10
0 0.05 × 0 + 10
1 0.05 × 1 + 10
1.5 0.05 × 1.5 + 10
2 0.05 × 2 + 10
3.25 0.05 × 3.25 + 10
Variables such as n are used to represent an unknown quantity
or a quantity that can change. Students should also understand,
however, that while in many situations variables can take on
many values (e.g., 4p s= for any value of s), in other
situations they represent a single value (e.g., 3 9x + = ). The
work with equations will be addressed in unit 6.
Example for Discussion
Mary babysits for her neighbour and earns $8.00 per hour.
Students should be able to write an expression to represent her
earnings: 8h. They should also be able to explain what the
variable h represents in this situation: the number of hours she
worked.
7PR4.1 Identify and
provide an example of a
constant term, numerical
coefficient and variable in
an expression and an
equation.
(continued)
7PR4.2 Explain what a
variable is and how it is
used in a given
expression.
(continued)
We can abbreviate
by using M for
Messages and then
write O.5 × M + 10,
or 0.05M + 10.

Strand: Patterns and Relations (Patterns)
.
Grade 7 Mathematics Curriculum Outcomes 43
Outcomes with Achievement Indicators
Unit 1
General Outcome: Represent algebraic expressions in
multiple ways.
Suggested Assessment Strategies
Resources/Notes
Math Makes Sense 7
Lesson 1.3
(continued)
Strand: Patterns and Relations (Patterns)
Grade 7 Mathematics Curriculum Outcomes 44
Outcomes with Achievement Indicators
Unit 1
General Outcome: Use patterns to describe the world and to
solve patterns.
Specific Outcome
It is expected that students will:
7PR4 Explain the difference
between an expression and
an equation. [C, CN]
(Cont’d)
Achievement Indicators
Elaborations: Suggested Learning and Teaching Strategies
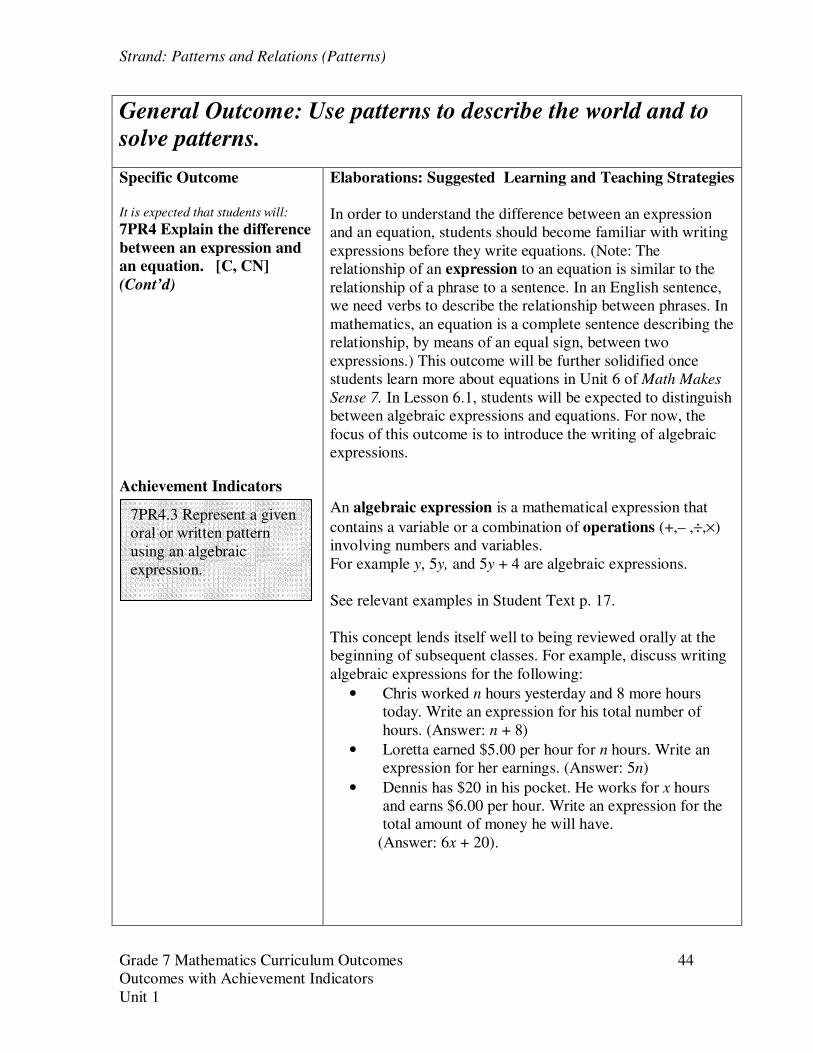
In order to understand the difference between an expression
and an equation, students should become familiar with writing
expressions before they write equations. (Note: The
relationship of an expression to an equation is similar to the
relationship of a phrase to a sentence. In an English sentence,
we need verbs to describe the relationship between phrases. In
mathematics, an equation is a complete sentence describing the
relationship, by means of an equal sign, between two
expressions.) This outcome will be further solidified once
students learn more about equations in Unit 6 of Math Makes
Sense 7. In Lesson 6.1, students will be expected to distinguish
between algebraic expressions and equations. For now, the
focus of this outcome is to introduce the writing of algebraic
expressions.
An algebraic expression is a mathematical expression that
contains a variable or a combination of operations (+,– ,÷,×)
involving numbers and variables.
For example y, 5y, and 5y + 4 are algebraic expressions.
See relevant examples in Student Text p. 17.
This concept lends itself well to being reviewed orally at the
beginning of subsequent classes. For example, discuss writing
algebraic expressions for the following:
• Chris worked n hours yesterday and 8 more hours
today. Write an expression for his total number of
hours. (Answer: n + 8)
• Loretta earned $5.00 per hour for n hours. Write an
expression for her earnings. (Answer: 5n)
• Dennis has $20 in his pocket. He works for x hours
and earns $6.00 per hour. Write an expression for the
total amount of money he will have.
(Answer: 6x + 20).
7PR4.3 Represent a given
oral or written pattern
using an algebraic
expression.
Strand: Patterns and Relations (Patterns)
Grade 7 Mathematics Curriculum Outcomes 45
Outcomes with Achievement Indicators
Unit 1
General Outcome: Use patterns to describe the world and to
solve patterns.
Suggested Assessment Strategies
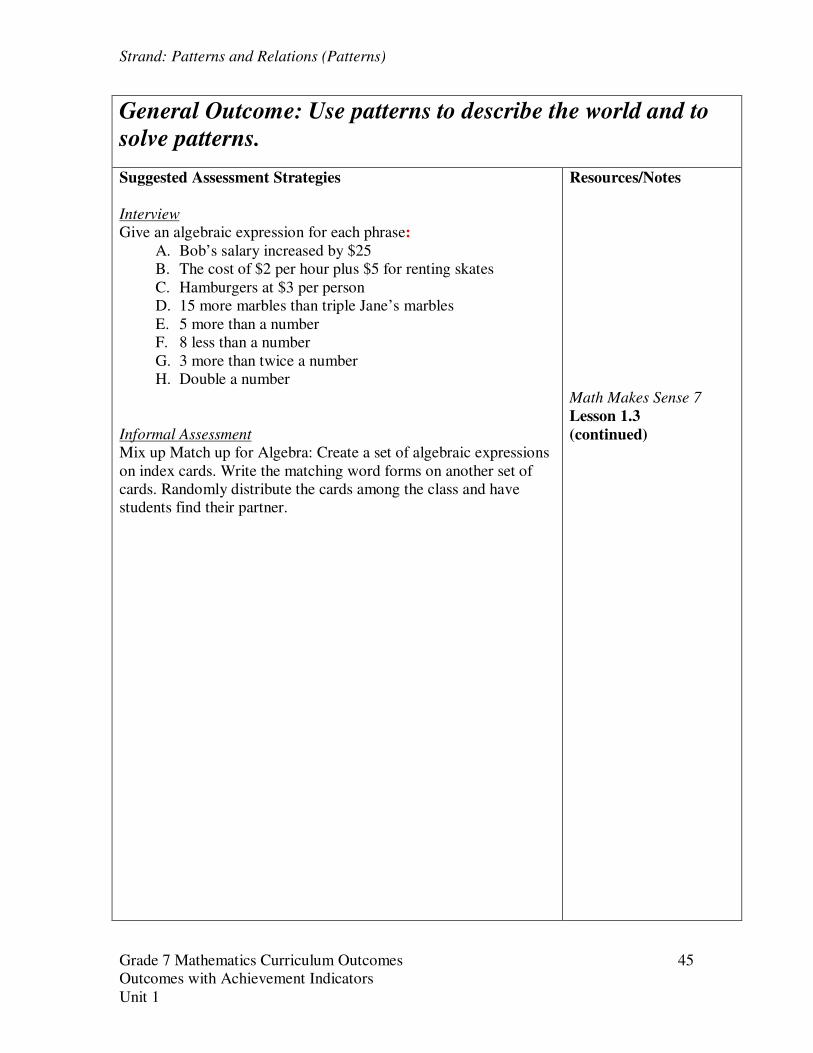
Interview
Give an algebraic expression for each phrase:
A. Bob’s salary increased by $25
B. The cost of $2 per hour plus $5 for renting skates
C. Hamburgers at $3 per person
D. 15 more marbles than triple Jane’s marbles
E. 5 more than a number
F. 8 less than a number
G. 3 more than twice a number
H. Double a number
Informal Assessment
Mix up Match up for Algebra: Create a set of algebraic expressions
on index cards. Write the matching word forms on another set of
cards. Randomly distribute the cards among the class and have
students find their partner.
Resources/Notes
Math Makes Sense 7
Lesson 1.3
(continued)

Strand: Patterns and Relations (Patterns)
Grade 7 Mathematics Curriculum Outcomes 46
Outcomes with Achievement Indicators
Unit 1
General Outcome: Represent algebraic expressions in
multiple ways
Specific Outcome
It is expected that students will:
7PR5 Evaluate an
expression, given the value
of the variable(s). [CN, R]
Achievement Indicators
Elaborations: Suggested Learning and Teaching Strategies
To evaluate an algebraic expression, substitute a number for
the variable and carry out the computation. Order of
Operations will likely need to be reviewed prior to a discussion
of evaluating expressions. It will likely be helpful to start by
providing expressions based on real-life contexts and
substituting values for the variables, such as the situations used
on 7PR4.
Calculations with expressions involving division should also
be discussed, e.g.
82
−m
Note that we could also write this as 8 – m ÷ 2, but this
form is not often used in algebra.
Refer to Teacher Resource (p. 14 – 17) and Student Text (p. 16
– 19).
7PR5.1 Substitute a value
for an unknown in a given
expression, and evaluate
the expression.
Strand: Patterns and Relations (Patterns)
Grade 7 Mathematics Curriculum Outcomes 47
Outcomes with Achievement Indicators
Unit 1
General Outcome: Represent algebraic expressions in
multiple ways
Suggested Assessment Strategies
Paper and Pencil
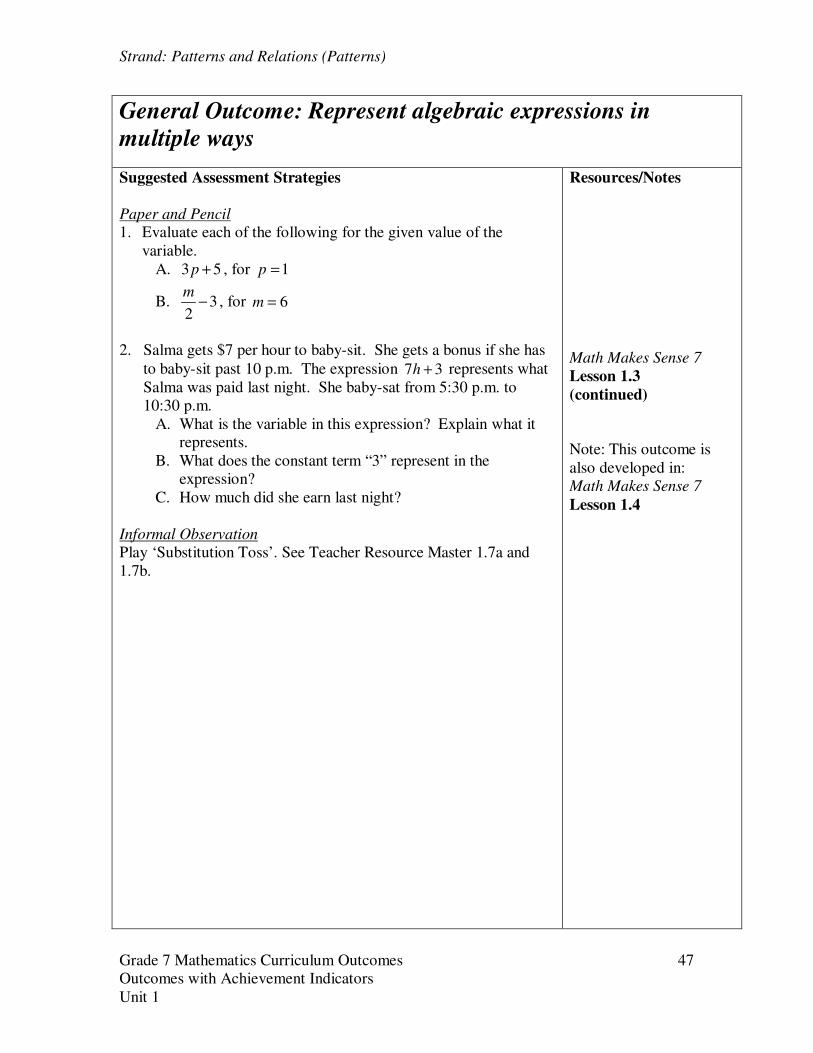
1. Evaluate each of the following for the given value of the
variable.
A. 3 5p + , for 1p =
B. 32
m− , for 6m =
2. Salma gets $7 per hour to baby-sit. She gets a bonus if she has
to baby-sit past 10 p.m. The expression 7 3h + represents what
Salma was paid last night. She baby-sat from 5:30 p.m. to
10:30 p.m.
A. What is the variable in this expression? Explain what it
represents.
B. What does the constant term “3” represent in the
expression?
C. How much did she earn last night?
Informal Observation
Play ‘Substitution Toss’. See Teacher Resource Master 1.7a and
1.7b.
Resources/Notes
Math Makes Sense 7
Lesson 1.3
(continued)
Note: This outcome is
also developed in:
Math Makes Sense 7
Lesson 1.4
Strand: Patterns and Relations (Patterns)
Grade 7 Mathematics Curriculum Outcomes 48
Outcomes with Achievement Indicators
Unit 1
General Outcome: Use patterns to describe the world and to
solve patterns.
Specific Outcome
It is expected that students will:
7PR1 Demonstrate an
understanding of oral and
written patterns and their
equivalent linear relations.
[C, CN, R]
Achievement Indicators
Elaborations: Suggested Learning and Teaching Strategies
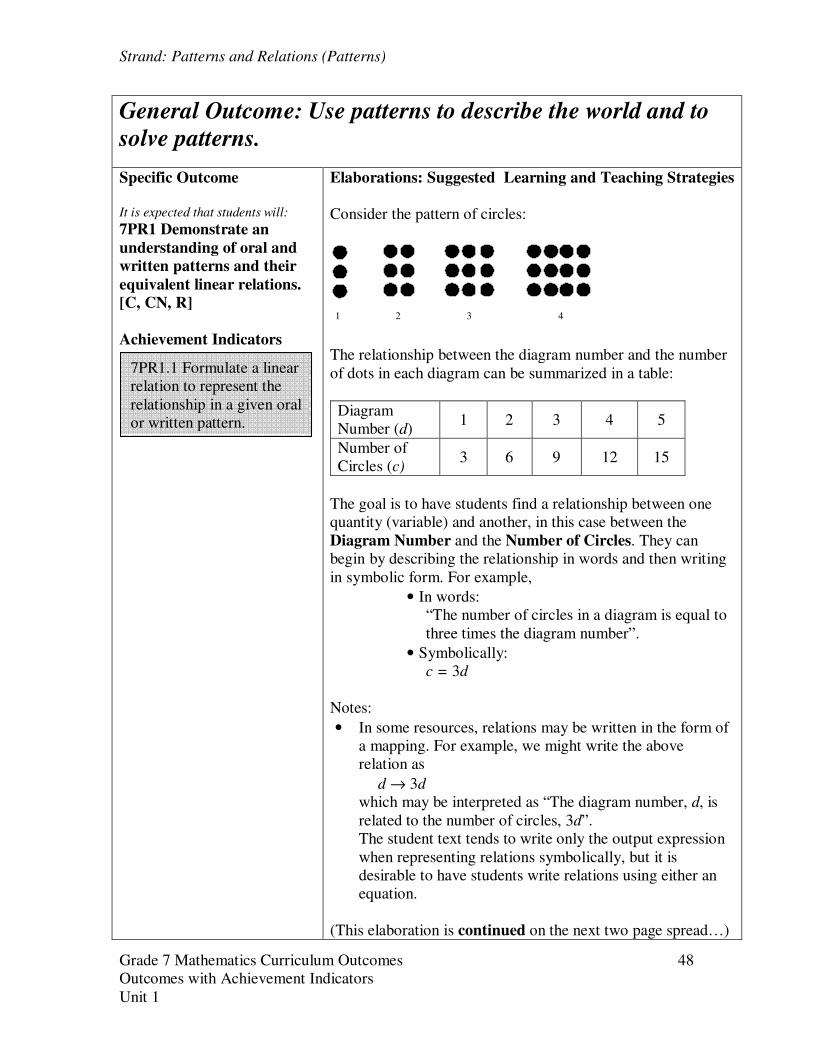
Consider the pattern of circles:
1 2 3 4
The relationship between the diagram number and the number
of dots in each diagram can be summarized in a table:
Diagram
Number (d) 1 2 3 4 5
Number of
Circles (c) 3 6 9 12 15
The goal is to have students find a relationship between one
quantity (variable) and another, in this case between the
Diagram Number and the Number of Circles. They can
begin by describing the relationship in words and then writing
in symbolic form. For example,
• In words:
“The number of circles in a diagram is equal to
three times the diagram number”.
• Symbolically:
c = 3d
Notes:
• In some resources, relations may be written in the form of
a mapping. For example, we might write the above
relation as
d → 3d
which may be interpreted as “The diagram number, d, is
related to the number of circles, 3d”.
The student text tends to write only the output expression
when representing relations symbolically, but it is
desirable to have students write relations using either an
equation.
(This elaboration is continued on the next two page spread…)
7PR1.1 Formulate a linear
relation to represent the
relationship in a given oral
or written pattern.
Strand: Patterns and Relations (Patterns)
Grade 7 Mathematics Curriculum Outcomes 49
Outcomes with Achievement Indicators
Unit 1
General Outcome: Use patterns to describe the world and to
solve patterns.
Suggested Assessment Strategies
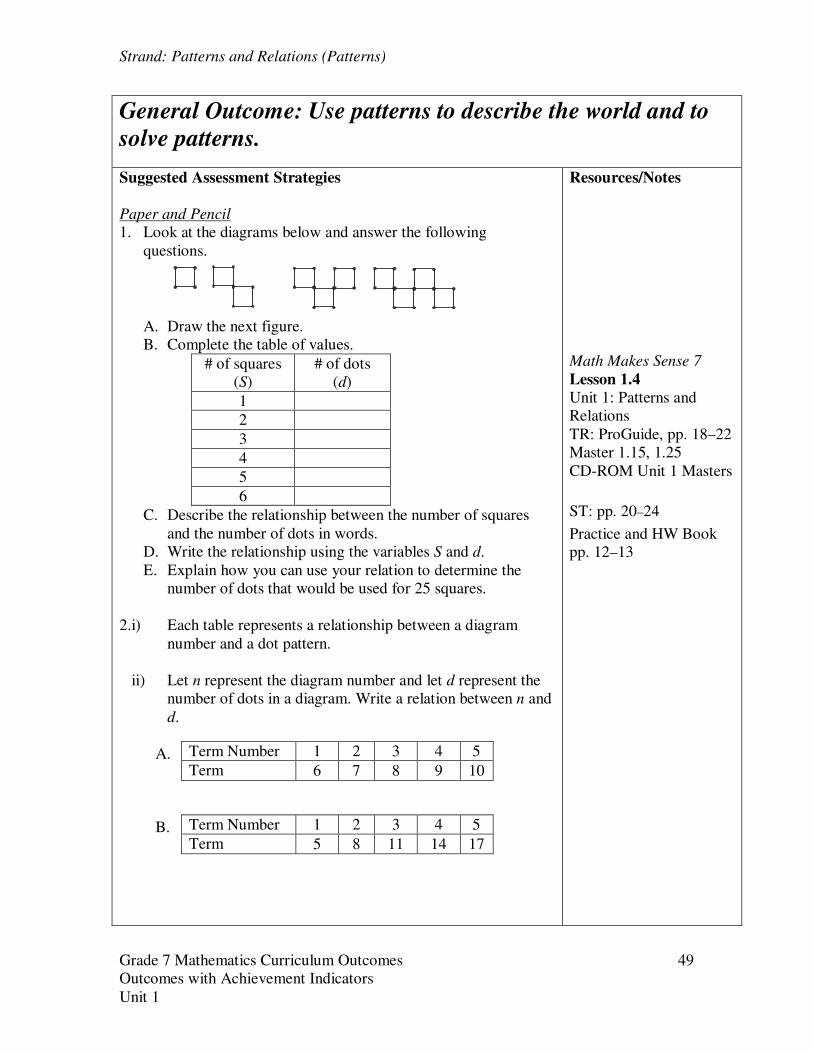
Paper and Pencil
1. Look at the diagrams below and answer the following
questions.
A. Draw the next figure.
B. Complete the table of values.
# of squares
(S)
# of dots
(d)
1
2
3
4
5
6
C. Describe the relationship between the number of squares
and the number of dots in words.
D. Write the relationship using the variables S and d.
E. Explain how you can use your relation to determine the
number of dots that would be used for 25 squares.
2.i) Each table represents a relationship between a diagram
number and a dot pattern.
ii) Let n represent the diagram number and let d represent the
number of dots in a diagram. Write a relation between n and
d.
A.
B.
Term Number 1 2 3 4 5
Term 6 7 8 9 10
Term Number 1 2 3 4 5
Term 5 8 11 14 17
Resources/Notes
Math Makes Sense 7
Lesson 1.4
Unit 1: Patterns and
Relations
TR: ProGuide, pp. 18–22
Master 1.15, 1.25
CD-ROM Unit 1 Masters
ST: pp. 20–24
Practice and HW Book
pp. 12–13
Strand: Patterns and Relations (Patterns)
Grade 7 Mathematics Curriculum Outcomes 50
Outcomes with Achievement Indicators
Unit 1
General Outcome: Use patterns to describe the world and to
solve patterns.
Specific Outcome
It is expected that students will:
7PR1 Demonstrate an
understanding of oral and
written patterns and their
equivalent linear relations.
[C, CN, R]
(Cont’d)
Achievement Indicators
Elaborations: Suggested Learning and Teaching Strategies
• Students may tend to focus on the increasing pattern in the
number of circles, i.e. that the number of circles in one
diagram is three more than the number of circles in the
previous diagram. However, this does not express the
relationship between the two variables. Additionally, it is
not very useful if we want to find the number of circles in,
say, the 50th diagram. The relation, c = 3d, allows us to
find the number of circles in any diagram, e.g. for the 50th
diagram, there would be c = 3(50) circles.
• It is important to start students’ investigation of linear
relationships using concrete models followed by oral and
written descriptions. For the circle diagrams above, one
option is to provide counters to students and allow them to
construct the diagrams.
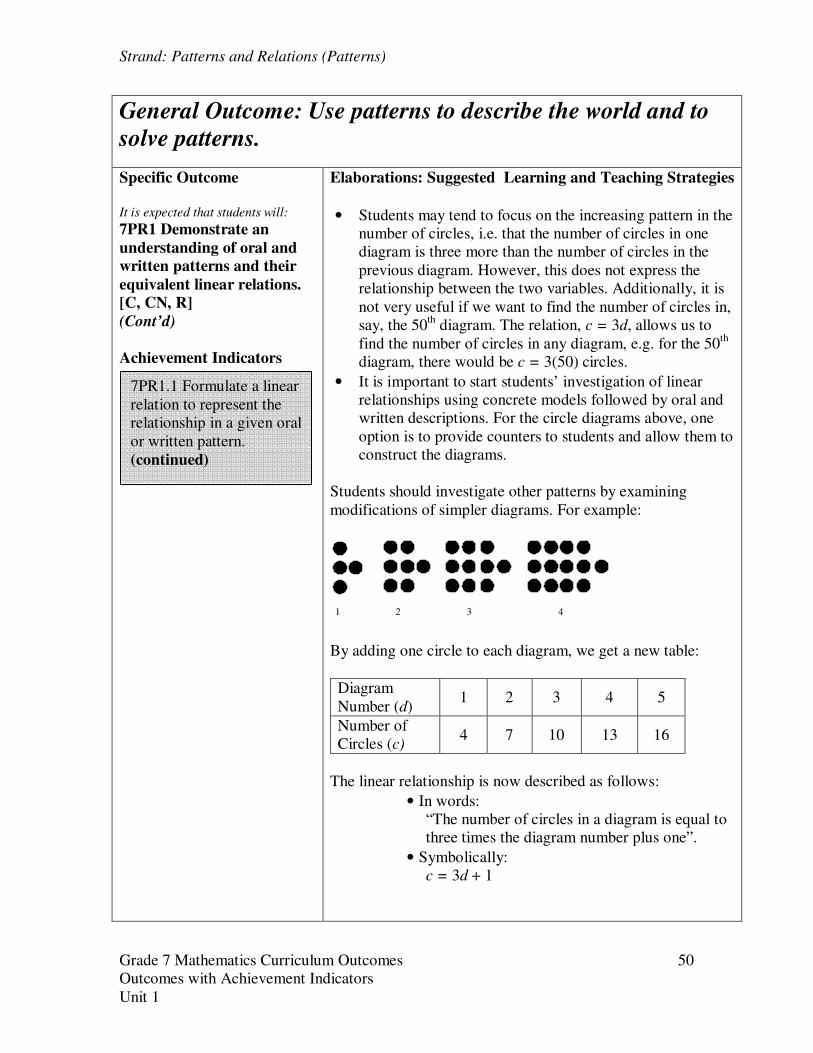
Students should investigate other patterns by examining
modifications of simpler diagrams. For example:
1 2 3 4
By adding one circle to each diagram, we get a new table:
Diagram
Number (d) 1 2 3 4 5
Number of
Circles (c) 4 7 10 13 16
The linear relationship is now described as follows:
• In words:
“The number of circles in a diagram is equal to
three times the diagram number plus one”.
• Symbolically:
c = 3d + 1
7PR1.1 Formulate a linear
relation to represent the
relationship in a given oral
or written pattern.
(continued)
Strand: Patterns and Relations (Patterns)
Grade 7 Mathematics Curriculum Outcomes 51
Outcomes with Achievement Indicators
Unit 1
General Outcome: Use patterns to describe the world and to
solve patterns.
Suggested Assessment Strategies
Paper and Pencil
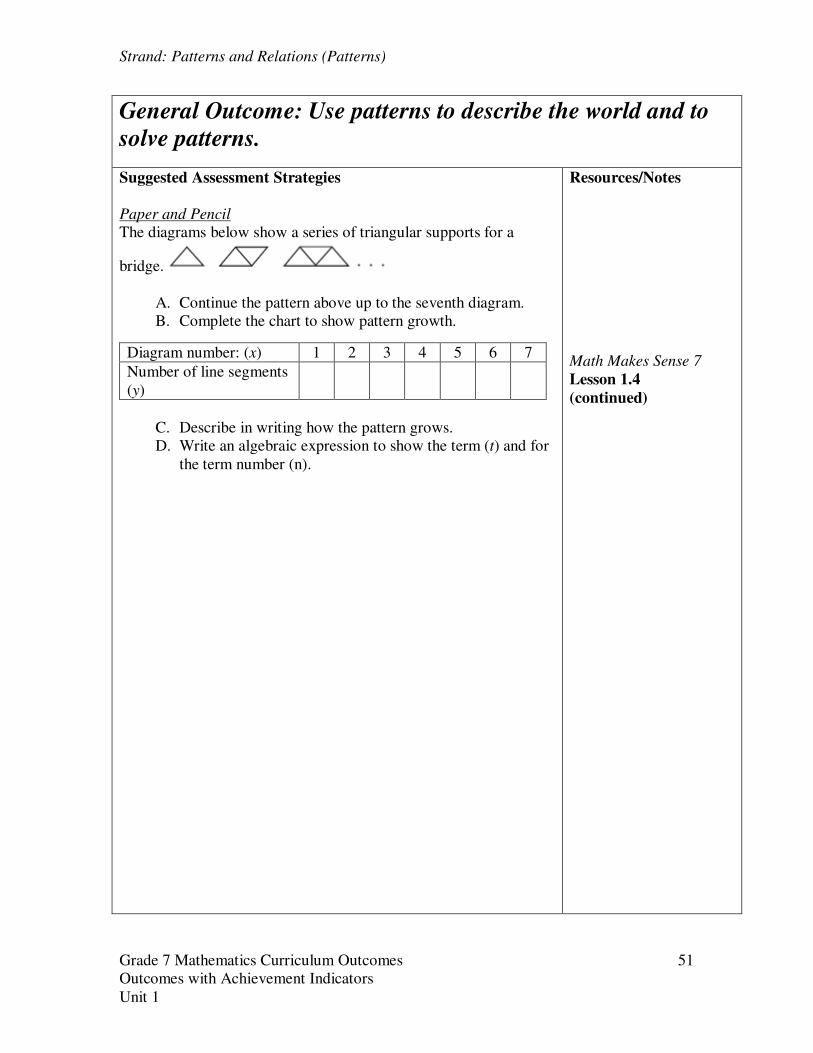
The diagrams below show a series of triangular supports for a
bridge.
A. Continue the pattern above up to the seventh diagram.
B. Complete the chart to show pattern growth.
C. Describe in writing how the pattern grows.
D. Write an algebraic expression to show the term (t) and for
the term number (n).
Diagram number: (x) 1 2 3 4 5 6 7
Number of line segments
(y)
Resources/Notes
Math Makes Sense 7
Lesson 1.4
(continued)
Strand: Patterns and Relations (Patterns)
Grade 7 Mathematics Curriculum Outcomes 52
Outcomes with Achievement Indicators
Unit 1
General Outcome: Use patterns to describe the world and to
solve patterns.
Specific Outcome
It is expected that students will:
7PR1 Demonstrate an
understanding of oral and
written patterns and their
equivalent linear relations.
[C, CN, R]
(Cont’d)
Achievement Indicators
Elaborations: Suggested Learning and Teaching Strategies
Students should also be able to provide contexts or real-life
situations for given relations, e.g.
• D = 2n
• D = 3N + 2
• y = 5x + 1
Example:
Suggest a real-life situation that could be represented by the
relation D = 3N + 2.
.
Students should show how the relation fits the situation. This
relationship could represent someone getting $5 after one hour
of work, $8 after two hours, and so on. Since the amount of
money earned increases by $3 per hour but the person earns $5
after only one hour, there must be a $2 bonus for taking the
job.
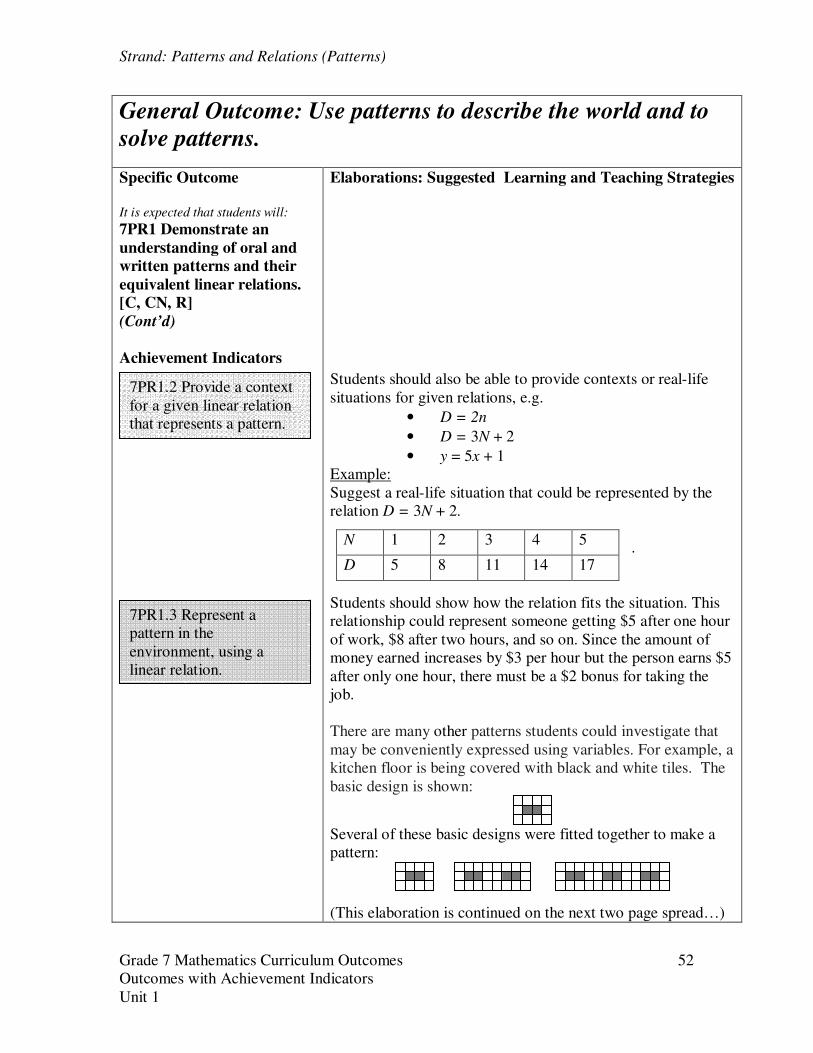
There are many other patterns students could investigate that
may be conveniently expressed using variables. For example, a
kitchen floor is being covered with black and white tiles. The
basic design is shown:
Several of these basic designs were fitted together to make a
pattern:
(This elaboration is continued on the next two page spread…)
N 1 2 3 4 5
D 5 8 11 14 17
7PR1.2 Provide a context
for a given linear relation
that represents a pattern.
7PR1.3 Represent a
pattern in the
environment, using a
linear relation.
Strand: Patterns and Relations (Patterns)
Grade 7 Mathematics Curriculum Outcomes 53
Outcomes with Achievement Indicators
Unit 1
General Outcome: Use patterns to describe the world and to
solve patterns.
Suggested Assessment Strategies
Pencil and Paper
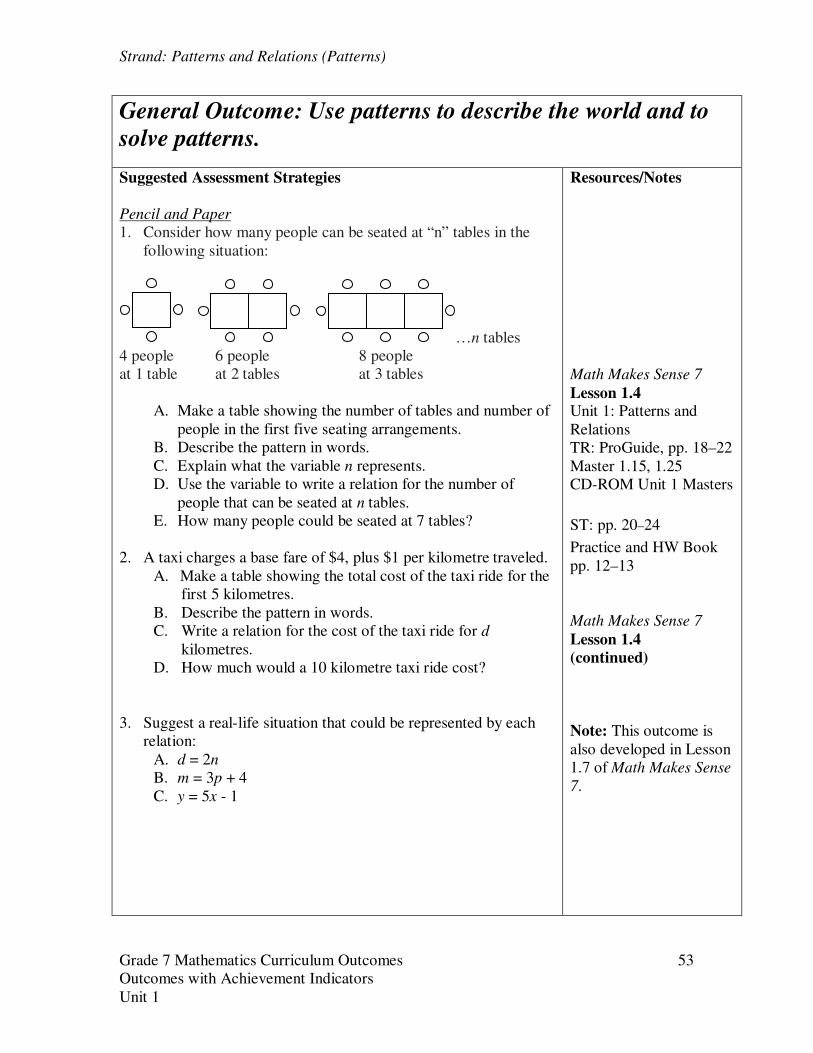
1. Consider how many people can be seated at “n” tables in the
following situation:
…n tables
4 people 6 people 8 people
at 1 table at 2 tables at 3 tables
A. Make a table showing the number of tables and number of
people in the first five seating arrangements.
B. Describe the pattern in words.
C. Explain what the variable n represents.
D. Use the variable to write a relation for the number of
people that can be seated at n tables.
E. How many people could be seated at 7 tables?
2. A taxi charges a base fare of $4, plus $1 per kilometre traveled.
A. Make a table showing the total cost of the taxi ride for the
first 5 kilometres.
B. Describe the pattern in words.
C. Write a relation for the cost of the taxi ride for d
kilometres.
D. How much would a 10 kilometre taxi ride cost?
3. Suggest a real-life situation that could be represented by each
relation:
A. d = 2n
B. m = 3p + 4
C. y = 5x - 1
Resources/Notes
Math Makes Sense 7
Lesson 1.4
Unit 1: Patterns and
Relations
TR: ProGuide, pp. 18–22
Master 1.15, 1.25
CD-ROM Unit 1 Masters
ST: pp. 20–24
Practice and HW Book
pp. 12–13
Math Makes Sense 7
Lesson 1.4
(continued)
Note: This outcome is
also developed in Lesson
1.7 of Math Makes Sense
7.
Strand: Patterns and Relations (Patterns)
Grade 7 Mathematics Curriculum Outcomes 54
Outcomes with Achievement Indicators
Unit 1
General Outcome: Use patterns to describe the world and to
solve patterns.
Specific Outcome
It is expected that students will:
7PR1 Demonstrate an
understanding of oral and
written patterns and their
equivalent linear relations.
[C, CN, R]
(Cont’d)
Achievement Indicators
Elaborations: Suggested Learning and Teaching Strategies
Students should be able to make a table of values showing the
number of black and white tiles in the first 5 designs and
describe the pattern.
Black Tiles
(b) 2 4 6 8 10
White Tiles
(w) 10 20 30 40 50
The number of white tiles, w, is five times the number of black
tiles, b, which can be expressed as w = 5b. NOTE: This
describes the relationship between two quantities within the
diagrams and not between the diagram number and number of
tiles.
7PR1.3 Represent a
pattern in the
environment, using a
linear relation.
(continued)

Strand: Patterns and Relations (Patterns)
Grade 7 Mathematics Curriculum Outcomes 55
Outcomes with Achievement Indicators
Unit 1
General Outcome: Use patterns to describe the world and to
solve patterns.
Suggested Assessment Strategies
Resources/Notes
Math Makes Sense 7
Lesson 1.4
(continued)
Note: This outcome is
also developed in Lesson
1.7 of Math Makes Sense
7.

Strand: Patterns and Relations (Patterns)
Grade 7 Mathematics Curriculum Outcomes 56
Outcomes with Achievement Indicators
Unit 1
General Outcome: Use patterns to describe the world and to
solve patterns.
Specific Outcome
It is expected that students will:
7PR2 Create a table of
values from a linear
relation, graph the table of
values, and analyze the
graph to draw conclusions
and solve problems.
[C, CN, PS, R, V]
Achievement Indicators
Elaborations: Suggested Learning and Teaching Strategies
Students have had experience graphing in the first quadrant of
the Cartesian Plane. Teachers should be careful not to use
relations that will result in negative output values at this point.
Students have already learned to evaluate an expression by
replacing a variable with a number. The student resource refers
to Input/Output machines. The input number is substituted into
an expression to get the output.
This relationship can also be written as 12 +→ pp .
The previous achievement indicator can be addressed here also
by giving students an input/output machine and asking them to
describe the relation represented in the completed table. (See
student text p. 26-28.)
2 1p + input output
Input
p
Output
2 1p +
1 3
2 5
3 7
4 9
5 11
7PR2.1 Create a table of
values for a given linear
relation by substituting
values for the variable.
Strand: Patterns and Relations (Patterns)
Grade 7 Mathematics Curriculum Outcomes 57
Outcomes with Achievement Indicators
Unit 1
General Outcome: Use patterns to describe the world and to
solve patterns.
Suggested Assessment Strategies
Paper and Pencil
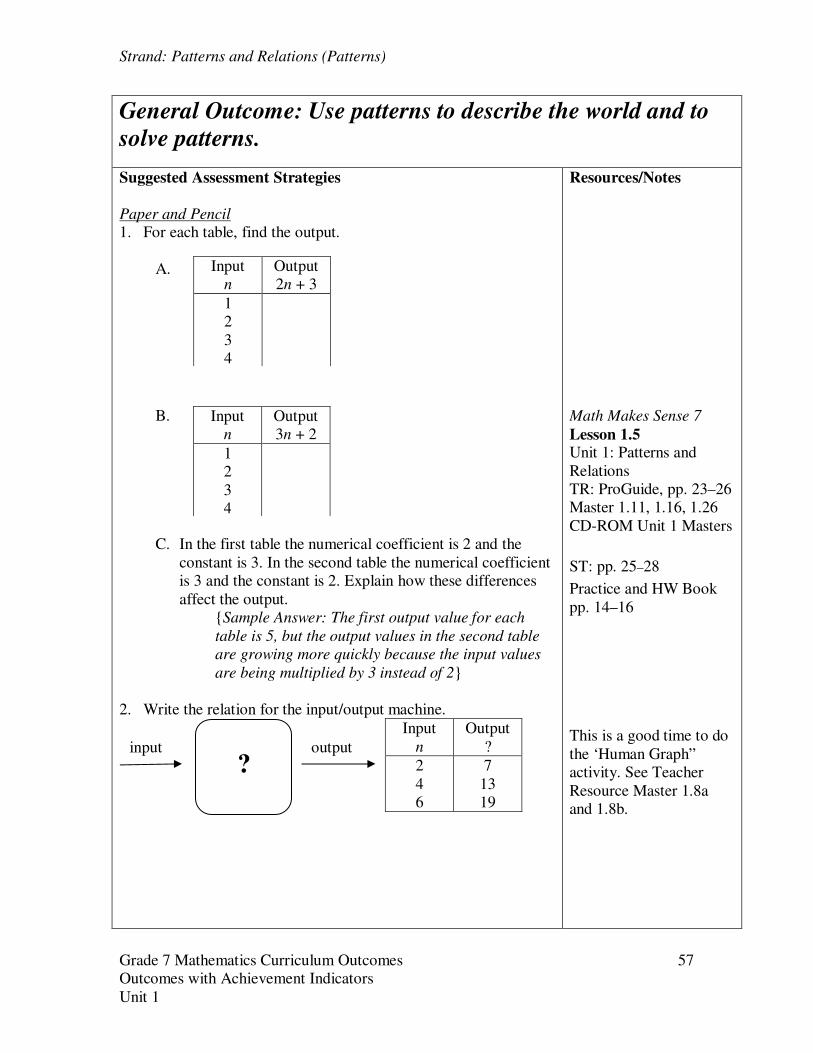
1. For each table, find the output.
A.
B.
C. In the first table the numerical coefficient is 2 and the
constant is 3. In the second table the numerical coefficient
is 3 and the constant is 2. Explain how these differences
affect the output.
{Sample Answer: The first output value for each
table is 5, but the output values in the second table
are growing more quickly because the input values
are being multiplied by 3 instead of 2}
2. Write the relation for the input/output machine.
Resources/Notes
Math Makes Sense 7
Lesson 1.5
Unit 1: Patterns and
Relations
TR: ProGuide, pp. 23–26
Master 1.11, 1.16, 1.26
CD-ROM Unit 1 Masters
ST: pp. 25–28
Practice and HW Book
pp. 14–16
This is a good time to do
the ‘Human Graph”
activity. See Teacher
Resource Master 1.8a
and 1.8b.
? input output
Input
n
Output
?
2
4
6
7
13
19
Input
n
Output
2n + 3
1
2
3
4
Input
n
Output
3n + 2
1
2
3
4
Strand: Patterns and Relations (Patterns)
Grade 7 Mathematics Curriculum Outcomes 58
Outcomes with Achievement Indicators
Unit 1
General Outcome: Use patterns to describe the world and to
solve patterns.
Specific Outcome
It is expected that students will:
7PR2 Create a table of
values from a linear
relation, graph the table of
values, and analyze the
graph to draw conclusions
and solve problems.
[C, CN, PS, R, V]
(Cont’d)
Achievement Indicators
Elaborations: Suggested Learning and Teaching Strategies
This is an extension in that students are now required to graph
the data from the table of values on the coordinate grid.
To plot a point, an input value and its related output value
should be considered as directions to move from the origin
(0,0) to another specific point on the coordinate plane. For
example, if the input value is 4 and the output value is 6, we
move 4 units to the right from the origin, then continue by
moving 6 units upward.
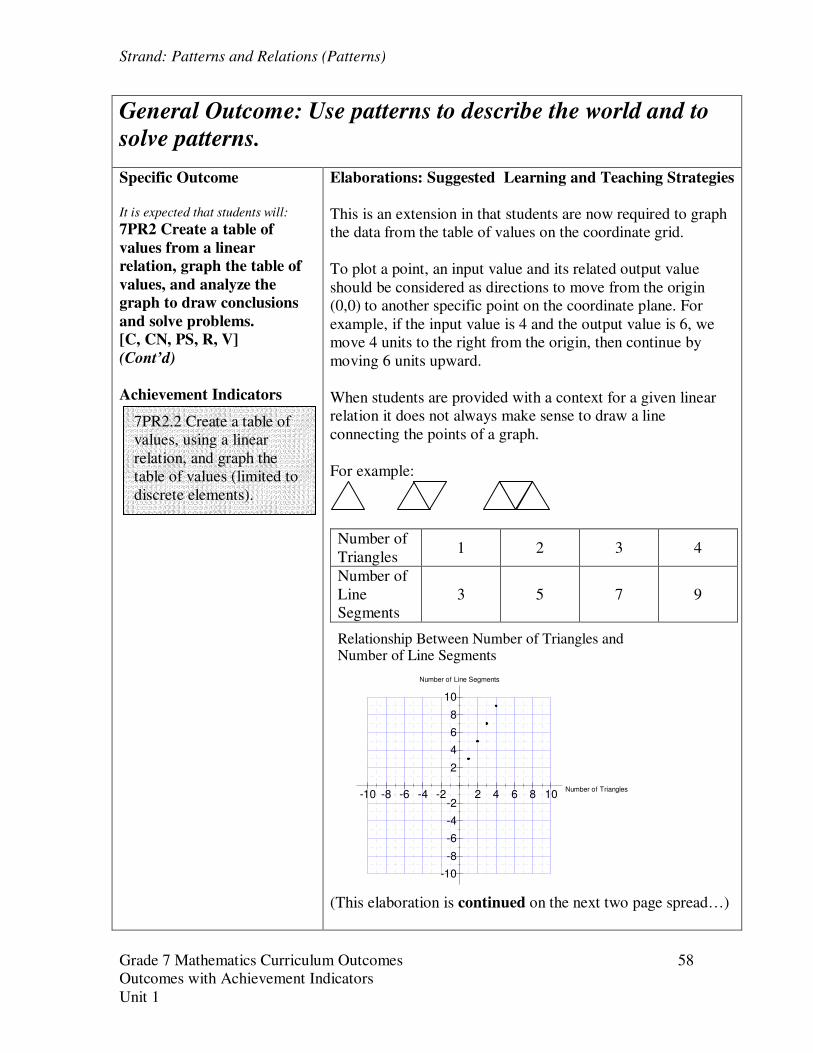
When students are provided with a context for a given linear
relation it does not always make sense to draw a line
connecting the points of a graph.
For example:
Number of
Triangles 1 2 3 4
Number of
Line
Segments
3 5 7 9
Number of Triangles-10 -8 -6 -4 -2 2 4 6 8 10
Number of Line Segments
-10
-8
-6
-4
-2
2
4
6
8
10
Relationship Between Number of Triangles and Number of Line Segments
(This elaboration is continued on the next two page spread…)
7PR2.2 Create a table of
values, using a linear
relation, and graph the
table of values (limited to
discrete elements).

Strand: Patterns and Relations (Patterns)
Grade 7 Mathematics Curriculum Outcomes 59
Outcomes with Achievement Indicators
Unit 1
General Outcome: Use patterns to describe the world and to
solve patterns.
Suggested Assessment Strategies
Paper and Pencil
1. The diagram below shows a series of triangular supports for
a bridge.
…
A. Continue the pattern above for up to five triangles.
B. Complete the chart to show the pattern.
C. Describe the relationship in words.
D. Predict the number of line segments for 10 triangles and
20 triangles.
E. Write a relation to show how the number of line segments
in related to the number of triangles.
F. Draw a graph to show the relation. Does it make sense to
join the points? Discuss the shape of the graph.
Interview/Journal
Refer to the table in Pencil and Paper question #1. A student was
asked to explain the relationship between the number of triangles
and the number of line segments. The student described the pattern
as follows: “It goes up by 2.” Ask students if they agree or
disagree, and have them explain their reasons.
Resources/Notes
Math Makes Sense 7
Lesson 1.6
Unit 1: Patterns and
Relations
TR: ProGuide, pp. 28–32
Master 1.17, 1.27
PM 22
CD-ROM Unit 1 Masters
ST: pp. 30–34
Practice and HW Book
pp. 17–19
Strand: Patterns and Relations (Patterns)
Grade 7 Mathematics Curriculum Outcomes 60
Outcomes with Achievement Indicators
Unit 1
General Outcome: Use patterns to describe the world and to
solve patterns.
Specific Outcome
It is expected that students will:
7PR2 Create a table of
values from a linear
relation, graph the table of
values, and analyze the
graph to draw conclusions
and solve problems.
[C, CN, PS, R, V]
(Cont’d)
Achievement Indicators
Elaborations: Suggested Learning and Teaching Strategies
We cannot plot points in between the given points since we are
not dealing with parts of triangles and an input value such as
1.25 does not make sense, therefore we should not connect the
points of the graph with a solid line. In cases where the input
values are discrete (such as this case), we do not connect the
points.
Discrete cases also arise when the input numbers are restricted
to natural numbers, whole numbers and – later in unit 8 –
integer values. For example, for the table
Input 0 1 2 3 4
Output 4 4.5 5 5.5 6
If we restrict the input values to only the whole numbers, then
we cannot connect the points of the graph.
Students should be reminded to label the axes, give the graph a
title and use appropriate scales.
7PR2.2 Create a table of
values, using a linear
relation, and graph the
table of values (limited to
discrete elements).
(continued)
Strand: Patterns and Relations (Patterns)
Grade 7 Mathematics Curriculum Outcomes 61
Outcomes with Achievement Indicators
Unit 1
General Outcome: Use patterns to describe the world and to
solve patterns.
Suggested Assessment Strategies
Resources/Notes
Math Makes Sense 7
Lesson 1.6
(continued)
Strand: Patterns and Relations (Patterns)
Grade 7 Mathematics Curriculum Outcomes 62
Outcomes with Achievement Indicators
Unit 1
General Outcome: Use patterns to describe the world and to
solve patterns.
Specific Outcome
It is expected that students will:
7PR2 Create a table of
values from a linear
relation, graph the table of
values, and analyze the
graph to draw conclusions
and solve problems. [C, CN,
PS, R, V] (Cont’d)
Achievement Indicators
Elaborations: Suggested Learning and Teaching Strategies
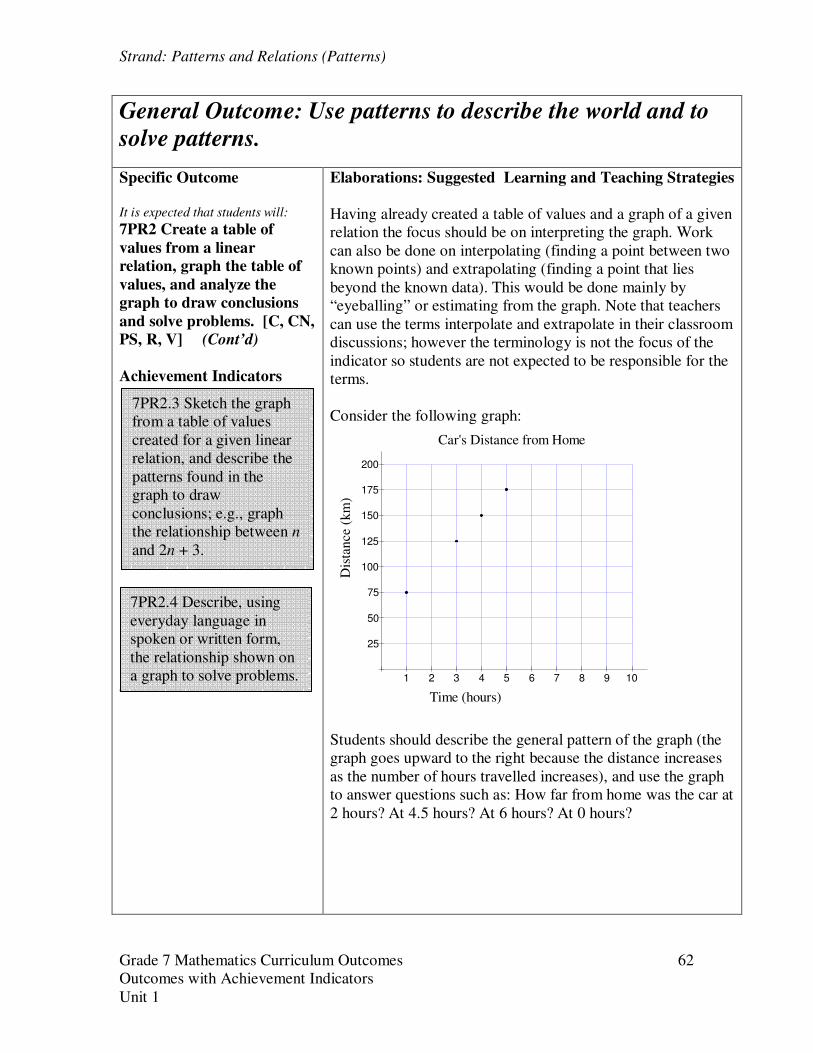
Having already created a table of values and a graph of a given
relation the focus should be on interpreting the graph. Work
can also be done on interpolating (finding a point between two
known points) and extrapolating (finding a point that lies
beyond the known data). This would be done mainly by
“eyeballing” or estimating from the graph. Note that teachers
can use the terms interpolate and extrapolate in their classroom
discussions; however the terminology is not the focus of the
indicator so students are not expected to be responsible for the
terms.
Consider the following graph:
1 2 3 4 5 6 7 8 9 10
25
50
75
100
125
150
175
200
Car's Distance from Home
Dis
tan
ce (
km
)
Time (hours)
Students should describe the general pattern of the graph (the
graph goes upward to the right because the distance increases
as the number of hours travelled increases), and use the graph
to answer questions such as: How far from home was the car at
2 hours? At 4.5 hours? At 6 hours? At 0 hours?
7PR2.4 Describe, using
everyday language in
spoken or written form,
the relationship shown on
a graph to solve problems.
7PR2.3 Sketch the graph
from a table of values
created for a given linear
relation, and describe the
patterns found in the
graph to draw
conclusions; e.g., graph
the relationship between n
and 2n + 3.
Strand: Patterns and Relations (Patterns)
Grade 7 Mathematics Curriculum Outcomes 63
Outcomes with Achievement Indicators
Unit 1
General Outcome: Use patterns to describe the world and to
solve patterns.
Suggested Assessment Strategies
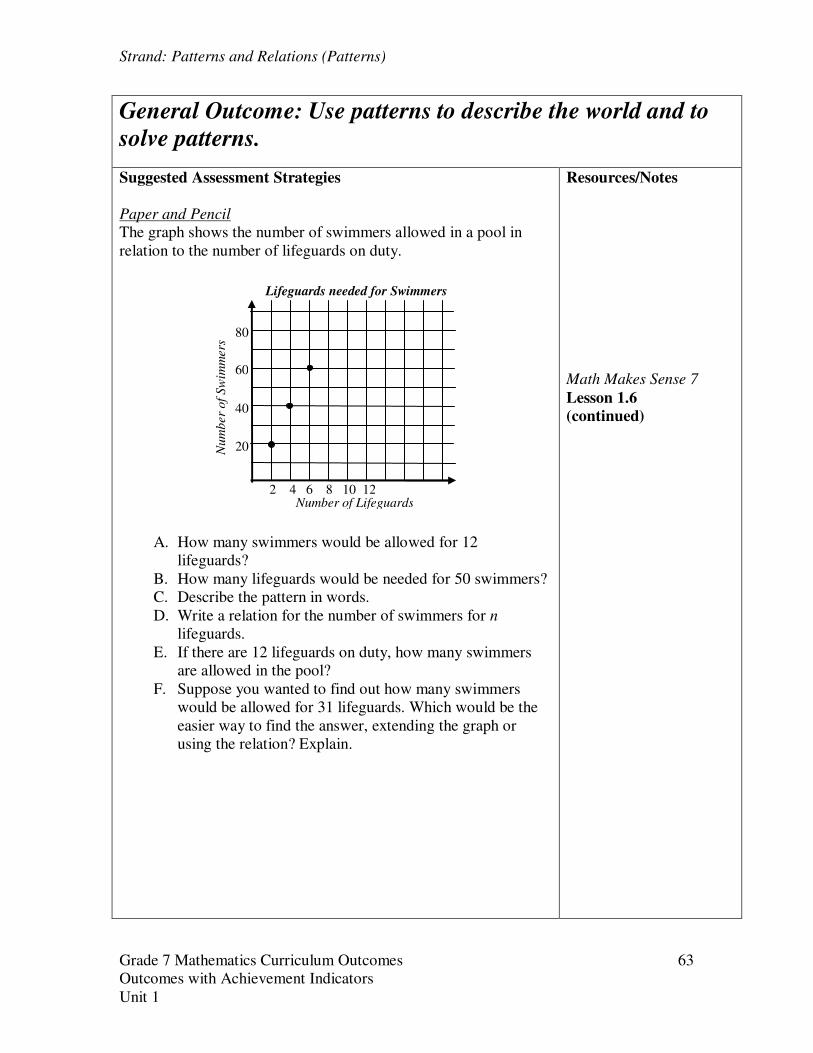
Paper and Pencil
The graph shows the number of swimmers allowed in a pool in
relation to the number of lifeguards on duty.
A. How many swimmers would be allowed for 12
lifeguards?
B. How many lifeguards would be needed for 50 swimmers?
C. Describe the pattern in words.
D. Write a relation for the number of swimmers for n
lifeguards.
E. If there are 12 lifeguards on duty, how many swimmers
are allowed in the pool?
F. Suppose you wanted to find out how many swimmers
would be allowed for 31 lifeguards. Which would be the
easier way to find the answer, extending the graph or
using the relation? Explain.
Resources/Notes
Math Makes Sense 7
Lesson 1.6
(continued)
2 4 6 8 10 12 Number of Lifeguards
Nu
mb
er o
f S
wim
mers
Lifeguards needed for Swimmers
20
40
60
80
Strand: Patterns and Relations (Patterns)
Grade 7 Mathematics Curriculum Outcomes 64
Outcomes with Achievement Indicators
Unit 1
General Outcome: Use patterns to describe the world and to
solve patterns.
Specific Outcome
It is expected that students will:
7PR2 Create a table of
values from a linear
relation, graph the table of
values, and analyze the
graph to draw conclusions
and solve problems.
[C, CN, PS, R, V]
(Cont’d)
Achievement Indicators
Elaborations: Suggested Learning and Teaching Strategies
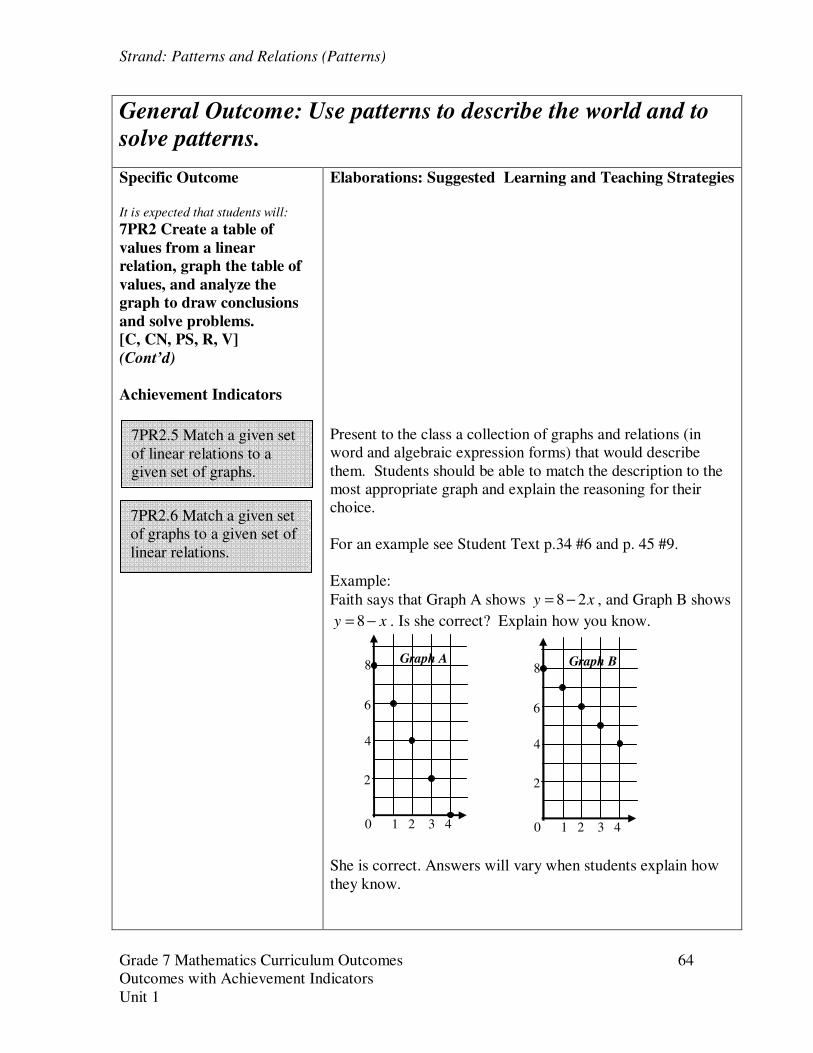
Present to the class a collection of graphs and relations (in
word and algebraic expression forms) that would describe
them. Students should be able to match the description to the
most appropriate graph and explain the reasoning for their
choice.
For an example see Student Text p.34 #6 and p. 45 #9.
Example:
Faith says that Graph A shows 8 2y x= − , and Graph B shows
8y x= − . Is she correct? Explain how you know.
She is correct. Answers will vary when students explain how
they know.
0 1 2 3 4
Graph A 8
6
4
2
0 1 2 3 4
Graph B 8
6
4
2
7PR2.5 Match a given set
of linear relations to a
given set of graphs.
7PR2.6 Match a given set
of graphs to a given set of
linear relations.
Strand: Patterns and Relations (Patterns)
Grade 7 Mathematics Curriculum Outcomes 65
Outcomes with Achievement Indicators
Unit 1
General Outcome: Use patterns to describe the world and to
solve patterns.
Suggested Assessment Strategies
Journal/Portfolio/Presentation
1. Which relations can be matched with the graph? Explain.
Input Number1 2 3 4 5 6 7 8 9 10
Outp
ut N
um
ber
1
2
3
4
5
6
7
8
9
10
A. y = 2x - 1
B. y = 2x + 1
C. y = 2x
D. y = 1x + 2
E. The output number is equal to double the input number
increased by 1.
F. The output number is equal to double the input number
decreased by 1.
2. A teacher has $60 from left from her class fundraiser. She is
going to buy each student an ice cream cone. One ice cream
costs $2. Which graph best shows the amount of money she has
left after buying various numbers of ice cream cones? Explain.
A. B.
Number of Ice Cream Cones1 2 3 4 5
Am
ou
nt o
f M
on
ey L
eft (
$)
8
16
24
32
40
48
56
64
Number of Ice Cream Cones1 2 3 4 5
Am
ou
nt o
f M
on
ey L
eft (
$)
8
16
24
32
40
48
56
64
3. Which relation matches Graph A in #2? Explain.
A. y = 60 – 5x B. y = 60 – 2x
Resources/Notes
Math Makes Sense 7
Lesson 1.6
(continued)
Unit Review:
Page 45, #9
Strand: Patterns and Relations (Patterns)
Grade 7 Mathematics Curriculum Outcomes 66
Outcomes with Achievement Indicators
Unit 1
General Outcome: Represent algebraic expressions in
multiple ways.
Specific Outcome
7PR4. Explain the difference
between an expression and
an equation.
[C, CN]
(Cont’d)
Achievement Indicators
Elaborations: Suggested Learning and Teaching Strategies
Note: Other relevant material and elaboration can be found at
the beginning of Unit 6.
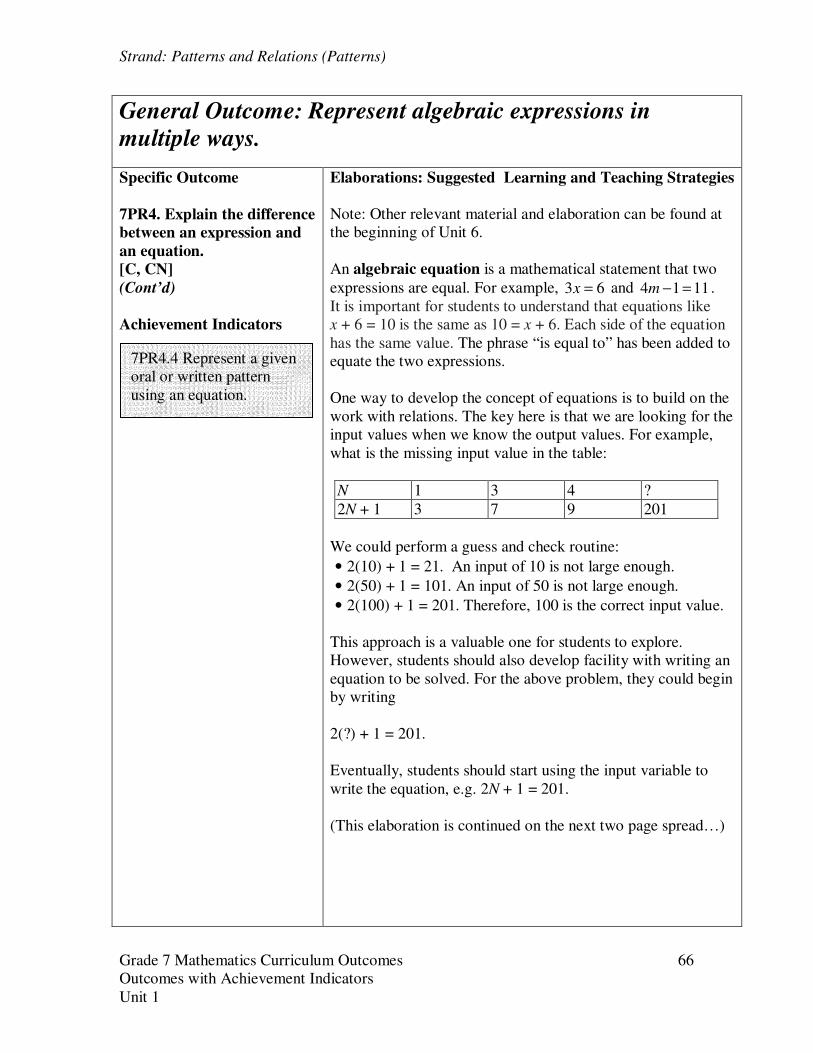
An algebraic equation is a mathematical statement that two
expressions are equal. For example, 3 6x = and 4 1 11m − = .
It is important for students to understand that equations like
x + 6 = 10 is the same as 10 = x + 6. Each side of the equation
has the same value. The phrase “is equal to” has been added to
equate the two expressions.
One way to develop the concept of equations is to build on the
work with relations. The key here is that we are looking for the
input values when we know the output values. For example,
what is the missing input value in the table:
N 1 3 4 ?
2N + 1 3 7 9 201
We could perform a guess and check routine:
• 2(10) + 1 = 21. An input of 10 is not large enough.
• 2(50) + 1 = 101. An input of 50 is not large enough.
• 2(100) + 1 = 201. Therefore, 100 is the correct input value.
This approach is a valuable one for students to explore.
However, students should also develop facility with writing an
equation to be solved. For the above problem, they could begin
by writing
2(?) + 1 = 201.
Eventually, students should start using the input variable to
write the equation, e.g. 2N + 1 = 201.
(This elaboration is continued on the next two page spread…)
7PR4.4 Represent a given
oral or written pattern
using an equation.
Strand: Patterns and Relations (Patterns)
Grade 7 Mathematics Curriculum Outcomes 67
Outcomes with Achievement Indicators
Unit 1
General Outcome: Represent algebraic expressions in
multiple ways.
Suggested Assessment Strategies
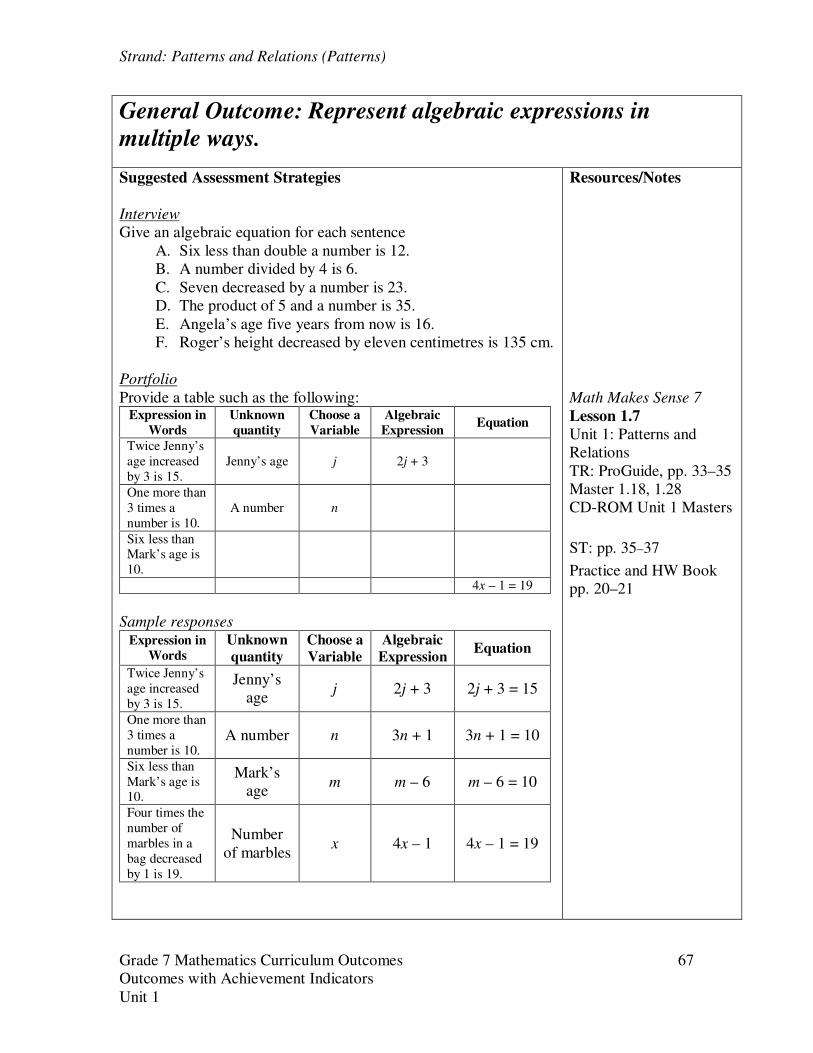
Interview
Give an algebraic equation for each sentence
A. Six less than double a number is 12.
B. A number divided by 4 is 6.
C. Seven decreased by a number is 23.
D. The product of 5 and a number is 35.
E. Angela’s age five years from now is 16.
F. Roger’s height decreased by eleven centimetres is 135 cm.
Portfolio
Provide a table such as the following: Expression in
Words
Unknown
quantity
Choose a
Variable
Algebraic
Expression Equation
Twice Jenny’s
age increased
by 3 is 15.
Jenny’s age j 2j + 3
One more than
3 times a
number is 10.
A number n
Six less than Mark’s age is
10.
4x – 1 = 19
Sample responses
Expression in
Words
Unknown
quantity
Choose a
Variable
Algebraic
Expression Equation
Twice Jenny’s
age increased
by 3 is 15.
Jenny’s
age j 2j + 3 2j + 3 = 15
One more than
3 times a
number is 10. A number n 3n + 1 3n + 1 = 10
Six less than
Mark’s age is 10.
Mark’s
age m m – 6 m – 6 = 10
Four times the
number of
marbles in a
bag decreased
by 1 is 19.
Number
of marbles x 4x – 1 4x – 1 = 19
Resources/Notes
Math Makes Sense 7
Lesson 1.7
Unit 1: Patterns and
Relations
TR: ProGuide, pp. 33–35
Master 1.18, 1.28
CD-ROM Unit 1 Masters
ST: pp. 35–37
Practice and HW Book
pp. 20–21
Strand: Patterns and Relations (Patterns)
Grade 7 Mathematics Curriculum Outcomes 68
Outcomes with Achievement Indicators
Unit 1
General Outcome: Represent algebraic expressions in
multiple ways.
Specific Outcome
7PR4. Explain the difference
between an expression and
an equation.
[C, CN]
(Cont’d)
Achievement Indicators
Elaborations: Suggested Learning and Teaching Strategies
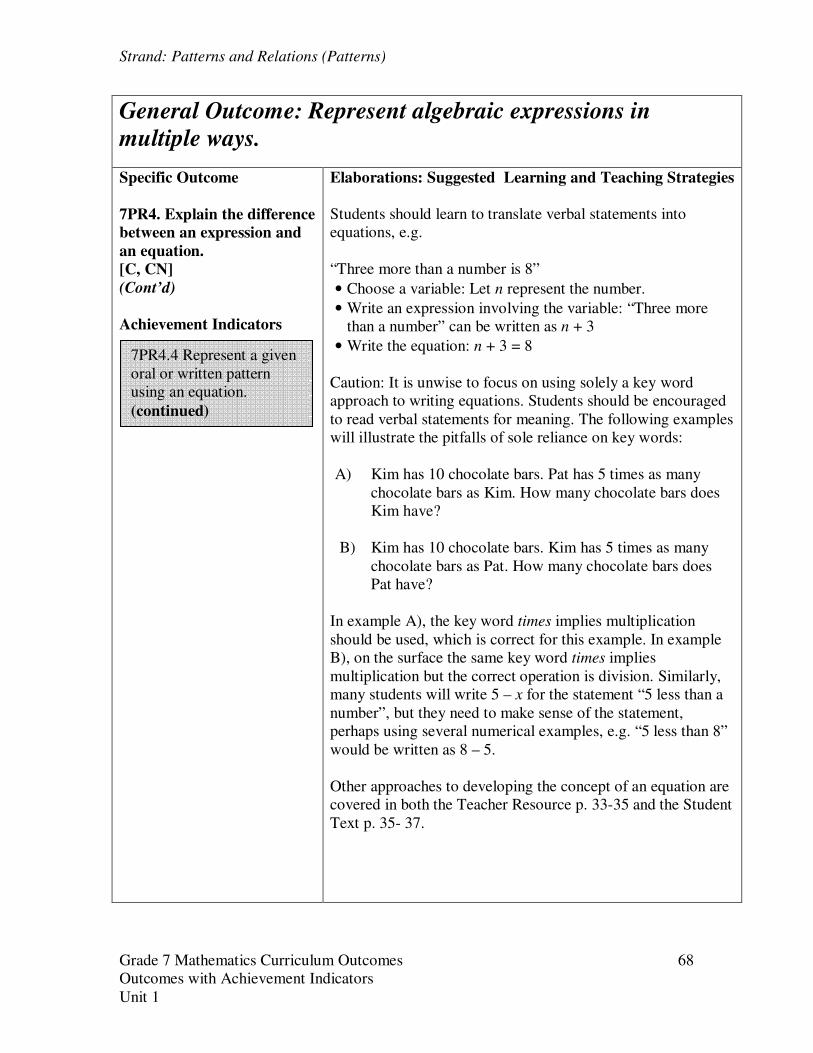
Students should learn to translate verbal statements into
equations, e.g.
“Three more than a number is 8”
• Choose a variable: Let n represent the number.
• Write an expression involving the variable: “Three more
than a number” can be written as n + 3
• Write the equation: n + 3 = 8
Caution: It is unwise to focus on using solely a key word
approach to writing equations. Students should be encouraged
to read verbal statements for meaning. The following examples
will illustrate the pitfalls of sole reliance on key words:
A) Kim has 10 chocolate bars. Pat has 5 times as many
chocolate bars as Kim. How many chocolate bars does
Kim have?
B) Kim has 10 chocolate bars. Kim has 5 times as many
chocolate bars as Pat. How many chocolate bars does
Pat have?
In example A), the key word times implies multiplication
should be used, which is correct for this example. In example
B), on the surface the same key word times implies
multiplication but the correct operation is division. Similarly,
many students will write 5 – x for the statement “5 less than a
number”, but they need to make sense of the statement,
perhaps using several numerical examples, e.g. “5 less than 8”
would be written as 8 – 5.
Other approaches to developing the concept of an equation are
covered in both the Teacher Resource p. 33-35 and the Student
Text p. 35- 37.
7PR4.4 Represent a given
oral or written pattern
using an equation.
(continued)
Strand: Patterns and Relations (Patterns)
Grade 7 Mathematics Curriculum Outcomes 69
Outcomes with Achievement Indicators
Unit 1
General Outcome: Represent algebraic expressions in
multiple ways.
Suggested Assessment Strategies
Resources/Notes
Math Makes Sense 7
Lesson 1.7
(continued)
Strand: Patterns and Relations (Patterns)
.
Grade 7 Mathematics Curriculum Outcomes 70
Outcomes with Achievement Indicators
Unit 1
General Outcome: Represent algebraic expressions in
multiple ways.
Specific Outcome
It is expected that students will:
7PR4 Explain the difference
between an expression and
an equation. [C, CN]
(Cont’d)
Achievement Indicators
Elaborations: Suggested Learning and Teaching Strategies
Students were previously expected to be able to identify the
constant term, numerical coefficient, and variable in an
algebraic expression (see Achievement Indicator 7PR4.1).
Students should be able to identify these in an algebraic
equation as well. For example, in the equation 5 7+ =x , the
constant terms are 5 and 7, the numerical coefficient is 1 and
the variable is x.
7PR4.5 Identify and
provide an example of a
constant term, numerical
coefficient and variable in
an equation.

Strand: Patterns and Relations (Patterns)
.
Grade 7 Mathematics Curriculum Outcomes 71
Outcomes with Achievement Indicators
Unit 1
General Outcome: Represent algebraic expressions in
multiple ways.
Suggested Assessment Strategies
Portfolio
Ask students to create a classroom chart with the following
headings:
Equation Variable Numerical
Coefficient Constant
3b + 1= 7 b 3 1 & 7
Have students continue to add examples to the chart each day.
Resources/Notes
Math Makes Sense 7
Lesson 1.8
Unit 1: Patterns and
Relations
TR: ProGuide, pp. 36–40
Master 1.19, 1.29
PM 30
CD-ROM Unit 1 Masters
ST: pp. 38–42
Practice and HW Book
pp. 22–24
Strand: Patterns and Relations (Patterns)
Grade 7 Mathematics Curriculum Outcomes 72
Outcomes with Achievement Indicators
Unit 1
General Outcome: Represent algebraic expressions in multiple
ways.
Specific Outcome
It is expected that students will:
7PR7 Model and solve,
concretely, pictorially and
symbolically, problems that
can be represented by linear
equations of the form:
• ax + b = c
• ax = b
• ,x
b aa
= ≠ 0
where a, b and c are whole
numbers.
[CN, PS, R, V]
Achievement Indicators
Elaborations: Suggested Learning and Teaching Strategies
At this time, the focus will be on solving equations concretely (e.g.
algebra tiles) and pictorially (e.g. a sketch of algebra tiles or a two-
pan balance), using whole numbers only. Solving linear equations
symbolically (algebraically) will be covered in Unit 6.
Students are expected to use concrete models when solving problems
and equations. They can then draw pictures of their models in order to
move from the concrete stage to the pictorial. It is also important for
students to verify the solutions to equations using their models.
As mentioned in the teacher resource, the yellow algebra tiles used in
the student text represent positive values and the red tiles will represent
negative. Other sets of tiles may vary in their color schemes. Class
agreement should be reached as to which color will represent positive
and which will represent negative. Some teachers may choose to create
a class set that matches the text using ‘fun foam’ or other similar
materials. For the purpose of this section, we will be working with
positive tiles only.
A full description of how to use algebra tiles to solve equations of the
form ax + b = c and ax = b is given in the Teacher Resource p. 36-41
and the Student Text p. 38-41.
(This achievement indicator is continued on the next page…)
7PR7.1 Model a given
problem with a linear
equation; and solve the
equation, using concrete
models, e.g., counters,
integer tiles.
Strand: Patterns and Relations (Patterns)
Grade 7 Mathematics Curriculum Outcomes 73
Outcomes with Achievement Indicators
Unit 1
General Outcome: Represent algebraic expressions in multiple
ways.
Suggested Assessment Strategies
Paper and Pencil
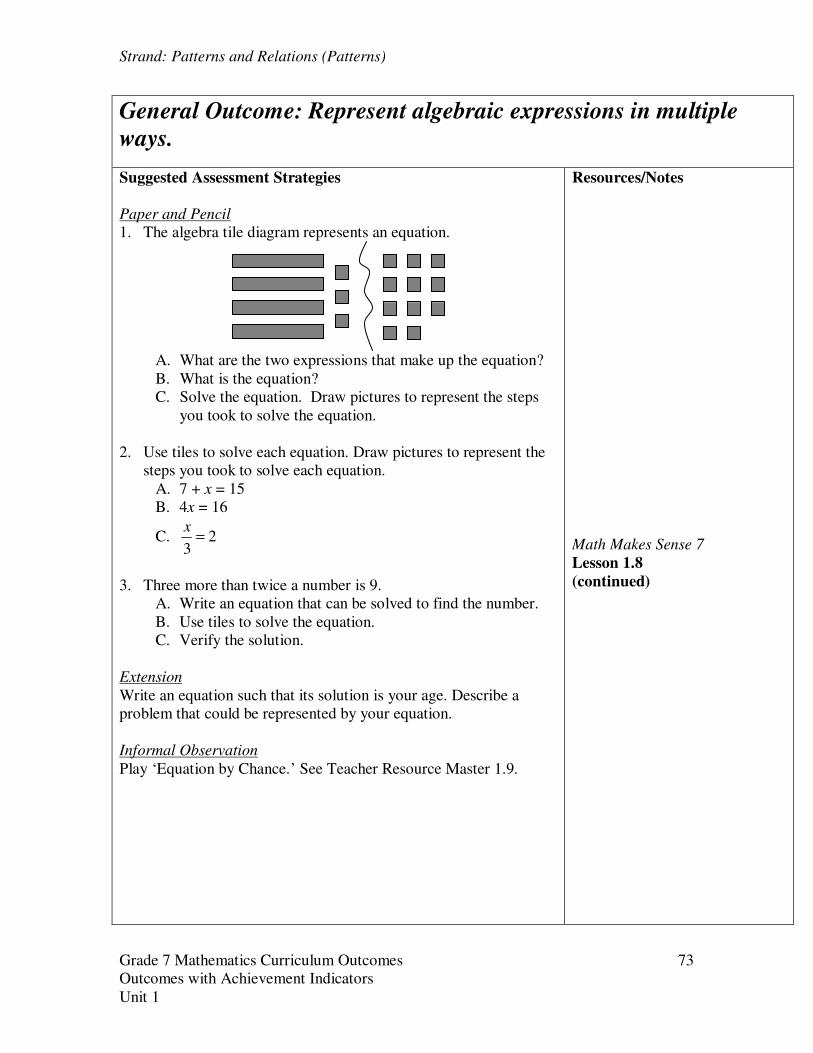
1. The algebra tile diagram represents an equation.
A. What are the two expressions that make up the equation?
B. What is the equation?
C. Solve the equation. Draw pictures to represent the steps
you took to solve the equation.
2. Use tiles to solve each equation. Draw pictures to represent the
steps you took to solve each equation.
A. 7 + x = 15
B. 4x = 16
C. 23
x=
3. Three more than twice a number is 9.
A. Write an equation that can be solved to find the number.
B. Use tiles to solve the equation.
C. Verify the solution.
Extension
Write an equation such that its solution is your age. Describe a
problem that could be represented by your equation.
Informal Observation
Play ‘Equation by Chance.’ See Teacher Resource Master 1.9.
Resources/Notes
Math Makes Sense 7
Lesson 1.8
(continued)
Strand: Patterns and Relations (Patterns)
Grade 7 Mathematics Curriculum Outcomes 74
Outcomes with Achievement Indicators
Unit 1
General Outcome: Represent algebraic expressions in
multiple ways.
Specific Outcome
It is expected that students will:
7PR7 Model and solve,
concretely, pictorially and
symbolically, problems that
can be represented by linear
equations of the form:
• ax + b = c
• ax = b
• ,x
b aa
= ≠ 0
where a, b and c are whole
numbers.
[CN, PS, R, V]
(Cont’d)
Achievement Indicators
Elaborations: Suggested Learning and Teaching Strategies
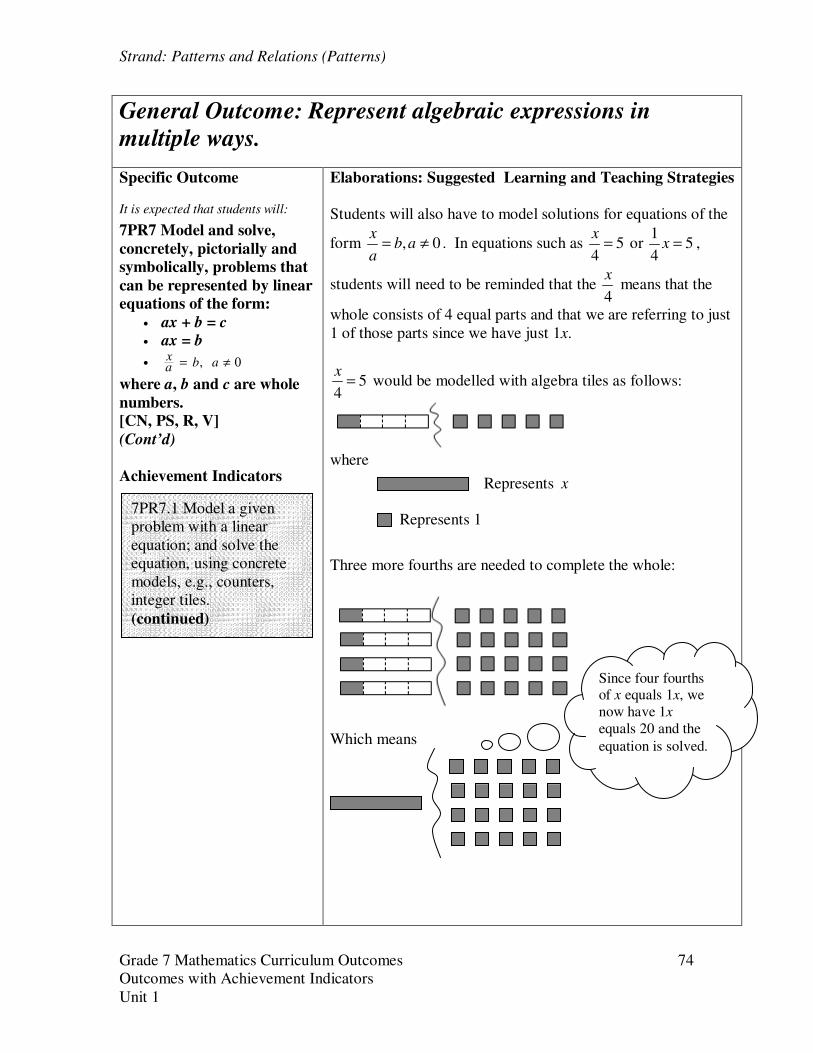
Students will also have to model solutions for equations of the
form , 0x
b aa
= ≠ . In equations such as 54
x= or
15
4x = ,
students will need to be reminded that the 4
x means that the
whole consists of 4 equal parts and that we are referring to just
1 of those parts since we have just 1x.
54
x= would be modelled with algebra tiles as follows:
where
Three more fourths are needed to complete the whole:
Which means
7PR7.1 Model a given
problem with a linear
equation; and solve the
equation, using concrete
models, e.g., counters,
integer tiles.
(continued)
Represents x
Represents 1
Since four fourths
of x equals 1x, we
now have 1x
equals 20 and the
equation is solved.
Strand: Patterns and Relations (Patterns)
Grade 7 Mathematics Curriculum Outcomes 75
Outcomes with Achievement Indicators
Unit 1
General Outcome: Represent algebraic expressions in
multiple ways.
Suggested Assessment Strategies
Resources/Notes
Math Makes Sense 7
Lesson 1.8
(continued)

Strand: Patterns and Relations (Patterns)
Grade 7 Mathematics Curriculum Outcomes 76
Outcomes with Achievement Indicators
Unit 1


![Sky Patterns [2nd grade] - Trinity University](https://img.dokumen.tips/doc/110x75/621143fdac95da672a152fc8/sky-patterns-2nd-grade-trinity-university.jpg)