Embed Size (px)
Citation preview

14
Transportation Research Record: Journal of the Transportation Research Board, No. 2267, Transportation Research Board of the National Academies, Washington, D.C., 2012, pp. 14–26.DOI: 10.3141/2267-02
Gradation Effects Influencing Mechanical Properties of Aggregate Base–Granular Subbase Materials in Minnesota
Yuanjie Xiao, Erol Tutumluer, Yu Qian, and John A. Siekmeier
shape, texture and angularity, fines content (percentage passing No. 200 sieve or smaller than 0.075 mm), plasticity index, and mois-ture and density conditions related to compaction and their interactions are not well understood. For example, particle size distribution or gradation is a key factor influencing not only the mechanical response behavior characterized by resilient modulus (MR), shear strength, and permanent deformation but also permeability, frost susceptibility, and susceptibility to erosion (6, 7).
To ensure adequate pavement performance, the Minnesota Depart-ment of Transportation (DOT), among many other state highway agencies, uses recipe-based specifications for unbound aggregates in road base–subbase construction. These empirical gradation bands used in pavement applications specify different aggregate classes from 1 to 7 and source rock quality, which reportedly have no robust linkage with actual performance in the field (8). Such requirements based on various grading envelopes (e.g., well graded, uniformly graded) and limits of maximum particle size not only may be con-flicting with regard to pavement layer stability and drainability but also may fail to distinguish different gradations within the specified bands, especially when aggregates from different sources are used (3, 9). With standard high-quality materials becoming increasingly scarce and expensive, such traditional gradation specifications may potentially reject many marginal materials that often lower cost and are locally available. Recent research demonstrated that marginal materials could become quite economical for use in low-volume roads and properly serve the design traffic levels and the operating environment (10). Therefore, development of performance-based gradation specifications can help maximize beneficial use of locally available materials, which is potentially a green and sustainable transportation infrastructure alternative.
Establishing robust linkages between gradation and satisfactory unbound aggregate mechanical behavior is essential for the develop-ment of performance-based gradation specifications. The qualitative gradation descriptions (e.g., upper, median, and lower limits), as documented in previous laboratory experiments investigating grada-tion influences, are not applicable for this purpose (1, 3, 11, 12). With the advent of analytic gradation models and aggregate packing theo-ries, recent research efforts have focused on quantifying gradation curves as numbers on a continuous scale to relate them to mechanis-tic behavior trends (4, 13). These analytic gradation measures can quantify the change in performance of a given aggregate material within specified gradation bands leading to optimized gradation zones for desirable mechanical and hydraulic performance based on site-specific traffic and environmental conditions, respectively.
This paper presents an aggregate gradation mechanism based on the proportionality between gravel and sand size particles (as per ASTM D2487-11) to demonstrate how mechanical behavior—that is,
Aggregate gradation effects on strength and modulus characteristics of aggregate base–granular subbase materials used in Minnesota are described. The importance of specifying proper aggregate grading or particle size distribution has long been recognized for achieving satisfac-tory performance in pavement applications. In the construction of dense-graded unbound aggregate base–subbase layers, well-graded gradation bands were often established years ago on the basis of the experience of the state transportation agency and may not have a direct link to mechan-ical performance. To improve specifications for superior performance targeted in the mechanistic–empirical pavement analysis and design framework, there is a need to understand how differences in aggregate gradations may affect unbound aggregate base–subbase behavior for site-specific design conditions. Aggregates with different gradations and material properties were compiled in a statewide database established from a variety of sources in Minnesota. Analyses showed nonunique mod-ulus and strength relationships for most aggregate base and especially sub-base materials. Laboratory resilient modulus and shear strength results were analyzed for critical gradation parameters by common gradation characterization methods. The most significant correlations were between a gravel-to-sand ratio (proposed based on ASTM D2487-11) and aggregate shear strength properties. Aggregate compaction (AASHTO T99) and resilient modulus characteristics could also be linked to the gravel-to-sand ratio and verified with other databases in the literature. The gravel-to-sand ratio can be used to optimize aggregate gradations for improved base–subbase performances primarily influenced by shear strength.
Unbound granular materials are commonly used in aggregate base–granular subbase courses in flexible pavements. The main functions of these unbound pavement foundation layers are to distribute load through aggregate interlock and protect the weak subgrade beneath; other performance needs pertinent to maintaining integrity in chang-ing environmental conditions are also nontrivial. In the past few decades, there have been significant efforts to understand individual aggregate properties as factors influencing mechanical and hydrau-lic response trends of unbound aggregate materials (1–5). Compared with aggregate type and mineralogy, properties such as aggregate
Y. Xiao, E. Tutumluer, and Y. Qian, Department of Civil and Environmental Engi-neering, University of Illinois at Urbana–Champaign, 205 North Mathews Ave-nue, Urbana, IL 61801. J. A. Siekmeier, Office of Materials and Road Research, Minnesota Department of Transportation, Maplewood, MN 55109. Corresponding author: E. Tutumluer, [email protected].

Xiao, Tutumluer, Qian, and Siekmeier 15
shear strength and MR characteristics—of aggregate base–granular subbase materials can be quantified and related to grain size distribu-tions. A secondary goal is to show that there is no unique relationship between modulus and shear strength properties as obtained from analyzing a comprehensive aggregate database established from a variety of sources in Minnesota, and, further, the actual field rut-ting performance of an unbound aggregate base–granular subbase is primarily linked to shear strength but not to modulus characteristics.
Gradation Quantification Methods
Of the various mathematical functions proposed to describe aggregate particle size distribution, the Talbot equation was possibly one of the earliest to describe a maximum density curve for a given maximum aggregate size (14). With percent passing data (pi) regressing against sieve sizes (Di) according to Equation 1, a given gradation curve can be represented as a point with coordinates (n, Dmax) in a similar Cartesian plane where shape factor n is on the x-axis and Dmax is on the y-axis. Using this representation, Sánchez-Leal (15) proposed a gradation-chart approach to promote free design in which a calculated gravel-to-sand ratio was used in lieu of the traditional gradation bands to ensure that required hot-mix asphalt performance was met by avail-able aggregate sources. According to Sánchez-Leal (15), an increas-ing gravel-to-sand ratio resulted in diminished workability, greater rutting resistance, and increased permeability.
pD
Dii
n
=
max
( )1
where
pi = percentage of material by weight passing the ith sieve size, Di = opening size of this particular ith sieve, Dmax = maximum size of aggregate, and n = shape factor of gradation curve.
The above gradation-chart approach was developed from grada-tion curves explained by the Talbot equation with R2 values > .97; extending such an approach to gradation curves with R2 values < .97 remains unexplored. For gradations other than well-graded ones (e.g., open graded) that may not be well explained by the Talbot equation, the Rosin–Rammler distribution function described by Djamarani and Clark (16) can outperform others, as it is reported to be particularly suitable for describing the particle size distribution of powders of various natures and sizes as generated by grinding, mill-ing, and crushing operations. As shown in Equation 2, two parame-ters, the mean particle size Dm and the measure of the spread of particle size distribution n, are used to represent the Rosin–Rammler function.
pD
Dii
m
n
= − −
1 2exp ( )
The Unified Soil Classification System (USCS), as per ASTM D2487-11, quantifies the gradation of a soil with <12% of fines with two parameters: coefficient of uniformity, Cu (D60/D10), and coeffi-cient of curvature, Cc (D2
30/D60D10). Soils are considered very poorly graded when Cu < 3, whereas gravels and sands are deemed well graded when Cu > 4 and 6, respectively. Cc for well-graded soils or aggregates often ranges between 1 and 3. The definitions for gravel
and sand are not unique, with USCS defining gravel as particles pass-ing a 75-mm (3-in.) sieve and retained on 4.75-mm (No. 4) sieve and sand as particles passing a 4.75-mm (No. 4) sieve and retained on a 75-µm (No. 200) sieve. Thus, an aggregate is classified as gravel or sand (coarse aggregate or fine aggregate) depending on which proportion present is larger.
The influence of gravel (or coarse aggregate) content on the shear strength of cohesionless soil–gravel and sand–gravel mixtures has been the topic of investigation of many geotechnical researchers. According to Vallejo (17), the frictional resistance between the gravel particles controlled the shear strength of the soil–gravel and sand–gravel mixtures when the percentage by weight of gravel aver-aged >70%, whereas the gravel particles with an average concentra-tion by weight of <49% basically had no control over the shear strength of the mixtures. This scientific observation could imply that the rela-tive contents of gravel and sand particles in aggregate base–granular subbase materials may be an inherent factor controlling mixture per-formance mechanically or hydraulically, as supported by the findings of Sánchez-Leal (15) from studies with hot-mix asphalt.
In terms of characterizing aggregate packing in stone-based infra-structure materials, such as hot-mix asphalt, the Bailey method is one of the pioneers. It analyzes the combined aggregate blend with the use of three parameters: the coarse aggregate ratio, the coarse portion of the fine aggregate ratio, and the fine portion of the fine aggregate ratio, which are calculated from the following designated sieves: half sieve, primary control sieve, secondary control sieve, and tertiary control sieve (18). Although the Bailey method has been widely used in hot-mix asphalt gradation design and performance evaluation, its application and validity for aggregate base–granular subbase grada-tion design has not been fully explored. Equation 3 summarizes the essential equations associated with the Bailey method.
half sieve NMPS
PCS NMPS SCS PC
= ∗
= ∗ = ∗
0 5
0 22 0 22
.
. . SS TCS SCS
CA ratiopassing half sieve
= ∗
=
0 22.
% −−−
%
% %
passing PCS
passing half sieve
FAc
100
==
=
%
%
%
passing SCS
passing PCS
FApassing T
f
CCS
passing SCS%( )3
where
NMPS = nominal maximum particle size, a Superpave® asphalt mix design terminology defined as one sieve larger than the first sieve that retains more than 10%;
PCS = primary control sieve; SCS = secondary control sieve; TCS = tertiary control sieve; CA = coarse aggregate; FAc = coarse portion of fine aggregate ratio; and FAf = fine portion of fine aggregate ratio.
objective and scope
As part of ongoing research efforts aimed at developing performance-based Minnesota DOT aggregate material classes, the primary objec-tive has been to explore from Minnesota DOT aggregate database

16 Transportation Research Record 2267
analysis robust linkages between quantitative gradation parameters and critical mechanical behavior of aggregate base–granular subbase materials. More broadly, when such linkages are established and vali-dated, improved performance-based specifications would provide sustainable outcomes for the use of limited aggregate sources with optimal properties by matching site-specific design traffic levels and operating environmental conditions.
The comprehensive Minnesota DOT aggregate database includes experimental results of the MR and peak deviator stress at failure for standard material aggregate classes as well as waste–reclaimed base–subbase course materials. There is no unique relationship between modulus and shear strength properties. Statistical correla-tions established between critical gradation parameters, quantified with the characterization methods described above, and the strength, modulus, and moisture properties indicate gravel-to-sand ratio as an important gradation parameter.
Minnesota dot aGGreGate database
Materials tested
The database provided by the Minnesota DOT includes various types of aggregates ranging from standard gravel (pit-run), limestone, granite, and select granular materials to nonstandard taconite tailings (a waste mining material), reclaimed asphalt pavement, reclaimed concrete aggregates blended with virgin aggregates at different blend-ing ratios, and materials recovered from full-depth reclamation sites. All the materials were collected from road construction sites in Minnesota for testing at the Minnesota DOT Office of Materials and Road Research Laboratories or Minnesota DOT’s contracting agencies and universities with consistent quality control procedures. Figures 1 and 2 present the grain size distributions of these materials in relation to corresponding aggregate base–granular subbase grada-tion bands. They are grouped according to rock type and mineralogy to minimize the confounding effects that aggregate shape properties (form, texture, and angularity), which have been demonstrated to be quite influential (19), have on analyses of gradation. Quarried lime-stone and granite materials appear to have much less variability in gradation than the other materials. Table 1 summarizes other sample details at optimum moisture conditions sorted from the database for correlation analyses, such as Minnesota DOT specification designa-tions and nominal maximum particle size. The different aggregate top sizes available in the database make it possible to compare the laboratory-measured performances of different top-sized gradations.
experimental program
Proctor compaction tests were performed on the aggregate materials following the AASHTO T99 standard energy with index properties, and optimum moisture contents and maximum dry densities were determined accordingly. MR tests were conducted on compacted specimens following the NCHRP 1-28A protocol. After completion of MR tests, specimens were typically loaded to failure at constant confining pressures ranging from 4 to 10 psi (see Table 1) with a constant loading rate of 0.03 in./s (0.76 mm/s) to obtain the peak deviator stress values. Such shear strength tests performed after com-pletion of the repeated-load MR sequences were conditioned and thus included the effect of stress history compared with unconditioned
ones. The MR results of this database were analyzed in a previous study to establish correlations between aggregate source properties and the Mechanistic–Empirical Pavement Design Guide MR consti-tutive model parameters for use in Level 2 pavement design applica-tions (20). Hence, this paper focuses on the shear strength results to provide a more definite evaluation of base–subbase material quality and performance potential compared with MR (1).
Considering that permanent deformations were not recorded from the conditioning stages of MR tests and saved in the database, the permanent deformation trends linked to field rutting performances were then indirectly evaluated for these aggregate materials from the peak deviator stresses at failure measured at a given confining pres-sure. The peak deviator stresses at failure data presented here are therefore used as an indicator of the aggregate material’s shear strength. Tutumluer and Pan (19) observed good correlations between maximum peak deviator stress at failure (at confining pressure = 34.5 kPa, or 5 psi) and permanent strains at the 10,000th load repeti-tion for 21 unbound aggregate blends in a study of aggregate shape effects. Although the Mohr–Coulomb shear strength parameters, cohesion c and friction angle ϕ, could be determined for some of the samples, to be consistent, they are not used in the following correlation analyses.
analyses of experiMental results
determination of Key Gradation parameters
To develop correlations between gradation parameters and the MR and peak deviator stress responses of base–subbase materials, the first step was to establish data sets containing all the independent and dependent variables. It was necessary to eliminate any differ-ences among samples related to compaction moisture and density conditions. This was accomplished by choosing samples with molded moisture contents within ±0.5% of the targeted optimum, as per the NCHRP 1-28A protocol, for investigation. As a result, samples com-pared were closely kept at optimum conditions with only the grada-tions varying. All the results presented here were based on the ±1% moisture content criterion; such a trial relaxation of the ±0.5% cri-terion to ±1% increased the sample population but did not change the results and the trends observed in statistical analyses, and the data included in the analyses were referred to as “near optimum conditions.” Unlike the moisture contents, the achieved dry densi-ties were not found to influence results significantly in this study. The average relative compaction level (achieved dry density over maximum dry density) was 98.9% with a standard deviation of 3.5% for all samples tested.
The previously reviewed gradation quantification methods were used one by one to calculate gradation parameters for all samples selected; thus, the following independent variables were considered: maximum particle size Dmax and shape factor n from the Talbot equa-tion; mean aggregate size Dm and spread factor n from the Rosin–Rammler distribution function; uniformity coefficient Cu, curvature coefficient Cc, fines percentage %F, and diameter values correspond-ing to 60%, 50%, 30%, and 10% passing in weights d60, d50, d30, and d10 from the USCS, respectively; gravel-to-sand ratio (G/S); and CA, FAc, and FAf. The gravel-to-sand ratios for the Minnesota DOT data-base gradations studied were calculated with Equation 4, which was derived from the two parameters of the Talbot equation (Dmax and n) fitted from the percent passing data, according to the gravel and sand
Xiao, Tutumluer, Qian, and Siekmeier 17
FIGURE 1 Gradations of traditional base–subbase materials in Minnesota DOT database: (a) select granular, (b) granite, (c) pit-run gravel, and (d) limestone.
(a)
Class 3 Upper BoundClass 4 Upper BoundADFHJNClass 3 Lower BoundClass 4 Lower Bound
0.075 0.5 5 75500.1 1 10
Grain Size (mm)
Sand GravelCoarseCoarse FineFine Medium
U.S. Standard Sieve Sizes
0
10
20
30
40
50
60
70
80
90
100#100 #50 #30 #16 #8 #4 2"1" 11/2"1/2"3/8" 3/4"#200
Fine
r by
Wei
ght (
%)
(c)
0.075 0.5 5 75500.1 1 10
Grain Size (mm)
Sand GravelCoarseCoarse FineFine Medium
U.S. Standard Sieve Sizes
0
10
20
30
40
50
60
70
80
90
100#100 #50 #30 #16 #8 #4 2"1" 11/2"1/2"3/8" 3/4"#200
Fine
r by
Wei
ght (
%)
(b)
Class 5 Upper BoundClass 6 Upper BoundC6OMC6PC6MC6OM105CC6M2105BClass 5 Lower BoundClass 6 Lower Bound
Class 5 Upper BoundClass 6 Upper BoundC5C5G723GNR2C5HJR2C5GBR5Class 5 Lower BoundClass 6 Lower Bound
Class 5 Upper BoundClass 6 Upper BoundC2603C5GJR3C5HCR3_T62CHHR161CHHR1M5FNDSU_CClass 5 Lower BoundClass 6 Lower Bound
0.075 0.5 5 75500.1 1 10
Grain Size (mm)
Sand GravelCoarseCoarse FineFine Medium
U.S. Standard Sieve Sizes
0
10
20
30
40
50
60
70
80
90
100#100 #50 #30 #16 #8 #4 2"1" 11/2"1/2"3/8" 3/4"#200
Fine
r by
Wei
ght (
%)
(d)
0.075 0.5 5 75500.1 1 10
Grain Size (mm)
Sand GravelCoarseCoarse FineFine Medium
U.S. Standard Sieve Sizes
0
10
20
30
40
50
60
70
80
90
100#100 #50 #30 #16 #8 #4 2"1" 11/2"1/2"3/8" 3/4"#200
Fine
r by
Wei
ght (
%)

18 Transportation Research Record 2267
FIGURE 2 Gradations of nontraditional waste base–subbase materials in Minnesota DOT database: (a) taconite tailings, (b) reclaimed concrete (Class 7C), (c) reclaimed bituminous (Class 7B), and (d) full-depth reclamation (FDR).
(a)
Class 3 Upper BoundClass 4 Upper Bound3600RM2A0801RM2A3700RM1001RM1101RM2A0901RM2AClass 3 Lower BoundClass 4 Lower Bound
0.075 0.5 5 75500.1 1 10
Grain Size (mm)
Sand GravelCoarseCoarse FineFine Medium
U.S. Standard Sieve Sizes
0
10
20
30
40
50
60
70
80
90
100#100 #50 #30 #16 #8 #4 2"1" 11/2"1/2"3/8" 3/4"#200
Fine
r by
Wei
ght (
%)
(c)
0.075 0.5 5 75500.1 1 10
Grain Size (mm)
Sand GravelCoarseCoarse FineFine Medium
U.S. Standard Sieve Sizes
0
10
20
30
40
50
60
70
80
90
100#100 #50 #30 #16 #8 #4 2"1" 11/2"1/2"3/8" 3/4"#200
Fine
r by
Wei
ght (
%)
(b)
Class 5 Upper BoundClass 7 Base Upper BoundTH23_XTH200_YCR3_UCR3_VCR3_WCR3_SClass 5 Lower BoundClass 7 Base Lower Bound
Class 5 Upper BoundClass 7 Base Upper BoundC1314R2C3328R2UM_SAT_PCC100UM_PCC75UM_PCC50UM_PCC25Class 5 Lower BoundClass 7 Base Lower Bound
Class 5 Upper BoundClass 7 Base Upper BoundNDSU_UF/UNNDSU_VF/VNNDSU_WF/WNNDSU_RF/RNUM_RAP100UM_RAP25NDSU_SF/SNNDSU_TF/TNClass 5 Lower BoundClass 7 Base Lower Bound
0.075 0.5 5 75500.1 1 10
Grain Size (mm)
Sand GravelCoarseCoarse FineFine Medium
U.S. Standard Sieve Sizes
0
10
20
30
40
50
60
70
80
90
100#100 #50 #30 #16 #8 #4 2"1" 11/2"1/2"3/8" 3/4"#200
Fine
r by
Wei
ght (
%)
(d)
0.075 0.5 5 75500.1 1 10
Grain Size (mm)
Sand GravelCoarseCoarse FineFine Medium
U.S. Standard Sieve Sizes
0
10
20
30
40
50
60
70
80
90
100#100 #50 #30 #16 #8 #4 2"1" 11/2"1/2"3/8" 3/4"#200
Fine
r by
Wei
ght (
%)

Xiao, Tutumluer, Qian, and Siekmeier 19
definitions of the USCS. Thus, percentages passing all sieve sizes, not just No. 4 (4.75 mm) and No. 200 (75 µm), were used.
G
S
p p
p p
D= −−
=−
75 4 75
4 75 0 075
14 75
mm mm
mm mm
.
. .
max
.
−
=
n
n n
D D
D
4 75 0 075. .
max max
maax .
. .( )
( ) −−
n n
n n
4 75
4 75 0 0754
Modulus–Strength Relationship
To determine representative aggregate base–granular subbase stress levels, MnPAVE layered structural analyses were performed on typi-cal Minnesota DOT pavement sections, indicated in Table 2, sub-jected to the 18-kip dual-tire axle loads (equivalent single-axle loads). The MnPAVE program default values were assumed for parameters not specified in Table 2, which presents the representative stress states computed at mid-depth in the aggregate base and granular subbase. The representative stress states were needed to calculate base–subbase MR values with the modulus characterization models reported from laboratory testing of these aggregate materials.
Relationships between modulus and shear strength properties were investigated for different Minnesota DOT aggregate classes. Because of the limited number of data sets selected, the primary objective was
to verify whether any consistent trends existed between modulus and strength (e.g., high shear strength for high modulus, and vice versa) for each Minnesota DOT aggregate class, as assumed in a previous study on aggregate quality effects (21). Modulus–strength trends for standard or conventional aggregate base and granular subbase materi-als at near optimum moisture conditions are illustrated in Figure 3. The MR values of base and subbase materials were calculated at the representative stress levels computed at mid-depth base and subbase (as tabulated in Table 2), respectively.
As shown in Figure 3, for standard high-quality crushed stones, such as granite, high MR values generally correspond to high shear strength properties, while this trend is reversed for weak subbase materials such as select granular. There appears to be no clear and significant modulus–strength relationship for all aggregate materials studied, probably because the shear strength test is destructive in nature, whereas the MR test is nondestructive in nature. By testing materials close to maximum dry density and optimum moisture con-ditions, Thompson and Smith (1) pointed out that permanent defor-mation under repeated loading, instead of MR, was a better and more definite property for ranking granular base performance potential. Bilodeau et al. (4) tested materials with three water contents (+2% higher than the absorption, near saturation, and drained water con-tents) and also found that the permanent strain behavior of all source aggregates was related to the grain size properties of the smaller fractions, while the resilient behavior (at saturated water content)
TABLE 1 Aggregate Materials Compiled in Minnesota DOT Database
Material Type DOT Specificationa σ3 for σdf (psi) NMPS (mm) Major Gradation Type
Standard Select granular Class 3/4 4, 8 0.425, 0.6, 9.5, 37.5 Fine graded Granite Class 6 4 16 Coarse graded Gravel Class 5 4, 5, 8, 10 9.5, 16, 19, 25, 31.5 Both Limestone Class 5 4 16, 25, 31.5 Coarse graded
Nonstandard Taconite tailings Class 3/4 4 2, 4.75, 9.5 Fine graded Reclaimed bituminous Class 7B 4, 5, 8, 10 9.5, 19 Fine graded Reclaimed concrete Class 7C 5, 10 19 Fine graded FDR Class 7 5, 10 19, 25 Fine graded
Note: σ3 = confining pressure; σdf = peak deviator stress at failure; NMPS = nominal maximum particle size; FDR = full-depth reclamation.aNo crushed or fractured particles are allowed for Class 3/4, Class 5 requires at least 10% crushed particles, and Class 6 requires at least 15% crushed particles.
TABLE 2 Representative Stress Levels in Typical Minnesota DOT Pavement Layers
Layer ThicknessRepresentative Stress Level
MnPAVE Fall Design Moduli
Minnesota DOT Pavement Layer in. cm psi kPa ksi MPa
Hot-mix asphalt: PG 58-34 6 15.2 — — — —
Aggregate base: Class 6 6 15.2 1 = 9.0 3 = 1.0
1 = 62.1 3 = 6.9
24 164
Granular subbase: select granular 18
45.7
3 = 5.0 3 = 1.0
1 = 34.5 3 = 6.9
11.7 81
Subgrade: engineered soil 12 30.5 3 = 4.5 3 = 1.0
1 = 31.0 3 = 6.9
— —
Natural subgrade Infinite Infinite — — — —
Note: — = items were not listed.

20 Transportation Research Record 2267
depended highly on the grain size distribution of the gravel (or coarse) fraction for crushed rocks or on the gradation uniformity for par-tially crushed gneiss. These findings may partly explain the results shown in Figure 3, although further in-depth analysis is needed on suction stress, which reportedly has different relative effects on resilience and strength. Contrary to the conventional wisdom that the load-carrying capacity of base–subbase materials increases with larger aggregate top sizes, it was observed for the data graphed in Figure 3 (although not explicitly shown) that gradations with larger top sizes did not necessarily perform better than those with smaller top sizes in terms of both MR and shear strength characteristics—that is, the top size appears to have no definite effect on MR and shear strength, as reported by Lindly et al. (22).
On the basis of similar findings, a limiting shear stress ratio (applied shear stress over shear strength) was recommended for implementa-tion in the MnPAVE flexible pavement analysis and design program so that potential rutting performances of aggregate base and espe-cially granular subbase courses in Minnesota could be taken into account. Such an approach would avoid any catastrophic shear failure in the base–subbase layer, such as the one reported by Mulvaney and Worel (8) in the Minnesota Road Research Project (MnROAD) forensic case studies.
Critical Gradation Parameters Governing Shear Strength Behavior
To identify the most important gradation parameter(s) governing the shear strength behavior of base–subbase materials, a bivariate analysis, useful for identifying bivariate unusual points and bivari-ate collinearities, was used to investigate relationships between the dependent variable (peak deviator stress at failure at given confining pressure) and explanatory variables (gradation parameters). The coef-ficients of determination (R2 and adjusted R2) were the criteria for evaluating the strength of association between each pair of these parameters. The statistical normality of each parameter was also verified with the Shapiro–Wilk test.
Of those calculated gradation parameters, the gravel-to-sand ratio, in spite of its relative simplicity, was found to exhibit the best correlation with peak deviator stress at failure for all the materials
studied at various confining pressures, as shown in Figure 4. For instance, aggregate ratios of the Bailey method, which were thought to be very promising for governing influential factors, were found to be statistically insignificant except for the fine aggregate coarse ratio. For brevity, weaker correlations are not described here.
As shown in Figure 4a, the gravel-to-sand ratio appears to have an optimal value somewhere between 1.5 and 2 at which maximum peak deviator stress at failure was computed for different grada-tions. Limestone samples exhibited decreased peak deviator stress at failure with increased gravel-to-sand ratio (larger than a possible optimal gravel-to-sand ratio). Examination of Figure 4, b and d, tends to confirm the inference made from Figure 4a, as values for peak deviator stress at failure increase with larger gravel-to-sand ratios regardless of aggregate types and gradations when the gravel-to-sand ratio is less than 1.5. The trend in Figure 4c is less obvious. As reported by Kim and Labuz (23), specimens with increased reclaimed asphalt pavement percentages exhibited higher perma-nent deformation. Almost the same peak deviator stress at failure level for those three different reclaimed asphalt pavement percent-ages in Figure 3c may be attributed to the increasing gravel-to-sand ratios (still less than 1.5), which to a certain extent could offset the detrimental effect of increasing reclaimed asphalt pavement per-centages (further study is needed to make this inference conclu-sive). It appears that when gravel-to-sand ratios gradually approach about 1.5, shear strength behavior is improved.
DiSCuSSion of ReSultS
interpretation of Gravel-to-Sand Ratio
The profound effect of the gravel-to-sand ratio on the peak deviator stress at failure (or shear strength behavior) can also be interpreted from the particle packing and porosity characteristics acquired by different relative concentrations of gravel and sand size particles. Aggregate base–granular subbase materials, in essence, are mixtures of the gravel fractions, sand fractions, and fines. Coarse aggregate grains can be deemed to enclose a void space that finer sand particles fill in, whereas the fines (passing No. 200 sieve or smaller than 75 µm) basically fill the void space created by the sand particles (see Figure 5).
(b) (a)
FIGURE 3 Resilient modulus–shear strength relationships for standard materials: (a) aggregate base and (b) granular subbase materials at near optimum moisture conditions.

Xiao, Tutumluer, Qian, and Siekmeier 21
(a) (b) (c)
FIGURE 5 Packing states of gravel–sand–fines mixture with different gravel-to-sand ratios: (a) large, (b) optimum, and (c) small (small black dots represent fines fraction).
FIGURE 4 Peak deviator stress at failure versus gravel-to-sand (G/S) ratio for various aggregates: (a) 4-psi confining pressure, (b) 5-psi confining pressure, (c) 8-psi confining pressure, and (d) 10-psi confining pressure (pcf = pounds per cubic foot; 1 pcf = 16.02 kg/m3).
(b)
y = 63.916x + 64.293R2 = 0.6553
020406080
160
100120140
0 10.5G/S
1.5
Gravel
FDR
ReclaimedBituminous
Reclaimed Concrete
Overall Regression
σ df (
psi)
(d)
y = 61.959x + 55.338R2 = 0.716
020406080
180160
100120140
0 1 20.5G/S
1.5
Gravel
FDR
ReclaimedBituminous
Reclaimed Concrete
Overall Regression
σ df (
psi)
(a)
y = -24.48x2 + 68.576x + 34.861R2 = 0.29150
20
40
60
80
100
120
0 1 20.5G/S
1.5
Select Granular
Taconite Tailings
Gravel
Limestone
Granite
Overall Regression
σ df (
psi)
(c)
75% RAP
020406080
160
100120140
0 10.5G/S
1.5
ReclaimedBituminous
Gravel
Select Granular
σ df (
psi)
100% RAP50% RAP

22 Transportation Research Record 2267
Figure 5a indicates the packing state resulting in the largest gravel-to-sand ratio as almost no sand grains to occupy a portion of the voids between the coarse aggregate particles. Mixtures at this state develop shear or permanent deformation resistance primarily by friction resis-tance between gravel size particles and may not be very stable, depending on the grading of the gravel size particle distribution. The gravel-to-sand ratio decreases when more sand fractions exist until an optimal packing configuration is reached at the ideal state shown in Figure 5b. The ideal state means the voids between the gravel size particles are completely occupied by the bulk volume of the sand grains, developing the condition of minimum porosity. The minimum porosity of the mixture can be theoretically interpreted as the bound-ary between a gravel-controlled and a sand-controlled mixture. The phase diagram analysis of Figure 5b can also derive that the mini-mum porosity of the mixture is the product of the porosity of each individual fraction (i.e., nmin = nG * nS * nf) with the same specific gravity assumed for all fractions; after that, if sand fractions con-tinue to increase (or gravel-to-sand ratio decreases), then packing
conditions will dictate gravel (or coarse) particles to “float” in the sand–fine matrix and have trivial control over shear strength behavior of the mixture (see Figure 5c).
To validate the inferences made above, the trends between the maximum dry density and optimum moisture content and the gravel-to-sand ratio are plotted in Figure 6 for those materials studied. Intui-tively, the maximum dry density and optimum moisture content obtained under a given compactive effort can serve as indicators of the porosity of the mixture, with lower maximum dry density and higher optimum moisture content representing greater porosity. The porosity is then related to the shear strength developed, and the maxi-mum shear strength of the mixture tends to occur at an optimum range of low porosity values.
As shown in Figure 6, maximum dry density approaches a maxi-mum and optimum moisture content reaches a minimum when the gravel-to-sand ratio is around 1.5, indicating the minimum possible porosity achieved by mixtures with a gravel-to-sand ratio around 1.5. The relative importance of the suction stress is also reduced as the
(a)
(b)
FIGURE 6 Maximum dry density (γdmax) and optimum moisture content (ωopt) versus G/S ratio: (a) 4-psi confining pressure and (b) 8-psi confining pressure.

Xiao, Tutumluer, Qian, and Siekmeier 23
gravel-to-sand ratio increases and the optimum moisture content decreases. Since mixtures with gravel-to-sand ratios around 1.5 at the moment are at the possibly densest packing state, it explains why peak deviator stress at failure has a maximum at this point, as indi-cated previously. The minimum porosity of a mixture is a function of porosities of both coarse aggregate particles and fine aggregate particles. Therefore, the approximate value of 1.5 found here may change when different material sources (e.g., with different bulk specific gravity) with different gradations are used. Nevertheless, such optimal proportions of gravel and sand fractions may exist when the mixture reaches its minimum porosity, is packed to the densest state, and thus yields the highest shear strength.
The gravel-to-sand ratio may also contribute to understanding the effects of unsaturated hydraulic conductivity on the suction behav-ior of base–subbase materials, especially those with broad particle size distributions. The gravel-to-sand ratio reflects the relative con-centrations of larger gravel (or coarse aggregate) and smaller sand particles, which according to Gupta et al. (24) control the saturated hydraulic conductivity and the water retention characteristics, respectively. Future research in this area potentially could explain how moisture suction may become more controlling with smaller gravel-to-sand ratios.
Analyses of other Aggregate Databases Collected
To support the observed gradation effects and gravel-to-sand ratio trends summarized so far, similar analysis results from other aggre-gate databases collected from the literature are presented in this sec-tion. The first data source was collected from the comprehensive laboratory testing program performed by Garg and Thompson (2) in which six base and subbase materials (CL-1Fsp, CL-1Csp, CL-3sp, CL-4sp, CL-5sp, and CL-6sp) collected from the MnROAD flexible pavement test sections were characterized for shear strength, MR, and rutting potential from rapid shear and repeated load triaxial tests. Since samples were tested in that study at varying moisture and den-sity levels, to be consistent, only results of three samples (CL-1Csp, CL-4sp, and CL-5sp) tested at reported maximum dry density and optimum moisture content values (AASHTO T99) are presented here. In Figure 7a, the calculated gravel-to-sand ratios are plotted against the maximum dry density, optimum moisture content, MR calculated at 100-psi bulk stress, and permanent strain (εp) calculated at the 1,000th load application from the reported values of regression constants a and b (εp% = aNb). It clearly shows that, as the gravel-to-sand ratio increases, the optimum moisture content decreases and maximum dry density increases, indicating the densification trend toward the minimum porosity. Higher permanent strain (at the 1,000th load application) represents increased rutting potential and lower shear strength. The decreased permanent strain or increased shear strength is also observed for increasing gravel-to-sand ratio, which agrees with previous findings. Although aggregate class CL-5sp required 10% to 15% crushed or fractured particles and no crushed or fractured particles were allowed in CL-1Csp or CL-4sp, a perma-nent strain decrease of up to 64% from CL-5sp to CL-4sp demon-strates the significant role of the gravel-to-sand ratio for improving shear strength. MR increases with decreased permanent strain or increased shear strength.
The second data source collected was from the study of Tian et al. (3) aimed at investigating MR and shear strength characteristics of two good quality aggregates commonly used in Oklahoma as base–
subbase materials at three gradations (finer, median, and coarser limits). As shown in Figure 7b, the calculated gravel-to-sand ratios (from actual gradation curves) are plotted against the unconfined compressive strength (Qu), maximum dry density (AASHTO T180), and optimum moisture content. The MR values were obtained at 689-kPa (100-psi) bulk stress. As indicated in Figure 7b, both aggre-gates have an optimal gravel-to-sand ratio around 2, where mix-ture porosity reaches its minimum and shear strength reaches its maximum values. The greater optimal gravel-to-sand ratio found here may be possibly attributed to higher compaction energy used (AASHTO T180 rather than T99). In addition, the modulus–strength relationship does not show any consistent or unique trends, similar to the previous Minnesota DOT aggregate database findings.
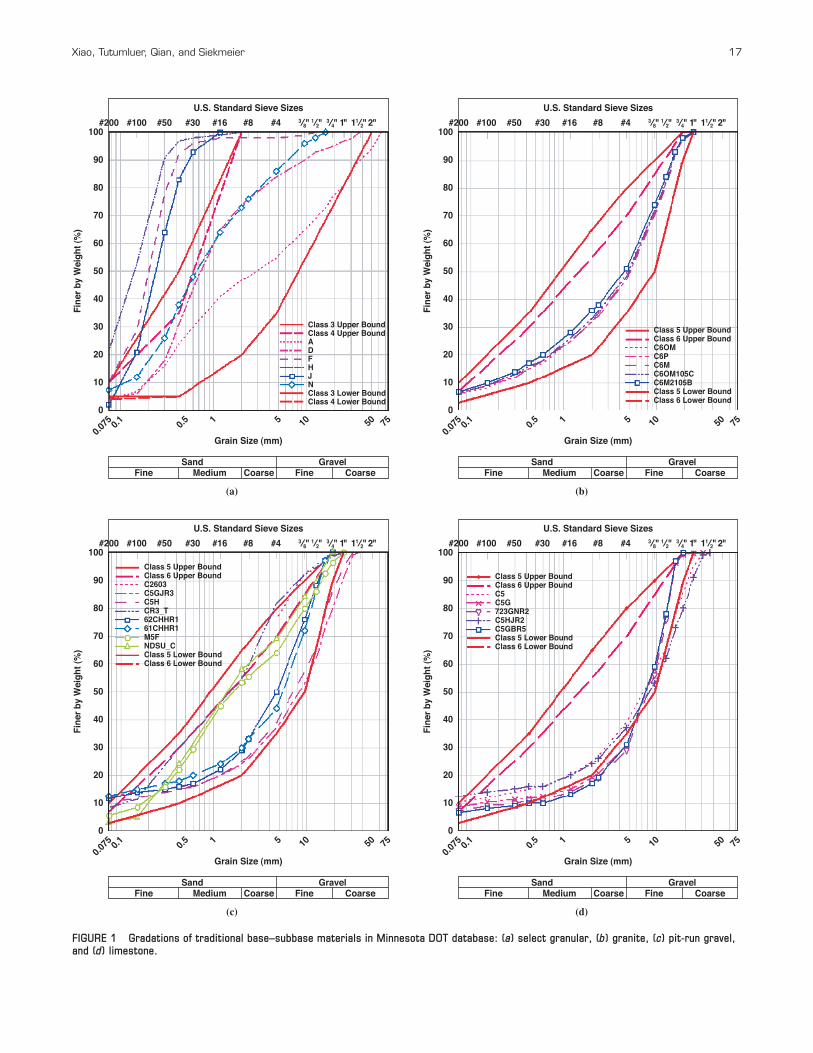
Tutumluer et al. (5) recently characterized strength, stiffness, and deformation behavior of three aggregate materials (limestone, dolo-mite, and uncrushed pit-run gravel) with controlled gradations for subgrade replacement and subbase applications through a compre-hensive laboratory test matrix. This comprehensive database was also analyzed for verification purpose. To be consistent, only sam-ples that had nonplastic fines at optimum moisture conditions were studied here for the gravel-to-sand ratio effects. The results are shown in Figure 7c. The peak deviator stress values were recorded at 15-psi confining pressure, and MR values were calculated at 345-kPa (50-psi) bulk stress. The increasing maximum dry density (AASHTO T99) and decreasing optimum moisture content trends are consistent and indicate that the minimum porosity levels for the uncrushed gravel, crushed limestone, and crushed dolomite materials approximately take place at gravel-to-sand ratios of 1.6, 1.68, and 1.56, respectively. Considering the specific gravity variations of those three materials, the three very close gravel-to-sand ratios can actually be considered as the same. Investigation of the gradation effect was not the primary objective of this research study, so the gradations were well con-trolled and engineered by varying only percent fines. Although the peak deviator stress values do not consistently increase with increas-ing gravel-to-sand ratios (or decreasing porosity), the peak deviator stress values at the maximum gravel-to-sand ratios for all three aggre-gate materials are still approximately the maximum ones. No definite relationship exists between modulus and shear strength trends, which may require further investigation into the effects of moisture-related suction stress for various fines percentages.
SuMMARy AnD ConCluSionS
A comprehensive statewide aggregate database, including both stan-dard virgin and nontraditional aggregate materials collected from various sources in Minnesota, was used to investigate the influence of gradation parameters of these primarily aggregate base–granular sub-base materials on the shear strength and MR characteristics. Com-monly used gradation quantification methods—including the Talbot equation, the Rosin–Rammler distribution function, the USCS param-eters, the conventional gravel-to-sand ratio, and the Bailey method—were used to identify key gradation parameters governing the shear strength behavior of the studied aggregate materials. While other gra-dation parameters appeared to be less significant, the gravel-to-sand ratio was found to control the shear strength behavior of both standard and reclaimed materials. For the Minnesota DOT database samples studied, the highest shear strength was reached around an optimal gravel-to-sand ratio of 1.5, where void spaces enclosed by the coarse aggregate fraction were probably filled completely by the sand size particles and fines. Further, there was inconclusive evidence of an

24 Transportation Research Record 2267
FIGURE 7 G/S ratio effects observed in other databases collected from (a) Garg and Thompson (2), (b) Tian et al. (3).(continued)
10
9
8
7
6
5
Opt
imum
Moi
stur
e C
onte
nt ω
opt (
%)
Max
imum
Dry
Den
sity
γdm
ax (p
cf)
4
3
2
1
00.6 0.8
G/S1
134
132Moisture
Density
130
128
126
124
122
120
20
15
10
5
Perm
anen
t Str
ain
@ 1
,000
th L
oad
App
licat
ion
ε (%
)
Res
ilien
t Mod
ulus
MR (k
si)
00.6 0.8
G/S(a)
1
25CL-5sp
CL-4spCL-1Csp
PermanentStrain
ResilientModulus
20
15
10
5
0
7
6
5
Opt
imum
Moi
stur
e C
onte
nt ω
opt (
%)
Max
imum
Dry
Den
sity
γ dm
ax (g
/cm
3 )
4
3
2
1
00 1 32
G/S4
Limestone(density)
Sandstone(density)
Limestone(moisture)
Sandstone(moisture)
2.26
2.28
2.30
2.32
2.34
2.36
2.38
2.40
100
150
200
250
300
350
400
450
100
150
200
250
300
350
400
450
0 1 32G/S
(b)
4
Limestone(MR)
Sandstone(MR)
Limestone(Qu)
Sandstone(Qu)
Unc
onfin
ed C
ompr
essi
ve S
tren
gth
Qu (
kPa)
Res
ilien
t Mod
ulus
MR (M
Pa)
Xiao, Tutumluer, Qian, and Siekmeier 25
apparent modulus–strength relationship, which suggested incorpo-rating a limiting working shear stress to the strength ratio to avoid catastrophic shear failure in base and especially subbase courses.
Previous studies on soil–gravel and sand–gravel mixtures indi-cated that for large gravel (or coarse aggregate) concentrations, the friction resistance between gravel particles controls the shear strength behavior of mixtures, while at low gravel concentrations the friction resistance of sand and soil grains controls the shear strength behav-ior. By applying that observation to this study, the role of the gravel-to-sand ratio was interpreted, which explained the validity of the optimal gravel-to-sand ratio of 1.5 in this case. Additional aggregate databases collected from the literature also confirmed the existence of such an optimal gravel-to-sand ratio and the significant influence of the gravel-to-sand ratio gradation parameter. In light of these findings, current gradation specification bands, which may reject nonstandard base–subbase materials for use in cost-effective road con-structions, can be further revised and transferred to performance-based specifications in which the gravel-to-sand ratio, together with other important factors, can be used to utilize available aggregate sources to match the site-specific design traffic levels and operating environ-mental conditions for the sake of promoting sustainability. It is pos-tulated here that within the Minnesota DOT specified gradation bands, those with the same gravel-to-sand value of around 1.5 may exhibit similar shear strength behavior regardless of their maximum particle size, provided that other properties such as fines content, moisture and density conditions (AASHTO T99), and aggregate shape do not differ dramatically from one another.
Efforts are under way to understand the underlying mechanism of the gravel-to-sand ratio at a microscopic level, using an image-aided discrete element modeling approach well validated by the authors in railroad ballast studies (25, 26). The goal is to simulate aggregate shear strength tests with the capability to recreate the three-dimensional aggregate shapes as individual discrete elements (“polyhedrons or blocks”) based on the scanned images from the University of Illi-nois Aggregate Image Analyzer. In this way, optimum contact and packing arrangements from various gradations will be realistically studied for improved aggregate interlock. More aggregate material types and gradations will be helpful in terms of quantifying the effects
of the gravel-to-sand ratio on the mechanical behavior of aggregate base–granular subbase materials.
ACknowleDGMentS
The research findings reported here were completed as part of the Minnesota DOT H09PS07 research study, Best Value Granular Material for Road Foundations. The authors acknowledge the Min-nesota DOT Office of Materials and Road Research for support and for providing the required databases.
RefeRenCeS
1. Thompson, M. R., and K. L. Smith. Repeated Triaxial Characterization of Granular Bases. In Transportation Research Record 1278, TRB, National Research Council, Washington, D.C., 1990, pp. 7–17.
2. Garg, N., and M. R. Thompson. Triaxial Characterization of Minnesota Road Research Project Granular Materials. In Transportation Research Record 1577, TRB, National Research Council, Washington, D.C., 1997, pp. 27–36.
3. Tian, P., M. M., Zaman, and J. G., Laguros. Gradation and Moisture Effects on Resilient Moduli of Aggregate Bases. In Transportation Research Record 1619, TRB, National Research Council, Washington, D.C., 1998, pp. 75–84.
4. Bilodeau, J.-P., G. Dore, and P. Pierre. Pavement Base Unbound Granu-lar Materials Gradation Optimization. Proc., 8th International Confer-ence on the Bearing Capacity of Roads, Railways and Airfields, Vol. 1. Taylor & Francis Group, London, 2009, pp. 145–154.
5. Tutumluer, E., D. Mishra, and A. A. Butt. Characterization of Illinois Aggregate for Subgrade Replacement and Subbase. Technical Report FHWA-ICT-09-060. Illinois Center for Transportation, Urbana–Champaign, 2009, pp. 1–179.
6. Bilodeau, J.-P., G. Dore, and P. Pierre. Erosion Susceptibility of Granular Pavement Materials. International Journal of Pavement Engineering, Vol. 8, No. 1, 2007, pp. 55–66.
7. Bilodeau, J.-P., G. Dore, and P. Pierre. Gradation Influence on Frost Sus-ceptibility of Base Granular Materials. International Journal of Pavement Engineering, Vol. 9, No. 6, 2008, pp. 397–411.
8. Mulvaney, R., and B. Worel. MnROAD Cell 26 Forensic Investigation. Technical Report No. 2002-06. Minnesota Department of Transportation, Saint Paul, 2002.
(c)
12
10
Opt
imum
Moi
stur
e C
onte
nt ω
opt (
%)
Max
imum
Dry
Den
sity
γ dm
ax (p
cf)
8
6
4
2
01.3 1.4 1.61.5
G/S1.7
Limestone(density)
Dolomite(density)
Dolomite(moisture)
Gravel(density)
Limestone(moisture)
Gravel(moisture)
130
132
134
136
138
140
142
144
1.3 1.4 1.61.5G/S
1.7
Limestone(σdf)
Dolomite(σdf)
Dolomite(MR)
Gravel(σdf)
Limestone(MR)
Gravel(MR)
20
26
24
22
28
30
32
36
34
38
40
40
60
80
100
120
140
50
70
90
110
130
Res
ilien
t Mod
ulus
MR (k
si)
Peak
Dev
iato
r Str
ess
σdf
(psi
)
FIGURE 7 (continued) G/S ratio effects observed in other databases collected from (c) Tutumluer et al. (5).

26 Transportation Research Record 2267
9. Tao, M., M. Abu-Farsakh, and Z. Zhang. Optimize Drainable Unbound Aggregate Through Laboratory Tests. Proc., GeoCongress 2008: Char-acterization, Monitoring, and Modeling of Geosystems, ASCE, Reston, Va., 2008.
10. Bullen, F. Design and Construction of Low-Cost, Low-Volume Roads in Australia. In Transportation Research Record: Journal of the Trans-portation Research Board, No. 1819, Transportation Research Board of the National Academies, Washington, D.C., 2003, pp. 173–179.
11. Molenaar, A. A. A., and A. A. van Niekerk. Effects of Gradation, Com-position, and Degree of Compaction on the Mechanical Characteristics of Recycled Unbound Materials. In Transportation Research Record: Journal of the Transportation Research Board, No. 1787, Transportation Research Board of the National Academies, Washington, D.C., 2002, pp. 73–82.
12. Cunningham, C. N. Mechanical Response of Crushed Stone Mixtures. MS thesis. North Carolina State University, Raleigh, 2009.
13. Kim, S.-H., E. Tutumluer, D. N. Little, and N. Kim. Effect of Gradation on Nonlinear Stress-Dependent Behavior of a Sandy Flexible Pavement Subgrade. Journal of Transportation Engineering, Vol. 133, No. 10, 2007, pp. 582–589.
14. Talbot, A. N., and F. E. Richart. The Strength of Concrete and Its Relation to the Cement, Aggregate, and Water. Bulletin, No. 137, 1923, pp. 1–116.
15. Sánchez-Leal, F. J. Gradation Chart for Asphalt Mixes: Development. Journal of Materials in Civil Engineering, Vol. 19, No. 2, 2007, pp. 185–197.
16. Djamarani, K. M., and I. M. Clark. Characterization of Particle Size Based on Fine and Coarse Fractions. Powder Technology, Vol. 93, No. 2, 1997, pp. 101–108.
17. Vallejo, L. E. Interpretation of the Limits in Shear Strength in Binary Granular Mixtures. Canadian Geotechnical Journal, Vol. 38, 2001, pp. 1097–1104.
18. Vavrik, W. R., W. J. Pine, and S. H. Carpenter. Aggregate Blending for Asphalt Mix Design: Bailey Method. In Transportation Research Record: Journal of the Transportation Research Board, No. 1789, Transportation Research Board of the National Academies, Washington, D.C., 2002, pp. 146–153.
19. Tutumluer, E., and T. Pan. Aggregate Morphology Affecting Strength and Permanent Deformation Behavior of Unbound Aggregate Ma- terials. Journal of Materials in Civil Engineering, Vol. 20, No. 9, 2008, pp. 617–627.
20. Xiao, Y., E. Tutumluer, and J. Siekmeier. Resilient Modulus Behavior Estimated from Aggregate Source Properties. Proc., ASCE Geo-Frontiers 2011 Conference, Dallas, Tex., March 13–16, 2011.
21. Xiao, Y., E. Tutumluer, and J. Siekmeier. Mechanistic–Empirical Evalu-ation of Aggregate Base and Granular Subbase Quality Affecting Flexi-ble Pavement Performance in Minnesota. In Transportation Research Record: Journal of the Transportation Research Board, No. 2227, Trans-portation Research Board of the National Academies, Washington, D.C., 2011, pp. 97–106.
22. Lindly, J., J. T. Townsend, and A. Elsayed. How Top-Size Affects the Resilient Modulus of Roadway Base Materials. Engineering Journal of University of Qatar, Vol. 8, 1995, pp. 127–138.
23. Kim, W., and J. F. Labuz. Resilient Modulus and Strength of Base Course with Recycled Bituminous Material. Technical Report MN/RC-2007-05. Minnesota Department of Transportation, Saint Paul, 2007.
24. Gupta, S., A. Singh, and A. Ranaivoson. Moisture Retention Characteris-tics of Base and Sub-base Materials. Technical Report MN/RC-2005-06. Minnesota Department of Transportation, Saint Paul, 2005.
25. Tutumluer, E., H. Huang, Y. M. A. Hashash, and J. Ghaboussi. AREMA Gradations Affecting Ballast Performance Using Discrete Element Modeling (DEM) Approach. Proc., AREMA 2009 Annual Conference, Chicago, Ill., Sept. 20–23, 2009.
26. Yohannes, B., K. Hill, and L. Khazanovich. Mechanistic Modeling of Unbound Granular Materials. Technical Report MN/RC-2009-21. Minnesota Department of Transportation, Saint Paul, 2009.
The contents of this paper do not necessarily reflect the official views or policies of the Minnesota DOT. This paper does not constitute a standard, specification, or regulation.
The Geology and Properties of Earth Materials Section peer-reviewed this paper.