Embed Size (px)
Citation preview
BI Norwegian Business School - campus Oslo
GRA 19703Master Thesis
Thesis Master of Science
Effective email marketing: an empirical study of the impact of personalized communication on customer engagement and purchase decisions
Navn: Hanna Kiselova
Start: 15.01.2019 09.00
Finish: 01.07.2019 12.00
Hanna Kiselova
Master Thesis BI Norwegian Business School
Effective email marketing: an empirical study of
the impact of personalized communication on customer engagement and purchase decisions
Hand-in date: 01.07.2019
Campus: BI Oslo
Programme: Master of Science in Business with Major in Marketing
Supervisor: Auke Hunneman
“This thesis is a part of the MSc programme at BI Norwegian Business School. The school takes no responsibility for the methods used, results found and
conclusions drawn."
1010236GRA 19703
2
Acknowledgments
This thesis is the final project of my MSc degree in Business with a major
in Marketing. BI journey was both challenging and rewarding, and I am grateful for
all the unforgettable experiences, and, undoubtedly, for the broad knowledge and
competence which I gained during my studies.
The deepest gratitude goes to my supervisor, Auke Hunneman, for his
guidance, encouraging feedback, and support throughout the thesis writing process
as well as the expertise he shared through Marketing Research course. Huge thanks
go to Arnbjørn Marklund, my colleague and manager at Kahoot!, for his valuable
role in my career and significant input in this project. Finally, I would like to thank
my family, friends, and my significant other for their constant support and
motivation, which means the world to me.
1010236GRA 19703
3
Table of content SUMMARY ............................................................................................................ 4
1.0 INTRODUCTION ........................................................................................... 5
1.1 Research question .............................................................................................. 7
2.0 LITERATURE REVIEW ............................................................................... 7
2.1 Email marketing and its importance .................................................................. 7
2.2 Personalization of marketing communication ................................................... 9
2.3 Customer engagement ..................................................................................... 12
3.0 HYPOTHESES .............................................................................................. 14
4.0 METHODOLOGY ........................................................................................ 16
4.1 Study setting .................................................................................................... 16
4.2 Experimental design ........................................................................................ 18
4.3 Sample design and sample size ....................................................................... 19
4.4 Measurement of the outcome variables ........................................................... 20
4.5 Data collection ................................................................................................. 21
4.6 Statistical analysis ........................................................................................... 21
5.0 RESULTS ....................................................................................................... 23
5.1 Descriptive statistics ........................................................................................ 23
5.2 ANOVA and Kruskal-Wallis test for hypothesis 1 ......................................... 25
5.3 Logistic regression analysis for hypothesis 2 .................................................. 27
5.4 Logistic regression analysis for hypothesis 3 .................................................. 29
6.0 DISCUSSION AND CONCLUSIONS ........................................................ 30
6.1 Managerial implications .................................................................................. 32
7.0 LIMITATIONS AND FUTURE RESEARCH ........................................... 32
8.0 REFERENCES .............................................................................................. 34
9.0 APPENDICES ............................................................................................... 40
Appendix 1: Email campaign personalized based on customer behavior ............. 40
Appendix 2: Non-personalized email campaign ................................................... 41
1010236GRA 19703
4
Summary
This study investigates the impact of behavior-based personalization on
customer engagement and purchase behavior in the context of email marketing. For
this purpose, the author reviews and combines the following research streams in the
literature: email marketing, personalization of marketing communication, and
customer engagement.
To answer the research question at hand, the author designs a field study in
collaboration with Kahoot! AS, a fast-growing Norwegian start-up company
operating in the education technology industry. Kahoot!’s game-based learning and
trivia platform is used in multiple settings – school and university classrooms,
business training and presentations, social, cultural, and other events (retrieved
from kahoot.com). By leveraging marketing automation technology, which
Kahoot! uses for the email campaigns’ creation and management, the author sets
up and runs the experiment. Findings of the study provide marketing managers with
useful insights on the effectiveness of behavior-based personalization in the email
marketing context as well as contribute to the ongoing academic discussion about
personalized marketing communication and customer engagement.
The results reveal that email communication has a significant positive effect
on customer engagement irrespective of behavior-based personalization. This
proves that email is an effective marketing communication channel, and it should,
therefore, remain a key part of the digital media mix used by marketers. However,
based on the lack of a significant difference in the effectiveness of personalized and
non-personalized email campaigns, the author recommends focusing more on high-
quality generic content and the design of the email messages. Furthermore,
consistent with the viewpoints of researchers in the field, the study confirms that
customer engagement is a significant predictor of customer purchases, leading to
the conclusion that firms should invest in customer engagement marketing
initiatives to ultimately achieve better firm performance.
1010236GRA 19703
5
1.0 Introduction
With an explosion of new digital technologies, consumers have become
more empowered than ever before. They are highly demanding and selective in
what information they pay attention to (Harvard Business Review, 2018). To create
compelling and relevant interactions for their customers, companies are widely
using personalization (Chaffey & Ellis-Chadwick, 2016).
Both scholars and practitioners acknowledge the power of personalization.
Academic research highlights that the latter ultimately leads to superior value for
customers and, as a result, an increase in customer loyalty (Simonson, 2005), long-
term profitability and strengthening of companies’ competitive positions (Bleier,
Keiser, & Verleye, 2018; Kumar & Pansari, 2016). At the same time, 98% of
marketing managers acknowledge that personalization advances customer
relationships, while 87% specify that personalization campaigns can significantly
enhance business results (Researchscope International, 2018).
The role of personalization in the email marketing context deserves special
attention. Today, email is viewed as a key part of an effective digital media mix
(Hanna, Swain, & Smith, 2015; Chaffey & Ellis-Chadwick, 2016). It remains “the
most pervasive communication tool used by almost everyone, every day, throughout
the day” (Hanna et al., 2015, p.3). According to Statista (2019), there are 3.8 billion
email users worldwide, and this number is going to increase up to 4.6 billion users
in 2022. Importantly, email marketing plays a significant role in the development
of an online marketing communication strategy, which constitutes an integral part
of online customer experience management (Chaffey & Ellis-Chadwick, 2016).
This being said, marketers can considerably increase the quality of overall online
customer experience by building an effective email communication strategy. On the
other hand, the acceptance and performance of even desired emails have been
recently compromised by the growing amount of spam, i.e., intrusive unsolicited
commercial email, which leads to information overload (Hartemo, 2016; Pavlov,
Melville, & Plice, 2008). Due to spam, which knowledge workers sift through every
day, useful email messages are lost in the “background noise” and, therefore, it is
difficult for legitimate marketers to make their email messages stand out in the
customers’ email inboxes (Pavlov et al., 2008, p.1191). Hence, we consider
studying ways to achieve higher email marketing efficiency a particularly relevant
research direction. Here, personalization initiatives are of critical importance.
1010236GRA 19703
6
One of the most popular methods used by email marketers to personalize
email communication is to add consumer-specific information (e.g., customers’
names) to the headline or the content of the email (Sahni, Wheeler, & Chintagunta,
2018; Wattal, Telang, Mukhopadhyay, & Boatwright, 2012). However, such a basic
form of personalization is no longer sufficient to engage customers (Chaffey &
Ellis-Chadwick, 2016). According to the American Marketing Association,
effective personalization relies on behavioral data rather than demographic data
(Markelz, 2018). “It’s not about tailoring content. It’s about triggering a single e-
mail to a single person at a moment in time” (Markelz, 2018). In other words,
effective personalized communication implies the delivery of timely and highly
relevant messages to each customer. Today, this is possible due to such
technological advances as marketing automation software (Strauss, Frost, & Sinha,
2014; Chaffey & Ellis-Chadwick, 2016; Hanna et al., 2015). By leveraging
marketing automation technology, email marketers can automatically trigger
relevant messages for every customer based on their behavior, aiming to elicit
positive customer responses. For instance, after a shopper abandons a shopping cart,
online retailers frequently send a series of follow-up emails to encourage the
customer to make the purchase (Osborne, 2017).
As a result of such personalized communication, companies may
considerably improve their business results: according to Forbes, 60% of Netflix
subscriptions are attributed to personalized messages based on a customer’s
previous viewing behavior, and 35% of Amazon’s sales are possible due to
individual suggestions of products based on customers’ unique behaviors and
purchases (Osborne, 2017). Remarkably, academic research has not previously
studied the effectiveness of personalization based on customer behavior in the email
marketing context.
The main interest of the following study is to empirically test if behavior-
based personalization improves the results of the email communication by
examining not only its impact on such outcome variable as customer purchasing
behavior but also investigating why personalized email communication may
influence customer purchase decisions. Hence, the following study introduces
customer engagement that we assume is a mechanism through which marketing
communication affects subsequent customer purchasing behavior. While
developing the research framework of the paper, we support our assumptions with
the theory on perceived relevance associated with the personalization, and the
1010236GRA 19703
7
theory on perceived value associated with the engagement. To the best of our
knowledge, there is no previous research which investigated the relationships
between the defined constructs.
1.1 Research question
The current research proposal focuses on the question of the effectiveness
of personalized communication based on customer behavior and aims to investigate
if such communication has an effect on customer engagement and subsequent
customer purchases.
To answer the research question at hand, we decided to conduct a field
experiment. For that, we partnered with Kahoot! AS, a fast-growing Norwegian
start-up company operating in the education technology industry. Kahoot!’s game-
based learning and trivia platform is used in multiple settings – school and
university classrooms, business training and presentations, social, cultural, and
other events (retrieved from kahoot.com). We leveraged Kahoot! marketing
automation technology to set up and run the experiment. Findings of the study
provide marketing managers with useful insights on the effectiveness of behavior-
based personalization in the email marketing context as well as email marketing
effectiveness in general.
2.0 Literature review 2.1 Email marketing and its importance
To date, email remains a cornerstone of the digital media mix (Hanna et al.,
2015; Chaffey & Ellis-Chadwick, 2016). It is “the most pervasive communication
tool used by almost everyone, every day, throughout the day” (Hanna et al., 2015,
p.3) with 3.8 billion email users worldwide, predicted to increase up to 4.6 billion
users in 2022 (Statista, 2019).
While being substantially less expensive compared to other communication
tools (Hanna et al., 2015; Chaffey & Ellis-Chadwick, 2016), email is highly
profitable (Hartemo, 2016; Pavlov et al., 2008). According to Direct Marketing
Association and Demand Metric, email has a 122% return on investment, which is
1010236GRA 19703
8
more than four times higher than other communication channels like social media,
direct mail and paid search (eMarketer, 2016).
One of the key advantages of email is that it allows for interactive one-to-
one communication with customers (Hanna et al., 2015; Zhang, Kumar, &
Cosguner, 2017), which encourages immediate action. For instance, customers can
respond to email at the moment they receive it (or later) by clicking through to the
sender firm’s website (Zhang et al., 2017; Chaffey & Ellis-Chadwick, 2016).
Email marketing captured our academic interest since it plays a significant
role in the development of online marketing communication strategy, which
constitutes an integral part of online customer experience management. By building
up the right email communication, marketers can significantly increase the quality
of the online customer experience (Chaffey & Ellis-Chadwick, 2016). In general,
creating a strong online customer experience is critical to creating a competitive
advantage for businesses (Novak, Hoffman, & Yung, 2000; Lemon & Verhoef,
2016). “The increasing focus on customer experience arises because customers
now interact with firms through a myriad of touch points in multiple channels and
media, resulting in more complex customer journeys.” (Lemon & Verhoef, 2016,
p. 69).
The “right” email communication strategy primarily means that it must
deliver timely and relevant messages to each customer (Chaffey & Ellis-Chadwick,
2016). Today, this is possible due to such technological advances as marketing
automation software (Strauss et al., 2014; Chaffey & Ellis-Chadwick, 2016; Hanna
et al., 2015). According to Chaffey & Ellis-Chadwick (2016), marketing
automation is “currently used to describe a closely related approach known as one-
to-one marketing” (p.300). With the help of marketing automation technology,
marketers can track the behavior of each customer in real time and based on the
behavioral data build up communication so that each customer gets highly
personalized communication experience with the company. According to the study
conducted by HBR Analytic Services (2018) as cited in Harvard Business Review
(2018), nine out of ten business executives say their customers now expect them to
know and anticipate their needs, and eight out of ten executives state that
personalization of customer experiences is an important part of their organization’s
strategy.
1010236GRA 19703
9
In the following section, we are going to review the literature on the
personalization of marketing communication to understand what was done in the
previous research and identify the gap in the literature that this research fills.
2.2 Personalization of marketing communication
Contemporary technologies enable companies to collect a variety of
individual-level data and then use it to develop personalized online experiences so
that they are more aligned with an individual customer’s needs, preferences, and
interests (Chaffey & Ellis-Chadwick, 2016; Simonson, 2005).
Scholarly research highlights that personalization leads to superior value for
customers and, as a result, an increase in customer loyalty (Simonson, 2005), long-
term profitability and strengthening of companies’ competitive positions (Bleier et
al., 2018; Kumar & Pansari, 2016).
Harvard Business Review (2018, p.1) further emphasizes the role of
personalization for businesses: “As the digital age offers new ways to fight for
customer mindshare and dollars, consumer-facing organizations are responding
with new efforts to personalize the customer experience – and reaping big rewards
in the process.” Indeed, 98% of marketing managers acknowledge that
personalization advances customer relationships, while 87% specify that
personalization campaigns can significantly enhance business results
(Researchscope International, 2018).
Overall, personalization is one of the forms of one-to-one marketing, which
involves tailoring a firm’s marketing mix to the individual customer. The term
“personalization” is often used interchangeably with customization; however, these
are two different forms of one-to-one marketing (Arora et al., 2008). While
customization means customers themselves actively adapt the marketing mix to
their needs and preferences, personalization implies that it is the company which
determines the optimal marketing mix for each customer (Bleier et al., 2018; Arora
et al., 2008).
The following research focuses on personalization of marketing
communication based on customer behavior. Bleier et al. (2018) define
personalized marketing communication as tailored messages in which content is
based on inferred personal interests, experiences, and past customer behaviors. Tam
1010236GRA 19703
10
& Ho (2005) see personalization as the delivery of “the right content in the right
format to the right person at the right time” (p.271). Taking into account both
viewpoints, we define behavior-based personalization of marketing communication
as the delivery of the timely messages with tailored content for each customer based
on their behavior.
Research to date has widely examined the effectiveness of different forms
of personalization of marketing communication with a vast majority of studies
conducted in the context of the online banner advertisement.
Scholars, for instance, empirically tested how personalization based on
individual browsing history in the online banner ads influences subsequent
customer responses (Lambrecht & Tucker, 2013; Bleier & Eisenbeiss, 2015). In
particular, Lambrecht & Tucker (2013) investigated how ads retargeting influences
customer purchases using field experiment data from an online travel firm; the
authors found that brand-level ads (generic retargeting) are overall more effective
than personalized ads (dynamic retargeting), i.e., advertisement of the specific
products the consumer previously viewed on the firm’s website. However, the
effectiveness of dynamic retargeting increases when customers are getting highly
involved in the advertised category. These findings were reinforced by Bleier &
Eisenbeiss (2015), who made a distinction between the low, medium, and high level
of ad personalization and tested how those degrees influence advertisement
effectiveness. Authors found evidence that a medium degree of personalization
increases retargeting effectiveness, while when the advertisement very closely
reflects previous customer’s preferences, it loses its effectiveness due to the effect
of overpersonalization.
Apart from personalization based on the individual browsing history,
researchers also tested the effectiveness of banner ads’ personalization based on
observable consumer characteristics (or customer-related information). For
instance, Tucker (2014) investigated whether embedding personal information
posted by users on social media (e.g., educational affiliation or preferred celebrity)
into advertising content influenced advertisement effectiveness (click-through
rates) and found a positive effect. However, Van Doorn & Hoekstra (2013) found
that using personal information (e.g., personal identification and information about
customers’ transactions) in the banner advertisement has a negative influence on
customers’ purchase intentions.
1010236GRA 19703
11
There have been several studies in the context of online banner
advertisement which examined whether matching the ads to the website content
leads to better behavioral outcomes. For instance, Goldfarb & Tucker (2011) tested
if matching the advertisement content to the website content enhances customer
purchase intentions and found a significant positive effect. However, this effect
diminishes with the ad’s obtrusiveness. Similarly, researchers have found a positive
effect of banner ads – website content congruence on attitudes towards the ads
(Moore, Stammerjohan, & Coulter, 2005; Shamdasani, Stanaland, & Tan, 2001);
however, if the advertised product is low-involvement, the website content has a
very low impact (Shamdasani et al., 2001).
In the context of email communication, a few studies showed that the
effectiveness of email communication changes with the change of content. For
instance, Sudhir, Roy, & Cherian (2016) conducted a field experiment together with
a charity organization and found that monthly framing of the donation and inclusion
of the story of an in-group member has a positive effect on raised donations.
Several studies looked at the effects of embedding personal information in
the email content, and they yielded mixed findings. Sahni et al. (2018) empirically
tested how embedding the recipient’s name in emails influences sales’ leads
generation and unsubscription rates and found a significant positive effect, which
can be explained by the fact that personal information orients attention, it may serve
as a positive cue for the receiver, and may increase elaboration. At the same time,
Wattal et al. (2012) studied whether mentioning recipient’s name influences such
email responses as email opens, unsubscription, click-through, and purchases, and
they found that consumers respond negatively to the email when it includes a
personal greeting. Such an effect can be explained by an increase in consumers’
privacy concerns. However, this effect is moderated by the familiarity of the
consumer with the firm. Similarly, White, Zahay, Thorbjørnsen, & Shavitt (2008)
studied the effectiveness of the inclusion of personal information in the email
content and found that a high level of email personalization may lead to lower click-
through intentions due to the effect of personalization reactance, especially when
the use of personal information is not justified by the firm.
From the above discussion, we can observe that there is no previous research
which studied the effectiveness of personalization based on behavior in the context
of emailing. Research on email personalization is currently limited to a few studies,
which investigated whether the inclusion of customer-related information is an
1010236GRA 19703
12
effective personalization method. In the current research, we aim to investigate if
behavior-based personalization is effective in the context of email marketing. In
particular, we are going to test if personalized communication significantly affects
customer engagement as well as if customer engagement can serve as a mediator
between personalized communication and customer purchase behavior.
2.3 Customer engagement
To ensure growth, firms must focus on their customers. However, satisfying
customers only with the right product or service is not enough: companies must
encourage customer engagement (Kumar & Pansari, 2016).
Acknowledged as one of the top research priorities by Marketing Science
Institute (2018), customer engagement is gaining increased attention of academic
researchers. Scholars see customer engagement as a new research stream within
customer relationship management (Verhoef, Reinartz, & Kraft, 2010; Vivek,
Beatty, & Morgan, 2012).
Overall, the notion of engagement has been used in various academic
disciplines, such as social and political science, organization behavior, etc. (Brodie,
Hollebeek, Jurić, & Ilić, 2011). In marketing, engagement has been recently
discussed as an activity of the customer towards the firm (Kumar et al., 2010; Vivek
et al., 2012; Brodie et al., 2011).
Scholars discuss the multidimensional nature of customer engagement
(Brodie et al.,2011; Patterson, Yu, & De Ruyter, 2006; Hollebeek, 2011). More
precisely, research to date sees customer engagement (CE) as a concept which
comprises of cognitive, emotional, and behavioral dimensions. Brodie et al. (2011)
define CE as the following:
A psychological state that occurs by virtue of interactive, co-creative
customer experiences with a focal agent/object (e.g., a brand) in focal
service relationships. It occurs under a specific set of context-dependent
conditions generating differing CE levels; and exists as a dynamic, iterative
process within service relationships that co-create value. CE plays a central
role in a nomological network governing service relationships in which
other relational concepts (e.g., involvement, loyalty) are antecedents and/or
1010236GRA 19703
13
consequences in iterative CE processes. It is a multidimensional concept
subject to a context- and/or stakeholder-specific expression of relevant
cognitive, emotional and/or behavioral dimensions.
The behavioral dimension is of the greatest interest among existing research.
For instance, Kumar et al. (2010), Vivek et al. (2012), Van Doorn et al. (2010),
Verhoef et al. (2010), Harmeling, Moffett, Arnold, & Carlson (2017), Calder,
Malthouse, & Schaedel (2009) view engagement predominantly from a behavioral
perspective. According to Kumar et al. (2010), customer engagement implies both
transactional (i.e., purchase) and non-transactional interactions between a customer
and a firm. At the same time, Vivek et al. (2012), Van Doorn et al. (2010), Verhoef
et al. (2010), Harmeling et al. (2017) argue that customer engagement is non-
transactional customer behavior.
Vivek et al. (2012) posit that CE is an expanded domain of the relationship
marketing and define it as “an intensity of individual participation in and connection
with an organization’s offerings and/or organizational activities which either the
customer or the company initiates” (p. 133). Further, Van Doorn et al. (2010) state
that customer engagement is behavior beyond transactions, and it can be defined as
“a customer’s behavioral manifestations that have a brand or firm focus, beyond
purchase, resulting from motivational drivers” (p.253). Similarly, Verhoef et al.
(2010) and Harmeling et al. (2017) see customer engagement as non-transactional
customer behavior. Conceptualizing customer engagement as a construct capturing
the behavior outside the core transaction makes it clearly distinguished from such
concepts as behavioral loyalty and other transaction-focused behaviors (Harmeling
et al., 2017). Thus, in line with Vivek et al. (2012), Van Doorn et al. (2010), Verhoef
et al. (2010), and Harmeling et al. (2017) we will focus on CE as a behavioral
manifestation of customers towards the firm beyond the purchase.
Extant literature suggests that higher customer engagement leads to higher
customer lifetime value and, as a result, better firm performance (Kumar et al.,
2010; Verhoef et al., 2010; Harmeling et al., 2017). Researchers also highlight that
ignoring engagement may create lost opportunities for the firm (Verhoef et al.,
2010) and/or may lead to the wrong customer valuation (Kumar et al., 2010).
Drawing on a conceptual framework of customer engagement by Van Doorn
et al. (2010), customer engagement influences firms on six levels: financial,
reputational, regulatory, competitive, employee, and product. With regards to the
1010236GRA 19703
14
consequences of engagement for individual customers, customer engagement leads
to cognitive, attitudinal, and behavioral customer responses (Van Doorn et al.,
2010). In the following paper, we are focusing on the behavioral outcomes of
customer engagement: we will examine whether it has a significant positive effect
on customer purchase behavior. We consider purchase behavior the most relevant
customer response to focus on since the latter predetermines customer lifetime
value (Kumar et al., 2010; Rust, Lemon, & Zeithaml, 2000), customer equity and,
hence, overall business performance (Rust et al., 2000).
3.0 Hypotheses
In this section, the hypotheses and the conceptual framework of the paper
are developed.
This research focuses on behavior-based personalization of marketing
communication that refers to the delivery of the timely messages with tailored
content for each customer based on their behaviors (Bleier et al., 2018; Tam & Ho,
2005). In line with Bleier et al. (2018), we assume that personalized marketing
communication can foster customer engagement. The reasoning behind this
statement is based on the assumption that personalization increases the relevance
of marketing communication (Sahni et al., 2018; Tam & Ho, 2005; Hawkins,
Kreuter, Resnicow, Fishbein, & Dijkstra, 2008), which means that the message at
hand is linked to oneself. The linkage to the self increases personal involvement
with communication (Sahni et al., 2018). In other words, when the communication
is more “for you,” the recipient of the message perceives it as more relevant and
meaningful (Hawkins et al., 2008). Tam & Ho (2005) use the term “preference
matching”, defined as the level to which the content generated by personalization
agent appeals to users, and state that “if a personalization agent can generate
content that matches the taste and preference of a user, the user is most likely to
process the content (e.g., personalized offers) to a larger extent before arriving at
a decision (e.g., accept the offers)” (p. 276). Accordingly, if the marketing
communication takes into account customer behavior, it should be perceived as
more relevant by the receiver; thus, customers are more likely to respond to
personalized than non-personalized communication. Based on written above, we
hypothesize:
1010236GRA 19703
15
Hypothesis 1. Personalized communication based on customer behavior has
a direct positive effect on customer engagement.
As discussed earlier, we defined customer engagement as a non-
transactional behavioral manifestation of customers towards the firm (Vivek et al.,
2012; Van Doorn et al., 2010; Verhoef et al., 2010; Harmeling et al., 2017).
According to Van Doorn et al. (2010), such manifestations towards the firm
lead to cognitive, attitudinal, and, most importantly, behavioral outcomes for the
engaged customers. Similarly, Lemon & Verhoef (2016) state that customer
engagement, which the authors see as “the extent to which the customer reaches
out or initiates contact with the firm either attitudinally or behaviorally” (p.74),
results in various behavioral responses on the part of the customer.
Extant literature acknowledges customer purchases as one of the ultimate
behavioral outcomes of customer engagement (Van Doorn et al., 2010; Kumar et
al., 2010; Kumar & Pansari, 2016).
The connection between customer engagement and customer purchase
behavior can be explained as follows. As a consequence of being more engaged,
customers derive more value from their experience with a firm or a brand.
According to Zeithaml (1988), the value can be defined as the quality one gets for
the price paid. The value is shown as a direct consequence of customer engagement
in the conceptual framework of CE by Vivek et al. (2012). The author states that
“greater engagement is positively associated with perceptions of greater value
received” (p. 134). At the same time, when customers have higher value
perceptions of the product or brand, they are more willing to purchase from the
company (Zeithaml, 1988; Dodds, Monroe, & Grewal, 1991; Patterson & Spreng,
1997). The above discussion leads us to the following hypothesis:
Hypothesis 2. Customer engagement has a direct positive effect on customer
purchase behavior.
Consequently, we assume that highly relevant communications make
customers more willing to engage with a firm or a brand; the more they are engaged,
the stronger value perceptions they form and, as a result, the higher is their
willingness to purchase. Based on written above, we hypothesize that customer
1010236GRA 19703
16
engagement can serve as a mediator between personalized communication based
on customer behavior and customer purchase behavior.
Hypothesis 3. Customer engagement mediates the relationship between
personalized communication based on customer behavior and customer purchase
behavior.
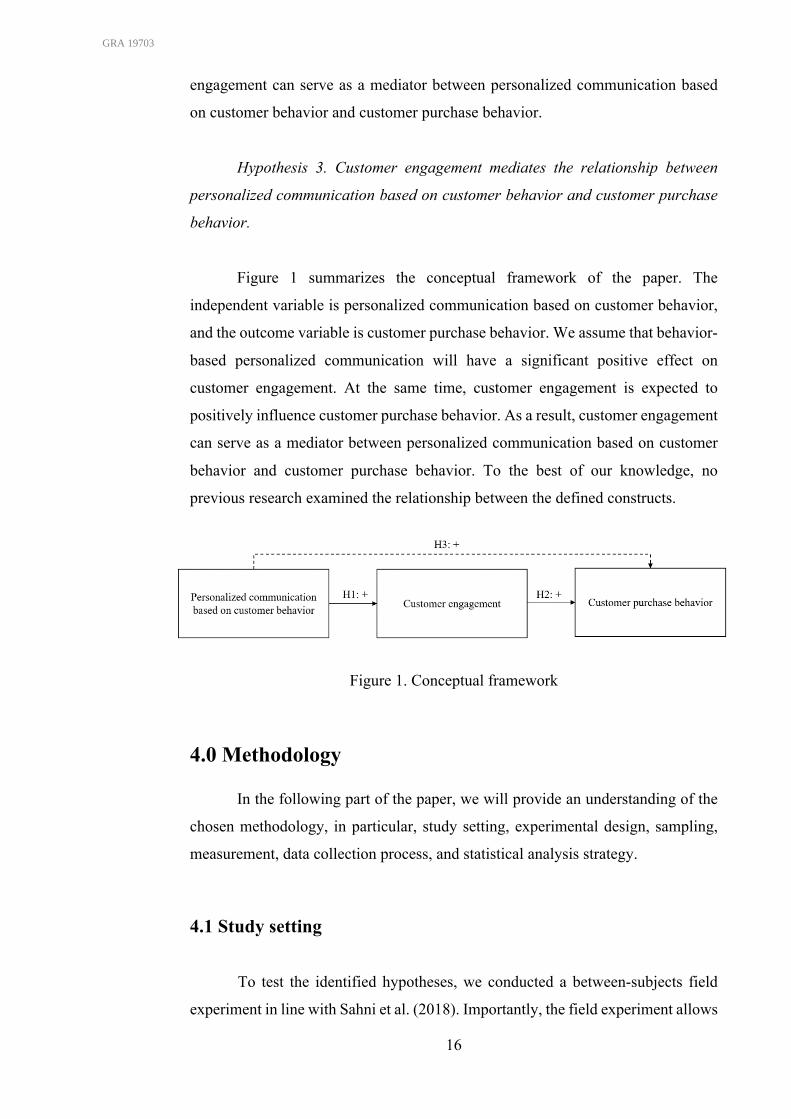
Figure 1 summarizes the conceptual framework of the paper. The
independent variable is personalized communication based on customer behavior,
and the outcome variable is customer purchase behavior. We assume that behavior-
based personalized communication will have a significant positive effect on
customer engagement. At the same time, customer engagement is expected to
positively influence customer purchase behavior. As a result, customer engagement
can serve as a mediator between personalized communication based on customer
behavior and customer purchase behavior. To the best of our knowledge, no
previous research examined the relationship between the defined constructs.
Figure 1. Conceptual framework
4.0 Methodology
In the following part of the paper, we will provide an understanding of the
chosen methodology, in particular, study setting, experimental design, sampling,
measurement, data collection process, and statistical analysis strategy.
4.1 Study setting To test the identified hypotheses, we conducted a between-subjects field
experiment in line with Sahni et al. (2018). Importantly, the field experiment allows
1010236GRA 19703
17
testing the hypotheses in a real-life setup. Despite a relatively low level of control
in comparison with a laboratory setting (Malhotra, 2010), the results of the field
study reflect actual consumer behavior. By conducting a field experiment, we also
ensured a high level of ecological validity, which means that the results of the study
are generalizable.
To perform the experiment, we partnered with Kahoot! AS. Kahoot!’s
platform enables users to create, share, and play different types of quizzes. The
audience can join the game on the presentation screen using their mobile devices
(retrieved from kahoot.com). As of the end of 2018, Kahoot! reached 13 million
unique users with registered accounts (Kahoot! Press Kit, 2019). Kahoot! games
have been played in all countries in the world. Over 60 million games were created
on the platform and played by 2 billion non-unique players cumulatively since its
launch in 2013 with 1 billion users in 2018 alone (Kahoot! Press Kit, 2019). Most
of Kahoot! customers (60%) are based in the United States (retrieved from
kahoot.com).
While signing up, each user chooses whether they want to use Kahoot! as a
teacher, as a student, socially, or at work (for business purposes). Based on that
information, Kahoot! segments their users into four groups: educators (school and
university teachers, administration of educational institutions), students, social
users (i.e., those who use Kahoot! during various cultural and social events), and
business users. The main segments are teachers and students. With that said, 50%
of teachers in the US use Kahoot! during a school year, and more than 50% of K-
12 students play Kahoot! every month (Kahoot! Press Kit, 2019).
From a marketing perspective, one of the critical managerial goals for
Kahoot! is to create a compelling customer experience for its users. Although the
greatest attention is given to the development of new product features, Kahoot!
extensively focuses on the delivery of customer experience through effective email
communication. For that, the company is adopting marketing automation
technology. With the use of marketing automation Kahoot! can track the user
behavior on the platform in real time and based on the behavioral data create highly
personalized email campaigns to best address the needs and preferences of each
customer. We leveraged Kahoot! marketing automation technology to run the
experiment. The design of the experiment is described in the next section.
1010236GRA 19703
18
4.2 Experimental design
The aim of this study is to test the effectiveness of behavior-based
personalized communication in the context of email marketing. For that, we are
working with the “Onboarding” email campaign, designed for the main Kahoot!
user segment – teachers. This email campaign represents a series of welcoming or
“onboarding” emails, and it is aiming to familiarize new users with Kahoot! as a
service, its features, benefits and, as a result, activate users on Kahoot! platform.
The campaign starts being sent to newcomers immediately after they sign up. It
includes a welcoming email, emails with tips on how to create Kahoot! game, host
(play) Kahoot! game in the classroom and assign it as homework, an email with an
invitation to join Kahoot! Certified, which is a free personal development program
for teachers.
In order to check the effect of the behavior-based personalization on
engagement and purchase behavior, we introduced three experimental groups. The
treatment group (1) received the “Onboarding” email campaign, which was
personalized based on customer behavior (see appendix 1). All the emails received
by users from the treatment group were trigger-based, which means that each email
was sent based on specific user activities on the Kahoot! platform. In one minute
after a user created an account, marketing automation software checks if the user
gave consent to receive emails from the company (as only those who gave the
consent can receive emails). Immediately after that, the user gets the first email –
“Welcome to Kahoot!”. In two days after the previous email, marketing automation
software checks if the user played and/or created the game. If the user created the
game but did not host it, they receive an email with the tips on how to host the game
(“Play Kahoot!”). If the user hosted an existing game but did not create their own,
they receive an email with the tips on how to create the game (“Create Kahoot!”).
If the user neither created nor hosted (played) the game, they receive an email with
the tips on how to create and host (play) the game (“Create & Play Kahoot!”). If the
user created and hosted the game, they do not receive any emails regarding game
creation or hosting. In five days after the previous query, the software checks if the
user assigned Kahoot! game as a homework (challenge). If no, then the user gets an
email with the tips on how to use Kahoot! for homework (“Kahoot! Challenge”). In
three days after the last query, the software checks if the user participated in
Kahoot! Certified. If no, they get an invitation and, later, a reminder in case the user
1010236GRA 19703
19
did not participate in Kahoot! Certified before the query. Otherwise, the invitation
is not sent. As a result, each user in the treatment group receives timely emails with
only relevant information about Kahoot! offerings.
The next group (2) of customers received “Onboarding for teachers” email
campaign, which was not personalized based on customer behavior (see appendix
2). With that said, users received the following flow of emails regardless of their
activity on the Kahoot! platform: “Welcome to Kahoot” in one minute after
registration, “Create Kahoot!” in two days after the previous email, “Play Kahoot”
in five days after the last email, “Create Challenge” in three days after the last email,
“Join Kahoot! Certified” in nine days after the last email. The number and the
content of emails are the same for every user in this group.
In order to eliminate procedural confound the design and description of the
offerings (e.g., description of creation functionality or challenge functionality) used
in emails, which the treatment group and the first control group of customers
received, were the same. For both personalized and non-personalized campaign, the
copy was created by a professional copywriter and the visual components of the
emails – by a professional designer.
The last group (0) of customers did not receive the “Onboarding for
teachers” email campaign. This control group was introduced with the purpose of
testing if email communication irrespective of personalization affects customer
engagement and purchase behavior.
The experiment ran for 3 months, starting from December 2018 until
February 2019. This way, we avoided a threat to internal validity, which could have
occurred due to seasonality issue (e.g., Kahoot! users are considerably less engaged
during holidays). Importantly, we tracked the behavior of each customer over the
same time period; mainly, the observation period for each user was restricted to 30
days after the sign-up date.
4.3 Sample design and sample size
As previously stated, the experiment was based on the “Onboarding” email
campaign created for school and university teachers, who use Kahoot! service for
formative assessment and homework. The majority of users (60%) are located in
the U.S. (retrieved from kahoot.com). Throughout the field experiment, we
1010236GRA 19703
20
collected the data on 4350 users, 1450 subjects in each group. To avoid
experimental confounds, we assigned subjects randomly to each of the experimental
conditions.
4.4 Measurement of the outcome variables
Within academia, there is no one established way of measuring customer
engagement, primarily because the methodology highly depends on the context of
the study, availability of the resources and whether the researchers investigate
cognitive, emotional, or behavioral dimension of engagement. With that said,
Lehmann, Lalmas, Yom-Tov, & Dupret (2012) suggest that the measurement of
engagement can be conducted in three ways: self-reported engagement, for which
questionnaires and interviews are used; cognitive engagement, for which task-based
methods and physiological measures are used; and online behavior metrics that
accesses the depth of customer engagement with the help of web analytics. In the
following study, we used online behavior metrics since the focus of the author is on
the behavioral dimension of customer engagement.
In their study on user engagement, Lehmann et al. (2012) state that “we
should not speak of one main approach to measure user engagement – e.g., through
one fixed set of metrics – because engagement depends on the online services at
hand” (p.1) and further highlight that engagement consists of different
characteristics depending on the web platform of interest. Engagement metrics
includes but is not limited to click-through rates, number of page views, time spend
on a site, return rate, number of users. Importantly, the engagement metrics should
reflect the following: the higher and the more frequent is the usage, the more
engaged the user is (Lehmann et al., 2012).
Taking into account the nature of Kahoot! service, we decided to focus on
such engagement metrics as the number of created Kahoot! games, the number of
hosted (played) Kahoot! games, and the number of assigned Kahoot! challenges.
We decided not to take into consideration participation in Kahoot! Certified since
the participants of Kahoot! Certified are initially much more active with regard to
game creation and hosting, so participation in Kahoot! Certified reflects the
behavior of just a small fraction of the users.
Drawing on the business model of Kahoot!, which implies that customers
can either use the service for free or upgrade to the paid plan to get additional
1010236GRA 19703
21
features, we were able to capture purchase behavior of each customer with the
dummy variable (purchase or non-purchase).
4.5 Data collection
In order to form the dataset with all identified engagement variables and
purchase behavior variable, first, we retrieved three lists of unique user IDs for each
experimental group after the experiment was finished. We also obtained the dates
when each user signed up. With regards to the treatment and first control group, the
date of sign-up was the date when the users started to get personalized and non-
personalized “Onboarding” email campaigns, respectively.
With the help of the list of unique user IDs, we were able to obtain
information on the number of created games, number of hosted games, number of
assigned challenges, and purchase behavior of each subject. Importantly, we made
sure that the observation period was restricted to 30 days after the sign-up date so
that the behavior of each subject was tracked over the same time period. This way,
we were able to eliminate procedural confound.
4.6 Statistical analysis
To analyze the data, we used SPSS or Statistical Package for Social Science.
To test the first hypothesis about the positive effect of behavior-based personalized
communication on customer engagement, we used ANOVA, “a statistical technique
for examining the differences among means for two or more populations”
(Malhotra, 2010, p. 531). In particular, we compared the means of the number of
created Kahoot! games, the number of hosted Kahoot! games, and the number of
assigned Kahoot! challenges across three experimental conditions described in the
experimental design section: personalized communication vs. non-personalized
communication vs. no communication. This method was the most appropriate
statistical technique to test the first hypothesis since we wanted to establish the
relationship between the categorical independent variable and metric dependent
variables (Malhotra, 2010). Although ANOVA is overall robust to violations of its
underlying assumptions, after we found non-normality of residuals of the DVs
(based on Kolmogorov-Smirnov test), we also decided to perform Kruskal-Wallis
1010236GRA 19703
22
test, which is a non-parametric equivalent of ANOVA that does not require
normality of residuals.
To test the second hypothesis about the positive effect of engagement on
customer purchase behavior, we used binary logit model or binomial logistic
regression, which estimates the probability of an observation belonging to a
specific group (Malhotra, 2010). Binomial logistic regression analysis was the most
appropriate method for investigation of the relationships between engagement
variables and purchase behavior since we wanted to explain a binary dependent
variable (purchase/non-purchase) in terms of several metric independent variables.
For the test of the third hypothesis about the mediation effect of customer
engagement, we followed a widely used methodology suggested by Judd & Kenny
(1981) and Baron & Kenny (1986).
Researchers state that in order to establish mediation, the following
conditions must hold: the treatment must significantly affect the outcome variable,
the treatment must also significantly affect the mediator and the mediator must
affect the outcome variable. If these conditions hold, further mediation analysis
should be performed. Authors recommend running a series of regression models:
regressing the mediator upon the independent variable, then regressing the
dependent variable upon the independent variable, and lastly, regressing the
dependent variable upon both the independent variable and upon the mediator
(Baron & Kenny, 1986). In the following research, the outcome variable is a dummy
variable (purchase/non-purchase); thus, we performed logistic regression analysis
following the next steps:
• First, the relationship between the treatment and the outcome
variable should be checked by running simple logistic regression:
𝑃𝑢𝑟𝑐ℎ𝑎𝑠𝑒 = 𝛽, + 𝛽./ ∗ 𝑡𝑦𝑝𝑒𝑜𝑓𝑐𝑜𝑚𝑚𝑢𝑛𝑖𝑐𝑎𝑡𝑖𝑜𝑛 + 𝜀
• In case a significant relationship between the treatment and the
outcome variable is established, mediating variables should be
added to the regression (multiple logistic regression):
𝑃𝑢𝑟𝑐ℎ𝑎𝑠𝑒 = 𝛽, + 𝛽. ∗ 𝑡𝑦𝑝𝑒𝑜𝑓𝑐𝑜𝑚𝑚𝑢𝑛𝑖𝑐𝑎𝑡𝑖𝑜𝑛 + 𝛽:∗ 𝑛𝑢𝑚𝑏𝑒𝑟𝑜𝑓ℎ𝑜𝑠𝑡𝑒𝑑𝑔𝑎𝑚𝑒𝑠 + 𝛽>∗ 𝑛𝑢𝑚𝑏𝑒𝑟𝑜𝑓𝑐𝑟𝑒𝑎𝑡𝑒𝑑𝑔𝑎𝑚𝑒𝑠 + 𝛽?∗ 𝑛𝑢𝑚𝑏𝑒𝑟𝑜𝑓𝑎𝑠𝑠𝑖𝑔𝑛𝑒𝑑𝑐ℎ𝑎𝑙𝑙𝑒𝑛𝑔𝑒𝑠 + 𝜀
1010236GRA 19703
23
• then, mediation should be controlled by calculating the difference
between regression coefficients (𝛽./ − 𝛽.).
5.0 Results 5.1 Descriptive statistics
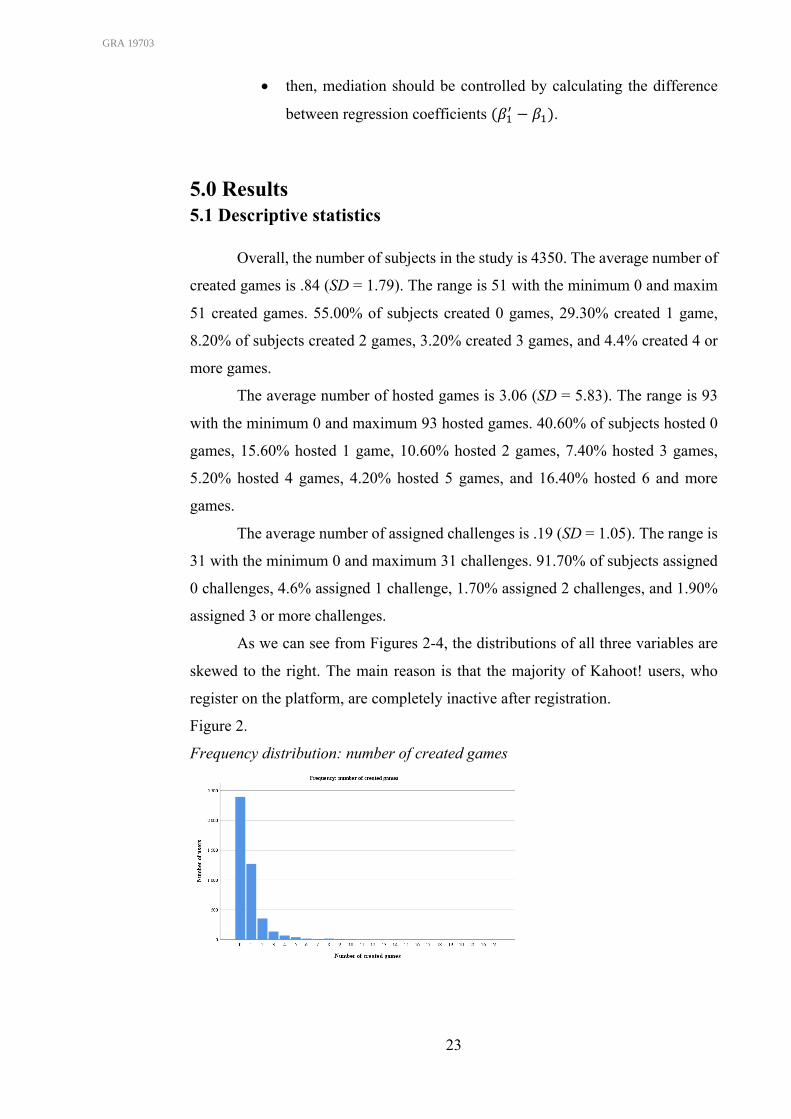
Overall, the number of subjects in the study is 4350. The average number of
created games is .84 (SD = 1.79). The range is 51 with the minimum 0 and maxim
51 created games. 55.00% of subjects created 0 games, 29.30% created 1 game,
8.20% of subjects created 2 games, 3.20% created 3 games, and 4.4% created 4 or
more games.
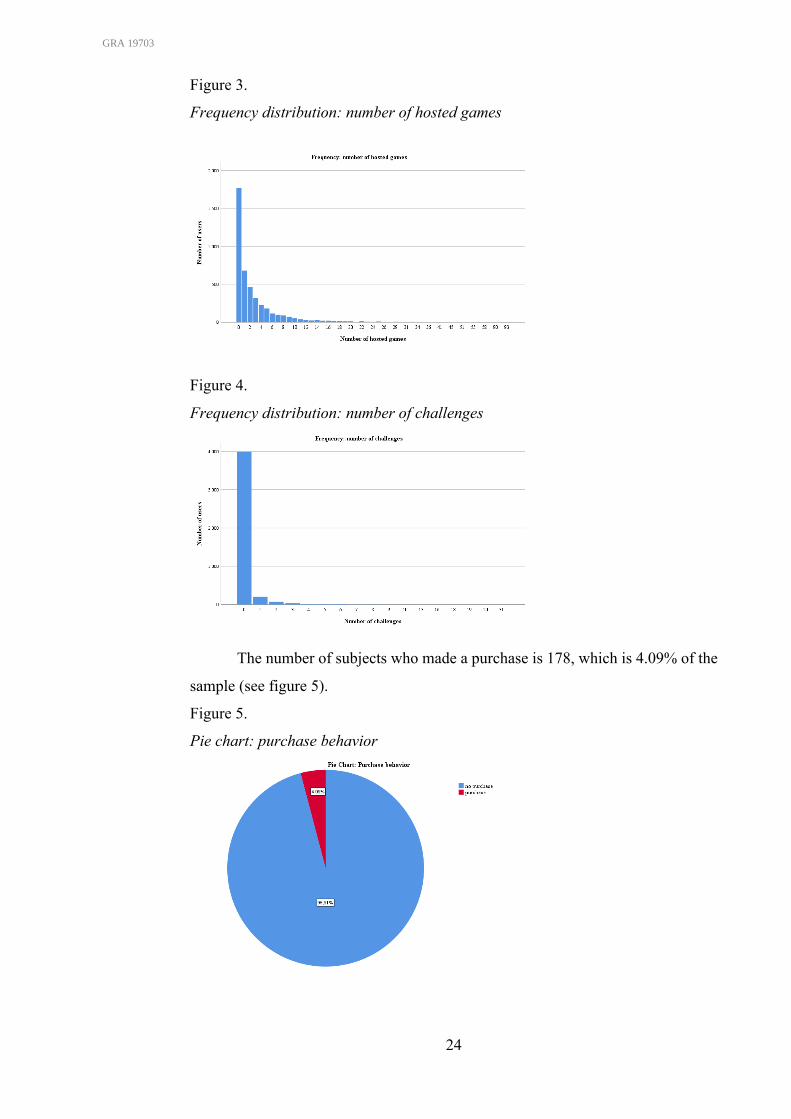
The average number of hosted games is 3.06 (SD = 5.83). The range is 93
with the minimum 0 and maximum 93 hosted games. 40.60% of subjects hosted 0
games, 15.60% hosted 1 game, 10.60% hosted 2 games, 7.40% hosted 3 games,
5.20% hosted 4 games, 4.20% hosted 5 games, and 16.40% hosted 6 and more
games.
The average number of assigned challenges is .19 (SD = 1.05). The range is
31 with the minimum 0 and maximum 31 challenges. 91.70% of subjects assigned
0 challenges, 4.6% assigned 1 challenge, 1.70% assigned 2 challenges, and 1.90%
assigned 3 or more challenges.
As we can see from Figures 2-4, the distributions of all three variables are
skewed to the right. The main reason is that the majority of Kahoot! users, who
register on the platform, are completely inactive after registration.
Figure 2.
Frequency distribution: number of created games
1010236GRA 19703
24
Figure 3.
Frequency distribution: number of hosted games
Figure 4.
Frequency distribution: number of challenges
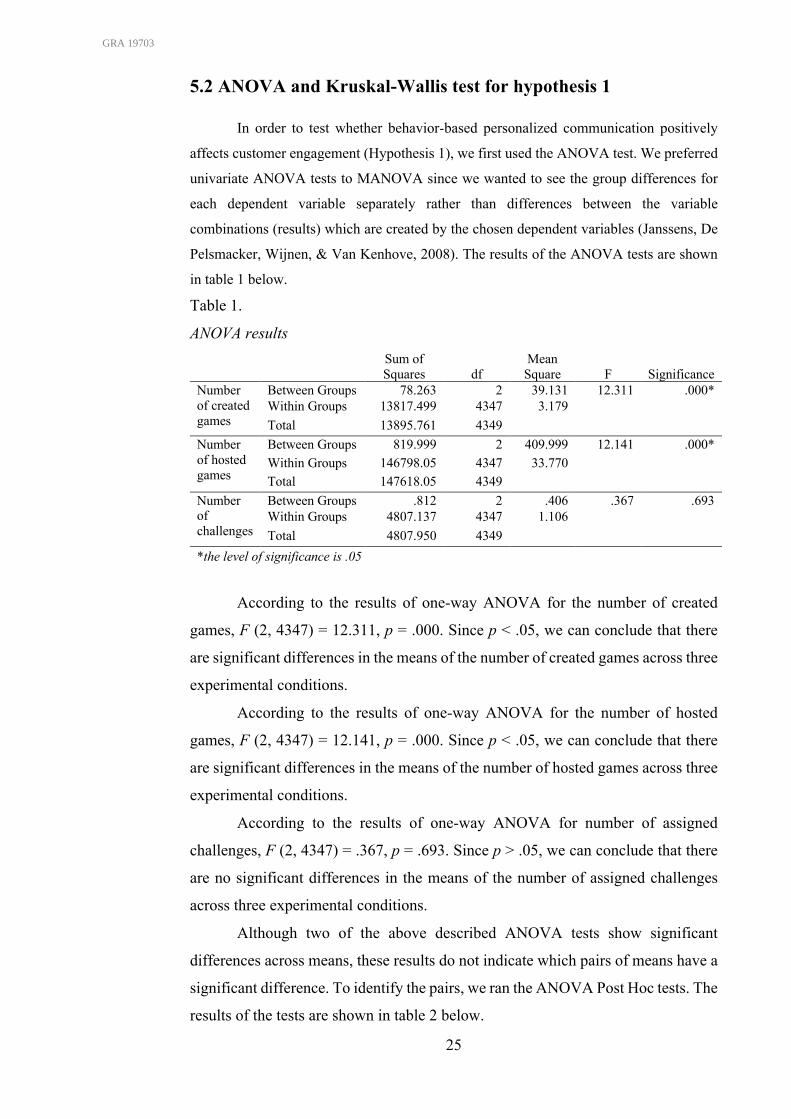
The number of subjects who made a purchase is 178, which is 4.09% of the
sample (see figure 5).
Figure 5.
Pie chart: purchase behavior
1010236GRA 19703
25
5.2 ANOVA and Kruskal-Wallis test for hypothesis 1 In order to test whether behavior-based personalized communication positively
affects customer engagement (Hypothesis 1), we first used the ANOVA test. We preferred
univariate ANOVA tests to MANOVA since we wanted to see the group differences for
each dependent variable separately rather than differences between the variable
combinations (results) which are created by the chosen dependent variables (Janssens, De
Pelsmacker, Wijnen, & Van Kenhove, 2008). The results of the ANOVA tests are shown
in table 1 below.
Table 1.
ANOVA results
Sum of Squares df
Mean Square F Significance
Number of created games
Between Groups 78.263 2 39.131 12.311 .000* Within Groups 13817.499 4347 3.179
Total 13895.761 4349 Number of hosted games
Between Groups 819.999 2 409.999 12.141 .000* Within Groups 146798.05 4347 33.770 Total 147618.05 4349
Number of challenges
Between Groups .812 2 .406 .367 .693 Within Groups 4807.137 4347 1.106
Total 4807.950 4349 *the level of significance is .05
According to the results of one-way ANOVA for the number of created
games, F (2, 4347) = 12.311, p = .000. Since p < .05, we can conclude that there
are significant differences in the means of the number of created games across three
experimental conditions.
According to the results of one-way ANOVA for the number of hosted
games, F (2, 4347) = 12.141, p = .000. Since p < .05, we can conclude that there
are significant differences in the means of the number of hosted games across three
experimental conditions.
According to the results of one-way ANOVA for number of assigned
challenges, F (2, 4347) = .367, p = .693. Since p > .05, we can conclude that there
are no significant differences in the means of the number of assigned challenges
across three experimental conditions.
Although two of the above described ANOVA tests show significant
differences across means, these results do not indicate which pairs of means have a
significant difference. To identify the pairs, we ran the ANOVA Post Hoc tests. The
results of the tests are shown in table 2 below.
1010236GRA 19703
26
Table 2.
ANOVA Post-Hoc test (Bonferroni)
Dependent Variable Mean
Difference Std.
Error Significance
95% Confidence Interval
Lower Bound
Upper Bound
Number of created games
0 1 -.317* .066 .000 -.48 -.16 2 -.234* .066 .001 -.39 -.08
1 0 .317* .066 .000 .16 .48 2 .082 .066 .646 -.08 .24
2 0 .234* .066 .001 .08 .39 1 -.082 .066 .646 -.24 .08
Number of hosted games
0 1 -.963* .216 .000 -1.48 -.45 2 -.872* .216 .000 -1.39 -.35 1 0 .963* .216 .000 .45 1.48 2 .092 .216 1.000 -.43 .61 2 0 .872* .216 .000 0.35 1.39 1 -.092 .216 1.000 -0.61 .43
Number of challenges 0 1 .028 .039 1.000 -.07 .12 2 .030 .039 1.000 -.06 .12
1 0 -.028 .039 1.000 -.12 .07 2 .001 .039 1.000 -.09 .09
2 0 -.030 .039 1.000 -.12 .06 1 -.001 .039 1.000 -.09 .09
*the mean difference is significant at the 0.05 level. 0 refers to no communication, 1 refers to personalized communication, 2 refers to non-personalized communication
As we can see from the table, there is a significant difference in the number
of created games between group 0 and group 1 (p = .000), group 0 and group 2 (p
= .001), but there is no significant difference (p = .646) between groups 1 and 2.
The average number of created games is .66 for group 0, .98 for group 1, and .89
for group 2. Hence, we can conclude that making marketing communication
personalized based on customer behavior does not affect the number of created
games. However, drawing on the significant difference in means between groups 0
and 1, 0 and 2, we can conclude that email communication itself has a significant
positive effect on the number of created games regardless of behavior-based
personalization.
Similarly, there is a significant difference in the number of hosted games
between group 0 and group 1 (p = .000), group 0 and group 2 (p = .000), but there
is no significant difference (p = 1.000) between groups 1 and 2. The average number
of hosted games is 2.45 for group 0, 3.41 for group 1 and 3.32 for group 2.
Therefore, we can conclude that personalized communication based on customer
1010236GRA 19703
27
behavior does not affect the number of hosted games. At the same time, based on
the significant difference in means between group 0 and 1, 0 and 2, we can conclude
that email communication itself irrespective of behavior-based personalization has
a significant positive effect on the number of hosted games.
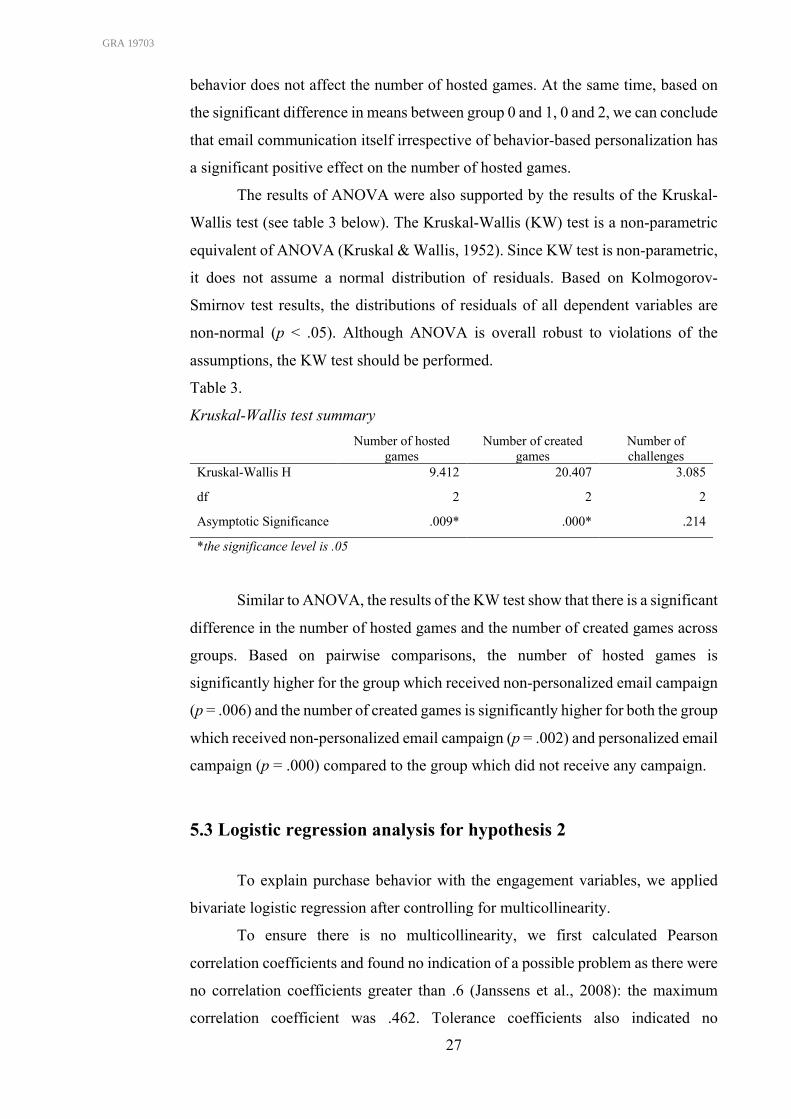
The results of ANOVA were also supported by the results of the Kruskal-
Wallis test (see table 3 below). The Kruskal-Wallis (KW) test is a non-parametric
equivalent of ANOVA (Kruskal & Wallis, 1952). Since KW test is non-parametric,
it does not assume a normal distribution of residuals. Based on Kolmogorov-
Smirnov test results, the distributions of residuals of all dependent variables are
non-normal (p < .05). Although ANOVA is overall robust to violations of the
assumptions, the KW test should be performed.
Table 3.
Kruskal-Wallis test summary
Number of hosted
games Number of created
games Number of challenges
Kruskal-Wallis H 9.412 20.407 3.085
df 2 2 2
Asymptotic Significance .009* .000* .214
*the significance level is .05
Similar to ANOVA, the results of the KW test show that there is a significant
difference in the number of hosted games and the number of created games across
groups. Based on pairwise comparisons, the number of hosted games is
significantly higher for the group which received non-personalized email campaign
(p = .006) and the number of created games is significantly higher for both the group
which received non-personalized email campaign (p = .002) and personalized email
campaign (p = .000) compared to the group which did not receive any campaign.
5.3 Logistic regression analysis for hypothesis 2
To explain purchase behavior with the engagement variables, we applied
bivariate logistic regression after controlling for multicollinearity.
To ensure there is no multicollinearity, we first calculated Pearson
correlation coefficients and found no indication of a possible problem as there were
no correlation coefficients greater than .6 (Janssens et al., 2008): the maximum
correlation coefficient was .462. Tolerance coefficients also indicated no
1010236GRA 19703
28
multicollinearity issue as all the tolerance values were greater than .5 (Janssens et
al., 2008): minimum tolerance value was .787.
Since it is impossible to calculate an R² for logistic regression, we need to
use approximations such as Cox & Snell R² and Nagelkerke pseudo-R². The Model
Summary resulted in Cox & Snell R² = .007 and Nagelkerke R² = .024. Drawing on
Nagelkerke R², which is preferred over Cox & Snell R² since Nagelkerke R² ranges
from 0 to 1, the full model has a reasonable model fit since pseudo-R² is typically
very low.
At the same time, based on the results of the Chi-Square test (c2 = 29.960(3),
p = .000), we concluded that it makes sense to include explanatory variables to the
model.
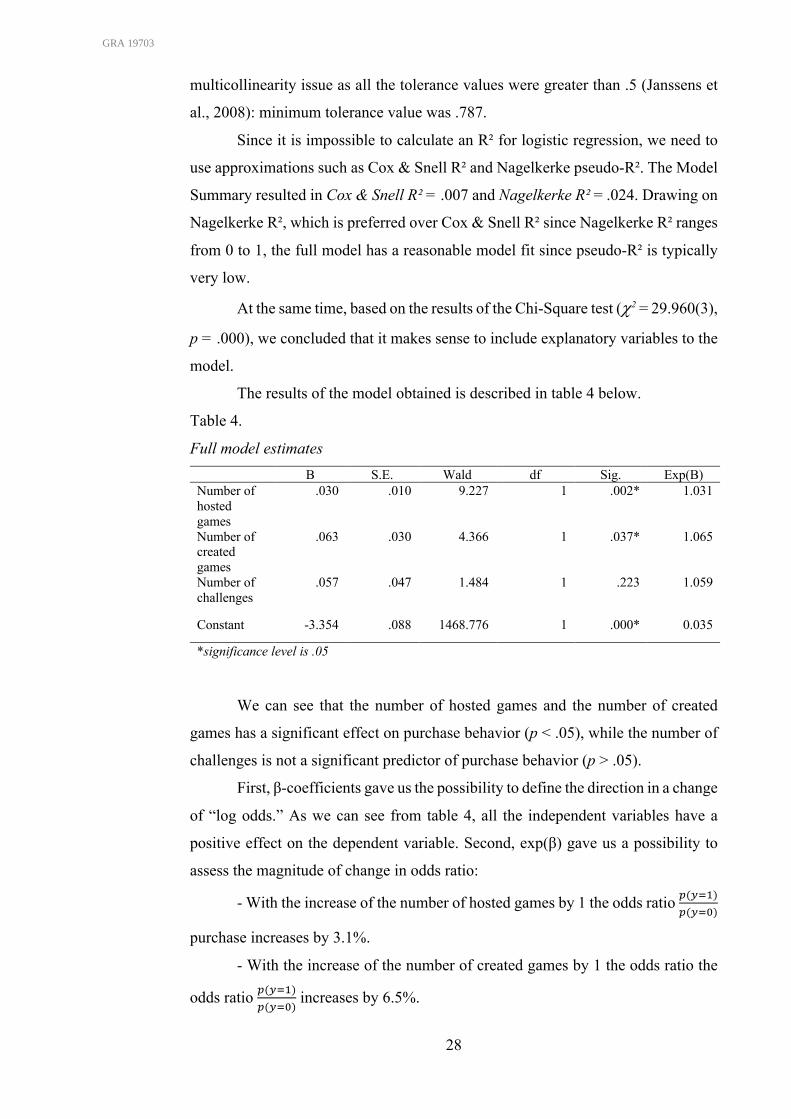
The results of the model obtained is described in table 4 below.
Table 4.
Full model estimates B S.E. Wald df Sig. Exp(B) Number of hosted games
.030 .010 9.227 1 .002* 1.031
Number of created games
.063 .030 4.366 1 .037* 1.065
Number of challenges
.057 .047 1.484 1 .223 1.059
Constant -3.354 .088 1468.776 1 .000* 0.035
*significance level is .05
We can see that the number of hosted games and the number of created
games has a significant effect on purchase behavior (p < .05), while the number of
challenges is not a significant predictor of purchase behavior (p > .05).
First, β-coefficients gave us the possibility to define the direction in a change
of “log odds.” As we can see from table 4, all the independent variables have a
positive effect on the dependent variable. Second, exp(β) gave us a possibility to
assess the magnitude of change in odds ratio:
- With the increase of the number of hosted games by 1 the odds ratio D(EF.)D(EF,)
purchase increases by 3.1%.
- With the increase of the number of created games by 1 the odds ratio the
odds ratio D(EF.)D(EF,)
increases by 6.5%.
1010236GRA 19703

29
The probability to purchase could be then calculated using the following
equation:
Logit (Purchase) = -3.354 + .030 × number of hosted games + .063 ×
number of created games + .057 × number of challenges (1)
5.4 Logistic regression analysis for hypothesis 3
To demonstrate mediation, we first must prove that the treatment
significantly affects the outcome variable. If this condition does not hold, then the
subsequent analysis of mediation makes little sense (Judd & Kenny, 1981).
According to the results of the logistic regression analysis with the purchase
behavior as a dependent variable and experimental group as an independent
variable, the model indicated zero fit since both Cox & Snell R² = .000 and
Nagelkerke R² = .000.
Also, based on the Chi-Square test (c2 = .079(1), p = .806), we concluded
that the model did not adequately explain the outcome variable. According to the
results of logistic regression (see table 5), none of the levels of the treatment
variable had a significant effect on the outcome variable (p > .05).
Table 5.
Full model estimates
B S.E. Wald df Sig. Exp(B) Communication type
.433 2 .805
Communication type1
-.068 .185 .137 1 .711 .934
Communication type 2
-.123 .188 .429 1 .513 .884
Constant -3.092 .129 576.052 1 .000* .045 *significance level is .05 Personalized communication was chosen to be a base category; communication type 1 refers to no communication, communication type 2 refers to non-personalized communication
Since the treatment variable does not have a significant effect on the
outcome variable, there is no need to conduct a further regression analysis, and after
this step, we can conclude that the hypothesis about the mediation effect of
engagement was not supported.
1010236GRA 19703
30
6.0 Discussion and conclusions
This study investigated how consumers respond to email marketing
communication personalized based on customer behavior. Limited prior research
studied the effects of behavior-based personalization in the context of email
marketing. Rather, scholars to date have put their efforts into the investigation of
the effects of email personalization based on customer-related information (Sahni
et al., 2018; Wattal et al., 2012; White et al., 2008). Particularly in this study, we
investigated the relationships between personalized communication based on
customer behavior, customer engagement, and customer purchase behavior.
The first question addressed in this study was related to the effect of
behavior-based personalization on customer engagement. Results suggest that
email campaigns personalized based on customer behavior compared to non-
personalized email campaigns do not lead to significantly higher engagement. First,
the reason for the absence of the significant effect might be related to the choice of
engagement metrics. While such widely used metrics as a number of visits or
number of clicks also reflect the intensity of customer engagement online (Lehmann
et al., 2012), we focused on the engagement behaviors that require more effort on
the part of a customer. Visiting a webpage or clicking through the link is not as
time-consuming and does not demand as much involvement as game creation and
game hosting. Second, another possible reason for the absence of a significant
difference in the effectiveness of personalized and non-personalized email
campaigns might be related to the overall low intrusiveness of the email content
used in this study. All the content was more of educational (according to Content
Marketing Matrix suggested by Chaffey & Ellis-Chadwick, 2016, p. 450) than
promotional nature. Hence, even though the users in the non-personalized condition
received emails with information about Kahoot! that was not always relevant to
them (e.g., received an email about how to create Kahoot! game after they created
it or email about how to host Kahoot! game after they hosted the game), still they
did not perceive the emails as highly intrusive and, thus, responded positively.
Important to mention, these research findings do not contradict the existing research
on behavior-based personalization. In fact, the results of our study are supported by
previous studies on personalization in the online banner advertisement context.
Scholars concluded that personalized ads based on individual customer browsing
1010236GRA 19703
31
behavior do not lead to better customer responses than generic ads (Lambrecht &
Tucker, 2013; Bleier & Eisenbeiss, 2015).
What is particularly interesting, after comparing customers who received
email campaigns with those who did not receive any email campaign, we found that
the email communication itself irrespective of personalization had a significant
positive effect on customer engagement. This proves that email is an efficient
digital media channel. Considering the massive popularity of email as a
communication tool for both personal and professional usage, one can argue that
being regularly present in the email inbox of customers helps brands to increase
their visibility substantially and, thus, make their audience more engaged.
Another question addressed in our research was related to the influence of
customer engagement on customer purchase behavior. Findings show the
significant positive effect of customer engagement on the probability of making a
purchase. This being said, the more engaged are customers, the more value they
derive from the experience with the company or a brand and are, therefore, more
likely to buy. This result is consistent with the viewpoints of other researchers in
the field (Kumar et al., 2010; Verhoef et al., 2010, Harmeling et al., 2017, Van
Doorn et al., 2010).
We also find it important to elaborate more on the reason why one of the
engagement variables, mainly the number of Kahoot! challenges (i.e., assigned
homework), did not significantly differ across any of the experimental conditions.
This variable also did not significantly affect customer purchase behavior. For
students to play Kahoot! game as homework, they need a mobile phone or a tablet
with installed Kahoot! mobile application (retrieved from kahoot.com). Taking into
account that not every student has a smartphone (Versel, 2018), we argue that this
creates a barrier for the active usage of challenges functionality. Thus, teachers
overall do not use this Kahoot! feature much (as confirmed by Lifecycle marketing
director at Kahoot!, Arnbjørn Marklund). Since the user can create and host
Kahoot! games using any device and they do not need to install any special
application or software, we drew our conclusions regarding engagement based on
the following engagement metrics: number of Kahoot! games created and number
of Kahoot! games hosted.
Lastly, we addressed the question of possible mediation effect of
engagement between the type of email communication customers receive and their
subsequent purchase behavior. The hypothesis about the mediation effect of
1010236GRA 19703
32
customer engagement was not supported because there was no significant main
effect found. Therefore, we can conclude that for the customers to make a decision
to buy, they primarily need to engage with the company to gain the perception of
value about a product or a brand.
6.1 Managerial implications
First, our study empirically confirms the importance of customer
engagement since the latter was found to have a significant positive effect on
customer purchase behavior. Although customer engagement can occur
organically, in order to achieve better firm performance, companies are
recommended to invest in customer engagement marketing initiatives, meaning that
they should make an effort to motivate, empower and measure customers’
contribution to the firm beyond purchase (Harmeling et al., 2017).
We suggest that one of such engagement initiatives should be email
marketing. Customers who get emails from the company are overall more willing
to engage with a brand than those who do not. Since email communication was
found to have a significant positive effect on engagement, managers are
recommended to invest both in talent and in technology for the creation of email
marketing campaigns. At the same time, based on the insignificant effect of
behavior-based personalization, we suggest email marketers put more focus on
high-quality generic content and responsive design rather than personalization of
the emails.
7.0 Limitations and future research
Most of the concerns related to our study originate from the chosen study
setting. Our partner company, Kahoot!, offers a highly technological product, thus,
the profile of Kahoot! customer might differ from the average consumer using
email. Consumers embracing technology have an optimistic view of its benefits and
are overall more innovative (Parasuraman, 2000). Thus, the subjects in this study
can be characterized by a high level of technological readiness. Technological
readiness is “people’s propensity to embrace and use new technologies for
accomplishing goals in home life and at work” (Parasuraman, 2000, p. 308). One
1010236GRA 19703
33
can argue that the high level of technological readiness, which Kahoot! users
possess, might bring a thread to the external validity of the study results. Therefore,
we suggest replicating the study in different, more traditional, setting. For instance,
future research might be performed in collaboration with online retailers, online
magazines, or service providers, who also use email marketing as a part of their
digital media mix.
Another limitation is related to the lack of data available for this research.
Since we did not have full access to the profiles of Kahoot! users, we could not
implement some control variables in the study (although the time users started
getting email campaigns and the observation period were strictly controlled, we
could not control from which device they open emails, for instance). Also, due to
the limited access, we could not provide an extensive description of subjects (i.e.,
demographics). In the future research, more data about the subjects should be
collected.
Although current study closed the gap in the research on behavior-based
personalization in the context of email marketing, more empirical effort is needed
to investigate if there are any moderators affecting the relationship between
personalized communication, customer engagement, and purchase behavior. Future
research may, for instance, investigate the interplay of behavior-based
personalization and personalization based on customer-related information. By
running a field experiment with the two-factor design (where the first factor would
be personalization based on customer-related information and the second factor
would be behavior-based personalization), researchers might find interaction
effects between two variables. This would bring a more detailed view of the
effectiveness of both types of personalization in the email marketing context.
1010236GRA 19703
34
8.0 References
Arora, N., Dreze, X., Ghose, A., Hess, J. D., Iyengar, R., Jing, B., ... & Sajeesh, S.
(2008). Putting one-to-one marketing to work: Personalization, customization, and
choice. Marketing Letters, 19(3-4), 305.
Baron, R. M., & Kenny, D. A. (1986). The moderator–mediator variable distinction
in social psychological research: Conceptual, strategic, and statistical
considerations. Journal of personality and social psychology, 51(6), 1173.
Bleier, A., & Eisenbeiss, M. (2015). Personalized online advertising effectiveness:
The interplay of what, when, and where. Marketing Science, 34(5), 669-688.
Bleier, A., De Keyser, A., & Verleye, K. (2018). Customer engagement through
personalization and customization. In Customer Engagement Marketing (pp. 75-
94). Palgrave Macmillan, Cham.
Brodie, R. J., Hollebeek, L. D., Jurić, B., & Ilić, A. (2011). Customer engagement:
Conceptual domain, fundamental propositions, and implications for research.
Journal of service research, 14(3), 252-271.
Calder, B. J., Malthouse, E. C., & Schaedel, U. (2009). An experimental study of
the relationship between online engagement and advertising effectiveness. Journal
of interactive marketing, 23(4), 321-331.
Chaffey, D., & Ellis-Chadwick, F. (2016). Digital marketing: Strategy,
implementation and practice (6th ed.). Harlow: Pearson.
Dodds, W. B., Monroe, K. B., & Grewal, D. (1991). Effects of price, brand, and
store information on buyers’ product evaluations. Journal of marketing research,
28(3), 307-319.
eMarketer. (2016). Email continues to deliver strong ROI and value for marketers.
Retrieved from www.emarketer.com
1010236GRA 19703
35
Goldfarb, A., & Tucker, C. (2011). Online display advertising: Targeting and
obtrusiveness. Marketing Science, 30(3), 389-404.
Hanna, R., Swain, S., & Smith, J. (2015). Email Marketing in a Digital World: The
Basics and Beyond. New York: Business Expert Press.
Harmeling, C. M., Moffett, J. W., Arnold, M. J., & Carlson, B. D. (2017). Toward
a theory of customer engagement marketing. Journal of the Academy of Marketing
Science, 45(3), 312-335.
Hartemo, M. (2016). Email marketing in the era of the empowered consumer.
Journal of Research in Interactive Marketing, 10(3), 212-230.
Harvard Business Review. (2018). The age of personalization. Retrieved from
https://hbr.org/
Hawkins, R. P., Kreuter, M., Resnicow, K., Fishbein, M., & Dijkstra, A. (2008).
Understanding tailoring in communicating about health. Health education
research, 23(3), 454-466.
Hollebeek, L. D. (2011). Demystifying customer brand engagement: Exploring the
loyalty nexus. Journal of marketing management, 27(7-8), 785-807.
Janssens, W., De Pelsmacker, P., Wijnen, K., & Van Kenhove, P. (2008).
Marketing research with SPSS. Pearson Education.
Judd, C. M., & Kenny, D. A. (1981). Process analysis: Estimating mediation in
treatment evaluations. Evaluation Review, 5(5), 602-619.
Kahoot! (2019). Kahoot! Press Kit. Retrieved from https://kahoot.com/press/
Kruskal, W. H., & Wallis, W. A. (1952). Use of ranks in one-criterion variance
analysis. Journal of the American statistical Association, 47(260), 583-621.
1010236GRA 19703
36
Kumar, V., & Pansari, A. (2016). Competitive advantage through engagement.
Journal of Marketing Research, 53(4), 497-514.
Kumar, V., Aksoy, L., Donkers, B., Venkatesan, R., Wiesel, T., & Tillmanns, S.
(2010). Undervalued or overvalued customers: capturing total customer
engagement value. Journal of service research, 13(3), 297-310.
Lambrecht, A., & Tucker, C. (2013). When does retargeting work? Information
specificity in online advertising. Journal of Marketing Research, 50(5), 561-576.
Lehmann, J., Lalmas, M., Yom-Tov, E., & Dupret, G. (2012, July). Models of user
engagement. In International Conference on User Modeling, Adaptation, and
Personalization (pp. 164-175). Springer, Berlin, Heidelberg.
Lemon, K. N., & Verhoef, P. C. (2016). Understanding customer experience
throughout the customer journey. Journal of marketing, 80(6), 69-96.
Malhotra, N. K. (2010). Marketing Research. An Applied Approach, 6th Global
Edition.
Markelz, M. (2018, July 11). Three things you must do to master email
personalization. American Marketing Association. Retrieved from
https://www.ama.org
Marketing Science Institute. (2018). Research Priorities 2018–2020. Retrieved
from https://www.msi.org/
Moore, R., Stammerjohan, C., & Coulter, R. (2005). Banner advertiser-web site
context congruity and color effects on attention and attitudes. Journal of
Advertising, 34(2), 71-84.
Novak, T. P., Hoffman, D. L., & Yung, Y. F. (2000). Measuring the customer
experience in online environments: A structural modeling approach. Marketing
science, 19(1), 22-42.
1010236GRA 19703
37
Osborne, M. (2017, January 26). How to use behavioral data in personalized
marketing campaigns. Forbes. Retrieved from https://www.forbes.com
Parasuraman, A. (2000). Technology Readiness Index (TRI) a multiple-item scale
to measure readiness to embrace new technologies. Journal of service research,
2(4), 307-320.
Patterson, P. G., & Spreng, R. A. (1997). Modelling the relationship between
perceived value, satisfaction and repurchase intentions in a business-to-business,
services context: an empirical examination. International Journal of service
Industry management, 8(5), 414-434.
Patterson, P., Yu, T., & De Ruyter, K. (2006, December). Understanding customer
engagement in services. In Advancing theory, maintaining relevance, proceedings
of ANZMAC 2006 conference, Brisbane (pp. 4-6).
Pavlov, O. V., Melville, N., & Plice, R. K. (2008). Toward a sustainable email
marketing infrastructure. Journal of Business Research, 61(11), 1191-1199.
Researchscope International (2018). 2018 Trends in Personalization. Retrieved
from https://www.evergage.com/wp-content/uploads/2018/04/Evergage-2018-
Trends-in-Personalization-Survey.pdf
Rust, R., Lemon, K., & Zeithaml, V. (2000). Driving customer equity: How
customer lifetime value is reshaping corporate strategy. New York: Free Press.
Sahni, N. S., Wheeler, S. C., & Chintagunta, P. (2018). Personalization in email
marketing: The role of noninformative advertising content. Marketing Science,
37(2), 236-258.
Shamdasani, P., Stanaland, A., & Tan, J. (2001). Location, location, location:
Insights for advertising placement on the web. Journal of Advertising Research,
41(4), 7-21.
1010236GRA 19703
38
Simonson, I. (2005). Determinants of customers’ responses to customized offers:
Conceptual framework and research propositions. Journal of marketing, 69(1), 32-
45.
Statista. (2019). Number of e-mail users worldwide from 2017 to 2022. Retrieved
from www.statista.com
Strauss, J., Frost, R., & Sinha, N. (2014). E-marketing (7th ed.). Harlow: Pearson.
Sudhir, K., Roy, S., & Cherian, M. (2016). Do sympathy biases induce charitable
giving? The effects of advertising content. Marketing Science, 35(6), 849-869.
Tam, K. Y., & Ho, S. Y. (2005). Web personalization as a persuasion strategy: An
elaboration likelihood model perspective. Information systems research, 16(3),
271-291.
Tucker, C. (2014). Social Networks, Personalized Advertising, and Privacy
Controls. JMR, Journal of Marketing Research, 51(5), 546-562.
Van Doorn, J., & Hoekstra, J. (2013). Customization of online advertising: The role
of intrusiveness. Marketing Letters, 24(4), 339-351.
Van Doorn, J., Lemon, K. N., Mittal, V., Nass, S., Pick, D., Pirner, P., & Verhoef,
P. C. (2010). Customer engagement behavior: Theoretical foundations and research
directions. Journal of service research, 13(3), 253-266.
Verhoef, P. C., Reinartz, W. J., & Krafft, M. (2010). Customer engagement as a
new perspective in customer management. Journal of service research, 13(3), 247-
252.
Versel, L. (2018, February 8). As cell phones proliferate in K-12, schools search
for smart policies. Education Week. Retrieved from
https://blogs.edweek.org/edweek/DigitalEducation/2018/02/
1010236GRA 19703
39
Vivek, S. D., Beatty, S. E., & Morgan, R. M. (2012). Customer engagement:
Exploring customer relationships beyond purchase. Journal of marketing theory
and practice, 20(2), 122-146.
Wattal, S., Telang, R., Mukhopadhyay, T., & Boatwright, P. (2012). What’s in a
“name”? Impact of use of customer information in e-mail advertisements.
Information Systems Research, 23(3-part-1), 679-697.
White, T. B., Zahay, D. L., Thorbjørnsen, H., & Shavitt, S. (2008). Getting too
personal: Reactance to highly personalized email solicitations. Marketing Letters,
19(1), 39-50.
Zeithaml, V. A. (1988). Consumer perceptions of price, quality, and value: a means-
end model and synthesis of evidence. Journal of marketing, 52(3), 2-22.
Zhang, X., Kumar, V., & Cosguner, K. (2017). Dynamically managing a profitable
email marketing program. Journal of Marketing Research, 54(6), 851-866.
1010236GRA 19703
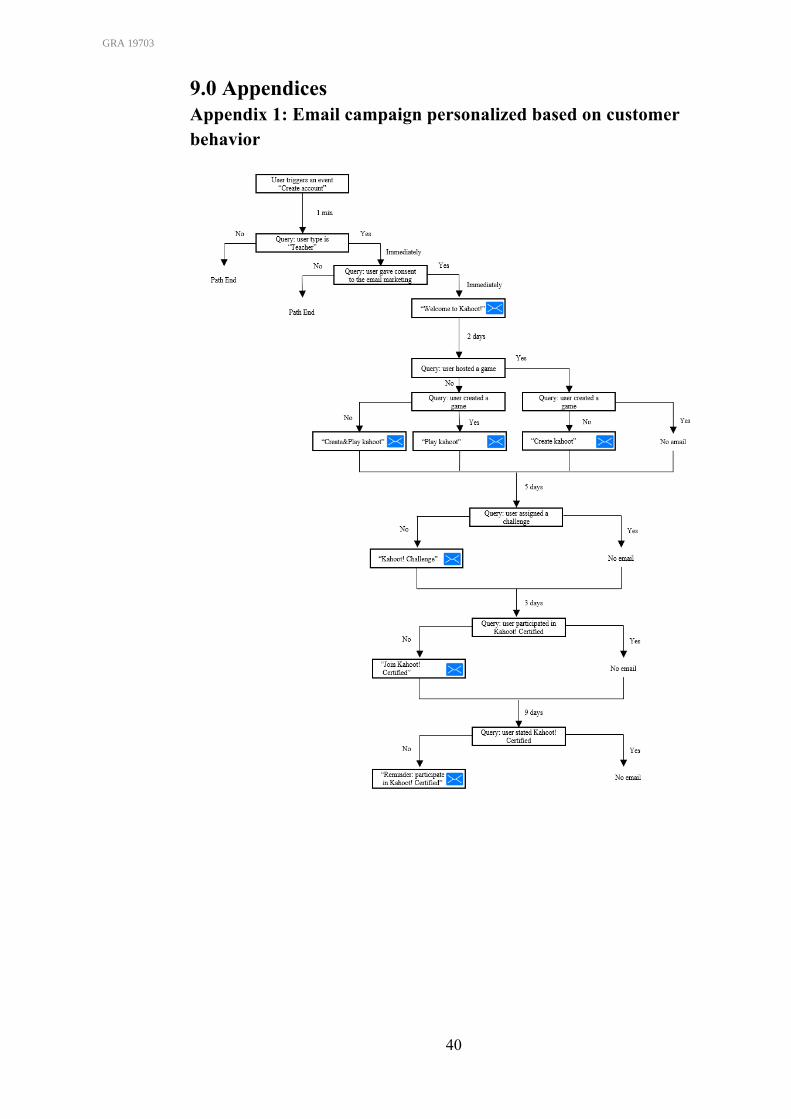
40
9.0 Appendices Appendix 1: Email campaign personalized based on customer behavior
1010236GRA 19703
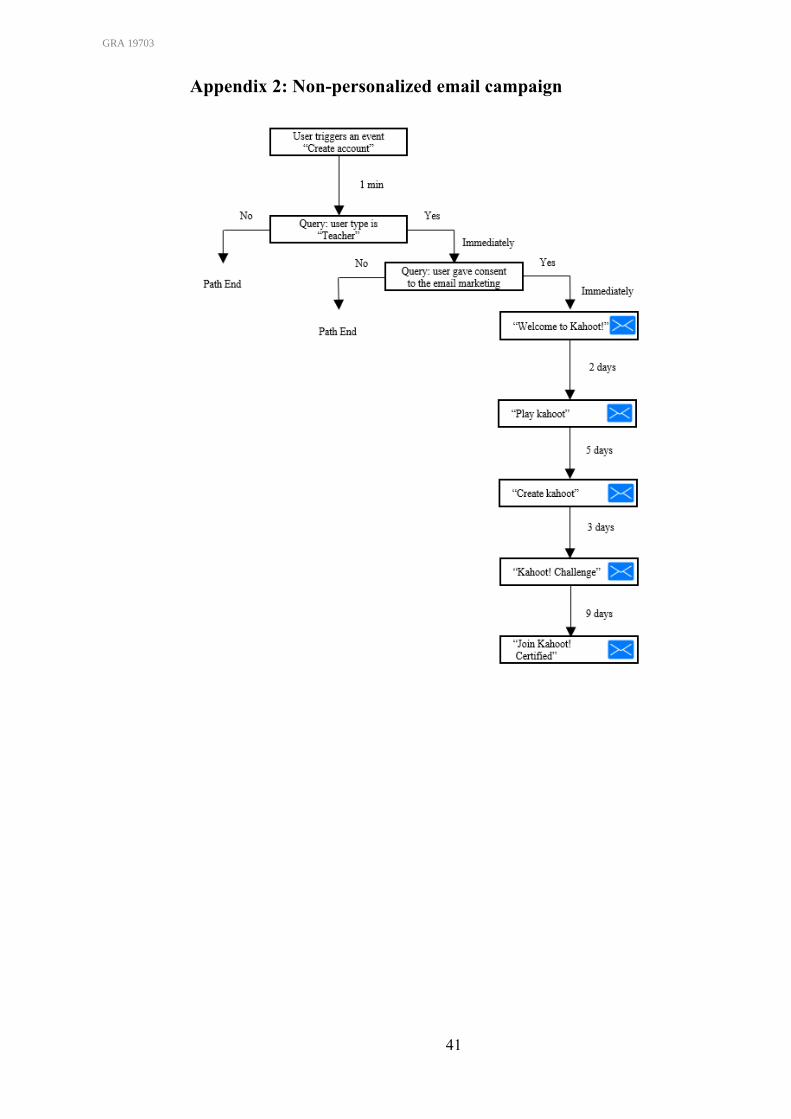
41
Appendix 2: Non-personalized email campaign
1010236GRA 19703