Embed Size (px)
Citation preview
GPP501: Lecture Sept 19 1 of 21
GPP 501
Microeconomic Analysis for Public Policy
Fall 2017
Given by Kevin Milligan
Vancouver School of Economics
University of British Columbia
Lecture Sept 19th: Supply
GPP501: Lecture Sept 19 2 of 21
Agenda for today:
1. Factors of production
2. Technology and production
3. Supply Curves
4. Market equilibrium
GPP501: Lecture Sept 19 3 of 21
Factors of production
What do we need to make guns/butter/anything?
GPP501: Lecture Sept 19 4 of 21
Factors of production
Labour
Is labour homogenous? Differentiated?
Capital
What is capital?
Land / Air / Nature / Raw materials
Where do these come from? How do we attain the right to use it?
GPP501: Lecture Sept 19 5 of 21
Agenda for today:
1. Factors of production
2. Technology and production
3. Supply Curves
4. Market equilibrium
GPP501: Lecture Sept 19 6 of 21
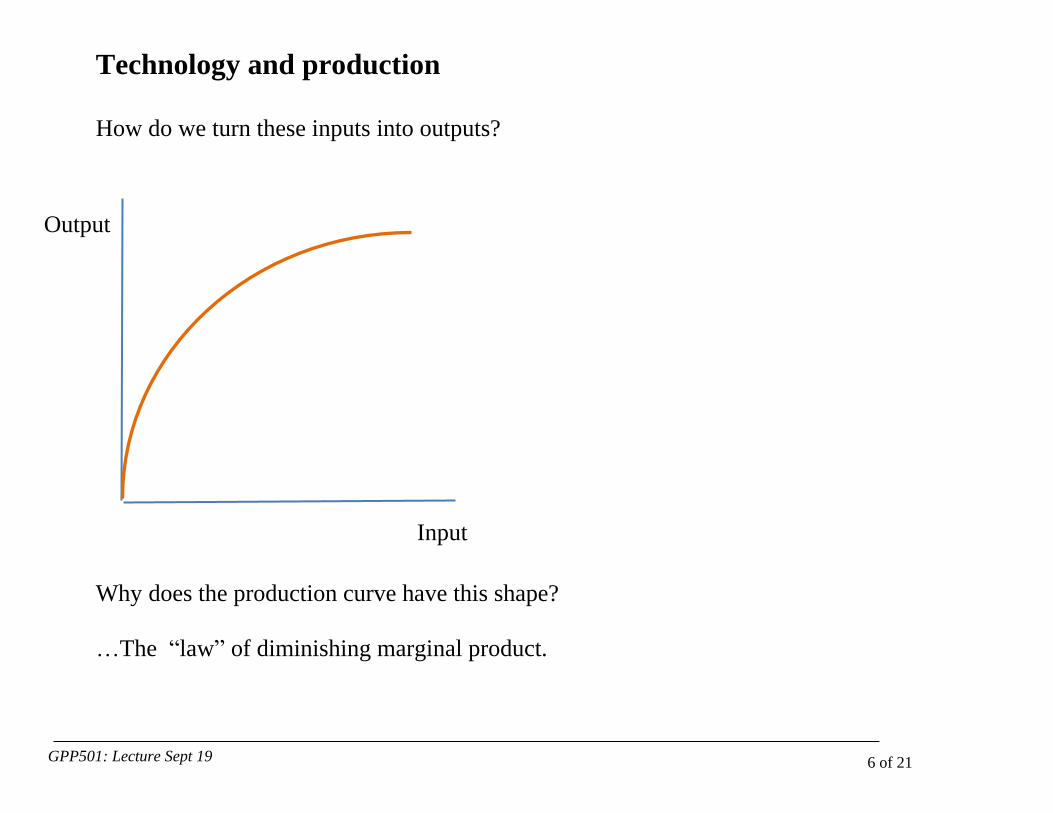
Technology and production
How do we turn these inputs into outputs?
Why does the production curve have this shape?
…The “law” of diminishing marginal product.
Output
Input
GPP501: Lecture Sept 19 7 of 21
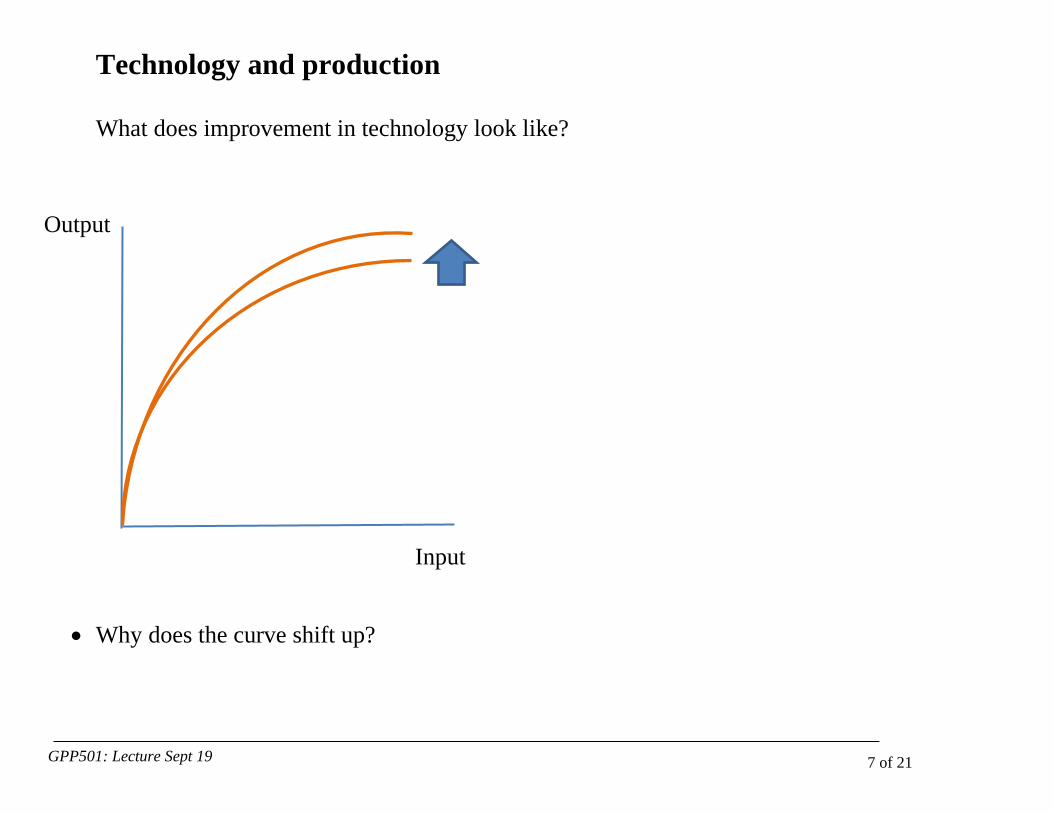
Technology and production
What does improvement in technology look like?
Why does the curve shift up?
Output
Input
GPP501: Lecture Sept 19 8 of 21
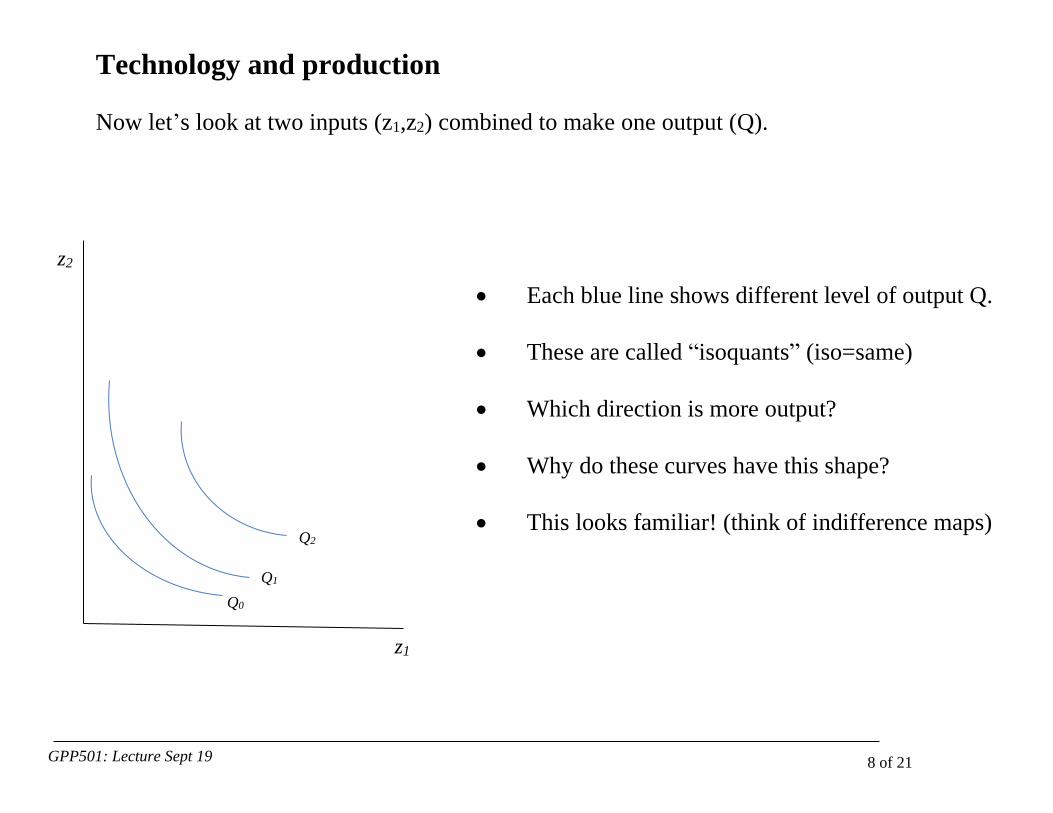
Technology and production
Now let’s look at two inputs (z1,z2) combined to make one output (Q).
Each blue line shows different level of output Q.
These are called “isoquants” (iso=same)
Which direction is more output?
Why do these curves have this shape?
This looks familiar! (think of indifference maps)
z1
z2
Q1
Q0
Q2
GPP501: Lecture Sept 19 9 of 21
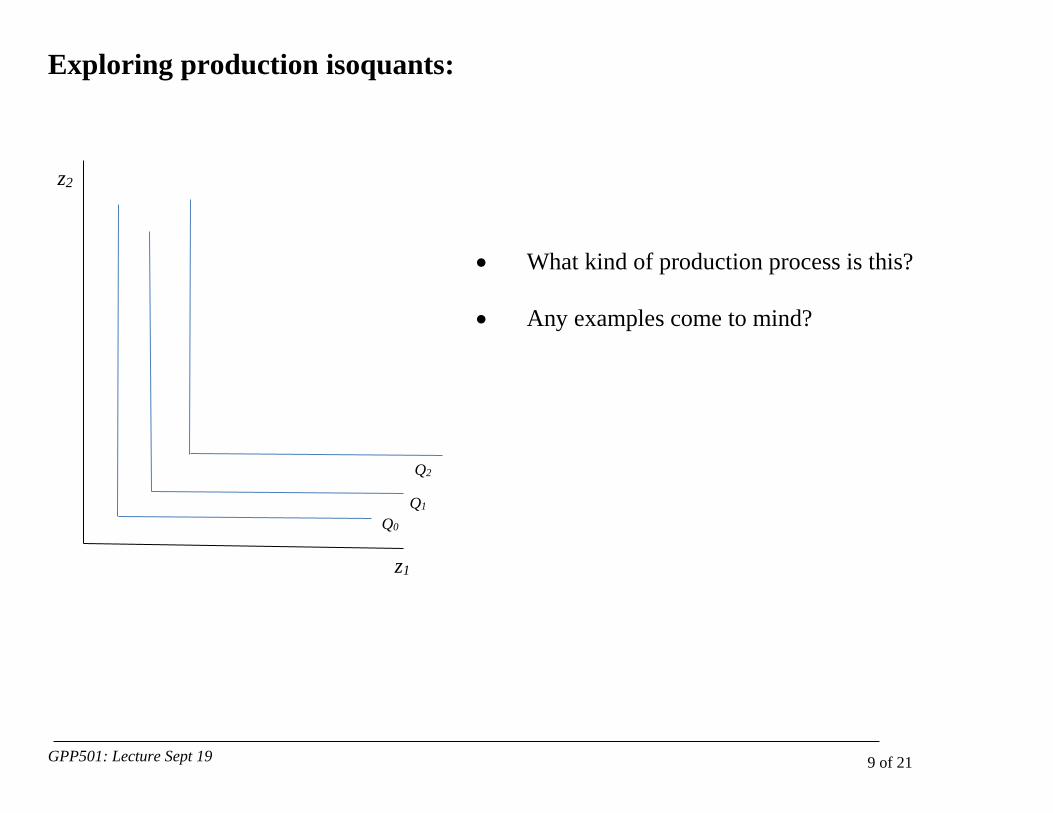
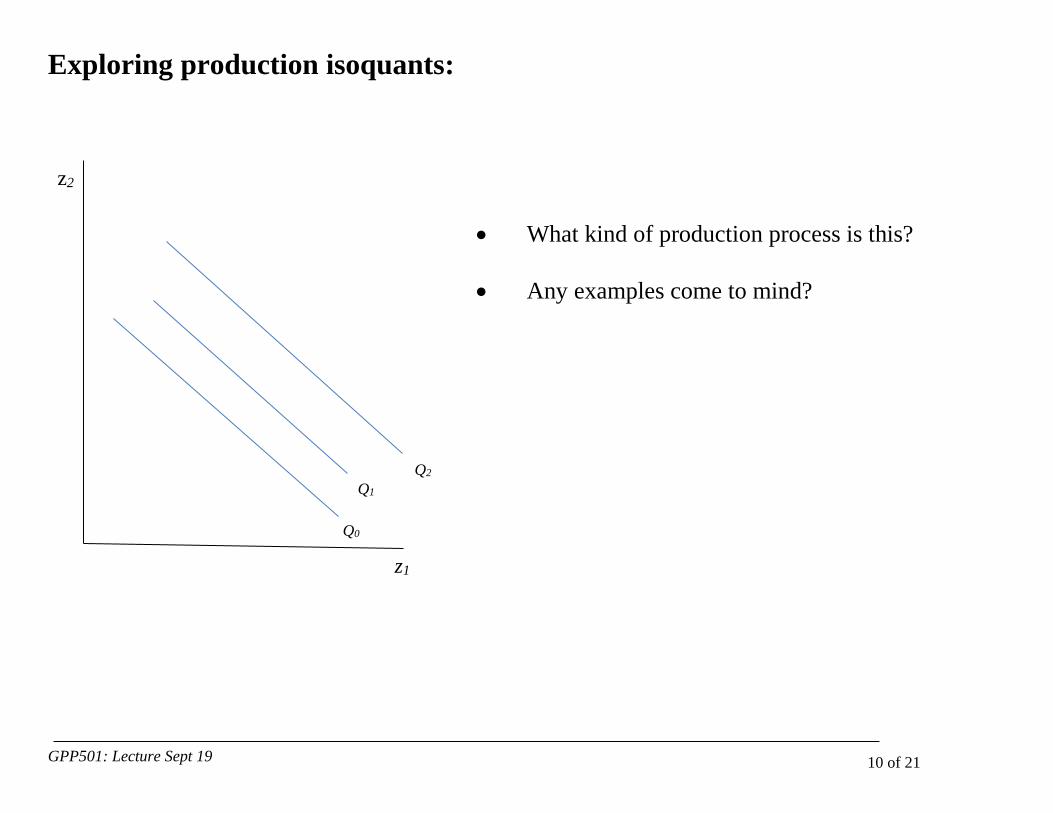
Exploring production isoquants:
What kind of production process is this?
Any examples come to mind?
z1
z2
Q1
Q0
Q2
GPP501: Lecture Sept 19 10 of 21
Exploring production isoquants:
What kind of production process is this?
Any examples come to mind?
z1
z2
Q1
Q0
Q2
GPP501: Lecture Sept 19 11 of 21
Now let’s think about cost of production:
Imagine we have:
Two inputs z1 and z2.
Inputs have prices at s1 and s2. (We will save ‘p’ for the price of the output….)
Total cost of production is defined as:
𝑐 = 𝑠1𝑧1 + 𝑠2𝑧2
Note that this can be used to form a line, just like the budget set on the consumer side.
GPP501: Lecture Sept 19 12 of 21
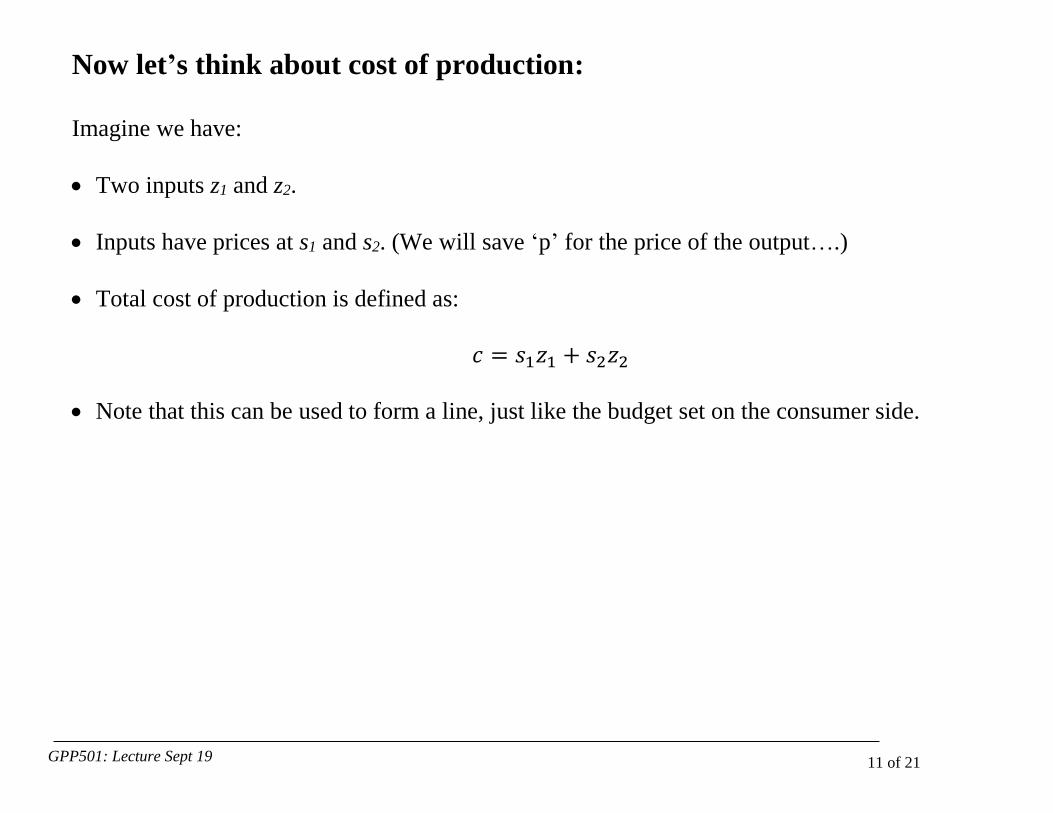
Now let’s think about cost of production:
There’s a name for this line: isocost line.
What is true along every point on this line?
If you’re a producer, which direction do you want
to move?
z1
z2
𝑐 = 𝑠1𝑧1 + 𝑠2𝑧2
GPP501: Lecture Sept 19 13 of 21
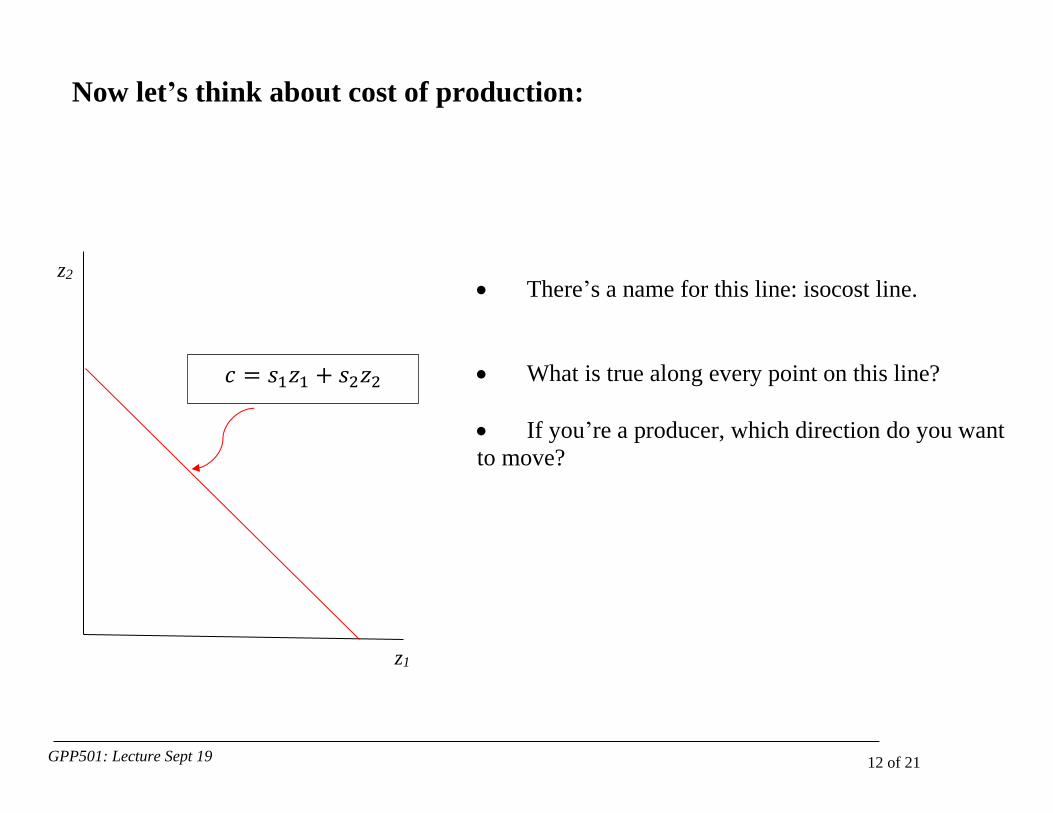
How do we minimize costs?
What happens if I get more y?
Parallel shifts outward of budget line.
z1
z2 𝑐0 < 𝑐1 < 𝑐2
𝑐0 𝑐1
𝑐2
GPP501: Lecture Sept 19 14 of 21
Agenda for today:
1. Factors of production
2. Technology and production
3. Supply Curves
4. Market equilibrium
GPP501: Lecture Sept 19 15 of 21
Putting isoquants and isocost curves together
What happens when we combine our diagrams?
Draw up the isoquants that we can make given our technology.
What is the cheapest way to make each quantity of production?
o Find the lowest cost curve on each isoquant.
Let’s give this a shot!
GPP501: Lecture Sept 19 16 of 21
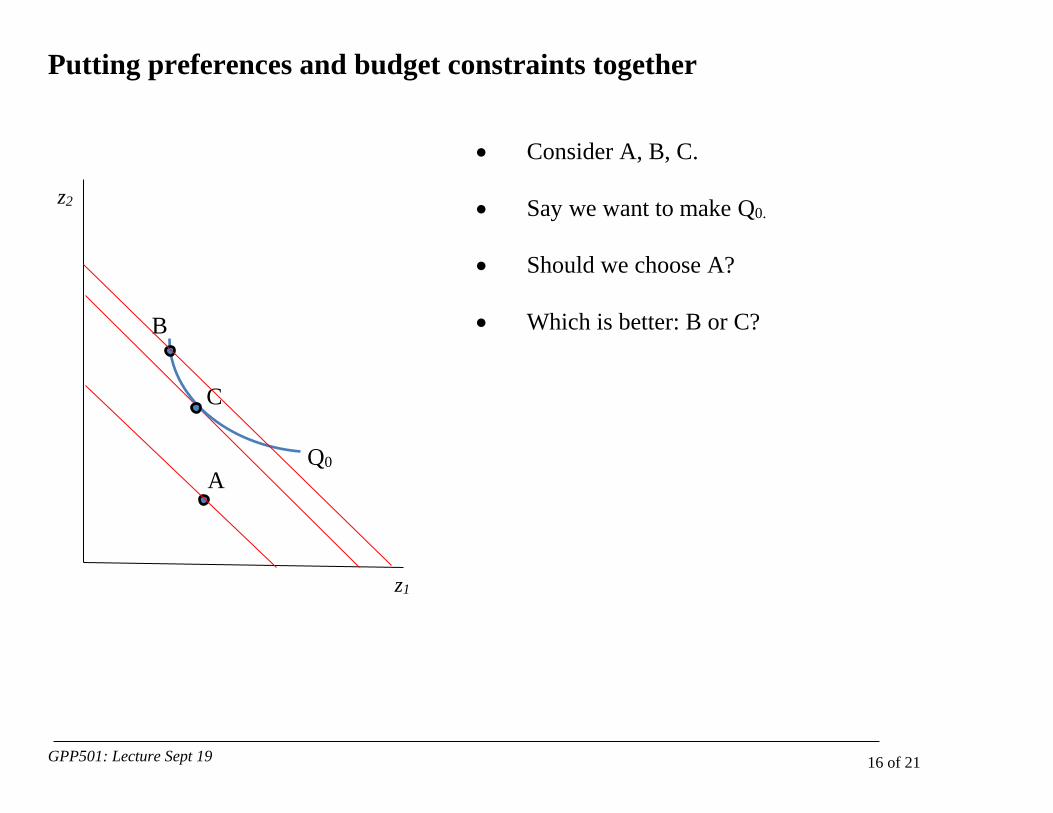
Putting preferences and budget constraints together
Consider A, B, C.
Say we want to make Q0.
Should we choose A?
Which is better: B or C?
z1
z2
C
B
A Q0
GPP501: Lecture Sept 19 17 of 21
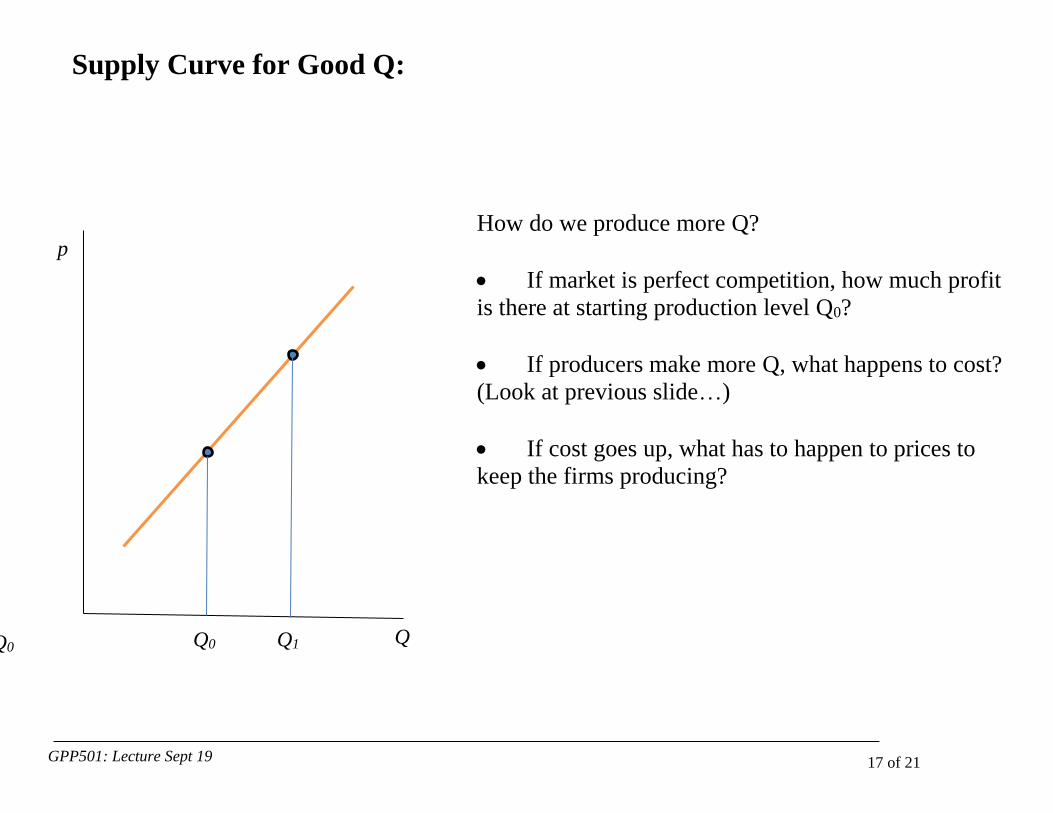
Supply Curve for Good Q:
How do we produce more Q?
If market is perfect competition, how much profit
is there at starting production level Q0?
If producers make more Q, what happens to cost?
(Look at previous slide…)
If cost goes up, what has to happen to prices to
keep the firms producing?
Q
p
Q0 Q0 Q1
GPP501: Lecture Sept 19 18 of 21
Agenda for today:
1. Factors of production
2. Technology and production
3. Supply Curves
4. Market equilibrium
GPP501: Lecture Sept 19 19 of 21
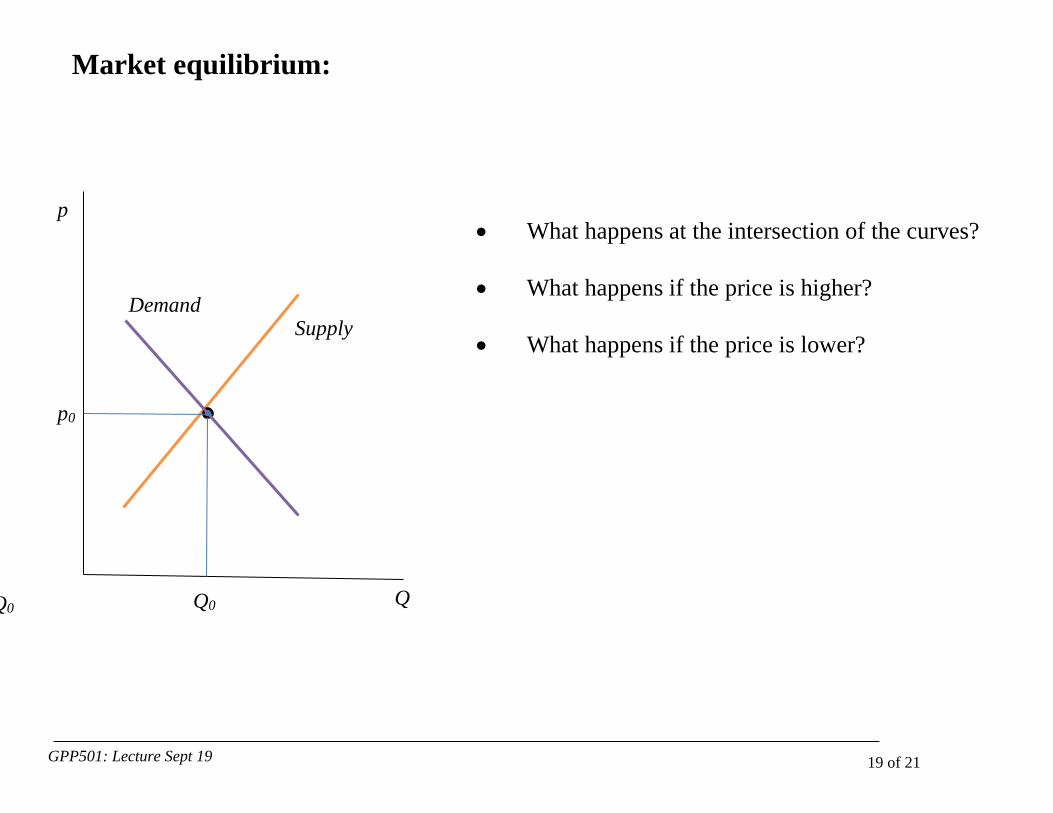
Market equilibrium:
What happens at the intersection of the curves?
What happens if the price is higher?
What happens if the price is lower?
Q
p
Q0 Q0
p0
Supply
Demand
GPP501: Lecture Sept 19 20 of 21
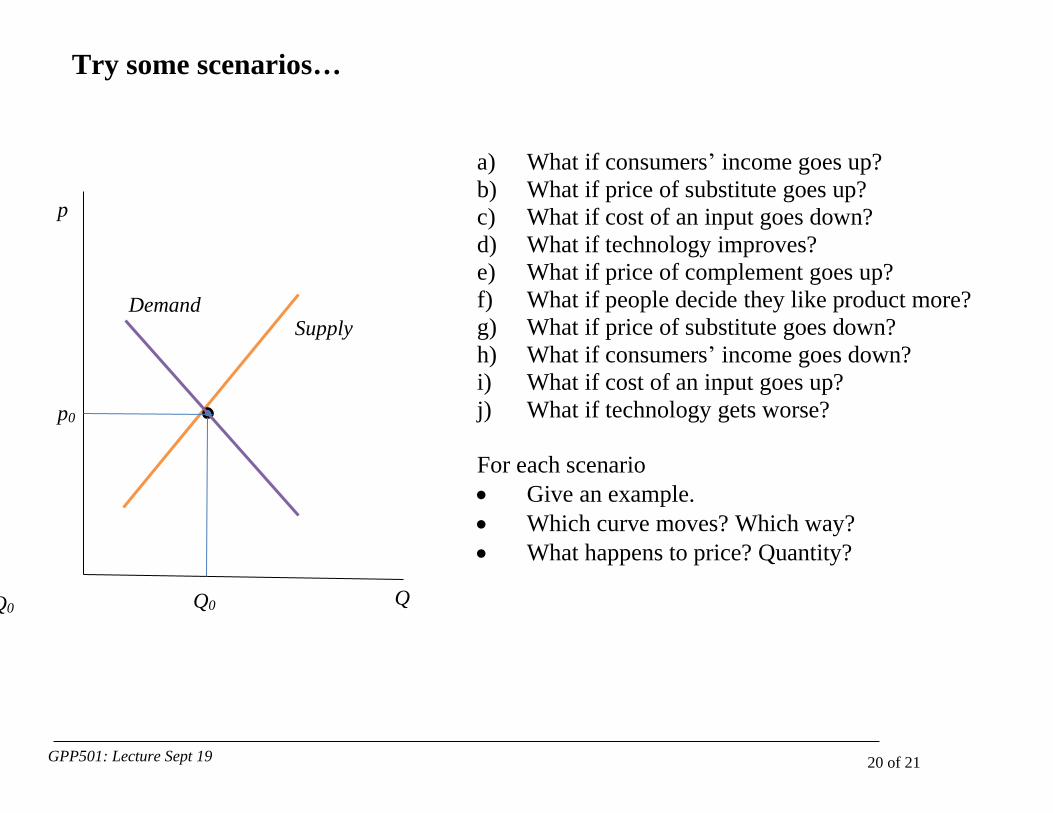
Try some scenarios…
a) What if consumers’ income goes up?
b) What if price of substitute goes up?
c) What if cost of an input goes down?
d) What if technology improves?
e) What if price of complement goes up?
f) What if people decide they like product more?
g) What if price of substitute goes down?
h) What if consumers’ income goes down?
i) What if cost of an input goes up?
j) What if technology gets worse?
For each scenario
Give an example.
Which curve moves? Which way?
What happens to price? Quantity?
Q
p
Q0 Q0
p0
Supply
Demand
GPP501: Lecture Sept 19 21 of 21
For next time…
Read through Green, Riddell, and St-Hilaire (2016).
Just pages 1-24!
Available here.