Embed Size (px)
Citation preview
GOLD STANDARD FINAL
VERIFICATION/CERTIFICATION REPORT
GS Verification/Certification Report N° 2010-DG-05-ME, Rev. 1.2 1 GS_VER_REP-05-10
“MAMAK LANDFILL WASTE MANAGEMENT PROJECT
- TURKEY�” in
TURKEY
Monitoring period: 1/4/2010 to 31/3/2011
Report N° 2011-DG-01-MD
Revision N° 1.2

GOLD STANDARD FINAL VERIFICATION/CERTIFICATION REPORT
GS Verification/Certification Report N° 2011-DG-01-MD, Rev.1.2 2 GS_VER_REP-05-10
Project Title: Country: Estimated VERs (tCO2e):
Mamak landfill waste management project �– Turkey.
Turkey 572,320 annual average over the crediting period
Gold Standard Project ID: Monitoring period: Certified VERs (tCO2e):
GS440 1/4/2010 to 31/3/2011 both days included
484,240
Client: Client contact:
OneCarbon International B.V. Hinrich BORNEBUSCH Report No.: Revision: Date of this report:
2011-DG-01-ME 1.2 04/08/2011 Approved by (Final Report �– DCI Director approval): Date of approval:
Roberto Cavanna
04/08/2011
Methodology Number: Version: Title: Scale SS(s):
ACM0001 AM0025
08.1 of 16/5/2008 10 of 19/10/2007
Consolidated baseline and monitoring methodology for landfill gas project activities. Avoided emissions from organic waste through alternative waste treatment processes.
Large 13, 1
RINA Services S.p.A. (RINA), commissioned by OneCarbon International B.V., has verified the greenhouse gas emission reductions reported for the project activity �“Mamak landfill waste management project - Turkey�” in Turkey, Gold Standard Project ID GS440, for the period 1/4/2010 to 31/3/2011, with regard to the relevant requirements for GS and CDM activities. The verification shall ensure that reported emission reductions are complete and accurate in accordance with applicable GS VER requirements, which refer to CDM rules, in order to be certified. The project was validated by TÜV SÜD Industrie Service GmbH (validation report N° 1175 963-GS revision 3 issued on 21/4/2009) and it was registered on 27/4/2009 under the Gold Standard Project ID GS440. The GHG emission reductions were calculated on the basis of the approved methodology ACM0001, version 08.1, Consolidated baseline and monitoring methodology for landfill gas project activitiesof 16/5/2008, methodology AM0025 version 10, Avoided emissions from organic waste through alternative waste treatment processes of 19/7/2007, and the monitoring plan included in the registered Project Design Document, version 07 of 20/4/2009. In conclusion, it is RINA�’s opinion that the project activity �“Mamak landfill waste management project �– Turkey�”, in �“Turkey�”, as described in the Monitoring Report version 3.1of 11/04/2011, meets all relevant requirements for GS and CDM activities and all relevant host Party criteria and correctly applies the baseline and monitoring methodology ACM0001, �“Consolidated baseline and monitoring methodology for landfill gas project activities�”, version 08.1 of 16/5/2008 and methodology AM0025 �“Avoided emissions from organic waste through alternative waste treatment processes�”, version 10 of 19/10/2007. Hence RINA is able to certify that the emission reductions from the project during the monitoring period 1/4/2010 to 31/3/2011 amount to 484,240 tCO2e (1/4/2010 to 31/12/2010 371,556 tCO2eand 1/1/2011 to 31/3/2011 112,684 tCO2e). Work carried out by:
Rita Valoroso, Sergio Degener, Hasan Zor No distribution without permission from the Client or
organizational unit responsible
Strictly confidential
Unrestricted distribution Work verified by (Final Report �– CRT person responsible approval)
Keywords:
Paolo Teramo
Climate Change, Kyoto Protocol, Verification, Gold Standard
GOLD STANDARD FINAL VERIFICATION/CERTIFICATION REPORT
GS Verification/Certification Report N° 2011-DG-01-MD, Rev.1.2 3 GS_VER_REP-05-10
Abbreviations AF Adjustment Factor BE Baseline Emissions CAR Corrective Action RequestCDM Clean Development Mechanism CDM M&P Modalities and Procedures CDM CEF Carbon Emission FactorCH4 Methane CR Clarification Request CO2 Carbon dioxide CO2e Carbon dioxide equivalent CRT Coordination and Technical Control Staff DCI Certification Division of RINA Services Spa DNA Designated National Authority DOE Designated Operational Entity EB Executive Board ER Emission Reductions GHG(s) Greenhouse gas(es) GS Gold Standard GWP Global Warming Potential IPCC Intergovernmental Panel on Climate Change LFG Landfill gas LoA Letter of Approval MoV Means of VerificationMP Monitoring Plan MR Monitoring Report NGO Non-governmental Organization ODA Official Development Assistance PDD Project Design Document PE Project Emission PNUM Piyasa Mali Uzla trma Merkezi �– Market Financial Settlement Center PP(s) Project Participant(s) Ref. Document Reference RINA RINA Services Spa SDI Sustainable Development Indicator SS(s) Sectoral Scope(s) UNFCCC United Nations Framework Convention on Climate Change VERs Verified Emission Reduction(s) VVM Validation and Verification Manual
GOLD STANDARD FINAL VERIFICATION/CERTIFICATION REPORT
GS Verification/Certification Report N° 2011-DG-01-MD, Rev.1.2 4 GS_VER_REP-05-10
Table of Contents Page
1 INTRODUCTION ................................................................................................................... 5 1.1 Objective 5 1.2 Scope 5
2 METHODOLOGY ................................................................................................................... 5 2.1 Desk Review 6 2.2 On-site assessment 9 2.3 Resolution of outstanding issues 10 2.4 Internal quality control 12 2.5 Verification team and the technical reviewer(s) 12
3 VERIFICATION FINDINGS .................................................................................................. 12 3.1 Description of the project activity 12 3.2 Remaining issues (FARs) from previous validation or verification 13 3.3 Project implementation 13 3.4 Methodology for determining Emission Reductions. 13
4 VERIFICATION AND CERTIFICATION OPINION ............................................................... 50 Appendix A: Gold Standard Verification Protocol
GOLD STANDARD FINAL VERIFICATION/CERTIFICATION REPORT
GS Verification/Certification Report N° 2011-DG-01-MD, Rev.1.2 5 GS_VER_REP-05-10
1 INTRODUCTION
OneCarbon International B.V. has commissioned RINA to carry out the verification and certification of emission reductions reported for the registered �“Mamak landfill waste management project - Turkey�” project in Turkey, Gold Standard Project ID GS440, for the period 1/4/2010 to 31/3/2011. This report summarizes the findings of the verification of the project, performed on the basis of GS VER requirements, which refer to CDM rules, as well as criteria given to provide for consistent project operations, monitoring and reporting.
1.1 Objective
The objective of the verification is to have an independent review ex post determination by a Designated Operational Entity (DOE) of the monitored reductions in GHG emissions that have occurred as a result of the registered GS project activity during a defined monitoring period and to monitor the impact of project activity on sustainable development, throughout the monitoring of the non-neutral Sustainable Development Indicators and moreover to monitor all the mitigation and compensation measures put in place. Certification is the written assurance by the DOE that, during a specific time period, a proposed GS project activity achieved the reductions in anthropogenic emissions by sources of GHGs as verified and that all the defined Sustainable Development Indicators to be monitored have been monitored according to the sustainability monitoring plan and that all the mitigation measures forecast have been correctly and effectively implemented. The objective of this verification/certification was to verify and certify emission reductions and effective implementation of the monitoring of sustainable development indicators and mitigation measures, reported for the �“Mamak landfill waste management project - Turkey�” project in Turkey for the period 1/4/2010 to 31/3/2011.
1.2 Scope
The verification scope is: to verify that actual monitoring systems and procedures are in compliance with the monitoring
systems and procedures described in the monitoring plan; to evaluate the GHG emission reduction data and express a conclusion with a reasonable level
of assurance about whether the reported GHG emission reduction data is free from material misstatement;
to verify that reported GHG emission data is sufficiently supported by evidence; to evaluate whether all the mitigation measures have been effectively put in place according to
the monitoring plan and that all the sustainable development indicators have been correctly monitored.
The verification shall ensure that reported emission reductions are complete and accurate in accordance with applicable GS VER requirements which refer to CDM rules, in order to be certified. UNFCCC criteria for CDM refer to Article 12 of the Kyoto Protocol, the CDM modalities and procedures, and the subsequent decisions by the CDM Executive Board. The GS criteria refer to GS version 1 documentation /9/ /10/ and their supporting annexes.
2 METHODOLOGY
The verification was conducted using RINA procedures in line with the requirements specified in the GS Requirements, CDM M&P, the latest version of the CDM Validation and Verification Manual, and relevant decisions of the COP/MOP and the CDM EB and applying standard auditing techniques. The verification consisted of the following three phases:
GOLD STANDARD FINAL VERIFICATION/CERTIFICATION REPORT
GS Verification/Certification Report N° 2011-DG-01-MD, Rev.1.2 6 GS_VER_REP-05-10
Desk review; On-site assessment: The resolution of outstanding issues and the issuance of the final verification report and
certification. The following sections outline each step in more detail.
2.1 Desk Review
The monitoring report, version 3.1 of 11/04/2011 /2/, the emission reduction calculations provided in the form of a spreadsheet, 110411_ER_Calculation_Mamak_3rdPV /17/, were assessed as part of the verification, as well all the supporting documents listed in the below table /1 �– 72/. In addition, the Project Design Document (PDD) /1/, in particular as regards the baseline estimations and the monitoring plan, the previous verification reports revision 0 of 14/7/2009 /15/, revision 3.0 of 14/10/2010 and the validation report, revision 3 of 21/4/2009 /14/ for the project, were reviewed. The following table lists the documentation that was reviewed during the verification. /1/ Ecofys Netherlands BV: GS CDM-PDD for project activity �“Mamak landfill waste management
project - Turkey�” in Turkey, version 07 of 20/4/2009. /2/ ORBEO: Monitoring report for project activity �“Mamak landfill waste management project -
Turkey�” in Turkey, version 3.1 of 11/04/2011 related to the monitoring period 1/4/2010 to 31/3/2011.
/3/ CDM Executive Board: Validation and Verification Manual, version 01.2 of 30/07/2010
/4/ CDM Executive Board: Baseline and monitoring methodology ACM0001, Consolidated baseline and monitoring methodology for landfill gas project activities, version 08.1 of 16/5/2008.
/5/ CDM Executive Board: Baseline and monitoring methodology AM0025, Avoided emissions from organic waste through alternative waste treatment processes, version 10 of 19/10/2007.
/6/ CDM Executive Board: methodological tool �“Tool to determine emissions from flaring gases containing methane�”, version 1 of December 2006.
/7/ CDM Executive Board: methodological tool �“Tool to calculate baseline, project and/or leakage emissions from electricity consumption�”, version 1 of 16/5/2008.
/8/ CDM Executive Board: methodological tool �“Tool to determine methane emissions avoided from disposal of waste at a solid waste disposal site�”, version 4 of 2/8/2008.
/9/ Gold Standard: The Gold Standard validation and verification manual for voluntary offset projects, of June 2007.
/10/ Gold Standard: Voluntary emission reductions (VERs) Manual for project developers, version 5 of May 2006.
/11/ CDM Executive Board: Methodological Tool �“Tool to calculate the emission factor for an electricity system�”, version 01 of 19/10/2007.
/12/ OneCarbon International B.V. / Orbeo �– Gold Standard Monitoring Manual version 2.0 of April 2010.
/13/ DNV �– Verification/Certification Report No. 2009-9109 rev. 0 of 14/7/2009 (1st verification) �– Monitoring period from 1/5/2007 to 31/3/2009.
/14/ TUV SUD Industrie Service GmbH �– Gold Standard Validation Report No. 1175 963-GS rev. 3 of 21/4/2009.
/15/ RINA Services Spa �– Gold Standard Final Verification/Certification Report No. 2010-DG-05-ME revision 3.0 of 14/10/2010 (2nd verification) Monitoring period 01/04/2009 �– 31/03/2010
/16/ ORBEO �– Emission reduction calculation, 110411_ER_Calculation_Mamak_3rdPV of 11/04/2011.
/17/ ITC Invest Trading & Consulting AG �– Booster data log book, Booster 1, 110323_Transfer-Booster1-P1.xlsx from 01/04/2010 to 31/07/2010, 110323_Transfer-Booster1-P2.xlsx from 01/08/2010 to 31/12/2010, 110411_Transfer-Booster1-P3.xlsx from 01/01/2011 to 31/03/2011.
GOLD STANDARD FINAL VERIFICATION/CERTIFICATION REPORT
GS Verification/Certification Report N° 2011-DG-01-MD, Rev.1.2 7 GS_VER_REP-05-10
/18/ ITC Invest Trading & Consulting AG �– Booster data log book, Booster 2, 110323_Transfer-Booster2-P1.xlsx from 01/04/2010 to 31/07/2010, 110325_Transfer-Booster2-P2.xlsx from 01/08/2010 to 31/12/2010, 110411_Transfer-Booster2-P3.xlsx from 01/01/2011 to 31/03/2011.
/19/ ITC Invest Trading & Consulting AG �– Booster data log book, Booster 3, 110325_Transfer-Booster3-P1.xlsx from 01/04/2010 to 31/07/2010, 110325_Transfer-Booster3-P2.xlsx from 01/08/2010 to 31/12/2010, 110411_Transfer-Booster3-P3.xlsx from 01/01/2011 to 31/03/2011.
/20/ ITC Invest Trading & Consulting AG �– Boosters raw data from 01/04/2010 to 31/03/2011 (010410GVS.csv to 310311GVS.csv
/21/ ITC Invest Trading & Consulting AG �– Internal records daily monitoring with measurement on the conveyor band from 1/4/2010 to 31/3/2011).
/22/ ITC Invest Trading & Consulting AG �– Internal records weekly samples (52 samples) /23/ ITC Invest Trading & Consulting AG �– Waste composition for the monitoring period
01/04/2010 to 31/03/2011 - 110107_Mamak_Digester_Waste_Composition.xls /24/ ITC Invest Trading & Consulting AG �– Internal records operating hours engines GM1to GM16
�– monitoring period 01/04/2010 to 31/03/2011 /25/ PNUM Piyasa Mali Uzla trma Merkezi (Market Financial Settlement Center) �– Monthly
protocols for power supplied to and by the grid, from April 2010 to March 2011. /26/ Netes Mühendislik Ve Di Tic. Ltd. ti. �– Calibration certificate n. M11020148 of 02/2011
(Date of calibration 04/02/2011) �– Pressure transmistter ABB 261GSFJT821 sn 261GS6505018203
/27/ Netes Mühendislik Ve Di Tic. Ltd. ti. �– Calibration certificate n. M10091344 of 09/2010 (Date of calibration 07/09/2010) �– Flow meter SMAR 316l sn. U324889/204886-05.
/28/ Türk Standardlari Enstitüsü �– Calibration certificate n. 10S1885 of 10/2010 (date of calibration 20/10/2010) Temperature transmitter ELIMKO PT-100 RT03-1P08-30 sn 08/5297.
/29/ Uzmanlar Metroloji Servisi - Calibration certificate n. C11S27285 of 02/2011 (date of calibration 17/02/2011) Temperature transmitter ELIMKO PT-100 RT03-1P08-30 sn. 08/5292.
/30/ Türk Standardlari Enstitüsü �– Calibration certificate n. 10S1884 of 10/2010 (date of calibration 20/10/2010) Temperature transmitter ELIMKO PT-100 RT03-1P06-7,5-Tr sn 08/33891.
/31/ Türk Standardlari Enstitüsü �– Calibration certificate n. 10S1887 of 10/2010 (date of calibration 20/10/2010) Temperature transmitter ELIMKO PT-100 RT03-1P06-7,5-Tr sn 08/33887.
/32/ Uzmanlar Metroloji Servisi - Calibration certificate n. C11S28514 of 02/2011 (date of calibration 25/02/2011) Temperature transmitter NOVA Z OR03-B1H09-15 sn. 0802-01120.
/33/ Uzmanlar Metroloji Servisi - Calibration certificate n. C11S27280 of 02/2011 (date of calibration 17/02/2011) Temperature transmitter ELIMKO PT-100 RT103-1PO8-50 sn. 08/14625T.
/34/ Uzmanlar Metroloji Servisi - Calibration certificate n. C11S27282 of 02/2011 (date of calibration 17/02/2011) Temperature transmitter ELIMKO PT-100 RT103-1PO6-7,5Tr sn. 08/33885.
/35/ Netes Mühendislik Ve Di Tic. Ltd. ti. �– Calibration certificate n. M100960775 of 06/2010 (Date of calibration 09/06/2010) �– Pressure transmitter KELLER PR-23 sn. 130341.
/36/ Uzmanlar Metroloji Servisi - Calibration certificate n. A10P16730 of 09/2010 (date of calibration 17/09/2010) Pressure transmitter KELLER PR-23 sn. 145076.
/37/ Uzmanlar Metroloji Servisi - Calibration certificate n. A10P16731 of 09/2010 (date of calibration 17/09/2010) Pressure transmitter KELLER PR-23 sn. 145075.
/38/ Netes Mühendislik Ve Di Tic. Ltd. ti. �– Calibration certificate n. M100960777 of 06/2010 (Date of calibration 09/06/2010) �– Pressure transmitter WIKA sn. 2603LPH.
/39/ Uzmanlar Metroloji Servisi - Calibration certificate n. K11B27135 of 02/2011 (date of calibration 09/02/2011) Pressure transmitter KELLER PAA-21S sn. 128863.
/40/ ABB Spa �– Calibration Record n. 1100258644 of 01/12/2010 Pressure transmitter ABB 2600T sn. 6410030690.
/41/ Uzmanlar Metroloji Servisi - Calibration certificate n. E11B29227 of 03/2011 (date of calibration 04/03/2011) Pressure transmitter KELLER PAA-21S sn. 128865.
/42/ Netes Mühendislik Ve Di Tic. Ltd. ti. �– Calibration certificate n. M100960776 of 06/2010 (Date of calibration 09/06/2010) �– Pressure transmitter WIKA S-10 sn. 2603LPJ.
GOLD STANDARD FINAL VERIFICATION/CERTIFICATION REPORT
GS Verification/Certification Report N° 2011-DG-01-MD, Rev.1.2 8 GS_VER_REP-05-10
/43/ Uzmanlar Metroloji Servisi - Calibration certificate n. M11S29225 of 03/2011 (date of calibration 04/03/2011) Temperature transmitter ELIMKO TC02-1S4Y10-50/10-R1/2-Tr sn. 08/26236.
/44/ Türk Standardlari Enstitüsü �– Calibration certificate n. 11G0009 of 02/2011 (date of calibration 23/02/2011) Gas analyzer ULTRAMAT 23 sn N1-T4-0144.
/45/ Türk Standardlari Enstitüsü �– Calibration certificate n. 11G0003 of 02/2011 (date of calibration 04/02/2011) Gas analyzer ULTRAMAT 23 sn N1-X4-365.
/46/ Türk Standardlari Enstitüsü �– Calibration certificate n. 11G0004 of 02/2011 (date of calibration 09/02/2011) Gas analyzer ULTRAMAT 23 sn N1-A0-772.
/47/ S-E-G Instrument AB �– Load cell certificate of 18/10/2010 Balance SEG KN4 sn A0928005 /48/ Uzmanlar Metroloji Servisi - Calibration certificate n. C10T6152 of 04/2010 (date of
calibration 08/04/2010) Balance DIKOMSAN DT-600 sn. 2779. /49/ Orsa Elektronik �– Declaration for additional control on balance DIKOMSAN DT-600 sn.
ISXKDT070763 of 14/04/2010. /50/ FIRAT Plastik Kauçun San. ve Tic. A. �– Invoice n. B519827 of 11/01/2011, invoice n.
B513168 of 11/10/2010, invoice n. CG326373 of 02/10/2010, invoice n. CG307213 of 17/06/2010, invoice n. CG306796 of 15/06/2010, invoice n. CG305931 of 10/06/2010, invoice n. CG302265 of 19/05/2010, invocie n. CG300337 of 07/05/2010, n. CG326751 of 04/10/2010, n. CG307214 of 17/06/2010, n. CG326769 of 04/10/2010 (installed pipes).
/51/ ITC Invest Trading & Consulting AG �– Terraces mad updating for the monitoring period 01/04/2010 to 31/03/2011.
/52/ ITC Invest Trading & Consulting AG �– Internal training and fire exercise of 01/10/2010 (list of attendees)
/53/ ITC Invest Trading & Consulting AG �– Internal training Health and Safety of 13/01/2011 (list of attendees)
/54/ Ministry of Education - Certificate for use machine operator n. 2011-2827 of 30/03/Levent Azapci, n. 2011-2828 of 30/03/2011 Baris Karaman, n. 2011-2825 of 30/03/2011 Isa Boduroglu.
/55/ Social Security Agency �– Entry declaration of the insured Merdan Bulduk �– 31/03/2011 /56/ Social Security Agency �– List of employees, register n. 235110202111706300624-79 date of
adoption of the document 03/2011. /57/ ITC Invest Trading & Consulting AG �– Awarness campaign neighboring areas in the Golbasi
Municipality�– Waste separation �– 23/02/2010 /58/ Government Rules n° 22000 dated 24/7/1994 �– Requirement for measurement equipment /59/ ITC Invest Trading & Consulting AG �– List of visits to Mamak plant /60/ AHED PVC Waterstops �– Quality control certification by Turkish Standards Institute. /61/ Heytex Neugersdorf GmbH �– Certificate of quality DIN EN 10204 2.2. dated 2/12/2008
(membrane suitable for biogas applications). /62/ ITC Invest Trading & Consulting AG �– Internal procedure PRO-006 of 22/03/2010 for waste
sampling. /63/ ECONORM TEKNIK SERVIS HIZMETLERI Ltd �– Determination of methane and nitrous oxide
emissions from stationary sources. /64/ ABB Spa �– Calibration Record n. 1707173118 of 13/09/2007 Flow meter ABB 2600T sn.
6407022942. /65/ ABB Spa �– Calibration Record n. 1707221450 of 09/11/2007 Flow meter ABB 2600T sn.
6407029726. /66/ ABB Spa �– Calibration Record n. 1090266905 of 16/12/2009 Flow meter ABB 2600T sn.
2409029297. /67/ Uzmanlar Metroloji Servisi - Calibration certificate n. C11S28516 of 02/11 (date of calibration
25/02/2011) temperature transmitter ELIMKO RT03-1P08-5-U-Tr sn 08/14624 T. /68/ Ekotest �– Çevre Dani manlik Ölçum Hizmetleri Ltd, ti �– stack gas analysis Ref. No. GEN-
2010-021 of 24/04/2011 (analysis don on 12/01/2011). /69/ Ekotest �– Çevre Dani manlik Ölçum Hizmetleri Ltd, ti �– stack gas analysis Ref. No. GEN-
2010-353 of 27/09/2010 (analysis don on 13/09/2010). /70/ Ekotest �– Çevre Dani manlik Ölçum Hizmetleri Ltd, ti �– stack gas analysis Ref. No. GEN-
GOLD STANDARD FINAL VERIFICATION/CERTIFICATION REPORT
GS Verification/Certification Report N° 2011-DG-01-MD, Rev.1.2 9 GS_VER_REP-05-10
2010-020 of 24/01/2011 (analysis don on 22/11/2010). /71/ Ekotest �– Çevre Dani manlik Ölçum Hizmetleri Ltd, ti �– stack gas analysis Ref. No. GEN-
2010-096 of 05/04/2011 (analysis don on 29/03/2011). /72/ Uzmanlar Metroloji Servisi - Calibration certificate n. C11S27283 of 02/11 (date of calibration
17/02/2011) temperature transmitter ELIMKO RT02-1K09-70 sn 09/23185.
2.2 On-site assessment
On 03-04/05/2011, RINA visited the Mamak plant located in Ankara. During the on-site assessment of the project, RINA assessed the implementation and operation of the proposed project activity, reviewed the information flows for generating, aggregating and reporting the monitoring parameters, interviewed key personnel of the plant to confirm the operational and data collection procedures, cross-checked between information provided in the monitoring report and data plant, checked the monitoring equipment including calibration performance, reviewed calculations and assumptions made in determining the GHG data and emission reductions, checked the quality control and quality assurance procedures in place to prevent or identify and correct any errors or omissions in the reported monitoring parameters. Further, RINA checked the correct and effective implementation of the mitigation measures foreseen in the sustainability plan, to prevent violation or the risk of violating a safeguarding principle of the �“Do No Harm�” assessment or to �“neutralize�” a sustainable development indicator. RINA has interviewed the following key personnel during the on-site inspection of the plant. All the stakeholders interviewed by RINA were conversant with English, except for the employees listed in the below table at point /f/. In that case the RINA local expert, Mr. Hasan Zor, was able to interview them in local language and translate into English to the verification team. Regarding the documents collected for verification, the PP has submitted some documents in English language and other ones in Turkish language; the latest ones were checked and translated by the RINA local expert. The key personnel interviewed and the main topics of the interviews are summarized in the table below. Date Name and Role Organization Topic/a/ 03-04/05/2011 Tugba Kirer
Environment Manager
ITC Invest Trading & Consulting A.G.
Monitoring plan Monitoring methodology Monitoring data Implementation status of the project Monitoring equipments and operation Calibration certificates Emission Reductions calculation Monitoring of Gold Standard Parameters
/b/ 03-04/05/2011 Fikret Sert Project Manager
ITC Invest Trading & Consulting A.G.
/c/ 03-04/05/2011 Inga Fischer Project Manager
ORBEO
/d/ 03-04/05/2011 Hinrich Bornebusch Monitoring, Verification and Review Team
ORBEO
/e/ 04/05/2011 Erdogan Gogen General Manager
ITC Invest Trading & Consulting A.G.
Implementation status of the project
/f/ 04/05/2011 Aylin Alpagot Merdan Bulduk Songul Yuruk Musa Bulduk Yuksel Bulduk Nesimi Karakus Employees
ITC Invest Trading & Consulting A.G.
Stakeholder meeting
GOLD STANDARD FINAL VERIFICATION/CERTIFICATION REPORT
GS Verification/Certification Report N° 2011-DG-01-MD, Rev.1.2 10 GS_VER_REP-05-10
2.3 Resolution of outstanding issues
The objective of this phase of the verification is to resolve any outstanding issues which need to be clarified for RINA's positive conclusion on the monitoring report and emission reductions. To guarantee transparency, a verification protocol has been customized for the project. The protocol shows in a transparent manner the requirements, means of verification and the results from verifying the identified criteria. The verification protocol consists of three tables; the different columns in these tables are described in the figure below (see Figure 1). The completed verification protocol is enclosed in Appendix A to this report. A corrective action request (CAR) is raised if one of the following occurs:
Non-conformities with the monitoring plan or methodology are found in monitoring and reporting, or if the evidence provided to prove conformity is insufficient;
Mistakes have been made in applying assumptions, data or calculations of emission reductions that will impair the estimate of emission reductions;
Issues identified in a FAR during validation to be verified during verification have not been resolved by the project participants.
A clarification request (CR) is raised if information is insufficient or not clear enough to determine whether the applicable GS VER requirements which refer to CDM rules, and have been met.
CARs, CRs identified are included in the verification protocol in Appendix A of this report.
GOLD STANDARD FINAL VERIFICATION/CERTIFICATION REPORT
GS Verification/Certification Report N° 2011-DG-01-MD, Rev.1.2 11 GS_VER_REP-05-10
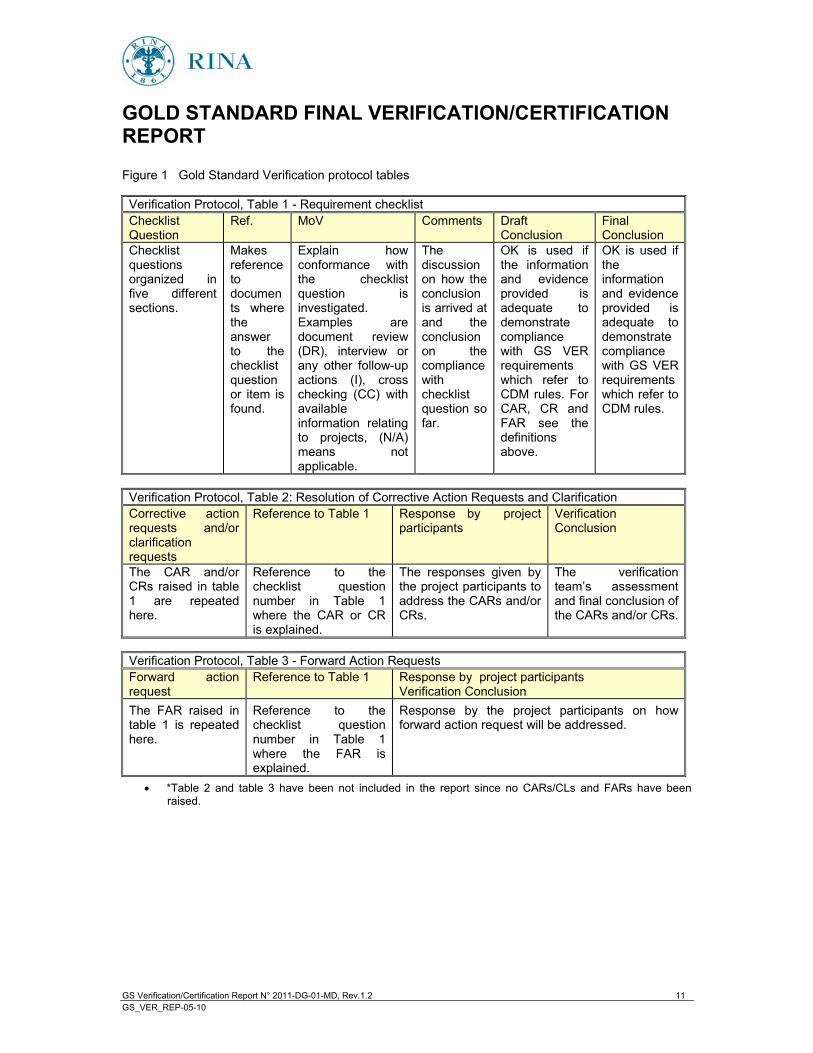
Figure 1 Gold Standard Verification protocol tables Verification Protocol, Table 1 - Requirement checklist Checklist Question
Ref. MoV Comments Draft Conclusion
Final Conclusion
Checklist questions organized in five different sections.
Makes reference to documents where the answer to the checklist question or item is found.
Explain how conformance with the checklist question is investigated. Examples are document review (DR), interview or any other follow-up actions (I), cross checking (CC) with available information relating to projects, (N/A) means not applicable.
The discussion on how the conclusion is arrived at and the conclusion on the compliance with checklist question so far.
OK is used if the information and evidence provided is adequate to demonstrate compliance with GS VER requirements which refer to CDM rules. For CAR, CR and FAR see the definitions above.
OK is used if the information and evidence provided is adequate to demonstrate compliance with GS VER requirements which refer to CDM rules.
Verification Protocol, Table 2: Resolution of Corrective Action Requests and Clarification Corrective action requests and/or clarification requests
Reference to Table 1 Response by project participants
Verification Conclusion
The CAR and/or CRs raised in table 1 are repeated here.
Reference to the checklist question number in Table 1 where the CAR or CR is explained.
The responses given by the project participants to address the CARs and/or CRs.
The verification team�’s assessment and final conclusion of the CARs and/or CRs.
Verification Protocol, Table 3 - Forward Action Requests Forward action request
Reference to Table 1 Response by project participants Verification Conclusion
The FAR raised in table 1 is repeated here.
Reference to the checklist question number in Table 1 where the FAR is explained.
Response by the project participants on how forward action request will be addressed.
*Table 2 and table 3 have been not included in the report since no CARs/CLs and FARs have been raised.
GOLD STANDARD FINAL VERIFICATION/CERTIFICATION REPORT
GS Verification/Certification Report N° 2011-DG-01-MD, Rev.1.2 12 GS_VER_REP-05-10
2.4 Internal quality control
All the revisions of the verification report, before being submitted to the client, were subjected to an independent internal technical review to confirm that all verification activities had been completed according to the pertinent RINA instructions. The technical review was performed by a technical reviewer(s) qualified in accordance with RINA�’s qualification scheme for CDM/GS validation and verification.
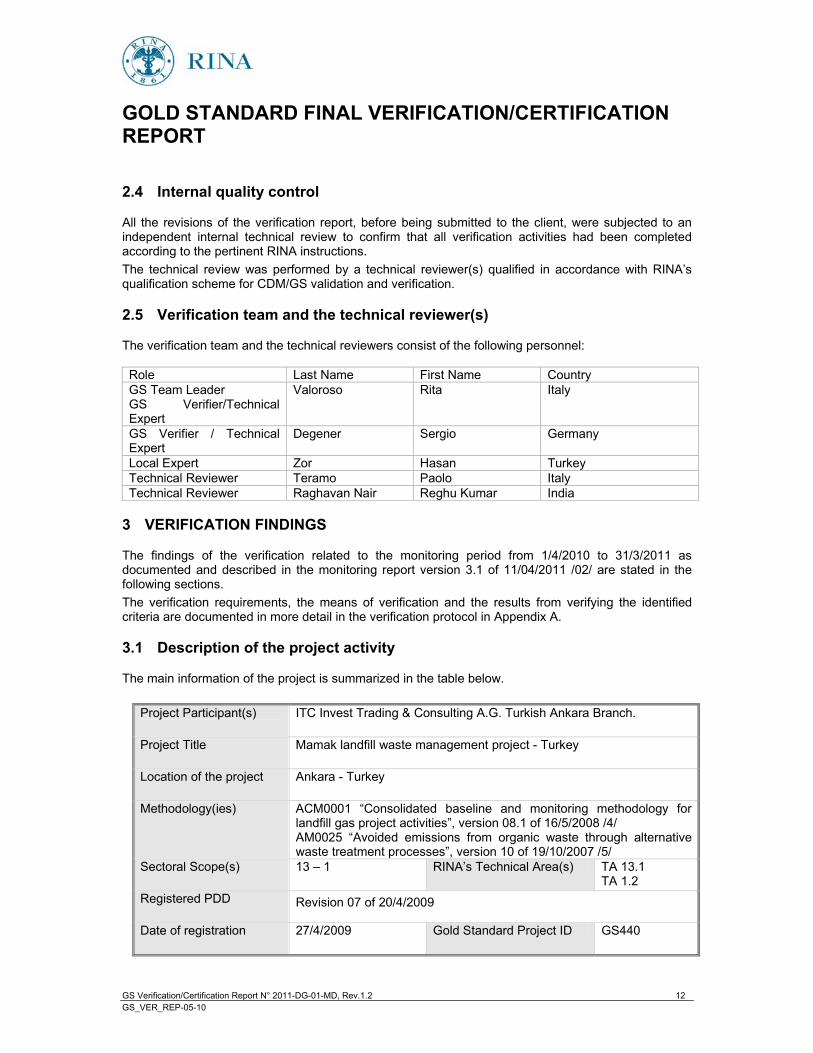
2.5 Verification team and the technical reviewer(s)
The verification team and the technical reviewers consist of the following personnel: Role Last Name First Name Country GS Team Leader GS Verifier/Technical Expert
Valoroso Rita Italy
GS Verifier / Technical Expert
Degener Sergio Germany
Local Expert Zor Hasan Turkey Technical Reviewer Teramo Paolo Italy Technical Reviewer Raghavan Nair Reghu Kumar India
3 VERIFICATION FINDINGS
The findings of the verification related to the monitoring period from 1/4/2010 to 31/3/2011 as documented and described in the monitoring report version 3.1 of 11/04/2011 /02/ are stated in the following sections. The verification requirements, the means of verification and the results from verifying the identified criteria are documented in more detail in the verification protocol in Appendix A.
3.1 Description of the project activity
The main information of the project is summarized in the table below.
Project Participant(s) ITC Invest Trading & Consulting A.G. Turkish Ankara Branch.
Project Title Mamak landfill waste management project - Turkey
Location of the project Ankara - Turkey
Methodology(ies) ACM0001 �“Consolidated baseline and monitoring methodology for landfill gas project activities�”, version 08.1 of 16/5/2008 /4/ AM0025 �“Avoided emissions from organic waste through alternative waste treatment processes�”, version 10 of 19/10/2007 /5/
Sectoral Scope(s) 13 �– 1 RINA�’s Technical Area(s) TA 13.1 TA 1.2
Registered PDD Revision 07 of 20/4/2009
Date of registration 27/4/2009 Gold Standard Project ID GS440
GOLD STANDARD FINAL VERIFICATION/CERTIFICATION REPORT
GS Verification/Certification Report N° 2011-DG-01-MD, Rev.1.2 13 GS_VER_REP-05-10
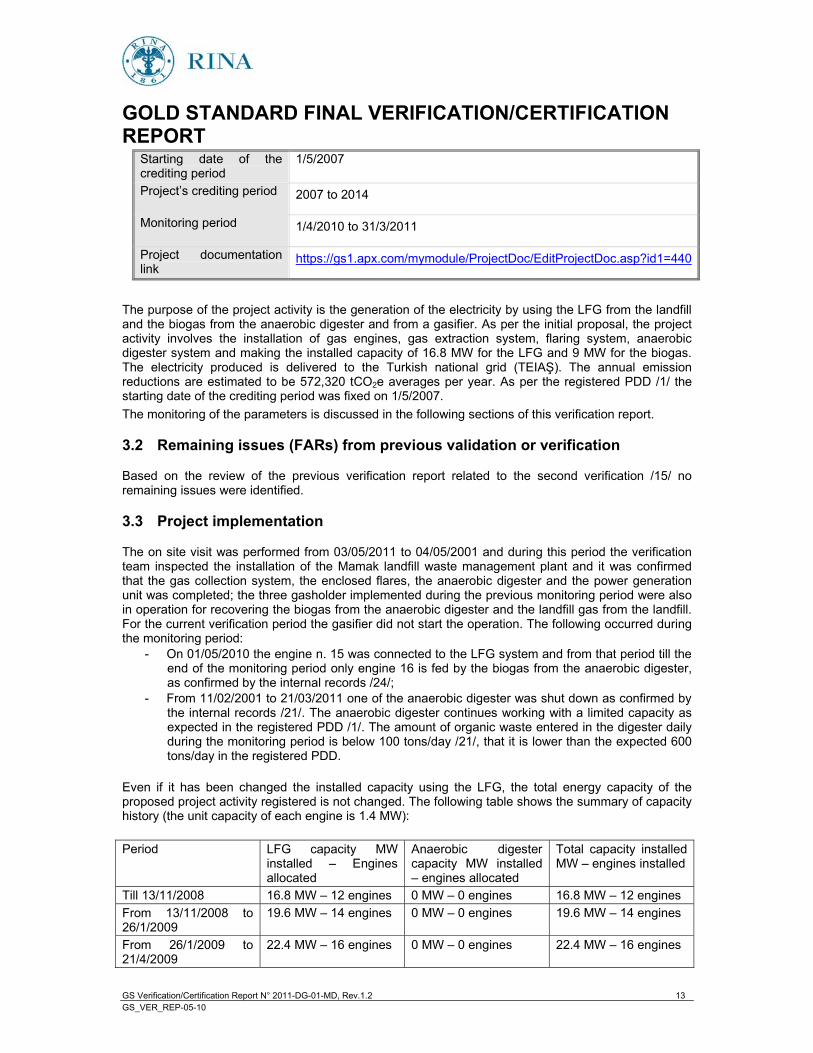
Starting date of the crediting period
1/5/2007
Project�’s crediting period 2007 to 2014
Monitoring period 1/4/2010 to 31/3/2011
Project documentation link
https://gs1.apx.com/mymodule/ProjectDoc/EditProjectDoc.asp?id1=440
The purpose of the project activity is the generation of the electricity by using the LFG from the landfill and the biogas from the anaerobic digester and from a gasifier. As per the initial proposal, the project activity involves the installation of gas engines, gas extraction system, flaring system, anaerobic digester system and making the installed capacity of 16.8 MW for the LFG and 9 MW for the biogas. The electricity produced is delivered to the Turkish national grid (TEIA ). The annual emission reductions are estimated to be 572,320 tCO2e averages per year. As per the registered PDD /1/ the starting date of the crediting period was fixed on 1/5/2007. The monitoring of the parameters is discussed in the following sections of this verification report.
3.2 Remaining issues (FARs) from previous validation or verification
Based on the review of the previous verification report related to the second verification /15/ no remaining issues were identified.
3.3 Project implementation
The on site visit was performed from 03/05/2011 to 04/05/2001 and during this period the verification team inspected the installation of the Mamak landfill waste management plant and it was confirmed that the gas collection system, the enclosed flares, the anaerobic digester and the power generation unit was completed; the three gasholder implemented during the previous monitoring period were also in operation for recovering the biogas from the anaerobic digester and the landfill gas from the landfill. For the current verification period the gasifier did not start the operation. The following occurred during the monitoring period:
- On 01/05/2010 the engine n. 15 was connected to the LFG system and from that period till the end of the monitoring period only engine 16 is fed by the biogas from the anaerobic digester, as confirmed by the internal records /24/;
- From 11/02/2001 to 21/03/2011 one of the anaerobic digester was shut down as confirmed by the internal records /21/. The anaerobic digester continues working with a limited capacity as expected in the registered PDD /1/. The amount of organic waste entered in the digester daily during the monitoring period is below 100 tons/day /21/, that it is lower than the expected 600 tons/day in the registered PDD.
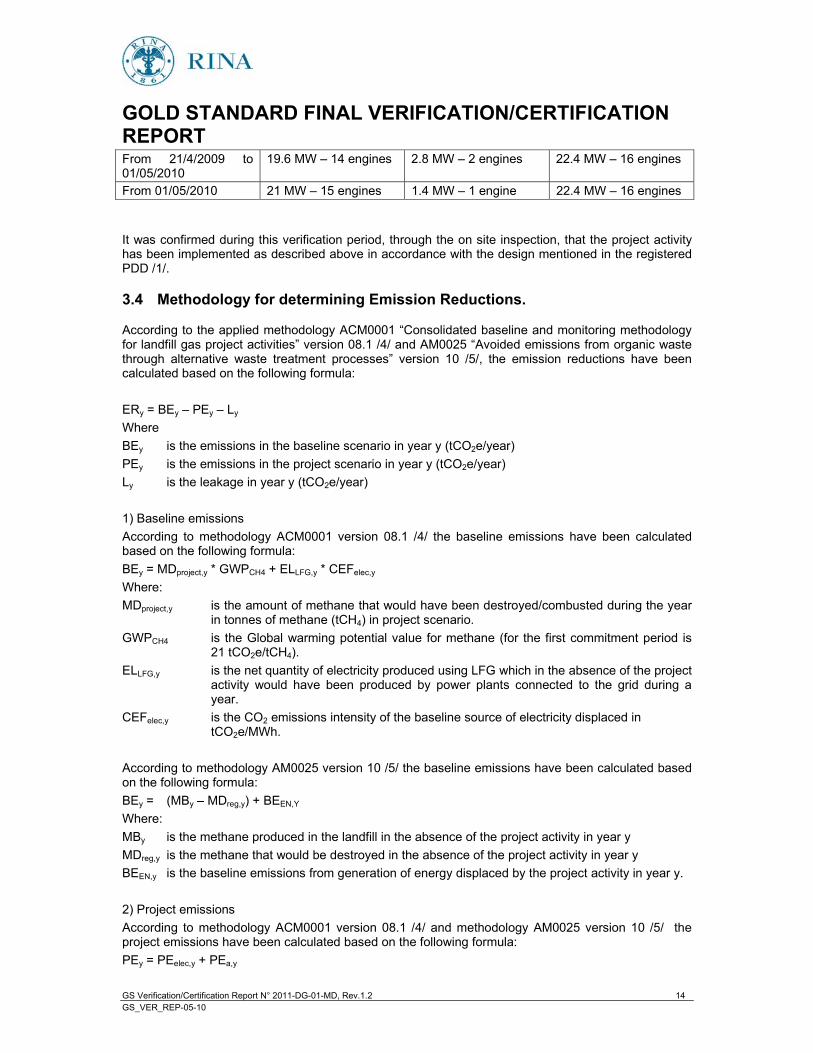
Even if it has been changed the installed capacity using the LFG, the total energy capacity of the proposed project activity registered is not changed. The following table shows the summary of capacity history (the unit capacity of each engine is 1.4 MW): Period LFG capacity MW
installed �– Engines allocated
Anaerobic digester capacity MW installed �– engines allocated
Total capacity installed MW �– engines installed
Till 13/11/2008 16.8 MW �– 12 engines 0 MW �– 0 engines 16.8 MW �– 12 engines From 13/11/2008 to 26/1/2009
19.6 MW �– 14 engines 0 MW �– 0 engines 19.6 MW �– 14 engines
From 26/1/2009 to 21/4/2009
22.4 MW �– 16 engines 0 MW �– 0 engines 22.4 MW �– 16 engines
GOLD STANDARD FINAL VERIFICATION/CERTIFICATION REPORT
GS Verification/Certification Report N° 2011-DG-01-MD, Rev.1.2 14 GS_VER_REP-05-10
From 21/4/2009 to 01/05/2010
19.6 MW �– 14 engines 2.8 MW �– 2 engines 22.4 MW �– 16 engines
From 01/05/2010 21 MW �– 15 engines 1.4 MW �– 1 engine 22.4 MW �– 16 engines It was confirmed during this verification period, through the on site inspection, that the project activity has been implemented as described above in accordance with the design mentioned in the registered PDD /1/.
3.4 Methodology for determining Emission Reductions.
According to the applied methodology ACM0001 �“Consolidated baseline and monitoring methodology for landfill gas project activities�” version 08.1 /4/ and AM0025 �“Avoided emissions from organic waste through alternative waste treatment processes�” version 10 /5/, the emission reductions have been calculated based on the following formula: ERy = BEy �– PEy �– Ly Where BEy is the emissions in the baseline scenario in year y (tCO2e/year) PEy is the emissions in the project scenario in year y (tCO2e/year) Ly is the leakage in year y (tCO2e/year) 1) Baseline emissions According to methodology ACM0001 version 08.1 /4/ the baseline emissions have been calculated based on the following formula: BEy = MDproject,y * GWPCH4 + ELLFG,y * CEFelec,y
Where: MDproject,y is the amount of methane that would have been destroyed/combusted during the year in tonnes of methane (tCH4) in project scenario. GWPCH4 is the Global warming potential value for methane (for the first commitment period is 21 tCO2e/tCH4). ELLFG,y is the net quantity of electricity produced using LFG which in the absence of the project activity would have been produced by power plants connected to the grid during a year. CEFelec,y is the CO2 emissions intensity of the baseline source of electricity displaced in tCO2e/MWh. According to methodology AM0025 version 10 /5/ the baseline emissions have been calculated based on the following formula: BEy = (MBy �– MDreg,y) + BEEN,Y Where: MBy is the methane produced in the landfill in the absence of the project activity in year y MDreg,y is the methane that would be destroyed in the absence of the project activity in year y BEEN,y is the baseline emissions from generation of energy displaced by the project activity in year y. 2) Project emissions According to methodology ACM0001 version 08.1 /4/ and methodology AM0025 version 10 /5/ the project emissions have been calculated based on the following formula: PEy = PEelec,y + PEa,y
GOLD STANDARD FINAL VERIFICATION/CERTIFICATION REPORT
GS Verification/Certification Report N° 2011-DG-01-MD, Rev.1.2 15 GS_VER_REP-05-10
PEelec,y is the emissions from electricity consumption on-site due to the project activity in year y PEa,y is the emission from the anaerobic digestion process in year y 3) Leakage. According to methodology ACM0001 version 08.1 /4/ no leakage effects need to be accounted. The project activity does not involve off-site transportation of waste materials. The approved methodology AM0025 /5/ made a difference between residual waste treated aerobically or delivered to a landfill. The compost (residual waste) produced by the anaerobic digester during the monitoring period is disposed at landfill and they are not treated aerobically; if aerobical conditions are observed in the future the leakage emissions can be calculated, according to AM0025 methodology version 10. Iin case the residual is delivered to a landfill CH4 emissions are estimated through equation (18) of the methodology AM0025 by multiplying the methane that would be destroyed in the absence of the project activity with the adjustment factor which shall be revised at the start of the new crediting period; according to the registered PDD /01/ there is no legislation, contractual requirement or safety/odour requirement in Turkey in force that regulated the destruction of methane. 4) Gold Standard In accordance with the Gold Standard requirements /9/ /10/ a landfill gas project can be considered eligible for emission reductions from both methane avoidance and non-renewable fuel substitution under the condition that at least 65% of the volume of the LFG captured, on an annual basis, is used to deliver energy services. The project activity during the crediting period meets the Gold Standard criteria reaching the 100% of LFG used for electricity generation. Gold Standard rules require demonstrating the contribution of the project activity to the sustainable development of Turkey through the contribution of local and/or global environmental sustainability, social sustainability and development and economic and technological development. In this regard the following sustainable development indicators have been monitored during the crediting period: LFG usage, water quality, air quality, soil condition, and employment job quality, livelihood of the poor, human and institutional capacity, and quantity of employment.
3.4.1 Compliance of the monitoring plan with the monitoring methodology
The monitoring plan in the GS registered PDD /1/ complies with the applied methodologies ACM0001 version 08.1 �“Consolidated baseline and monitoring methodology for landfill gas project activities�” /4/ and methodology AM0025 version 10 �“Avoided emissions from organic waste through alternative waste treatment processes�” /5/.
3.4.2 Compliance of monitoring with monitoring plan
The monitoring plan in the monitoring report version 3.1 of 11/04/2011 /2/ complies with the monitoring plan in the GS registered PDD /1/ and both the monitoring methodologies, ACM0001 version 08.1 /4/ and AM0025 version 10 /5/, have been properly implemented and followed. All the parameters, as listed in the following sections, have been monitored according the applied methodology and the relevant CDM EB decisions and GS requirements. The sustainability indicators in the monitoring report /2/ comply with the sustainability indicators established by the Appendix D of the Gold Standard Requirements. All information about organization, responsibility, reporting procedure and data flow have been defined in the Gold Standard Monitoring Manual /12/; the daily and internal records /17/ /18/ /19/ /20/ /21/ /22/ /23/ /24/, monthly protocols of meter reading /28/, the ER calculation /16/ (110411_ER_Calculation_Mamak_3rdPV) were provided and reviewed. No change occurred to the key sustainable development indicators during this monitoring period. RINA can thus confirm the implementation of the project monitoring was appropriate. The following parameters have been monitored in accordance with the monitoring plan in the registered PDD /01/ and the monitoring report /02/.

GOLD STANDARD FINAL VERIFICATION/CERTIFICATION REPORT
GS Verification/Certification Report N° 2011-DG-01-MD, Rev.1.2 16 GS_VER_REP-05-10
3.4.2.1 Data fixed ex-ante
DATA/PARAMETER Source of data Reported value for the project period
Assessment/Observation
AF % Adjustment Factor. Methane destroyed due to regulatory or other requirements.
ACM0001 version 08.1 /4/ AM0025 version 10 /5/
0% As per the approved methodolgoy ACM0001, AM0025 and the GS registered PDD /1/ the adjustment factor is determined as zero for the first crediting period.
GWPCH4 Global Warming Potential of methane
Kyoto Protocol 21 tCO2e/tCH4 As per the Kyoto Protocol the value is fixed for the first commitment period. It shall be updated according to any future COP/MOP decision.
GWPN2O Global Warming Potential of Nitrous Oxide
Kyoto Protocol 310 tCO2e/N2O As per the Kyoto Protocol the value is fixed for the first commitment period. It shall be updated according to any future COM/MOP decision.
DCH4 Density of methane
ACM0001 version 08.1 /4/
0.0007168 tCH4/m3CH4
The value considered is according with the approved methodology ACM0001 and it is fixed at standard temperature 0 degree Celsius and pressure 1.013 bar.
Model correction factor to account for model uncertainties.
Methodological tool /8/.
0.9 The value has been applied according to the methodological tool �“Tool to determine emissions avoided from disposal of waste at a solid waste disposal site�”.
OX Oxidation Factor
Methodological tool /8/. IPCC 2006 Guidelines.
0 According the methodological tool �“Tool to determine methane emissions avoided from disposal of waste at a solid waste disposal site�” and the registered PDD /1/, the oxidation factor is taken zero (for other types of solid disposal site) since the baseline scenario the landfill area is uncovered (IPCC 2006 Guidelines).
F Fraction of methane in the SWDS gas.
Methodological tool /8/ IPCC 2006 Guidelines.
0.5 According the methodological tool �“tool to determine methane emissions avoided from disposal of waste at a solid waste disposal site�” and the registered PDD /1/ a default value of 0.5 has been used as recommended by IPCC.
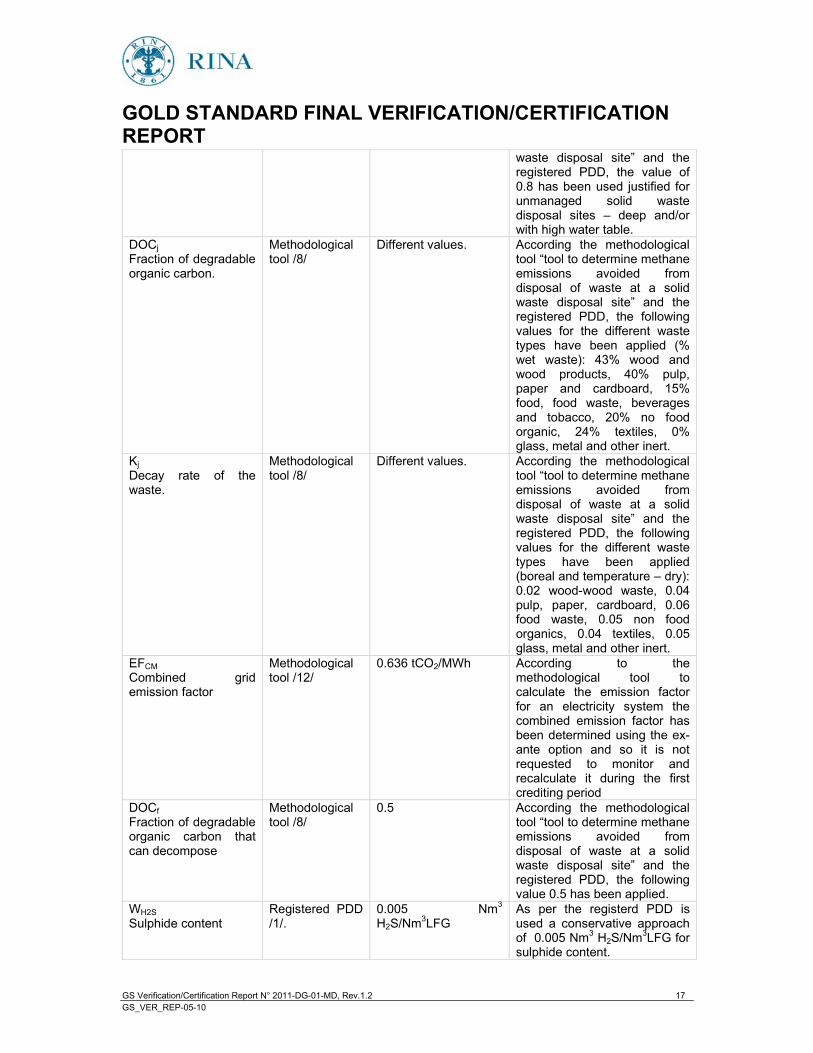
MCF Methane correction factor
Methodological tool /8/
0.8 According the methodological tool �“tool to determine methane emissions avoided from disposal of waste at a solid
GOLD STANDARD FINAL VERIFICATION/CERTIFICATION REPORT
GS Verification/Certification Report N° 2011-DG-01-MD, Rev.1.2 17 GS_VER_REP-05-10
waste disposal site�” and the registered PDD, the value of 0.8 has been used justified for unmanaged solid waste disposal sites �– deep and/or with high water table.
DOCj Fraction of degradable organic carbon.
Methodological tool /8/
Different values. According the methodological tool �“tool to determine methane emissions avoided from disposal of waste at a solid waste disposal site�” and the registered PDD, the following values for the different waste types have been applied (% wet waste): 43% wood and wood products, 40% pulp, paper and cardboard, 15% food, food waste, beverages and tobacco, 20% no food organic, 24% textiles, 0% glass, metal and other inert.
Kj Decay rate of the waste.
Methodological tool /8/
Different values. According the methodological tool �“tool to determine methane emissions avoided from disposal of waste at a solid waste disposal site�” and the registered PDD, the following values for the different waste types have been applied (boreal and temperature �– dry): 0.02 wood-wood waste, 0.04 pulp, paper, cardboard, 0.06 food waste, 0.05 non food organics, 0.04 textiles, 0.05 glass, metal and other inert.
EFCM Combined grid emission factor
Methodological tool /12/
0.636 tCO2/MWh According to the methodological tool to calculate the emission factor for an electricity system the combined emission factor has been determined using the ex-ante option and so it is not requested to monitor and recalculate it during the first crediting period
DOCf Fraction of degradable organic carbon that can decompose
Methodological tool /8/
0.5 According the methodological tool �“tool to determine methane emissions avoided from disposal of waste at a solid waste disposal site�” and the registered PDD, the following value 0.5 has been applied.
WH2S Sulphide content
Registered PDD /1/.
0.005 Nm3 H2S/Nm3LFG
As per the registerd PDD is used a conservative approach of 0.005 Nm3 H2S/Nm3LFG for sulphide content.
GOLD STANDARD FINAL VERIFICATION/CERTIFICATION REPORT
GS Verification/Certification Report N° 2011-DG-01-MD, Rev.1.2 18 GS_VER_REP-05-10
The �“correction factor�” mentioned in the registered PDD /1/ (footnote 75) was used for the ex-ante estimation of the emission reduction but it is not used for the baseline emission reduction calculation. The ex-ante parameters were validated by the then DOE which carried out the validation process and accepted by GS in registering the proposed project activity. The amount of methane destroyed/combusted during the monitoring period is measured as described in the Monitoring Report and in the ERs calculation spreadsheet provided by the PP and checked by RINA and it is evident that no correction factor is used.
GOLD STANDARD FINAL VERIFICATION/CERTIFICATION REPORT
GS Verification/Certification Report N° 2011-DG-01-MD, Rev.1.2 19 GS_VER_REP-05-10
3.4.2.2 Monitored data
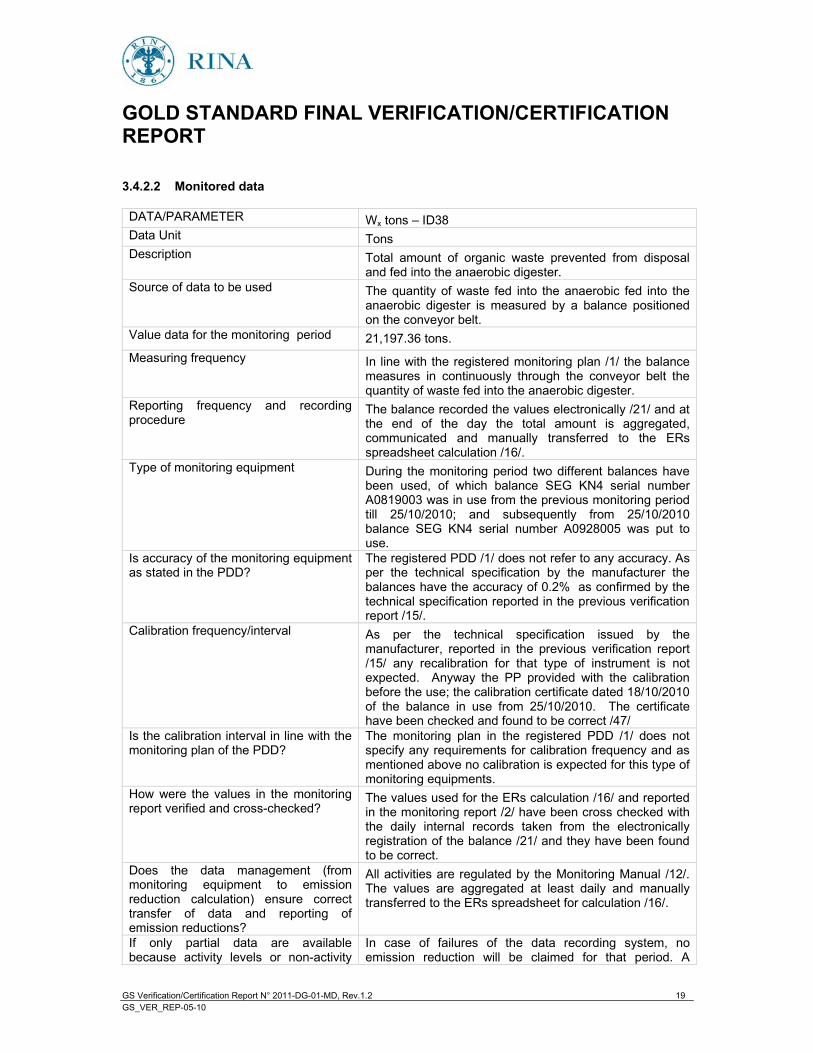
DATA/PARAMETER Wx tons �– ID38 Data Unit Tons Description Total amount of organic waste prevented from disposal
and fed into the anaerobic digester. Source of data to be used The quantity of waste fed into the anaerobic fed into the
anaerobic digester is measured by a balance positioned on the conveyor belt.
Value data for the monitoring period 21,197.36 tons. Measuring frequency In line with the registered monitoring plan /1/ the balance
measures in continuously through the conveyor belt the quantity of waste fed into the anaerobic digester.
Reporting frequency and recording procedure
The balance recorded the values electronically /21/ and at the end of the day the total amount is aggregated, communicated and manually transferred to the ERs spreadsheet calculation /16/.
Type of monitoring equipment During the monitoring period two different balances have been used, of which balance SEG KN4 serial number A0819003 was in use from the previous monitoring period till 25/10/2010; and subsequently from 25/10/2010 balance SEG KN4 serial number A0928005 was put to use.
Is accuracy of the monitoring equipment as stated in the PDD?
The registered PDD /1/ does not refer to any accuracy. As per the technical specification by the manufacturer the balances have the accuracy of 0.2% as confirmed by the technical specification reported in the previous verification report /15/.
Calibration frequency/interval As per the technical specification issued by the manufacturer, reported in the previous verification report /15/ any recalibration for that type of instrument is not expected. Anyway the PP provided with the calibration before the use; the calibration certificate dated 18/10/2010 of the balance in use from 25/10/2010. The certificate have been checked and found to be correct /47/
Is the calibration interval in line with the monitoring plan of the PDD?
The monitoring plan in the registered PDD /1/ does not specify any requirements for calibration frequency and as mentioned above no calibration is expected for this type of monitoring equipments.
How were the values in the monitoring report verified and cross-checked?
The values used for the ERs calculation /16/ and reported in the monitoring report /2/ have been cross checked with the daily internal records taken from the electronically registration of the balance /21/ and they have been found to be correct.
Does the data management (from monitoring equipment to emission reduction calculation) ensure correct transfer of data and reporting of emission reductions?
All activities are regulated by the Monitoring Manual /12/. The values are aggregated at least daily and manually transferred to the ERs spreadsheet for calculation /16/.
If only partial data are available because activity levels or non-activity
In case of failures of the data recording system, no emission reduction will be claimed for that period. A
GOLD STANDARD FINAL VERIFICATION/CERTIFICATION REPORT
GS Verification/Certification Report N° 2011-DG-01-MD, Rev.1.2 20 GS_VER_REP-05-10
parameters have not been monitored in accordance with the registered monitoring plan, has the most conservative assumption theoretically possible been applied or has a request for deviation been approved?
logbook will be written and will be registered the period without data recording /12/. Based on the daily internal records /21/, during this monitoring period no such failures are noticed.
GOLD STANDARD FINAL VERIFICATION/CERTIFICATION REPORT
GS Verification/Certification Report N° 2011-DG-01-MD, Rev.1.2 21 GS_VER_REP-05-10
DATA/PARAMETER Pnjx - ID39
z �– ID40 Data Unit %
n. Description Weight fraction of the waste type j in the sample n
collected during the year. Number of sample collected during the year.
Source of data to be used The collected sample is weighed through a dedicated balance.
Value data for the monitoring period i) food waste 79.6%; ii) textiles 0.8%; iii) wood 4.7%; iv) paper 9.2%; v) garden and park waste 3.1%; vi) glass, metal and other inert wastes 2.7%.
Measuring frequency Following the internal procedure PRO-006 of 22/3/2010 /62/ the samples are taken from the belt discharge, the quantity of the samples taken are around 100-500 kg, sample is not taken once but cumulatively at least 5 times during the day from container, to achieve a homogeneous mixture.
Reporting frequency and recording procedure
The collected sample is weighed and the amount is recorded; samples are spread and sorted fractions are weighed separately. 52 samples have been collected during the monitoring period; this can be considered a conservative procedure since the methodological tool required that a minimum sampling should be taken four times per year.
Type of monitoring equipment During the monitoring period two balances have been used, and the following has reported: DIKOMSAN DT600 s.n. 2779 (already in use during the previous monitoring period) and balance DIKOMSAN DT600 sn ISXKDT070763.
Is accuracy of the monitoring equipment as stated in the PDD?
The registered PDD /1/ does not refer to any accuracy. As confirmed by the technical specification reported in the previous verification report /15/ the balance DIKOMSAN DT 600 has the accuracy of 20 gr .
Calibration frequency/interval As per the technical specification issued by the manufacturer, reported in the previous verification report /15/ it is not expected for any recalibration for that type of instrument. Anyway the PP provided with the calibration. The related calibration certification has been checked and found to be correct:
- Calibration certificate n. C10T6152 of 04/2010 (date of calibration 08/04/2010) /48/;
- Declaration for additional control of 14/04/2010 /49/.
Is the calibration interval in line with the monitoring plan of the PDD?
The monitoring plan in the registered PDD /1/ does not specify any requirements for calibration frequency and as mentioned above no calibration is expected for this type of monitoring equipment.
How were the values in the monitoring report verified and cross-checked?
The values used for the ERs calculation /16/ and reported in the monitoring report /2/ have been cross checked with the internal weekly sample determined according to the
GOLD STANDARD FINAL VERIFICATION/CERTIFICATION REPORT
GS Verification/Certification Report N° 2011-DG-01-MD, Rev.1.2 22 GS_VER_REP-05-10
internal procedure PRO-006 of 22/3/2010 /62/. Does the data management (from monitoring equipment to emission reduction calculation) ensure correct transfer of data and reporting of emission reductions?
All activities are regulated by the Monitoring Manual /12/. The values are aggregated weekly and manually transferred to the ERs spreadsheet calculation /16/. The data used to determine the weekly percentage of waste sample have been checked with the internal records. The confidence level of 95% has been demonstrated through a �“test of sufficient monitoring�” established by the PP. The test includes the calculation of the standard deviation for each waste type and the interval is determined considering the standard deviation and the error distribution. The PP established that to have the confidence level of 95% the interval should be less than 10%. The calculation is checked and found correct /16/.
If only partial data are available because activity levels or non-activity parameters have not been monitored in accordance with the registered monitoring plan, has the most conservative assumption theoretically possible been applied or has a request for deviation been approved?
In case of failures of the data recording system, no emission reduction will be claimed for that period. A logboo will be written and will be registered the period without data recording /12/. During this monitoring period no such failures are noticed.
GOLD STANDARD FINAL VERIFICATION/CERTIFICATION REPORT
GS Verification/Certification Report N° 2011-DG-01-MD, Rev.1.2 23 GS_VER_REP-05-10
DATA/PARAMETER SGay / MCN2Oay / MCCH4ay �– ID32, ID33, ID34 Data Unit Nm3 / % / % Description Stack gas volume flow rate
Concentration of N2O in stack gas Concentration of CH4 in stack gas
Source of data to be used As per the approved methodology /5/ and registered PDD /1/ the stack gas flow rate and the concentration of N2O and CH4 have been determined using indirect method.
Value data for the monitoring period Nm3 1,906 (average flow) and the concentration of N2O and CH4 is equal to zero.
Measuring frequency The monitoring of the stack gases takes places quarterly by an independent laboratory following standards and procedure /63/. The concentrations are measured during normal operation in order to be representative. The average concentrations are determined on hourly basis taking into account the operating hours of the engines /24/.
Reporting frequency and recording procedure
The monitoring of the stack gases take places quarterly and the independent laboratory issue appropriate test reports /68/ /69/ /70/ /71/.
Type of monitoring equipment NA Is accuracy of the monitoring equipment as stated in the PDD?
NA
Calibration frequency/interval NA Is the calibration interval in line with the monitoring plan of the PDD?
NA
How were the values in the monitoring report verified and cross-checked?
The values used for the ERs calculation /16/ and reported in the monitoring report /2/ have been cross checked with the test reports issued by the independent laboratory /68/ /69/ /70/ /71/.
Does the data management (from monitoring equipment to emission reduction calculation) ensure correct transfer of data and reporting of emission reductions?
All activities are regulated by the Monitoring Manual /12/. The values are aggregated and manually transferred to the ERs spreadsheet calculation /16/.
If only partial data are available because activity levels or non-activity parameters have not been monitored in accordance with the registered monitoring plan, has the most conservative assumption theoretically possible been applied or has a request for deviation been approved?
In case of failures of the data recording system, no emission reduction will be claimed for that period. A logbook will be written and will be registered the period without data recording /12/. During this monitoring period no such failures are noticed.
GOLD STANDARD FINAL VERIFICATION/CERTIFICATION REPORT
GS Verification/Certification Report N° 2011-DG-01-MD, Rev.1.2 24 GS_VER_REP-05-10
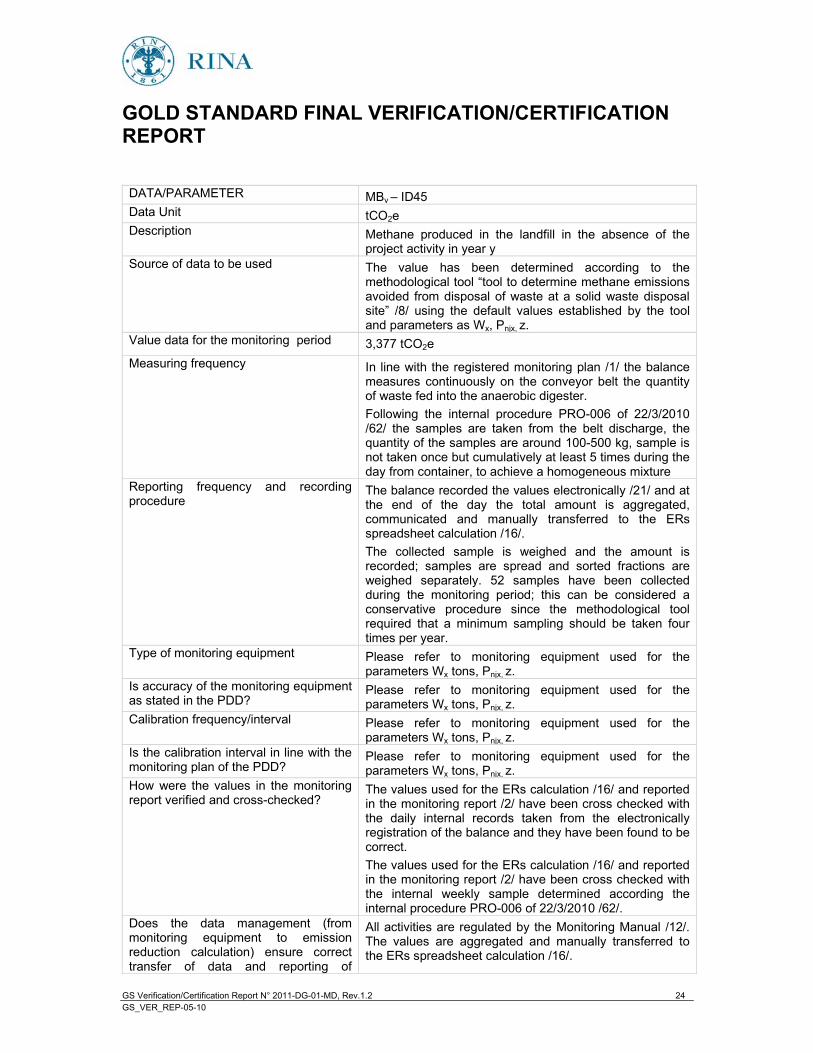
DATA/PARAMETER MBy �– ID45 Data Unit tCO2eDescription Methane produced in the landfill in the absence of the
project activity in year y Source of data to be used The value has been determined according to the
methodological tool �“tool to determine methane emissions avoided from disposal of waste at a solid waste disposal site�” /8/ using the default values established by the tool and parameters as Wx, Pnjx, z.
Value data for the monitoring period 3,377 tCO2e Measuring frequency In line with the registered monitoring plan /1/ the balance
measures continuously on the conveyor belt the quantity of waste fed into the anaerobic digester. Following the internal procedure PRO-006 of 22/3/2010 /62/ the samples are taken from the belt discharge, the quantity of the samples are around 100-500 kg, sample is not taken once but cumulatively at least 5 times during the day from container, to achieve a homogeneous mixture
Reporting frequency and recording procedure
The balance recorded the values electronically /21/ and at the end of the day the total amount is aggregated, communicated and manually transferred to the ERs spreadsheet calculation /16/. The collected sample is weighed and the amount is recorded; samples are spread and sorted fractions are weighed separately. 52 samples have been collected during the monitoring period; this can be considered a conservative procedure since the methodological tool required that a minimum sampling should be taken four times per year.
Type of monitoring equipment Please refer to monitoring equipment used for the parameters Wx tons, Pnjx, z.
Is accuracy of the monitoring equipment as stated in the PDD?
Please refer to monitoring equipment used for the parameters Wx tons, Pnjx, z.
Calibration frequency/interval Please refer to monitoring equipment used for the parameters Wx tons, Pnjx, z.
Is the calibration interval in line with the monitoring plan of the PDD?
Please refer to monitoring equipment used for the parameters Wx tons, Pnjx, z.
How were the values in the monitoring report verified and cross-checked?
The values used for the ERs calculation /16/ and reported in the monitoring report /2/ have been cross checked with the daily internal records taken from the electronically registration of the balance and they have been found to be correct. The values used for the ERs calculation /16/ and reported in the monitoring report /2/ have been cross checked with the internal weekly sample determined according the internal procedure PRO-006 of 22/3/2010 /62/.
Does the data management (from monitoring equipment to emission reduction calculation) ensure correct transfer of data and reporting of
All activities are regulated by the Monitoring Manual /12/. The values are aggregated and manually transferred to the ERs spreadsheet calculation /16/.
GOLD STANDARD FINAL VERIFICATION/CERTIFICATION REPORT
GS Verification/Certification Report N° 2011-DG-01-MD, Rev.1.2 25 GS_VER_REP-05-10
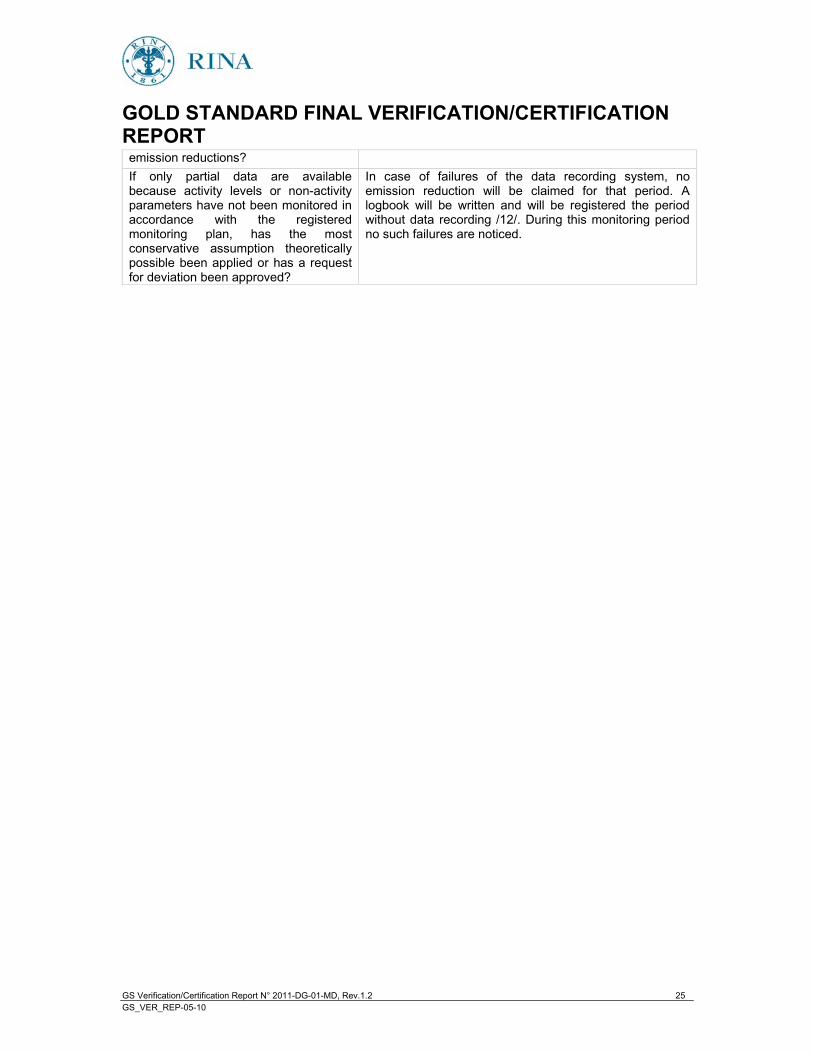
emission reductions? If only partial data are available because activity levels or non-activity parameters have not been monitored in accordance with the registered monitoring plan, has the most conservative assumption theoretically possible been applied or has a request for deviation been approved?
In case of failures of the data recording system, no emission reduction will be claimed for that period. A logbook will be written and will be registered the period without data recording /12/. During this monitoring period no such failures are noticed.
GOLD STANDARD FINAL VERIFICATION/CERTIFICATION REPORT
GS Verification/Certification Report N° 2011-DG-01-MD, Rev.1.2 26 GS_VER_REP-05-10
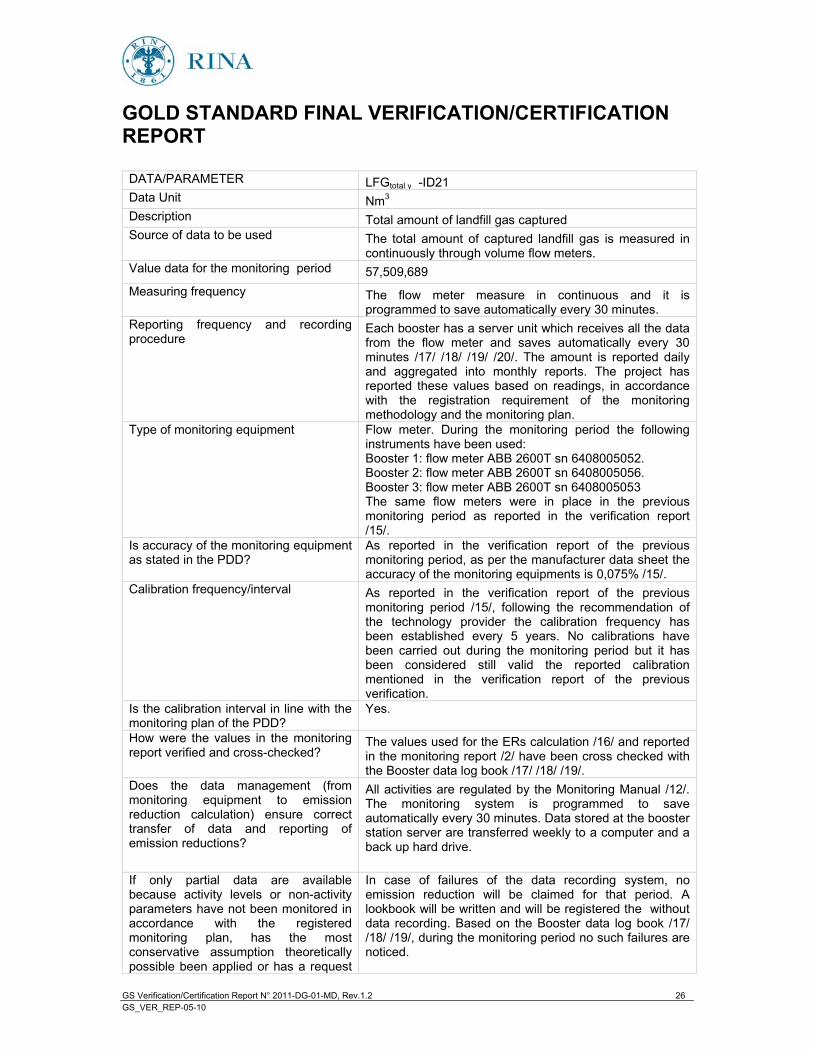
DATA/PARAMETER LFGtotal y -ID21 Data Unit Nm3 Description Total amount of landfill gas captured Source of data to be used The total amount of captured landfill gas is measured in
continuously through volume flow meters. Value data for the monitoring period 57,509,689 Measuring frequency The flow meter measure in continuous and it is
programmed to save automatically every 30 minutes. Reporting frequency and recording procedure
Each booster has a server unit which receives all the data from the flow meter and saves automatically every 30 minutes /17/ /18/ /19/ /20/. The amount is reported daily and aggregated into monthly reports. The project has reported these values based on readings, in accordance with the registration requirement of the monitoring methodology and the monitoring plan.
Type of monitoring equipment Flow meter. During the monitoring period the following instruments have been used: Booster 1: flow meter ABB 2600T sn 6408005052. Booster 2: flow meter ABB 2600T sn 6408005056. Booster 3: flow meter ABB 2600T sn 6408005053 The same flow meters were in place in the previous monitoring period as reported in the verification report /15/.
Is accuracy of the monitoring equipment as stated in the PDD?
As reported in the verification report of the previous monitoring period, as per the manufacturer data sheet the accuracy of the monitoring equipments is 0,075% /15/.
Calibration frequency/interval As reported in the verification report of the previous monitoring period /15/, following the recommendation of the technology provider the calibration frequency has been established every 5 years. No calibrations have been carried out during the monitoring period but it has been considered still valid the reported calibration mentioned in the verification report of the previous verification.
Is the calibration interval in line with the monitoring plan of the PDD?
Yes.
How were the values in the monitoring report verified and cross-checked?
The values used for the ERs calculation /16/ and reported in the monitoring report /2/ have been cross checked with the Booster data log book /17/ /18/ /19/.
Does the data management (from monitoring equipment to emission reduction calculation) ensure correct transfer of data and reporting of emission reductions?
All activities are regulated by the Monitoring Manual /12/. The monitoring system is programmed to save automatically every 30 minutes. Data stored at the booster station server are transferred weekly to a computer and a back up hard drive.
If only partial data are available because activity levels or non-activity parameters have not been monitored in accordance with the registered monitoring plan, has the most conservative assumption theoretically possible been applied or has a request
In case of failures of the data recording system, no emission reduction will be claimed for that period. A lookbook will be written and will be registered the without data recording. Based on the Booster data log book /17/ /18/ /19/, during the monitoring period no such failures are noticed.
GOLD STANDARD FINAL VERIFICATION/CERTIFICATION REPORT
GS Verification/Certification Report N° 2011-DG-01-MD, Rev.1.2 27 GS_VER_REP-05-10
for deviation been approved?
GOLD STANDARD FINAL VERIFICATION/CERTIFICATION REPORT
GS Verification/Certification Report N° 2011-DG-01-MD, Rev.1.2 28 GS_VER_REP-05-10
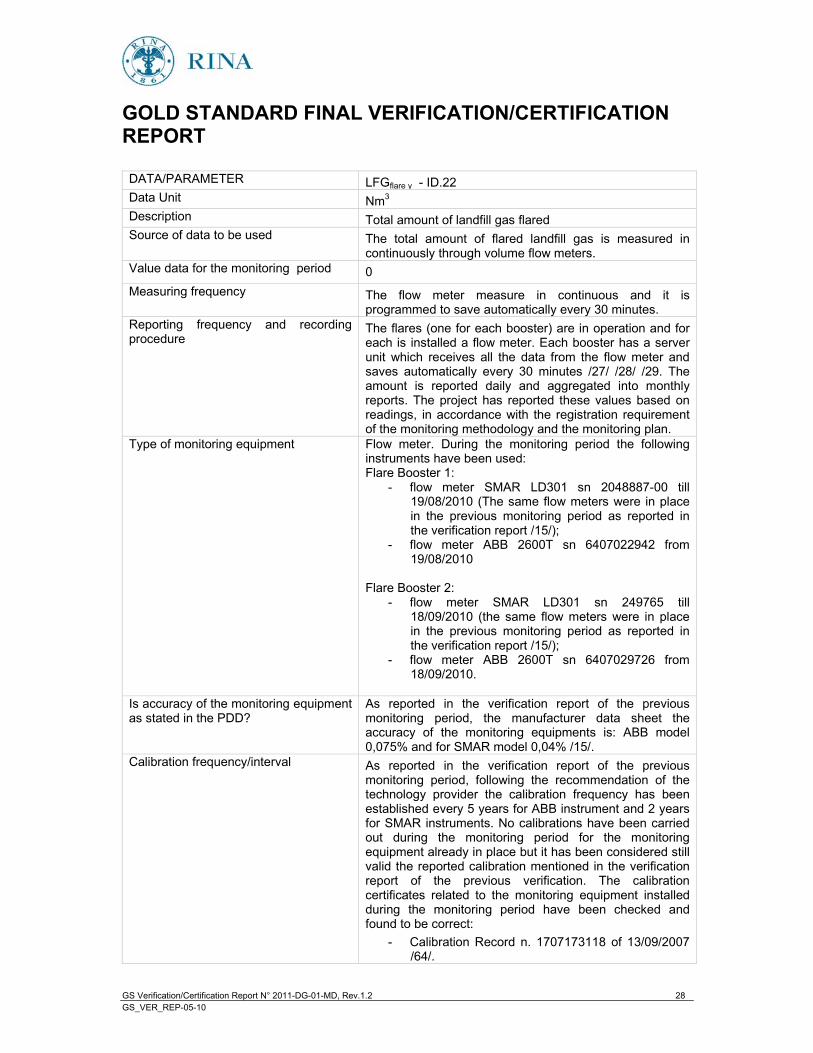
DATA/PARAMETER LFGflare y - ID.22 Data Unit Nm3 Description Total amount of landfill gas flared Source of data to be used The total amount of flared landfill gas is measured in
continuously through volume flow meters. Value data for the monitoring period 0 Measuring frequency The flow meter measure in continuous and it is
programmed to save automatically every 30 minutes. Reporting frequency and recording procedure
The flares (one for each booster) are in operation and for each is installed a flow meter. Each booster has a server unit which receives all the data from the flow meter and saves automatically every 30 minutes /27/ /28/ /29. The amount is reported daily and aggregated into monthly reports. The project has reported these values based on readings, in accordance with the registration requirement of the monitoring methodology and the monitoring plan.
Type of monitoring equipment Flow meter. During the monitoring period the following instruments have been used: Flare Booster 1:
- flow meter SMAR LD301 sn 2048887-00 till 19/08/2010 (The same flow meters were in place in the previous monitoring period as reported in the verification report /15/);
- flow meter ABB 2600T sn 6407022942 from 19/08/2010
Flare Booster 2:
- flow meter SMAR LD301 sn 249765 till 18/09/2010 (the same flow meters were in place in the previous monitoring period as reported in the verification report /15/);
- flow meter ABB 2600T sn 6407029726 from 18/09/2010.
Is accuracy of the monitoring equipment as stated in the PDD?
As reported in the verification report of the previous monitoring period, the manufacturer data sheet the accuracy of the monitoring equipments is: ABB model 0,075% and for SMAR model 0,04% /15/.
Calibration frequency/interval As reported in the verification report of the previous monitoring period, following the recommendation of the technology provider the calibration frequency has been established every 5 years for ABB instrument and 2 years for SMAR instruments. No calibrations have been carried out during the monitoring period for the monitoring equipment already in place but it has been considered still valid the reported calibration mentioned in the verification report of the previous verification. The calibration certificates related to the monitoring equipment installed during the monitoring period have been checked and found to be correct:
- Calibration Record n. 1707173118 of 13/09/2007 /64/.
GOLD STANDARD FINAL VERIFICATION/CERTIFICATION REPORT
GS Verification/Certification Report N° 2011-DG-01-MD, Rev.1.2 29 GS_VER_REP-05-10
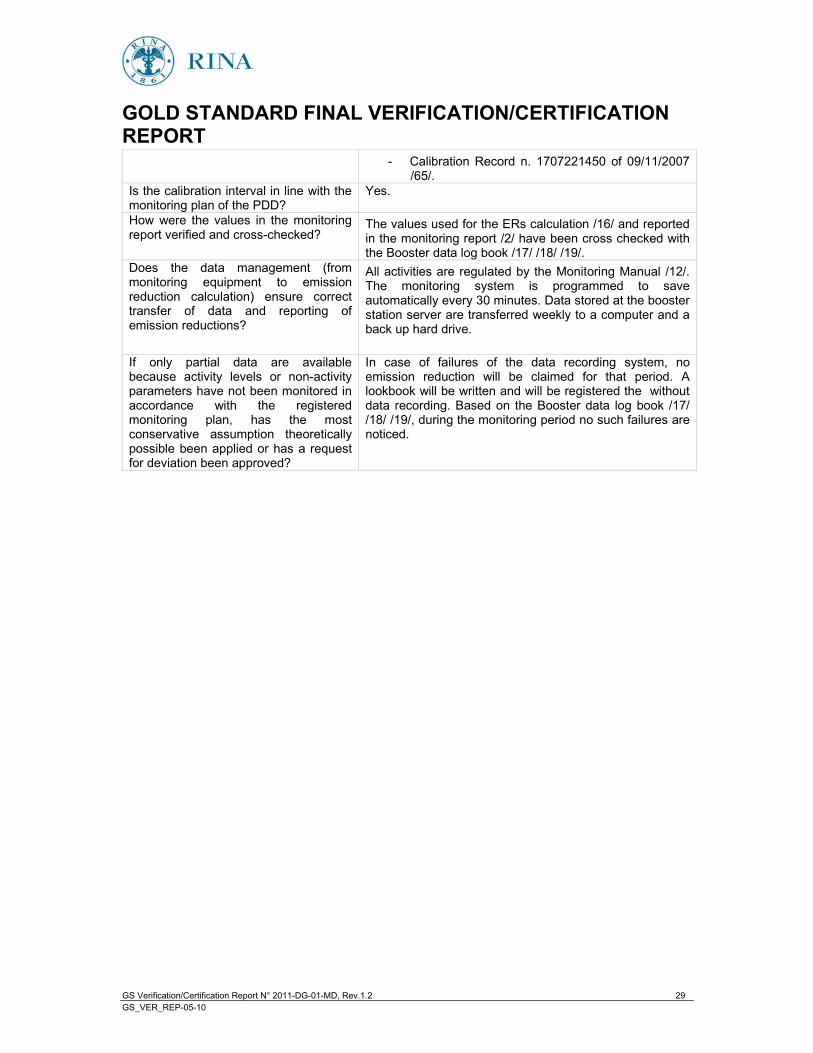
- Calibration Record n. 1707221450 of 09/11/2007 /65/.
Is the calibration interval in line with the monitoring plan of the PDD?
Yes.
How were the values in the monitoring report verified and cross-checked?
The values used for the ERs calculation /16/ and reported in the monitoring report /2/ have been cross checked with the Booster data log book /17/ /18/ /19/.
Does the data management (from monitoring equipment to emission reduction calculation) ensure correct transfer of data and reporting of emission reductions?
All activities are regulated by the Monitoring Manual /12/. The monitoring system is programmed to save automatically every 30 minutes. Data stored at the booster station server are transferred weekly to a computer and a back up hard drive.
If only partial data are available because activity levels or non-activity parameters have not been monitored in accordance with the registered monitoring plan, has the most conservative assumption theoretically possible been applied or has a request for deviation been approved?
In case of failures of the data recording system, no emission reduction will be claimed for that period. A lookbook will be written and will be registered the without data recording. Based on the Booster data log book /17/ /18/ /19/, during the monitoring period no such failures are noticed.
GOLD STANDARD FINAL VERIFICATION/CERTIFICATION REPORT
GS Verification/Certification Report N° 2011-DG-01-MD, Rev.1.2 30 GS_VER_REP-05-10
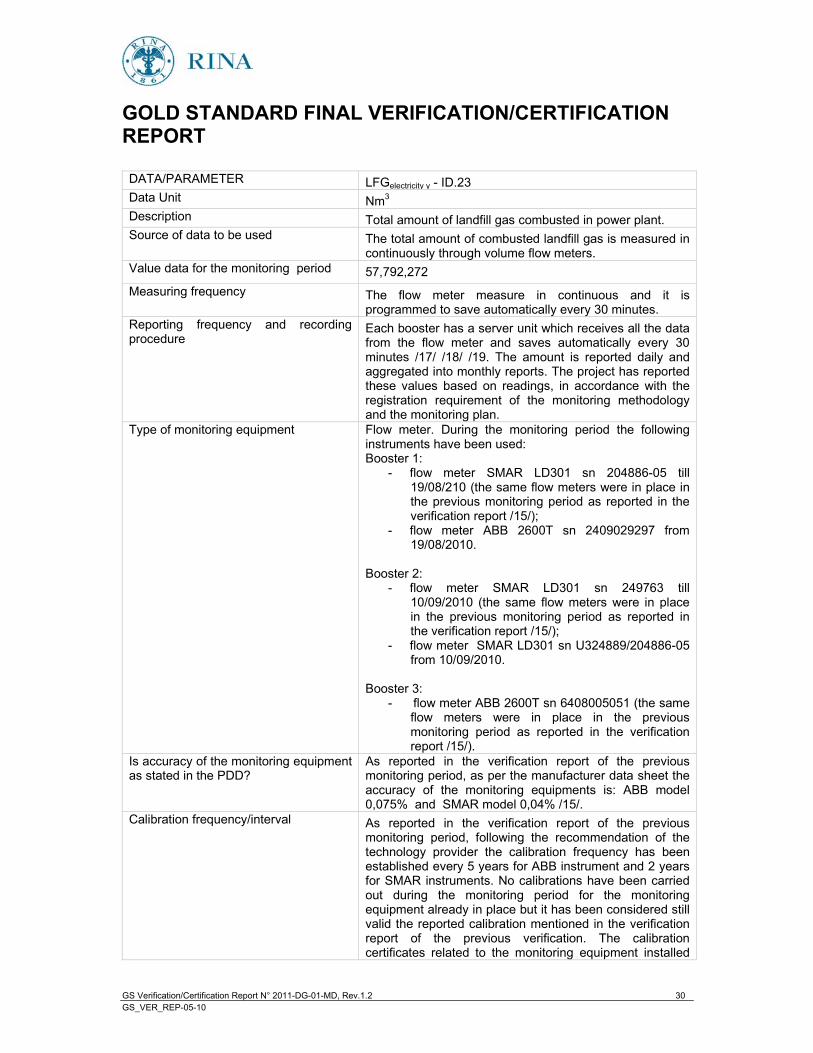
DATA/PARAMETER LFGelectricity y - ID.23 Data Unit Nm3 Description Total amount of landfill gas combusted in power plant. Source of data to be used The total amount of combusted landfill gas is measured in
continuously through volume flow meters. Value data for the monitoring period 57,792,272 Measuring frequency The flow meter measure in continuous and it is
programmed to save automatically every 30 minutes. Reporting frequency and recording procedure
Each booster has a server unit which receives all the data from the flow meter and saves automatically every 30 minutes /17/ /18/ /19. The amount is reported daily and aggregated into monthly reports. The project has reported these values based on readings, in accordance with the registration requirement of the monitoring methodology and the monitoring plan.
Type of monitoring equipment Flow meter. During the monitoring period the following instruments have been used: Booster 1:
- flow meter SMAR LD301 sn 204886-05 till 19/08/210 (the same flow meters were in place in the previous monitoring period as reported in the verification report /15/);
- flow meter ABB 2600T sn 2409029297 from 19/08/2010.
Booster 2: - flow meter SMAR LD301 sn 249763 till
10/09/2010 (the same flow meters were in place in the previous monitoring period as reported in the verification report /15/);
- flow meter SMAR LD301 sn U324889/204886-05 from 10/09/2010.
Booster 3: - flow meter ABB 2600T sn 6408005051 (the same
flow meters were in place in the previous monitoring period as reported in the verification report /15/).
Is accuracy of the monitoring equipment as stated in the PDD?
As reported in the verification report of the previous monitoring period, as per the manufacturer data sheet the accuracy of the monitoring equipments is: ABB model 0,075% and SMAR model 0,04% /15/.
Calibration frequency/interval As reported in the verification report of the previous monitoring period, following the recommendation of the technology provider the calibration frequency has been established every 5 years for ABB instrument and 2 years for SMAR instruments. No calibrations have been carried out during the monitoring period for the monitoring equipment already in place but it has been considered still valid the reported calibration mentioned in the verification report of the previous verification. The calibration certificates related to the monitoring equipment installed

GOLD STANDARD FINAL VERIFICATION/CERTIFICATION REPORT
GS Verification/Certification Report N° 2011-DG-01-MD, Rev.1.2 31 GS_VER_REP-05-10
during the monitoring period have been checked and found to be correct:
- Calibration Record n. 1090266905 of 16/12/2009 /66/;
- Calibration certificate n. M10091344 of 09/2010 (Date of calibration 07/09/2010) /27/.
Is the calibration interval in line with the monitoring plan of the PDD?
Yes.
How were the values in the monitoring report verified and cross-checked?
The values used for the ERs calculation /16/ and reported in the monitoring report /2/ have been cross checked with the Booster data log book /17/ /18/ /19/.
Does the data management (from monitoring equipment to emission reduction calculation) ensure correct transfer of data and reporting of emission reductions?
All activities are regulated by the Monitoring Manual /12/. The monitoring system is programmed to save automatically every 30 minutes. Data stored at the booster station server are transferred weekly to a computer and a back up hard drive.
If only partial data are available because activity levels or non-activity parameters have not been monitored in accordance with the registered monitoring plan, has the most conservative assumption theoretically possible been applied or has a request for deviation been approved?
In case of failures of the data recording system, no emission reduction will be claimed for that period. A lookbook will be written and will be registered the without data recording. Based on the Booster data log book /17/ /18/ /19/, during the monitoring period no such failures are noticed.
GOLD STANDARD FINAL VERIFICATION/CERTIFICATION REPORT
GS Verification/Certification Report N° 2011-DG-01-MD, Rev.1.2 32 GS_VER_REP-05-10
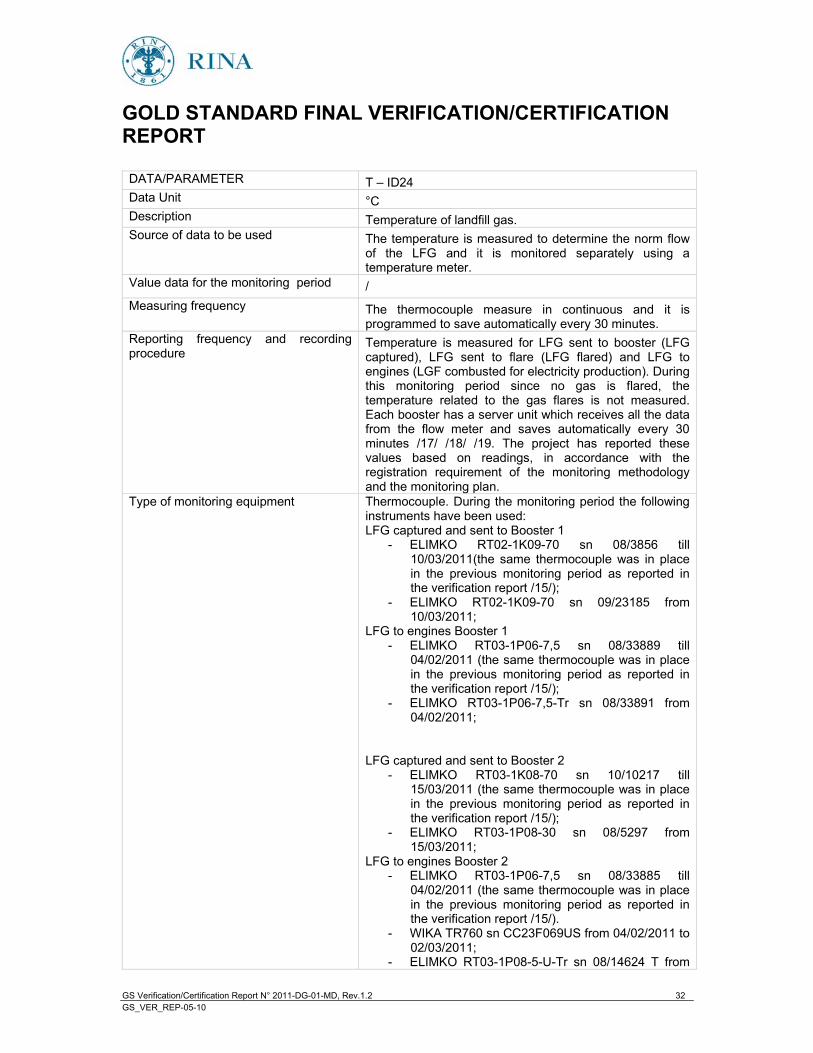
DATA/PARAMETER T �– ID24 Data Unit °C Description Temperature of landfill gas. Source of data to be used The temperature is measured to determine the norm flow
of the LFG and it is monitored separately using a temperature meter.
Value data for the monitoring period / Measuring frequency The thermocouple measure in continuous and it is
programmed to save automatically every 30 minutes. Reporting frequency and recording procedure
Temperature is measured for LFG sent to booster (LFG captured), LFG sent to flare (LFG flared) and LFG to engines (LGF combusted for electricity production). During this monitoring period since no gas is flared, the temperature related to the gas flares is not measured. Each booster has a server unit which receives all the data from the flow meter and saves automatically every 30 minutes /17/ /18/ /19. The project has reported these values based on readings, in accordance with the registration requirement of the monitoring methodology and the monitoring plan.
Type of monitoring equipment Thermocouple. During the monitoring period the following instruments have been used: LFG captured and sent to Booster 1
- ELIMKO RT02-1K09-70 sn 08/3856 till 10/03/2011(the same thermocouple was in place in the previous monitoring period as reported in the verification report /15/);
- ELIMKO RT02-1K09-70 sn 09/23185 from 10/03/2011;
LFG to engines Booster 1 - ELIMKO RT03-1P06-7,5 sn 08/33889 till
04/02/2011 (the same thermocouple was in place in the previous monitoring period as reported in the verification report /15/);
- ELIMKO RT03-1P06-7,5-Tr sn 08/33891 from 04/02/2011;
LFG captured and sent to Booster 2
- ELIMKO RT03-1K08-70 sn 10/10217 till 15/03/2011 (the same thermocouple was in place in the previous monitoring period as reported in the verification report /15/);
- ELIMKO RT03-1P08-30 sn 08/5297 from 15/03/2011;
LFG to engines Booster 2 - ELIMKO RT03-1P06-7,5 sn 08/33885 till
04/02/2011 (the same thermocouple was in place in the previous monitoring period as reported in the verification report /15/).
- WIKA TR760 sn CC23F069US from 04/02/2011 to 02/03/2011;
- ELIMKO RT03-1P08-5-U-Tr sn 08/14624 T from
GOLD STANDARD FINAL VERIFICATION/CERTIFICATION REPORT
GS Verification/Certification Report N° 2011-DG-01-MD, Rev.1.2 33 GS_VER_REP-05-10
02/03/2011; LFG captured and sent to Booster 3
- ELIMKO RT03-1K08-70 sn 10/10218 till 15/03/2011 (the same thermocouple was in place in the previous monitoring period as reported in the verification report /15/);
- ELIMKO RT03-1P08-30 sn 08/5292 from 15/03/2011;
LFG to engines Booster 3 a) ELIMKO RT03-1PO8-5 sn 08-14623 till
04/02/2011 (the same thermocouple was in place in the previous monitoring period as reported in the verification report /15/);
b) ELIMKO RT03-1P06-7,5 Tr sn08/33887 from 04/02/2011.
For each Booster is installed a flare; no gases have been flared during the monitoring period. Due to the calibration and maintenance than one device was in use at the monitoring point during the monitoring period.
Is accuracy of the monitoring equipment as stated in the PDD?
As reported in the verification report of the previous monitoring period /15/, as per the manufacturer data sheet the accuracy of the monitoring equipments is 0,5% .
Calibration frequency/interval As reported in the verification report of the previous monitoring period /15/, following the recommendation of the technology provider the calibration frequency has been established every year. The calibration certificates related to the monitoring period have been checked and found to be correct /72/ /28/ /29/ /30/ /67/ /31/.
Is the calibration interval in line with the monitoring plan of the PDD?
Yes.
How were the values in the monitoring report verified and cross-checked?
The values used for the ERs calculation /16/ and reported in the monitoring report /2/ have been cross checked with the Booster data log book /17/ /18/ /19/.
Does the data management (from monitoring equipment to emission reduction calculation) ensure correct transfer of data and reporting of emission reductions?
All activities are regulated by the Monitoring Manual /12/. The monitoring system is programmed to save automatically every 30 minutes. Data stored at the booster station server are transferred weekly to a computer and a back up hard drive.
If only partial data are available because activity levels or non-activity parameters have not been monitored in accordance with the registered monitoring plan, has the most conservative assumption theoretically possible been applied or has a request for deviation been approved?
In case of failures of the data recording system, no emission reduction will be claimed for that period. A lookbook will be written and will be registered the without data recording. Based on the Booster data log book /17/ /18/ /19/, during the monitoring period no such failures are noticed.
DATA/PARAMETER P �– ID25
GOLD STANDARD FINAL VERIFICATION/CERTIFICATION REPORT
GS Verification/Certification Report N° 2011-DG-01-MD, Rev.1.2 34 GS_VER_REP-05-10
Data Unit mbar Description Pressure of landfill gas. Source of data to be used The pressure is measured to determine the norm flow of
the LFG and it is monitored separately using a pressure meter.
Value data for the monitoring period / Measuring frequency The pressure meter measure in continuous and it is
programmed to save automatically every 30 minutes. Reporting frequency and recording procedure
Pressure is measured for LFG sent to booster (LFG captured), LFG sent to flare (LFG flared) and LFG to engines (LGF combusted for electricity production). Each booster has a server unit which receives all the data from the flow meter and saves automatically every 30 minutes /17/ /18/ /19. The project has reported these values based on readings, in accordance with the registration requirement of the monitoring methodology and the monitoring plan.
Type of monitoring equipment Pressure meter. During the monitoring period the following instruments have been used: LFG captured and sent to Booster 1
- KELLER PR-23 sn 130340 till 15/09/2010 (the same pressure transmitter was in place in the previous monitoring period as reporte in the verification report /15/).;
- KELLER PR-23 sn 130341 from 15/09/2010 Engines Booster 1
- WIKA S-10 sn 2603LPI till 14/06/2010 (the same pressure transmitter was in place in the previous monitoring period as reported in the verification report /15/).;
- WIKA S-10 sn 2603LPH/S475L from 14/06/2010.
LFG captured and sent to Booster 2 - KELLER PR-23 sn 138899 till 09/02/2011 (the
same pressure transmitter was in place in the previous monitoring period as reported in the verification report /15/).;
- KELLER PR-23 sn 145076 from 09/02/2011. Engines booster 2
- KELLER PAA-21S sn 100692 till 05/05/2010 the same pressure transmitter was in place in the previous monitoring period as reported in the verification report /15/).;
- WIKA S-10 sn J035T/4103360 from 05/05/2010 to 12/03/2011.
- KELLER PAA-21S sn 128863 from 12/03/2011. LFG captured and sent to Booster 3
- KELLER PR-23 sn 138896 till 09/02/2011 (the same pressure transmitter was in place in the previous monitoring period as reporte in the verification report /15/).;
- KELLER PR-23 sn 145075 from 09/02/2011. Engines booster 3
GOLD STANDARD FINAL VERIFICATION/CERTIFICATION REPORT
GS Verification/Certification Report N° 2011-DG-01-MD, Rev.1.2 35 GS_VER_REP-05-10
- KELLER PAA-21S sn 100715 till 04/03/2011 (the same pressure transmitter was in place in the previous monitoring period as reported in the verification report /15/).;
- ABB 2600T sn 6410030690 from 04/03/2011. For each Booster is installed a flare; no gases have been flared during the monitoring period. Due to the calibration and maintenance than one device was in use at the monitoring point during the monitoring period.
Is accuracy of the monitoring equipment as stated in the PDD?
As reported in the verifcation report of the previous monitoring period /15/,as per the manufacturer data sheet the accuracy of the monitoring equipments is: ABB model 0,1% /; WIKA model 0,2% ; KELLER model 0.25% .
Calibration frequency/interval As reported in the verification report of the previous monitoring period /15/, following the recommendation of the technology provider the calibration frequency has been established every year. The calibration certificates related to the monitoring period have been checked and found to be correct /35/ /36/ /37/ /38/ /39/ /40/
Is the calibration interval in line with the monitoring plan of the PDD?
Yes.
How were the values in the monitoring report verified and cross-checked?
The values used for the ERs calculation /16/ and reported in the monitoring report /2/ have been cross checked with the Booster data log book /17/ /18/ /19/.
Does the data management (from monitoring equipment to emission reduction calculation) ensure correct transfer of data and reporting of emission reductions?
All activities are regulated by the Monitoring Manual /12/. The monitoring system is programmed to save automatically every 30 minutes. Data stored at the booster station server are transferred weekly to a computer and a back up hard drive.
If only partial data are available because activity levels or non-activity parameters have not been monitored in accordance with the registered monitoring plan, has the most conservative assumption theoretically possible been applied or has a request for deviation been approved?
In case of failures of the data recording system, no emission reduction will be claimed for that period. A lookbook will be written and will be registered the without data recording. Based on the Booster data log book /17/ /18/ /19/, during the monitoring period no such failures are noticed.
GOLD STANDARD FINAL VERIFICATION/CERTIFICATION REPORT
GS Verification/Certification Report N° 2011-DG-01-MD, Rev.1.2 36 GS_VER_REP-05-10
DATA/PARAMETER
Tflare �– ID26 Data Unit °C Description Temperature in the exhaust gas of the enclosed flare. Source of data to be used The temperature is measured is measured in continuous
by thermocouple. Measurement of temperature above 500 °C in the exhaust gas stream in the flare indicated that the flare is operating in a reliable way.
Value data for the monitoring period / Measuring frequency The thermocouple measure in continuous and it is
programmed to save automatically on real time. Reporting frequency and recording procedure
Each booster has a server unit which receives all the data from the flow meter and saves automatically on real time with pressure /17/ /18/ /19. The project has reported these values based on readings, in accordance with the registration requirement of the monitoring methodology and the monitoring plan.
Type of monitoring equipment Thermocouple. During the monitoring period the following instruments have been used:
- Flare Booster 1 ELIMKO TC02-1S4Y10-50/10-R1/2-Tr sn 08/26236 (the same temperature transmitter was in place in the previous monitoring period as reporte in the verification report /15/).;
- Flare Booster 2 ELIMKO TC02-1S4Y10-50/10-
R1/2-Tr sn 08/26237; from 7/8/2009 HAASE PT-RH-PT 5.0 sn 2007000740/920-1 8 the same pressure transmitter was in place in the previous monitoring period as reporte in the verification report /15/).;
Is accuracy of the monitoring equipment as stated in the PDD?
As reported in the verificaton report of the previous monitoring period /12/, as per the manufacturer data sheet the accuracy of the monitoring equipments is 0.5% .
Calibration frequency/interval As reported in the verification report of the previous monitoring period /12/, following the recommendation of the technology provider the calibration frequency has been established every year.
Is the calibration interval in line with the monitoring plan of the PDD?
Yes.
How were the values in the monitoring report verified and cross-checked?
The values used for the ERs calculation /16/ and reported in the monitoring report /2/ have been cross checked with the Booster data log book /17/ /18/ /19/.
Does the data management (from monitoring equipment to emission reduction calculation) ensure correct transfer of data and reporting of emission reductions?
All activities are regulated by the Monitoring Manual /12/. The monitoring system is programmed to save automatically every 30 minutes. Data stored at the booster station server are transferred weekly to a computer and a back up hard drive.
GOLD STANDARD FINAL VERIFICATION/CERTIFICATION REPORT
GS Verification/Certification Report N° 2011-DG-01-MD, Rev.1.2 37 GS_VER_REP-05-10
If only partial data are available because activity levels or non-activity parameters have not been monitored in accordance with the registered monitoring plan, has the most conservative assumption theoretically possible been applied or has a request for deviation been approved?
In case of failures of the data recording system, no emission reduction will be claimed for that period. A lookbook will be written and will be registered the without data recording. Based on the Booster data log book /17/ /18/ /19/, during the monitoring period no such failures are noticed.
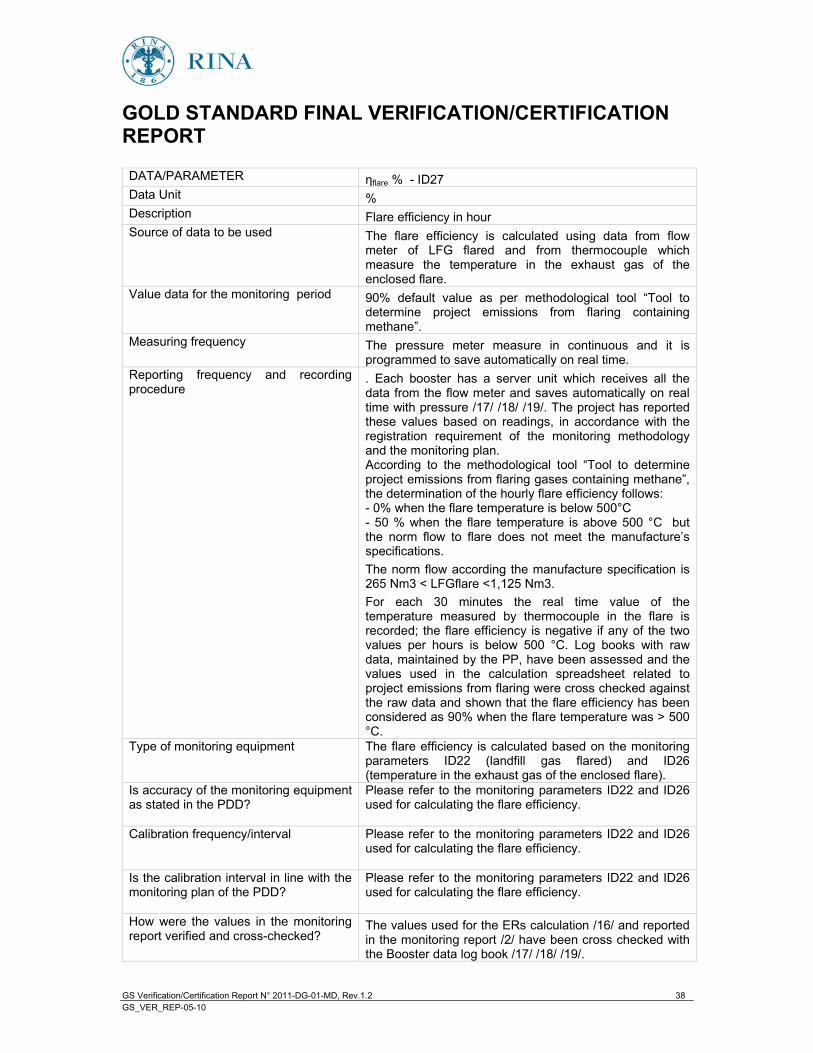
GOLD STANDARD FINAL VERIFICATION/CERTIFICATION REPORT
GS Verification/Certification Report N° 2011-DG-01-MD, Rev.1.2 38 GS_VER_REP-05-10
DATA/PARAMETER
flare % - ID27 Data Unit % Description Flare efficiency in hour Source of data to be used The flare efficiency is calculated using data from flow
meter of LFG flared and from thermocouple which measure the temperature in the exhaust gas of the enclosed flare.
Value data for the monitoring period 90% default value as per methodological tool �“Tool to determine project emissions from flaring containing methane�”.
Measuring frequency The pressure meter measure in continuous and it is programmed to save automatically on real time.
Reporting frequency and recording procedure
. Each booster has a server unit which receives all the data from the flow meter and saves automatically on real time with pressure /17/ /18/ /19/. The project has reported these values based on readings, in accordance with the registration requirement of the monitoring methodology and the monitoring plan. According to the methodological tool �“Tool to determine project emissions from flaring gases containing methane�”, the determination of the hourly flare efficiency follows: - 0% when the flare temperature is below 500°C - 50 % when the flare temperature is above 500 °C but the norm flow to flare does not meet the manufacture�’s specifications. The norm flow according the manufacture specification is 265 Nm3 < LFGflare <1,125 Nm3. For each 30 minutes the real time value of the temperature measured by thermocouple in the flare is recorded; the flare efficiency is negative if any of the two values per hours is below 500 °C. Log books with raw data, maintained by the PP, have been assessed and the values used in the calculation spreadsheet related to project emissions from flaring were cross checked against the raw data and shown that the flare efficiency has been considered as 90% when the flare temperature was > 500 °C.
Type of monitoring equipment The flare efficiency is calculated based on the monitoring parameters ID22 (landfill gas flared) and ID26 (temperature in the exhaust gas of the enclosed flare).
Is accuracy of the monitoring equipment as stated in the PDD?
Please refer to the monitoring parameters ID22 and ID26 used for calculating the flare efficiency.
Calibration frequency/interval Please refer to the monitoring parameters ID22 and ID26 used for calculating the flare efficiency.
Is the calibration interval in line with the monitoring plan of the PDD?
Please refer to the monitoring parameters ID22 and ID26 used for calculating the flare efficiency.
How were the values in the monitoring report verified and cross-checked?
The values used for the ERs calculation /16/ and reported in the monitoring report /2/ have been cross checked with the Booster data log book /17/ /18/ /19/.
GOLD STANDARD FINAL VERIFICATION/CERTIFICATION REPORT
GS Verification/Certification Report N° 2011-DG-01-MD, Rev.1.2 39 GS_VER_REP-05-10
Does the data management (from monitoring equipment to emission reduction calculation) ensure correct transfer of data and reporting of emission reductions?
All activities are regulated by the Monitoring Manual /12/. The monitoring system is programmed to save automatically every 30 minutes. Data stored at the booster station server are transferred weekly to a computer and a back up hard drive.
If only partial data are available because activity levels or non-activity parameters have not been monitored in accordance with the registered monitoring plan, has the most conservative assumption theoretically possible been applied or has a request for deviation been approved?
In case of failures of the data recording system, no emission reduction will be claimed for that period. A lookbook will be written and will be registered the period without data recording. Based on the Booster data log book /17/ /18/ /19/, during the monitoring period no such failures are noticed.
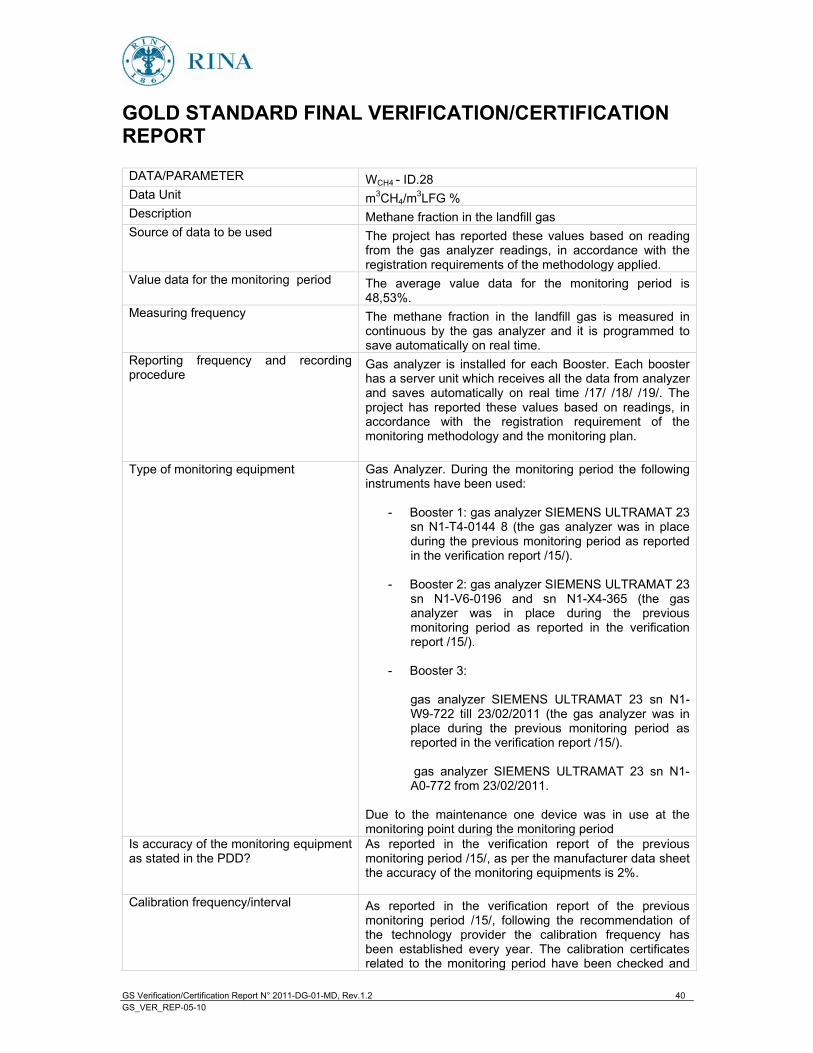
GOLD STANDARD FINAL VERIFICATION/CERTIFICATION REPORT
GS Verification/Certification Report N° 2011-DG-01-MD, Rev.1.2 40 GS_VER_REP-05-10
DATA/PARAMETER WCH4 - ID.28 Data Unit m3CH4/m3LFG % Description Methane fraction in the landfill gas Source of data to be used The project has reported these values based on reading
from the gas analyzer readings, in accordance with the registration requirements of the methodology applied.
Value data for the monitoring period The average value data for the monitoring period is 48,53%.
Measuring frequency The methane fraction in the landfill gas is measured in continuous by the gas analyzer and it is programmed to save automatically on real time.
Reporting frequency and recording procedure
Gas analyzer is installed for each Booster. Each booster has a server unit which receives all the data from analyzer and saves automatically on real time /17/ /18/ /19/. The project has reported these values based on readings, in accordance with the registration requirement of the monitoring methodology and the monitoring plan.
Type of monitoring equipment Gas Analyzer. During the monitoring period the following instruments have been used:
- Booster 1: gas analyzer SIEMENS ULTRAMAT 23 sn N1-T4-0144 8 (the gas analyzer was in place during the previous monitoring period as reported in the verification report /15/).
- Booster 2: gas analyzer SIEMENS ULTRAMAT 23
sn N1-V6-0196 and sn N1-X4-365 (the gas analyzer was in place during the previous monitoring period as reported in the verification report /15/).
- Booster 3:
gas analyzer SIEMENS ULTRAMAT 23 sn N1-W9-722 till 23/02/2011 (the gas analyzer was in place during the previous monitoring period as reported in the verification report /15/). gas analyzer SIEMENS ULTRAMAT 23 sn N1-A0-772 from 23/02/2011.
Due to the maintenance one device was in use at the monitoring point during the monitoring period
Is accuracy of the monitoring equipment as stated in the PDD?
As reported in the verification report of the previous monitoring period /15/, as per the manufacturer data sheet the accuracy of the monitoring equipments is 2%.
Calibration frequency/interval As reported in the verification report of the previous monitoring period /15/, following the recommendation of the technology provider the calibration frequency has been established every year. The calibration certificates related to the monitoring period have been checked and
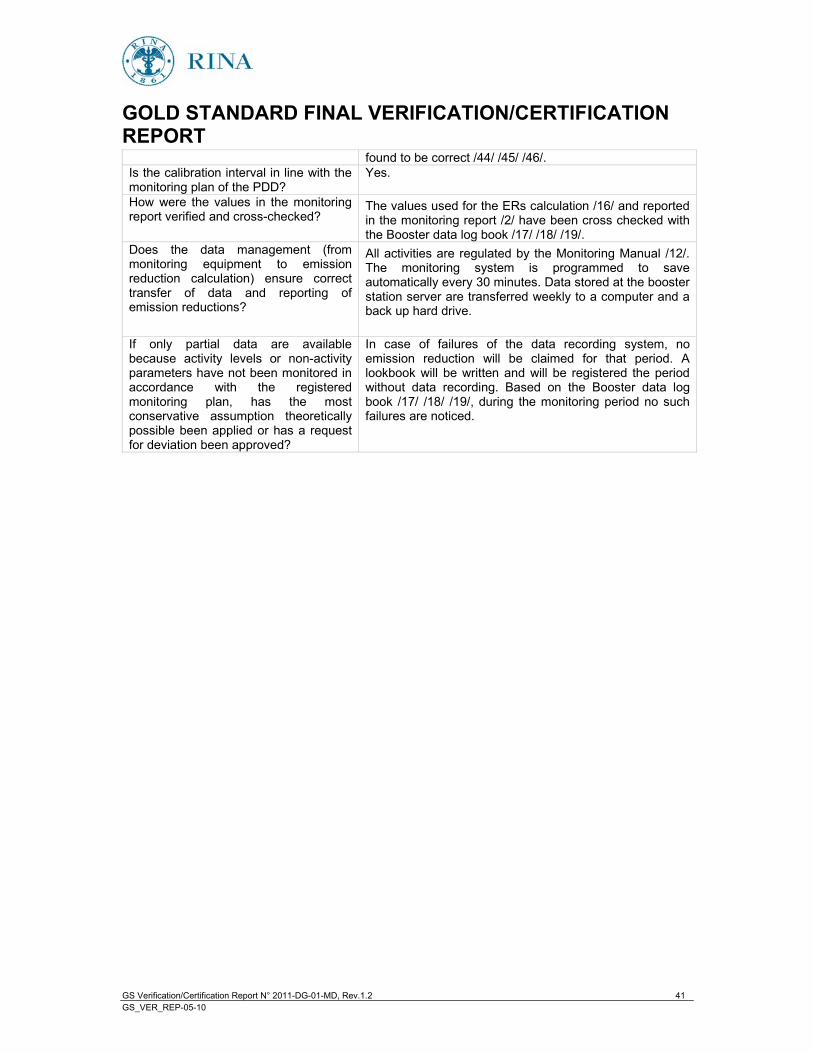
GOLD STANDARD FINAL VERIFICATION/CERTIFICATION REPORT
GS Verification/Certification Report N° 2011-DG-01-MD, Rev.1.2 41 GS_VER_REP-05-10
found to be correct /44/ /45/ /46/. Is the calibration interval in line with the monitoring plan of the PDD?
Yes.
How were the values in the monitoring report verified and cross-checked?
The values used for the ERs calculation /16/ and reported in the monitoring report /2/ have been cross checked with the Booster data log book /17/ /18/ /19/.
Does the data management (from monitoring equipment to emission reduction calculation) ensure correct transfer of data and reporting of emission reductions?
All activities are regulated by the Monitoring Manual /12/. The monitoring system is programmed to save automatically every 30 minutes. Data stored at the booster station server are transferred weekly to a computer and a back up hard drive.
If only partial data are available because activity levels or non-activity parameters have not been monitored in accordance with the registered monitoring plan, has the most conservative assumption theoretically possible been applied or has a request for deviation been approved?
In case of failures of the data recording system, no emission reduction will be claimed for that period. A lookbook will be written and will be registered the period without data recording. Based on the Booster data log book /17/ /18/ /19/, during the monitoring period no such failures are noticed.
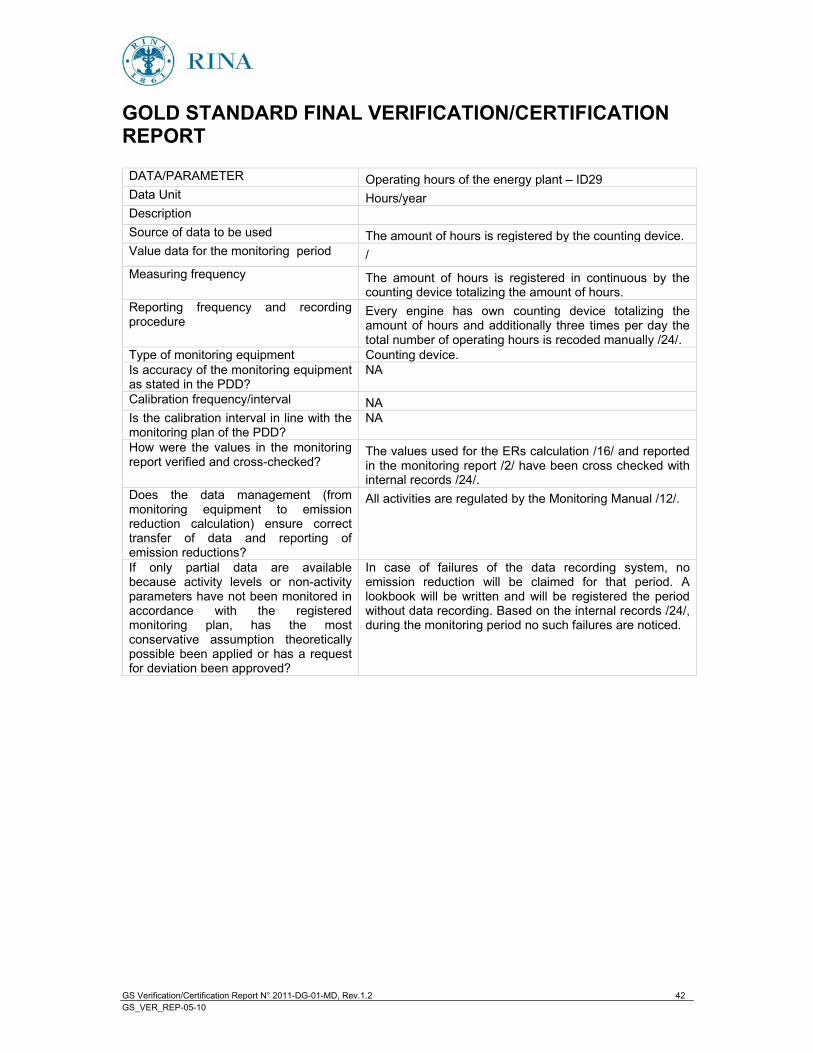
GOLD STANDARD FINAL VERIFICATION/CERTIFICATION REPORT
GS Verification/Certification Report N° 2011-DG-01-MD, Rev.1.2 42 GS_VER_REP-05-10
DATA/PARAMETER Operating hours of the energy plant �– ID29 Data Unit Hours/year Description Source of data to be used The amount of hours is registered by the counting device. Value data for the monitoring period / Measuring frequency The amount of hours is registered in continuous by the
counting device totalizing the amount of hours. Reporting frequency and recording procedure
Every engine has own counting device totalizing the amount of hours and additionally three times per day the total number of operating hours is recoded manually /24/.
Type of monitoring equipment Counting device. Is accuracy of the monitoring equipment as stated in the PDD?
NA
Calibration frequency/interval NA Is the calibration interval in line with the monitoring plan of the PDD?
NA
How were the values in the monitoring report verified and cross-checked?
The values used for the ERs calculation /16/ and reported in the monitoring report /2/ have been cross checked with internal records /24/.
Does the data management (from monitoring equipment to emission reduction calculation) ensure correct transfer of data and reporting of emission reductions?
All activities are regulated by the Monitoring Manual /12/.
If only partial data are available because activity levels or non-activity parameters have not been monitored in accordance with the registered monitoring plan, has the most conservative assumption theoretically possible been applied or has a request for deviation been approved?
In case of failures of the data recording system, no emission reduction will be claimed for that period. A lookbook will be written and will be registered the period without data recording. Based on the internal records /24/, during the monitoring period no such failures are noticed.
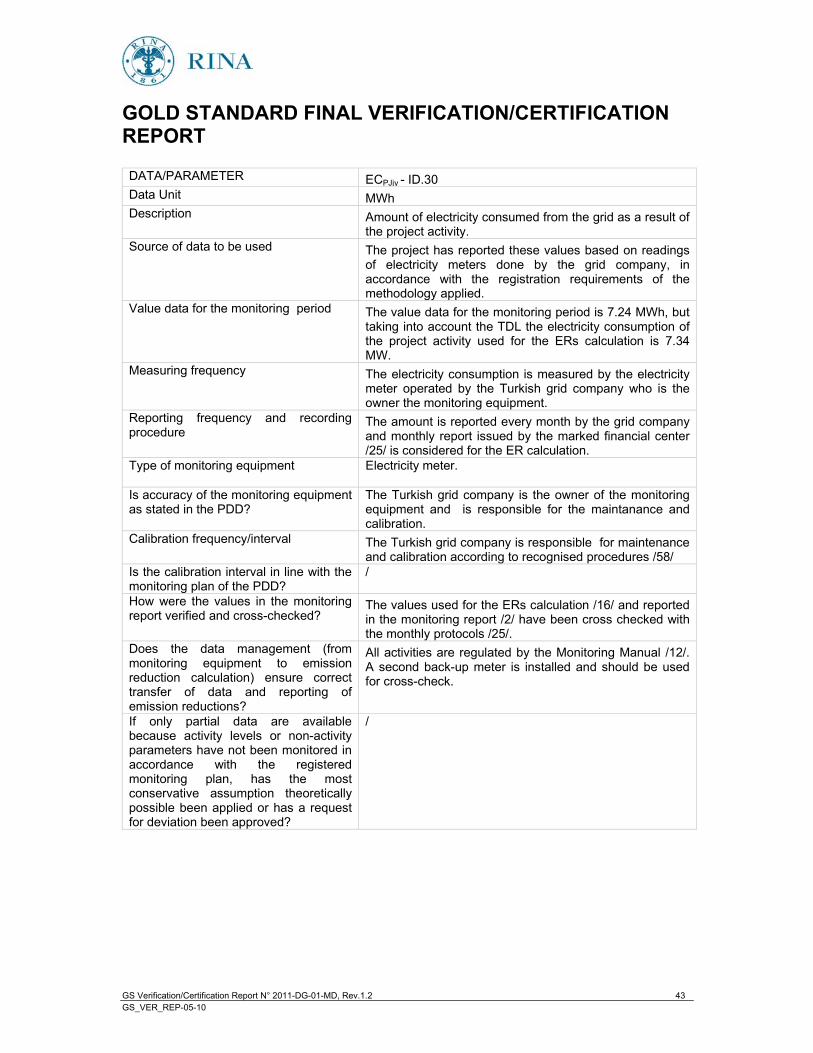
GOLD STANDARD FINAL VERIFICATION/CERTIFICATION REPORT
GS Verification/Certification Report N° 2011-DG-01-MD, Rev.1.2 43 GS_VER_REP-05-10
DATA/PARAMETER ECPJjy - ID.30 Data Unit MWh Description Amount of electricity consumed from the grid as a result of
the project activity. Source of data to be used The project has reported these values based on readings
of electricity meters done by the grid company, in accordance with the registration requirements of the methodology applied.
Value data for the monitoring period The value data for the monitoring period is 7.24 MWh, but taking into account the TDL the electricity consumption of the project activity used for the ERs calculation is 7.34 MW.
Measuring frequency The electricity consumption is measured by the electricity meter operated by the Turkish grid company who is the owner the monitoring equipment.
Reporting frequency and recording procedure
The amount is reported every month by the grid company and monthly report issued by the marked financial center /25/ is considered for the ER calculation.
Type of monitoring equipment Electricity meter.
Is accuracy of the monitoring equipment as stated in the PDD?
The Turkish grid company is the owner of the monitoring equipment and is responsible for the maintanance and calibration.
Calibration frequency/interval The Turkish grid company is responsible for maintenance and calibration according to recognised procedures /58/
Is the calibration interval in line with the monitoring plan of the PDD?
/
How were the values in the monitoring report verified and cross-checked?
The values used for the ERs calculation /16/ and reported in the monitoring report /2/ have been cross checked with the monthly protocols /25/.
Does the data management (from monitoring equipment to emission reduction calculation) ensure correct transfer of data and reporting of emission reductions?
All activities are regulated by the Monitoring Manual /12/. A second back-up meter is installed and should be used for cross-check.
If only partial data are available because activity levels or non-activity parameters have not been monitored in accordance with the registered monitoring plan, has the most conservative assumption theoretically possible been applied or has a request for deviation been approved?
/
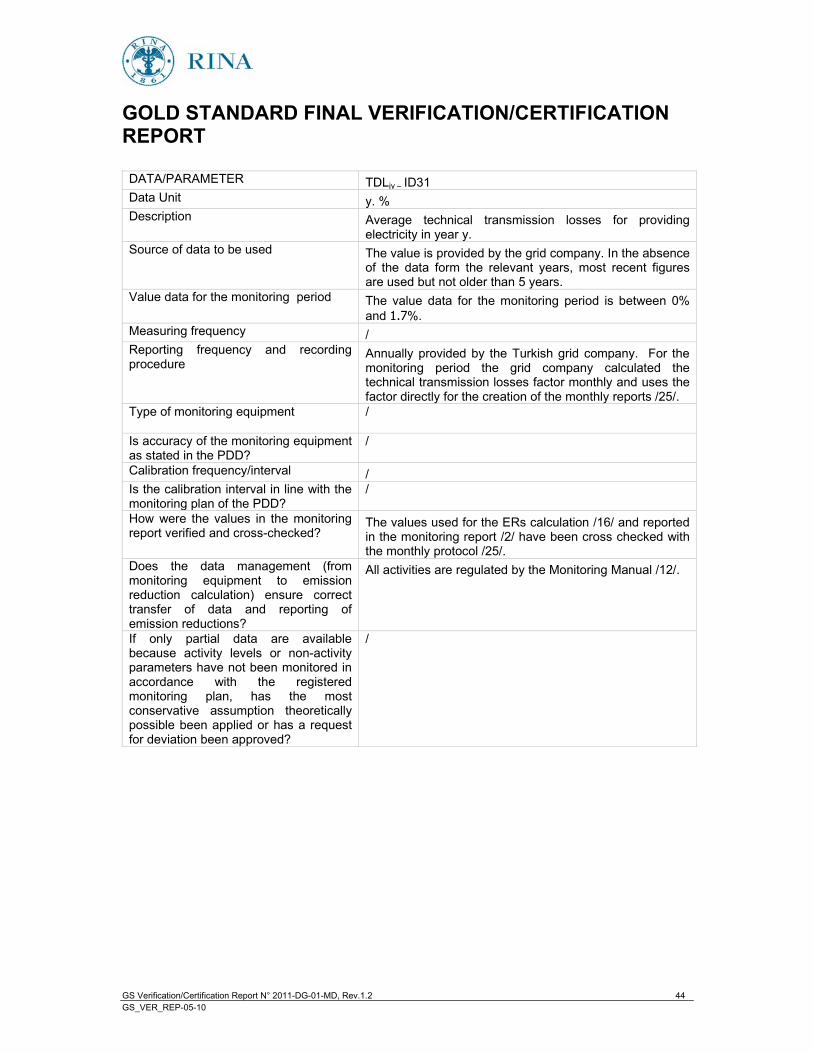
GOLD STANDARD FINAL VERIFICATION/CERTIFICATION REPORT
GS Verification/Certification Report N° 2011-DG-01-MD, Rev.1.2 44 GS_VER_REP-05-10
DATA/PARAMETER TDLjy �– ID31 Data Unit y. % Description Average technical transmission losses for providing
electricity in year y. Source of data to be used The value is provided by the grid company. In the absence
of the data form the relevant years, most recent figures are used but not older than 5 years.
Value data for the monitoring period The value data for the monitoring period is between 0% and 1.7%.
Measuring frequency / Reporting frequency and recording procedure
Annually provided by the Turkish grid company. For the monitoring period the grid company calculated the technical transmission losses factor monthly and uses the factor directly for the creation of the monthly reports /25/.
Type of monitoring equipment /
Is accuracy of the monitoring equipment as stated in the PDD?
/
Calibration frequency/interval / Is the calibration interval in line with the monitoring plan of the PDD?
/
How were the values in the monitoring report verified and cross-checked?
The values used for the ERs calculation /16/ and reported in the monitoring report /2/ have been cross checked with the monthly protocol /25/.
Does the data management (from monitoring equipment to emission reduction calculation) ensure correct transfer of data and reporting of emission reductions?
All activities are regulated by the Monitoring Manual /12/.
If only partial data are available because activity levels or non-activity parameters have not been monitored in accordance with the registered monitoring plan, has the most conservative assumption theoretically possible been applied or has a request for deviation been approved?
/
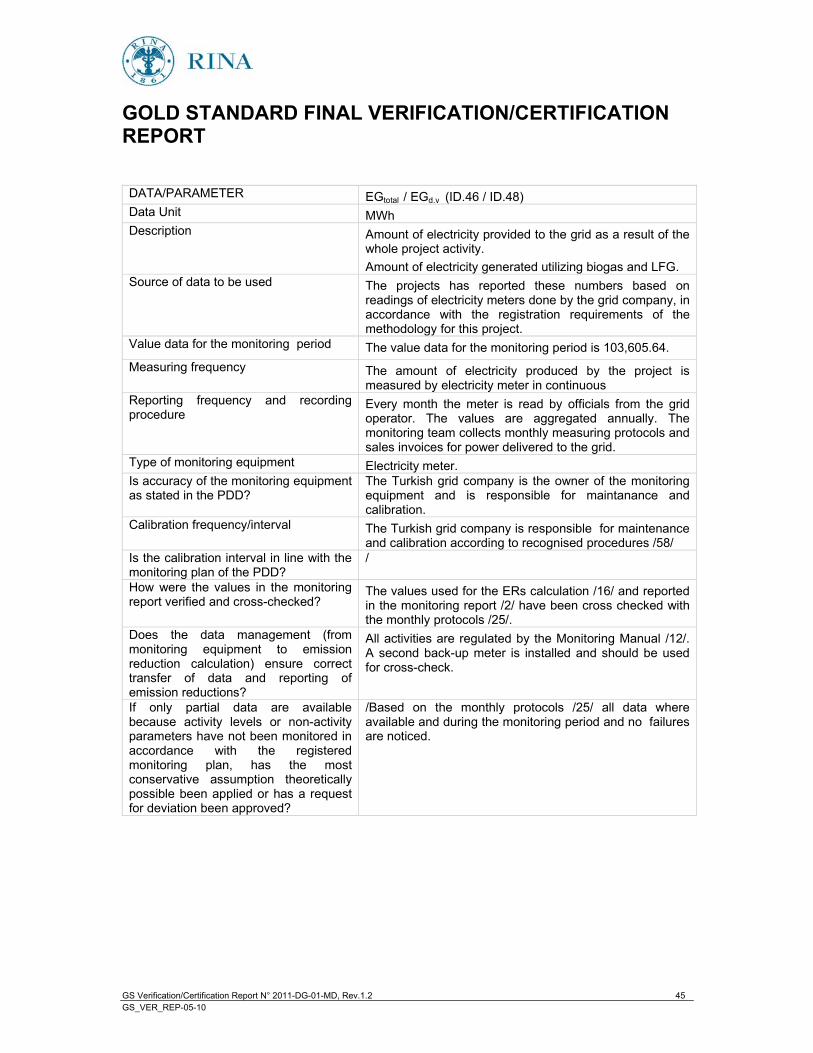
GOLD STANDARD FINAL VERIFICATION/CERTIFICATION REPORT
GS Verification/Certification Report N° 2011-DG-01-MD, Rev.1.2 45 GS_VER_REP-05-10
DATA/PARAMETER EGtotal / EGd,y (ID.46 / ID.48) Data Unit MWhDescription Amount of electricity provided to the grid as a result of the
whole project activity. Amount of electricity generated utilizing biogas and LFG.
Source of data to be used The projects has reported these numbers based on readings of electricity meters done by the grid company, in accordance with the registration requirements of the methodology for this project.
Value data for the monitoring period The value data for the monitoring period is 103,605.64. Measuring frequency The amount of electricity produced by the project is
measured by electricity meter in continuous Reporting frequency and recording procedure
Every month the meter is read by officials from the grid operator. The values are aggregated annually. The monitoring team collects monthly measuring protocols and sales invoices for power delivered to the grid.
Type of monitoring equipment Electricity meter. Is accuracy of the monitoring equipment as stated in the PDD?
The Turkish grid company is the owner of the monitoring equipment and is responsible for maintanance and calibration.
Calibration frequency/interval The Turkish grid company is responsible for maintenance and calibration according to recognised procedures /58/
Is the calibration interval in line with the monitoring plan of the PDD?
/
How were the values in the monitoring report verified and cross-checked?
The values used for the ERs calculation /16/ and reported in the monitoring report /2/ have been cross checked with the monthly protocols /25/.
Does the data management (from monitoring equipment to emission reduction calculation) ensure correct transfer of data and reporting of emission reductions?
All activities are regulated by the Monitoring Manual /12/. A second back-up meter is installed and should be used for cross-check.
If only partial data are available because activity levels or non-activity parameters have not been monitored in accordance with the registered monitoring plan, has the most conservative assumption theoretically possible been applied or has a request for deviation been approved?
/Based on the monthly protocols /25/ all data where available and during the monitoring period and no failures are noticed.
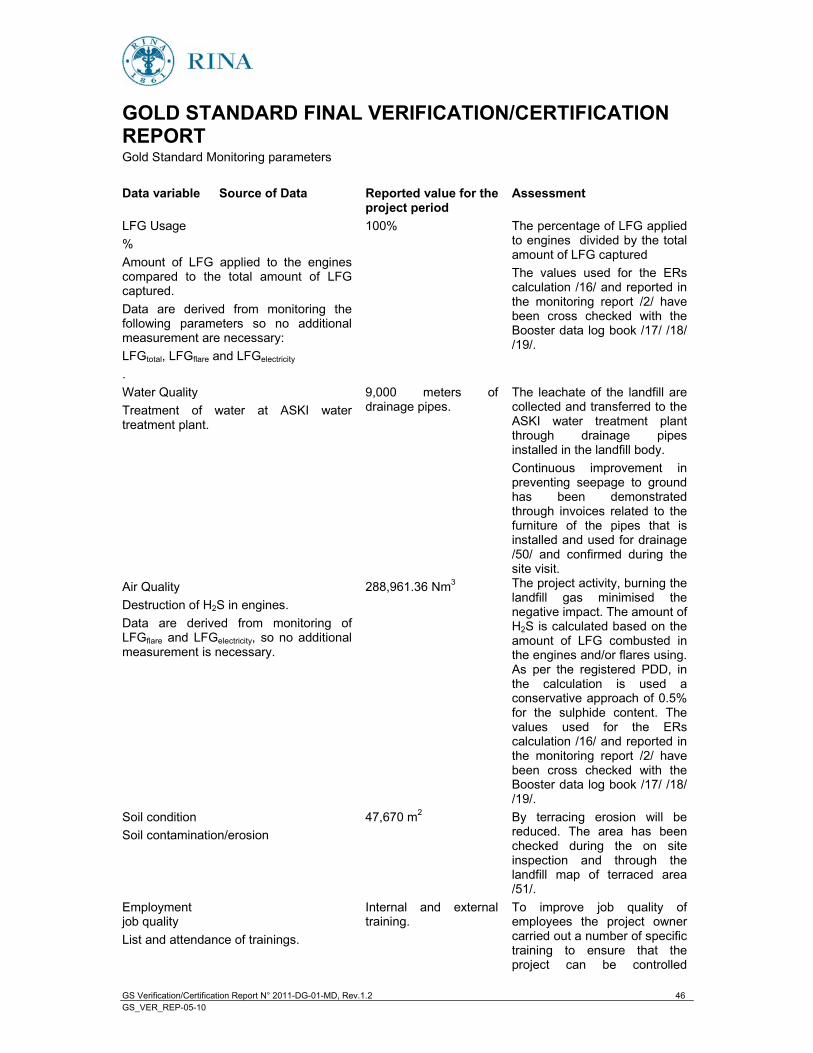
GOLD STANDARD FINAL VERIFICATION/CERTIFICATION REPORT
GS Verification/Certification Report N° 2011-DG-01-MD, Rev.1.2 46 GS_VER_REP-05-10
Gold Standard Monitoring parameters Data variable Source of Data Reported value for the
project period Assessment
LFG Usage %
100% The percentage of LFG applied to engines divided by the total amount of LFG captured The values used for the ERs calculation /16/ and reported in the monitoring report /2/ have been cross checked with the Booster data log book /17/ /18/ /19/.
Amount of LFG applied to the engines compared to the total amount of LFG captured. Data are derived from monitoring the following parameters so no additional measurement are necessary: LFGtotal, LFGflare and LFGelectricity
. Water Quality 9,000 meters of
drainage pipes. The leachate of the landfill are collected and transferred to the ASKI water treatment plant through drainage pipes installed in the landfill body. Continuous improvement in preventing seepage to ground has been demonstrated through invoices related to the furniture of the pipes that is installed and used for drainage /50/ and confirmed during the site visit.
Treatment of water at ASKI water treatment plant.
Air Quality 288,961.36 Nm3 The project activity, burning the landfill gas minimised the negative impact. The amount of H2S is calculated based on the amount of LFG combusted in the engines and/or flares using. As per the registered PDD, in the calculation is used a conservative approach of 0.5% for the sulphide content. The values used for the ERs calculation /16/ and reported in the monitoring report /2/ have been cross checked with the Booster data log book /17/ /18/ /19/.
Destruction of H2S in engines. Data are derived from monitoring of LFGflare and LFGelectricity, so no additional measurement is necessary.
Soil condition 47,670 m2 By terracing erosion will be reduced. The area has been checked during the on site inspection and through the landfill map of terraced area /51/.
Soil contamination/erosion
Employment job quality
Internal and external training.
To improve job quality of employees the project owner carried out a number of specific training to ensure that the project can be controlled
List and attendance of trainings.
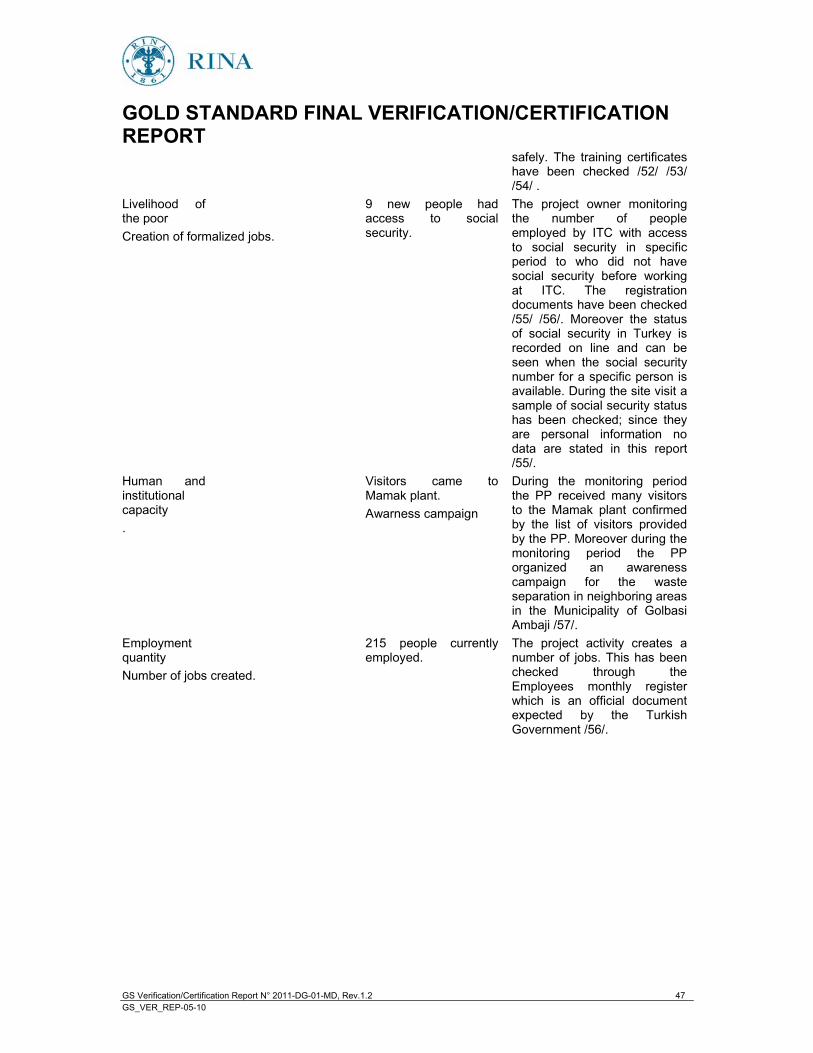
GOLD STANDARD FINAL VERIFICATION/CERTIFICATION REPORT
GS Verification/Certification Report N° 2011-DG-01-MD, Rev.1.2 47 GS_VER_REP-05-10
safely. The training certificates have been checked /52/ /53/ /54/ .
Livelihood of the poor
9 new people had access to social security.
The project owner monitoring the number of people employed by ITC with access to social security in specific period to who did not have social security before working at ITC. The registration documents have been checked /55/ /56/. Moreover the status of social security in Turkey is recorded on line and can be seen when the social security number for a specific person is available. During the site visit a sample of social security status has been checked; since they are personal information no data are stated in this report /55/.
Creation of formalized jobs.
Human and institutional capacity
Visitors came to Mamak plant. Awarness campaign
During the monitoring period the PP received many visitors to the Mamak plant confirmed by the list of visitors provided by the PP. Moreover during the monitoring period the PP organized an awareness campaign for the waste separation in neighboring areas in the Municipality of Golbasi Ambaji /57/.
.
Employment quantity
215 people currently employed.
The project activity creates a number of jobs. This has been checked through the Employees monthly register which is an official document expected by the Turkish Government /56/.
Number of jobs created.
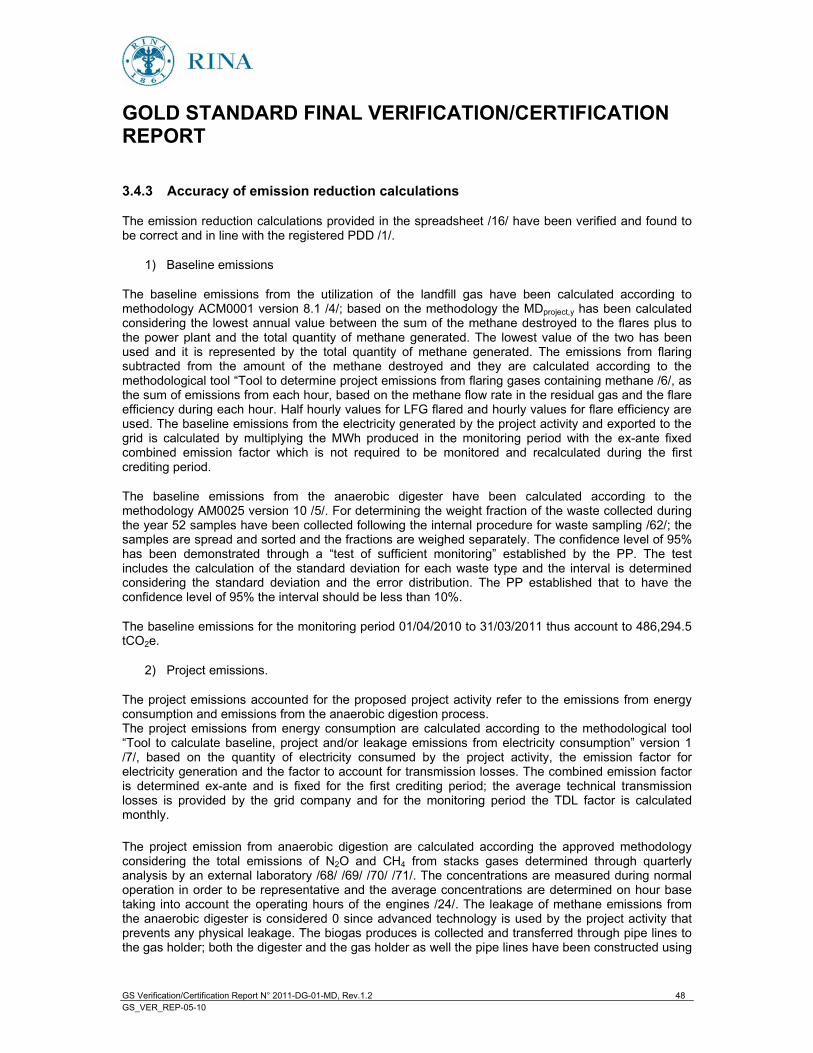
GOLD STANDARD FINAL VERIFICATION/CERTIFICATION REPORT
GS Verification/Certification Report N° 2011-DG-01-MD, Rev.1.2 48 GS_VER_REP-05-10
3.4.3 Accuracy of emission reduction calculations
The emission reduction calculations provided in the spreadsheet /16/ have been verified and found to be correct and in line with the registered PDD /1/.
1) Baseline emissions
The baseline emissions from the utilization of the landfill gas have been calculated according to methodology ACM0001 version 8.1 /4/; based on the methodology the MDproject,y has been calculated considering the lowest annual value between the sum of the methane destroyed to the flares plus to the power plant and the total quantity of methane generated. The lowest value of the two has been used and it is represented by the total quantity of methane generated. The emissions from flaring subtracted from the amount of the methane destroyed and they are calculated according to the methodological tool �“Tool to determine project emissions from flaring gases containing methane /6/, as the sum of emissions from each hour, based on the methane flow rate in the residual gas and the flare efficiency during each hour. Half hourly values for LFG flared and hourly values for flare efficiency are used. The baseline emissions from the electricity generated by the project activity and exported to the grid is calculated by multiplying the MWh produced in the monitoring period with the ex-ante fixed combined emission factor which is not required to be monitored and recalculated during the first crediting period.
The baseline emissions from the anaerobic digester have been calculated according to the methodology AM0025 version 10 /5/. For determining the weight fraction of the waste collected during the year 52 samples have been collected following the internal procedure for waste sampling /62/; the samples are spread and sorted and the fractions are weighed separately. The confidence level of 95% has been demonstrated through a �“test of sufficient monitoring�” established by the PP. The test includes the calculation of the standard deviation for each waste type and the interval is determined considering the standard deviation and the error distribution. The PP established that to have the confidence level of 95% the interval should be less than 10%.
The baseline emissions for the monitoring period 01/04/2010 to 31/03/2011 thus account to 486,294.5 tCO2e.
2) Project emissions.
The project emissions accounted for the proposed project activity refer to the emissions from energy consumption and emissions from the anaerobic digestion process. The project emissions from energy consumption are calculated according to the methodological tool �“Tool to calculate baseline, project and/or leakage emissions from electricity consumption�” version 1 /7/, based on the quantity of electricity consumed by the project activity, the emission factor for electricity generation and the factor to account for transmission losses. The combined emission factor is determined ex-ante and is fixed for the first crediting period; the average technical transmission losses is provided by the grid company and for the monitoring period the TDL factor is calculated monthly.
The project emission from anaerobic digestion are calculated according the approved methodology considering the total emissions of N2O and CH4 from stacks gases determined through quarterly analysis by an external laboratory /68/ /69/ /70/ /71/. The concentrations are measured during normal operation in order to be representative and the average concentrations are determined on hour base taking into account the operating hours of the engines /24/. The leakage of methane emissions from the anaerobic digester is considered 0 since advanced technology is used by the project activity that prevents any physical leakage. The biogas produces is collected and transferred through pipe lines to the gas holder; both the digester and the gas holder as well the pipe lines have been constructed using
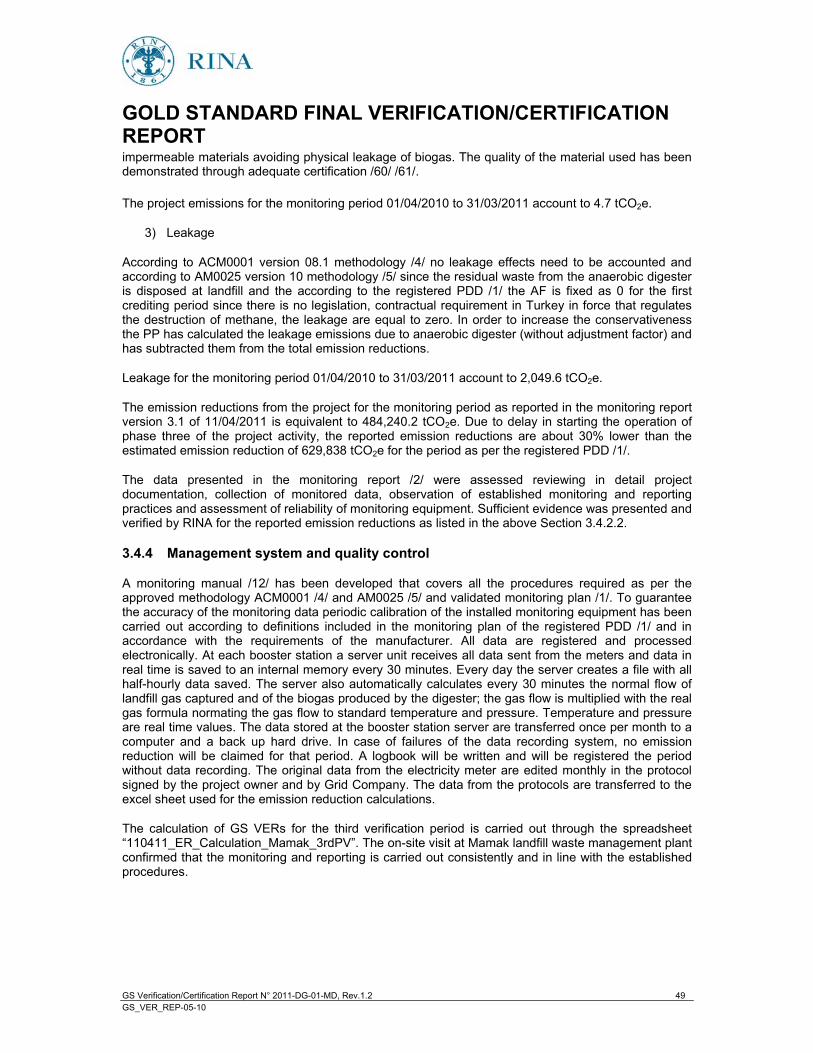
GOLD STANDARD FINAL VERIFICATION/CERTIFICATION REPORT
GS Verification/Certification Report N° 2011-DG-01-MD, Rev.1.2 49 GS_VER_REP-05-10
impermeable materials avoiding physical leakage of biogas. The quality of the material used has been demonstrated through adequate certification /60/ /61/.
The project emissions for the monitoring period 01/04/2010 to 31/03/2011 account to 4.7 tCO2e.
3) Leakage
According to ACM0001 version 08.1 methodology /4/ no leakage effects need to be accounted and according to AM0025 version 10 methodology /5/ since the residual waste from the anaerobic digester is disposed at landfill and the according to the registered PDD /1/ the AF is fixed as 0 for the first crediting period since there is no legislation, contractual requirement in Turkey in force that regulates the destruction of methane, the leakage are equal to zero. In order to increase the conservativeness the PP has calculated the leakage emissions due to anaerobic digester (without adjustment factor) and has subtracted them from the total emission reductions.
Leakage for the monitoring period 01/04/2010 to 31/03/2011 account to 2,049.6 tCO2e.
The emission reductions from the project for the monitoring period as reported in the monitoring report version 3.1 of 11/04/2011 is equivalent to 484,240.2 tCO2e. Due to delay in starting the operation of phase three of the project activity, the reported emission reductions are about 30% lower than the estimated emission reduction of 629,838 tCO2e for the period as per the registered PDD /1/.
The data presented in the monitoring report /2/ were assessed reviewing in detail project documentation, collection of monitored data, observation of established monitoring and reporting practices and assessment of reliability of monitoring equipment. Sufficient evidence was presented and verified by RINA for the reported emission reductions as listed in the above Section 3.4.2.2.
3.4.4 Management system and quality control
A monitoring manual /12/ has been developed that covers all the procedures required as per the approved methodology ACM0001 /4/ and AM0025 /5/ and validated monitoring plan /1/. To guarantee the accuracy of the monitoring data periodic calibration of the installed monitoring equipment has been carried out according to definitions included in the monitoring plan of the registered PDD /1/ and in accordance with the requirements of the manufacturer. All data are registered and processed electronically. At each booster station a server unit receives all data sent from the meters and data in real time is saved to an internal memory every 30 minutes. Every day the server creates a file with all half-hourly data saved. The server also automatically calculates every 30 minutes the normal flow of landfill gas captured and of the biogas produced by the digester; the gas flow is multiplied with the real gas formula normating the gas flow to standard temperature and pressure. Temperature and pressure are real time values. The data stored at the booster station server are transferred once per month to a computer and a back up hard drive. In case of failures of the data recording system, no emission reduction will be claimed for that period. A logbook will be written and will be registered the period without data recording. The original data from the electricity meter are edited monthly in the protocol signed by the project owner and by Grid Company. The data from the protocols are transferred to the excel sheet used for the emission reduction calculations.
The calculation of GS VERs for the third verification period is carried out through the spreadsheet �“110411_ER_Calculation_Mamak_3rdPV�”. The on-site visit at Mamak landfill waste management plant confirmed that the monitoring and reporting is carried out consistently and in line with the established procedures.
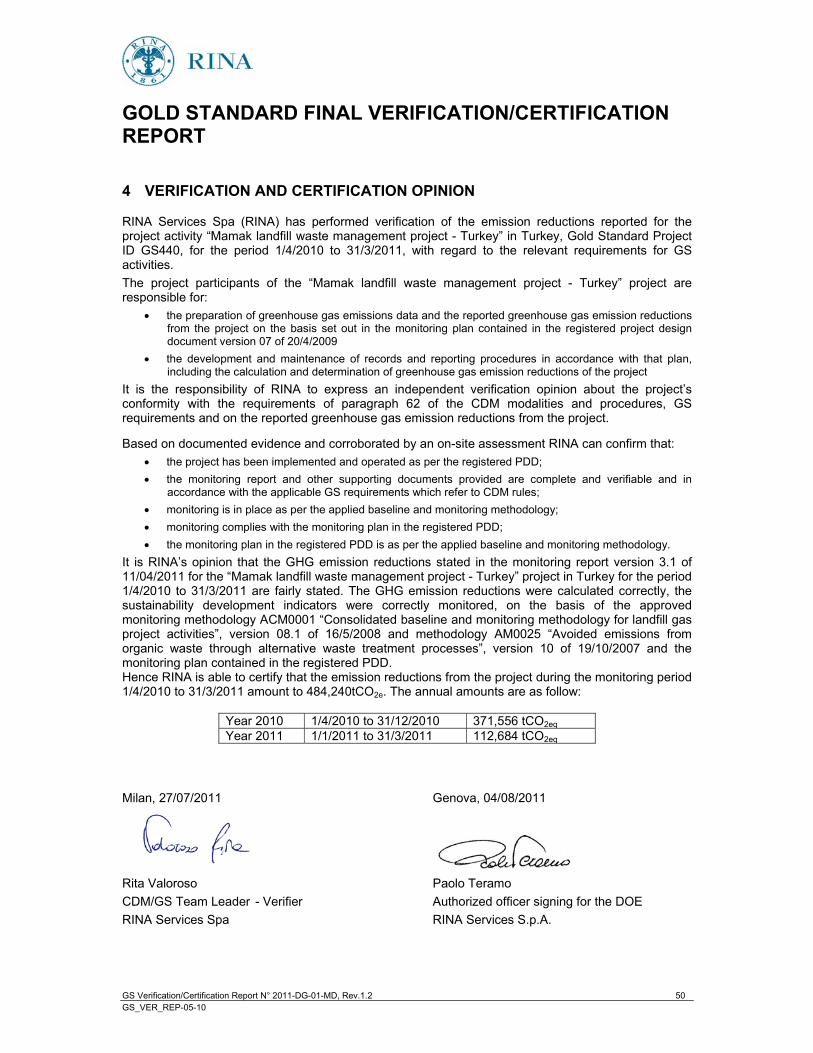
GOLD STANDARD FINAL VERIFICATION/CERTIFICATION REPORT
GS Verification/Certification Report N° 2011-DG-01-MD, Rev.1.2 50 GS_VER_REP-05-10
4 VERIFICATION AND CERTIFICATION OPINION
RINA Services Spa (RINA) has performed verification of the emission reductions reported for the project activity �“Mamak landfill waste management project - Turkey�” in Turkey, Gold Standard Project ID GS440, for the period 1/4/2010 to 31/3/2011, with regard to the relevant requirements for GS activities. The project participants of the �“Mamak landfill waste management project - Turkey�” project are responsible for:
the preparation of greenhouse gas emissions data and the reported greenhouse gas emission reductions from the project on the basis set out in the monitoring plan contained in the registered project design document version 07 of 20/4/2009
the development and maintenance of records and reporting procedures in accordance with that plan, including the calculation and determination of greenhouse gas emission reductions of the project
It is the responsibility of RINA to express an independent verification opinion about the project�’s conformity with the requirements of paragraph 62 of the CDM modalities and procedures, GS requirements and on the reported greenhouse gas emission reductions from the project.
Based on documented evidence and corroborated by an on-site assessment RINA can confirm that: the project has been implemented and operated as per the registered PDD; the monitoring report and other supporting documents provided are complete and verifiable and in
accordance with the applicable GS requirements which refer to CDM rules; monitoring is in place as per the applied baseline and monitoring methodology; monitoring complies with the monitoring plan in the registered PDD; the monitoring plan in the registered PDD is as per the applied baseline and monitoring methodology.
It is RINA�’s opinion that the GHG emission reductions stated in the monitoring report version 3.1 of 11/04/2011 for the �“Mamak landfill waste management project - Turkey�” project in Turkey for the period 1/4/2010 to 31/3/2011 are fairly stated. The GHG emission reductions were calculated correctly, the sustainability development indicators were correctly monitored, on the basis of the approved monitoring methodology ACM0001 �“Consolidated baseline and monitoring methodology for landfill gas project activities�”, version 08.1 of 16/5/2008 and methodology AM0025 �“Avoided emissions from organic waste through alternative waste treatment processes�”, version 10 of 19/10/2007 and the monitoring plan contained in the registered PDD. Hence RINA is able to certify that the emission reductions from the project during the monitoring period 1/4/2010 to 31/3/2011 amount to 484,240tCO2e. The annual amounts are as follow:
Year 2010 1/4/2010 to 31/12/2010 371,556 tCO2eq Year 2011 1/1/2011 to 31/3/2011 112,684 tCO2eq
Milan, 27/07/2011 Genova, 04/08/2011
Rita Valoroso Paolo Teramo CDM/GS Team Leader - Verifier Authorized officer signing for the DOE RINA Services Spa RINA Services S.p.A.
RINA Mamak landfill waste management project – Turkey
GS Verification/Certification Report N° 2011-DG-01-MD, Rev. 1.2 Page A-1 GS_VER_REP-05-10
APPENDIX A
VERIFICATION PROTOCOL
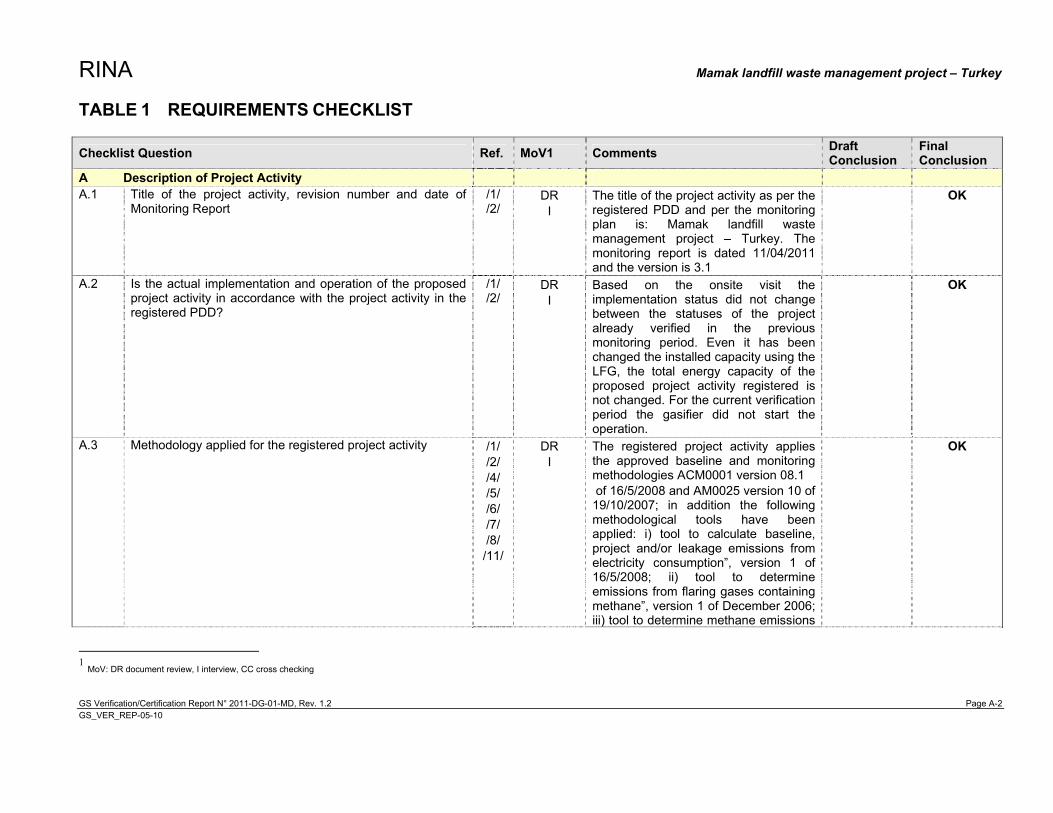
RINA Mamak landfill waste management project – Turkey
GS Verification/Certification Report N° 2011-DG-01-MD, Rev. 1.2 Page A-2 GS_VER_REP-05-10
TABLE 1 REQUIREMENTS CHECKLIST Checklist Question Ref. MoV1 Comments Draft
Conclusion Final Conclusion
A Description of Project Activity A.1 Title of the project activity, revision number and date of
Monitoring Report /1/ /2/
DR I
The title of the project activity as per the registered PDD and per the monitoring plan is: Mamak landfill waste management project �– Turkey. The monitoring report is dated 11/04/2011 and the version is 3.1
OK
A.2 Is the actual implementation and operation of the proposed project activity in accordance with the project activity in the registered PDD?
/1/ /2/
DR I
Based on the onsite visit the implementation status did not change between the statuses of the project already verified in the previous monitoring period. Even it has been changed the installed capacity using the LFG, the total energy capacity of the proposed project activity registered is not changed. For the current verification period the gasifier did not start the operation.
OK
A.3 Methodology applied for the registered project activity /1/ /2/ /4/ /5/ /6/ /7/ /8/ /11/
DR I
The registered project activity applies the approved baseline and monitoring methodologies ACM0001 version 08.1 of 16/5/2008 and AM0025 version 10 of 19/10/2007; in addition the following methodological tools have been applied: i) tool to calculate baseline, project and/or leakage emissions from electricity consumption�”, version 1 of 16/5/2008; ii) tool to determine emissions from flaring gases containing methane�”, version 1 of December 2006; iii) tool to determine methane emissions
OK
1 MoV: DR document review, I interview, CC cross checking
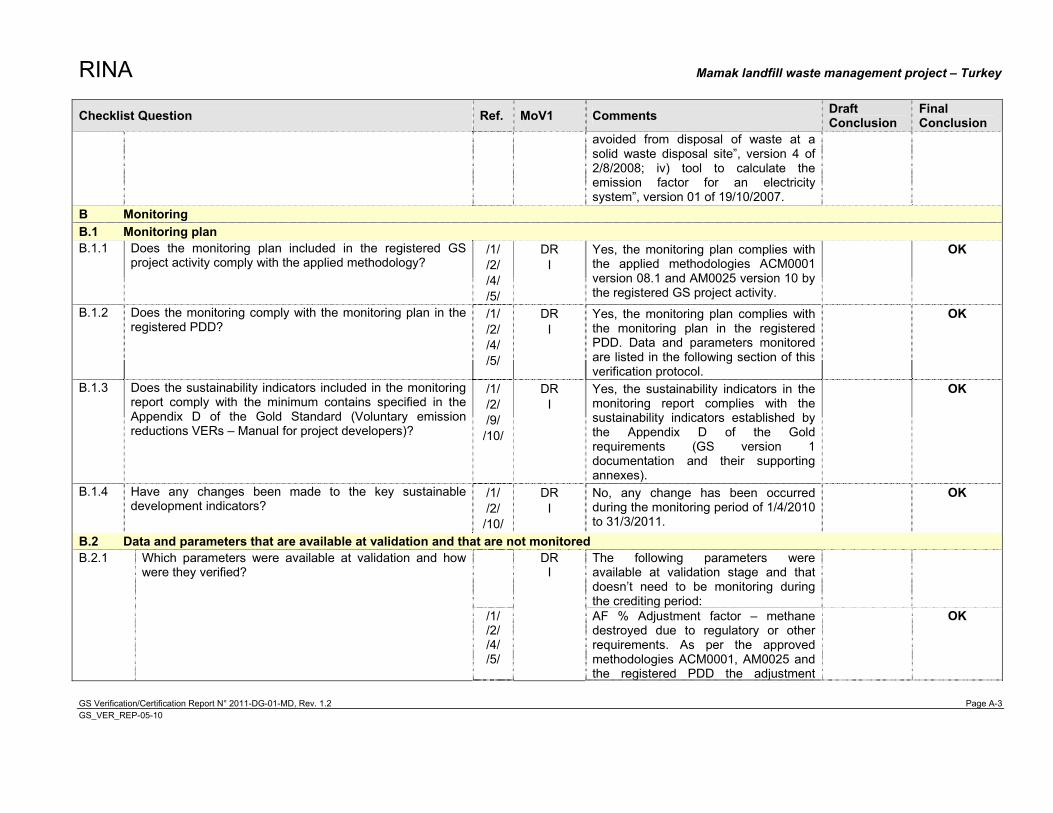
RINA Mamak landfill waste management project – Turkey
GS Verification/Certification Report N° 2011-DG-01-MD, Rev. 1.2 Page A-3 GS_VER_REP-05-10
Checklist Question Ref. MoV1 Comments Draft Conclusion
Final Conclusion
avoided from disposal of waste at a solid waste disposal site�”, version 4 of 2/8/2008; iv) tool to calculate the emission factor for an electricity system�”, version 01 of 19/10/2007.
B Monitoring B.1 Monitoring plan B.1.1 Does the monitoring plan included in the registered GS
project activity comply with the applied methodology? /1/ /2/ /4/ /5/
DR I
Yes, the monitoring plan complies with the applied methodologies ACM0001 version 08.1 and AM0025 version 10 by the registered GS project activity.
OK
B.1.2 Does the monitoring comply with the monitoring plan in the registered PDD?
/1/ /2/ /4/ /5/
DR I
Yes, the monitoring plan complies with the monitoring plan in the registered PDD. Data and parameters monitored are listed in the following section of this verification protocol.
OK
B.1.3 Does the sustainability indicators included in the monitoring report comply with the minimum contains specified in the Appendix D of the Gold Standard (Voluntary emission reductions VERs �– Manual for project developers)?
/1/ /2/ /9/ /10/
DR I
Yes, the sustainability indicators in the monitoring report complies with the sustainability indicators established by the Appendix D of the Gold requirements (GS version 1 documentation and their supporting annexes).
OK
B.1.4 Have any changes been made to the key sustainable development indicators?
/1/ /2/ /10/
DR I
No, any change has been occurred during the monitoring period of 1/4/2010 to 31/3/2011.
OK
B.2 Data and parameters that are available at validation and that are not monitored B.2.1 Which parameters were available at validation and how
were they verified? DR
I The following parameters were available at validation stage and that doesn�’t need to be monitoring during the crediting period:
/1/ /2/ /4/ /5/
AF % Adjustment factor �– methane destroyed due to regulatory or other requirements. As per the approved methodologies ACM0001, AM0025 and the registered PDD the adjustment
OK
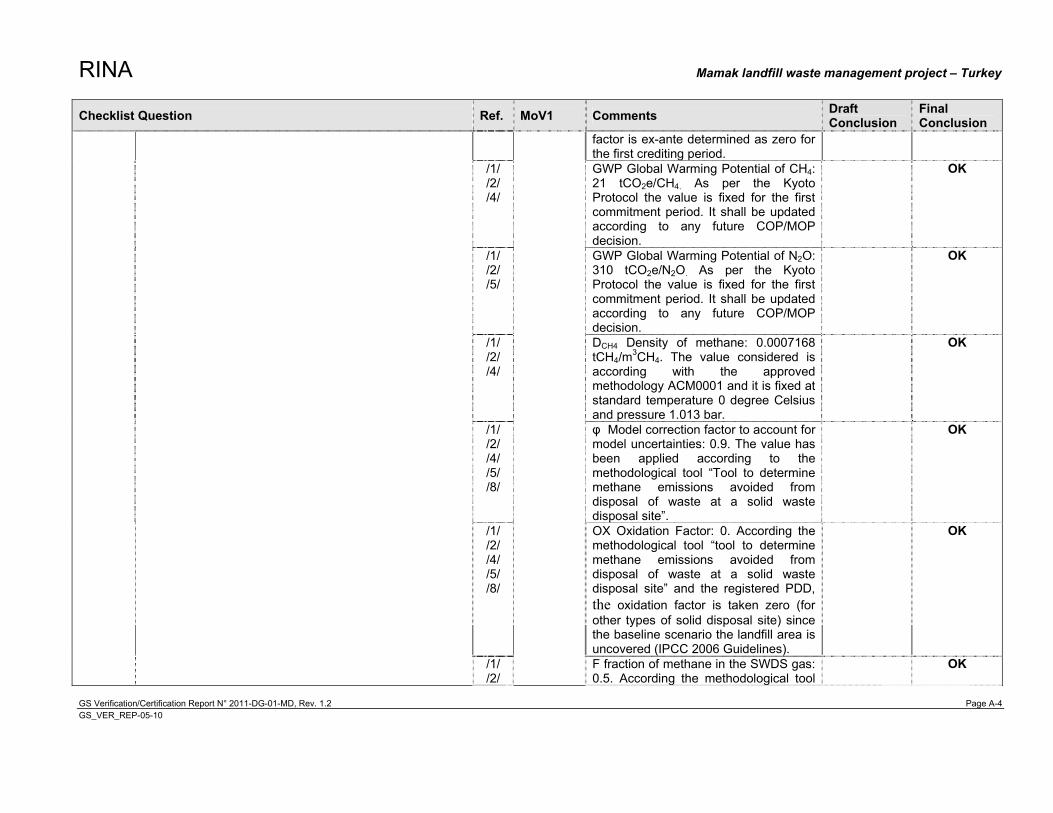
RINA Mamak landfill waste management project – Turkey
GS Verification/Certification Report N° 2011-DG-01-MD, Rev. 1.2 Page A-4 GS_VER_REP-05-10
Checklist Question Ref. MoV1 Comments Draft Conclusion
Final Conclusion
factor is ex-ante determined as zero for the first crediting period.
/1/ /2/ /4/
GWP Global Warming Potential of CH4: 21 tCO2e/CH4. As per the Kyoto Protocol the value is fixed for the first commitment period. It shall be updated according to any future COP/MOP decision.
OK
/1/ /2/ /5/
GWP Global Warming Potential of N2O: 310 tCO2e/N2O. As per the Kyoto Protocol the value is fixed for the first commitment period. It shall be updated according to any future COP/MOP decision.
OK
/1/ /2/ /4/
DCH4 Density of methane: 0.0007168 tCH4/m3CH4. The value considered is according with the approved methodology ACM0001 and it is fixed at standard temperature 0 degree Celsius and pressure 1.013 bar.
OK
/1/ /2/ /4/ /5/ /8/
Model correction factor to account for model uncertainties: 0.9. The value has been applied according to the methodological tool �“Tool to determine methane emissions avoided from disposal of waste at a solid waste disposal site�”.
OK
/1/ /2/ /4/ /5/ /8/
OX Oxidation Factor: 0. According the methodological tool �“tool to determine methane emissions avoided from disposal of waste at a solid waste disposal site�” and the registered PDD, the oxidation factor is taken zero (for other types of solid disposal site) since the baseline scenario the landfill area is uncovered (IPCC 2006 Guidelines).
OK
/1/ /2/
F fraction of methane in the SWDS gas: 0.5. According the methodological tool
OK
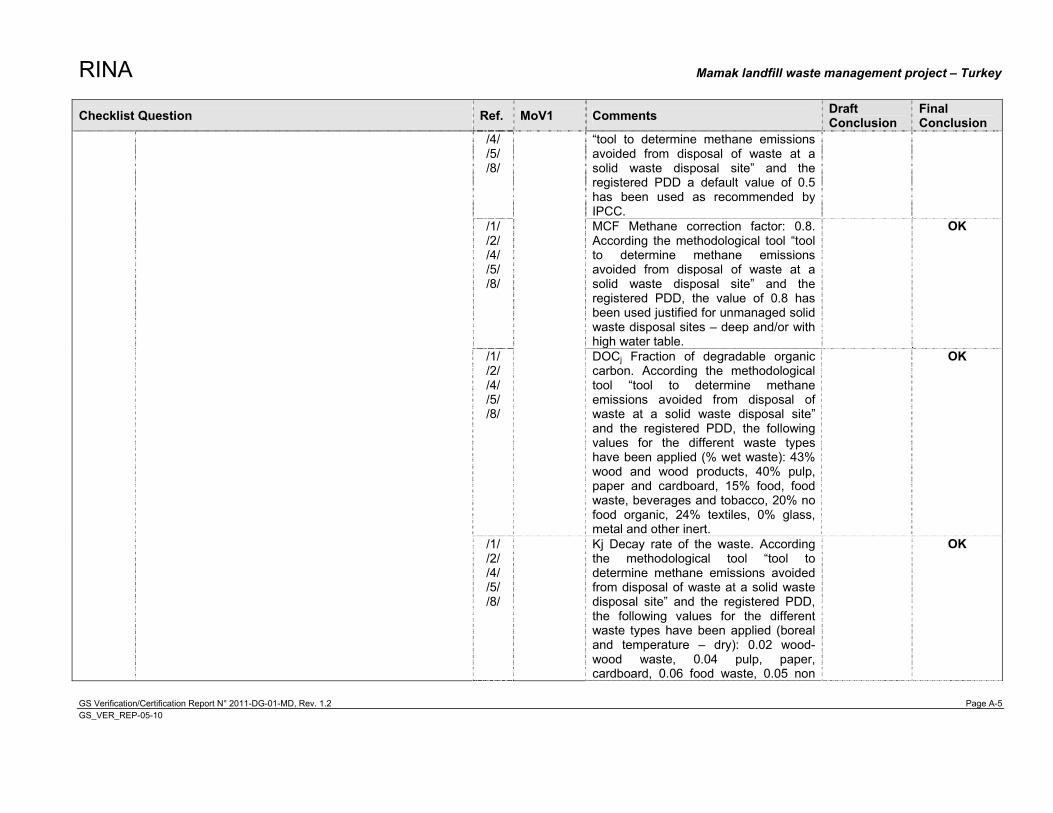
RINA Mamak landfill waste management project – Turkey
GS Verification/Certification Report N° 2011-DG-01-MD, Rev. 1.2 Page A-5 GS_VER_REP-05-10
Checklist Question Ref. MoV1 Comments Draft Conclusion
Final Conclusion
/4/ /5/ /8/
�“tool to determine methane emissions avoided from disposal of waste at a solid waste disposal site�” and the registered PDD a default value of 0.5 has been used as recommended by IPCC.
/1/ /2/ /4/ /5/ /8/
MCF Methane correction factor: 0.8. According the methodological tool �“tool to determine methane emissions avoided from disposal of waste at a solid waste disposal site�” and the registered PDD, the value of 0.8 has been used justified for unmanaged solid waste disposal sites �– deep and/or with high water table.
OK
/1/ /2/ /4/ /5/ /8/
DOCj Fraction of degradable organic carbon. According the methodological tool �“tool to determine methane emissions avoided from disposal of waste at a solid waste disposal site�” and the registered PDD, the following values for the different waste types have been applied (% wet waste): 43% wood and wood products, 40% pulp, paper and cardboard, 15% food, food waste, beverages and tobacco, 20% no food organic, 24% textiles, 0% glass, metal and other inert.
OK
/1/ /2/ /4/ /5/ /8/
Kj Decay rate of the waste. According the methodological tool �“tool to determine methane emissions avoided from disposal of waste at a solid waste disposal site�” and the registered PDD, the following values for the different waste types have been applied (boreal and temperature �– dry): 0.02 wood-wood waste, 0.04 pulp, paper, cardboard, 0.06 food waste, 0.05 non
OK
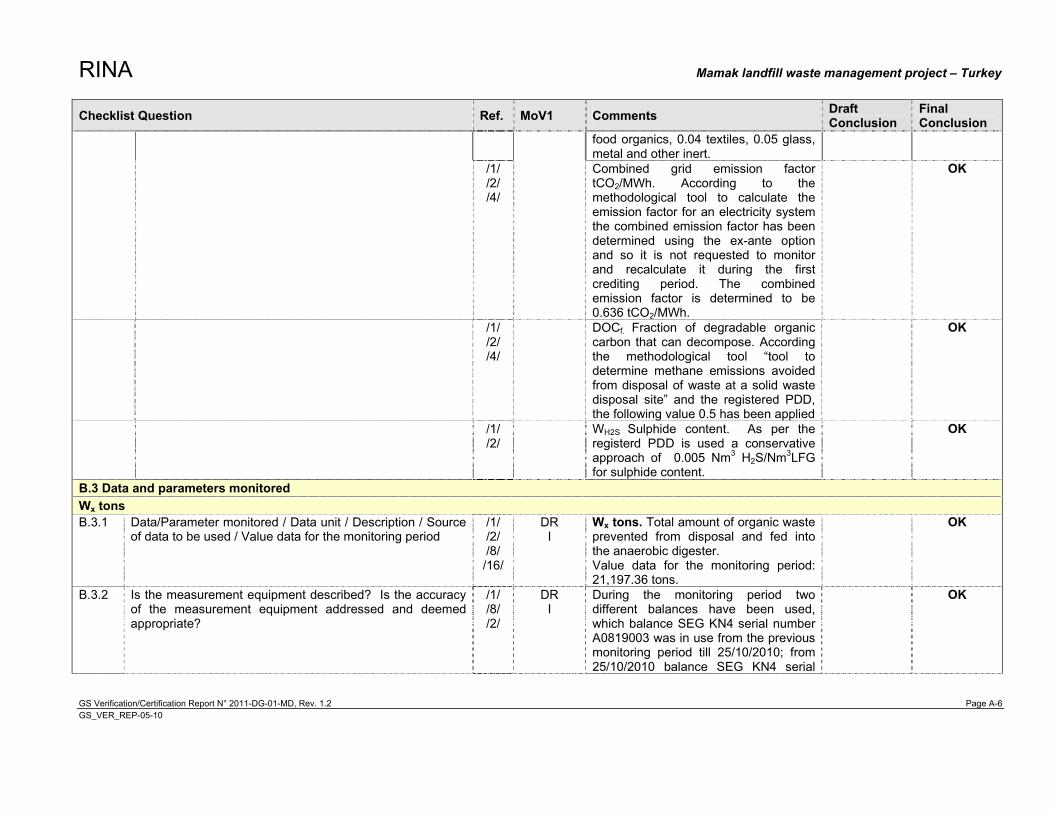
RINA Mamak landfill waste management project – Turkey
GS Verification/Certification Report N° 2011-DG-01-MD, Rev. 1.2 Page A-6 GS_VER_REP-05-10
Checklist Question Ref. MoV1 Comments Draft Conclusion
Final Conclusion
food organics, 0.04 textiles, 0.05 glass, metal and other inert.
/1/ /2/ /4/
Combined grid emission factor tCO2/MWh. According to the methodological tool to calculate the emission factor for an electricity system the combined emission factor has been determined using the ex-ante option and so it is not requested to monitor and recalculate it during the first crediting period. The combined emission factor is determined to be 0.636 tCO2/MWh.
OK
/1/ /2/ /4/
DOCf. Fraction of degradable organic carbon that can decompose. According the methodological tool �“tool to determine methane emissions avoided from disposal of waste at a solid waste disposal site�” and the registered PDD, the following value 0.5 has been applied
OK
/1/ /2/
WH2S Sulphide content. As per the registerd PDD is used a conservative approach of 0.005 Nm3 H2S/Nm3LFG for sulphide content.
OK
B.3 Data and parameters monitored Wx tons B.3.1 Data/Parameter monitored / Data unit / Description / Source
of data to be used / Value data for the monitoring period /1/ /2/ /8/ /16/
DR I
Wx tons. Total amount of organic waste prevented from disposal and fed into the anaerobic digester. Value data for the monitoring period: 21,197.36 tons.
OK
B.3.2 Is the measurement equipment described? Is the accuracy of the measurement equipment addressed and deemed appropriate?
/1/ /8/ /2/
DR I
During the monitoring period two different balances have been used, which balance SEG KN4 serial number A0819003 was in use from the previous monitoring period till 25/10/2010; from 25/10/2010 balance SEG KN4 serial
OK
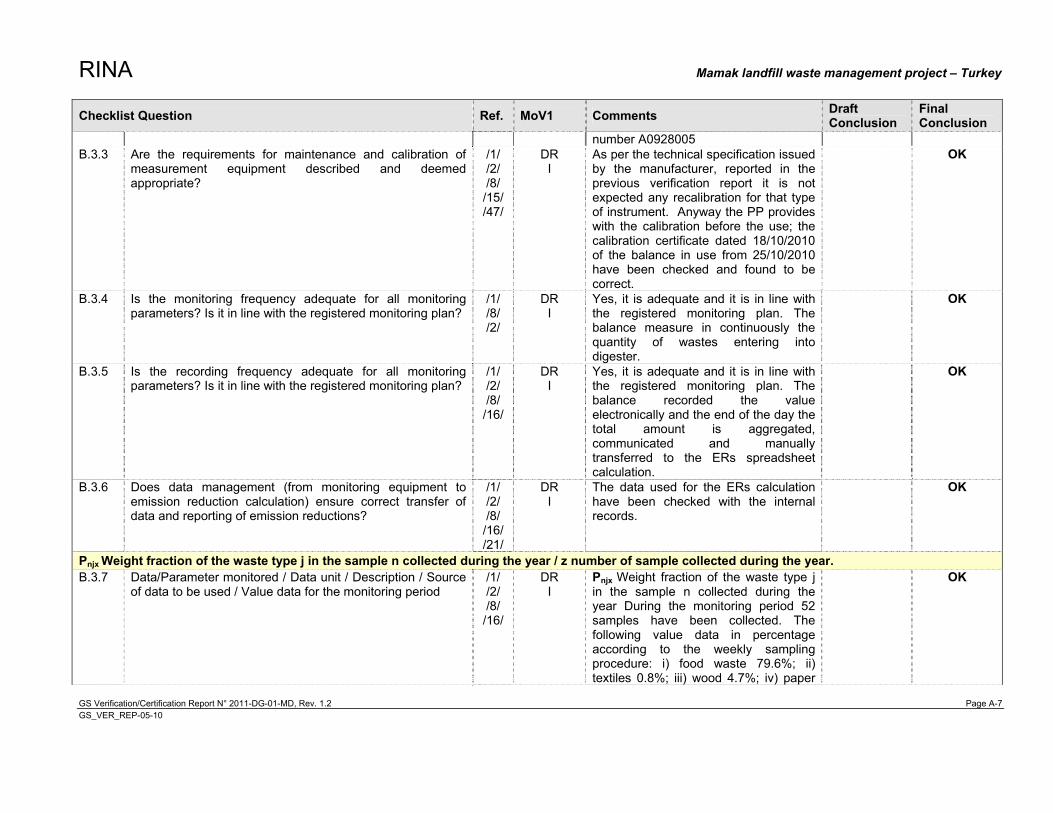
RINA Mamak landfill waste management project – Turkey
GS Verification/Certification Report N° 2011-DG-01-MD, Rev. 1.2 Page A-7 GS_VER_REP-05-10
Checklist Question Ref. MoV1 Comments Draft Conclusion
Final Conclusion
number A0928005 B.3.3 Are the requirements for maintenance and calibration of
measurement equipment described and deemed appropriate?
/1/ /2/ /8/ /15/ /47/
DR I
As per the technical specification issued by the manufacturer, reported in the previous verification report it is not expected any recalibration for that type of instrument. Anyway the PP provides with the calibration before the use; the calibration certificate dated 18/10/2010 of the balance in use from 25/10/2010 have been checked and found to be correct.
OK
B.3.4 Is the monitoring frequency adequate for all monitoring parameters? Is it in line with the registered monitoring plan?
/1/ /8/ /2/
DR I
Yes, it is adequate and it is in line with the registered monitoring plan. The balance measure in continuously the quantity of wastes entering into digester.
OK
B.3.5 Is the recording frequency adequate for all monitoring parameters? Is it in line with the registered monitoring plan?
/1/ /2/ /8/ /16/
DR I
Yes, it is adequate and it is in line with the registered monitoring plan. The balance recorded the value electronically and the end of the day the total amount is aggregated, communicated and manually transferred to the ERs spreadsheet calculation.
OK
B.3.6 Does data management (from monitoring equipment to emission reduction calculation) ensure correct transfer of data and reporting of emission reductions?
/1/ /2/ /8/ /16/ /21/
DR I
The data used for the ERs calculation have been checked with the internal records.
OK
Pnjx Weight fraction of the waste type j in the sample n collected during the year / z number of sample collected during the year. B.3.7 Data/Parameter monitored / Data unit / Description / Source
of data to be used / Value data for the monitoring period /1/ /2/ /8/ /16/
DR I
Pnjx Weight fraction of the waste type j in the sample n collected during the year During the monitoring period 52 samples have been collected. The following value data in percentage according to the weekly sampling procedure: i) food waste 79.6%; ii) textiles 0.8%; iii) wood 4.7%; iv) paper
OK
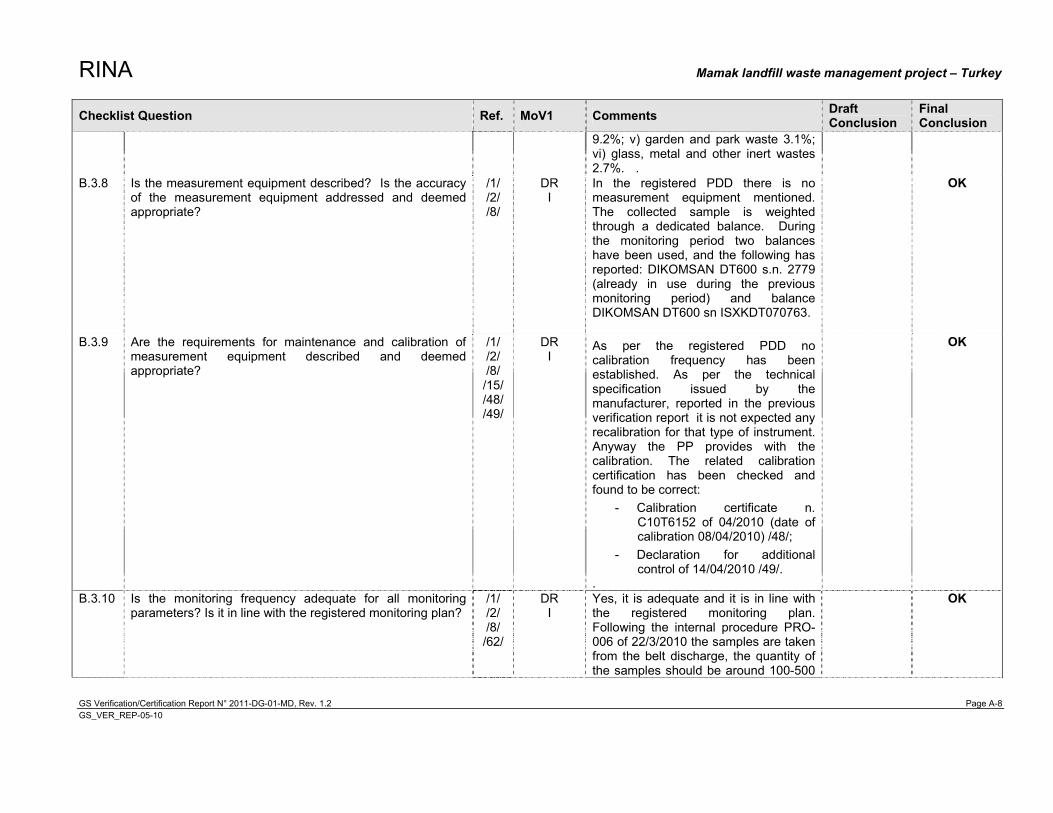
RINA Mamak landfill waste management project – Turkey
GS Verification/Certification Report N° 2011-DG-01-MD, Rev. 1.2 Page A-8 GS_VER_REP-05-10
Checklist Question Ref. MoV1 Comments Draft Conclusion
Final Conclusion
9.2%; v) garden and park waste 3.1%; vi) glass, metal and other inert wastes 2.7%. .
B.3.8 Is the measurement equipment described? Is the accuracy of the measurement equipment addressed and deemed appropriate?
/1/ /2/ /8/
DR I
In the registered PDD there is no measurement equipment mentioned. The collected sample is weighted through a dedicated balance. During the monitoring period two balances have been used, and the following has reported: DIKOMSAN DT600 s.n. 2779 (already in use during the previous monitoring period) and balance DIKOMSAN DT600 sn ISXKDT070763.
OK
B.3.9 Are the requirements for maintenance and calibration of measurement equipment described and deemed appropriate?
/1/ /2/ /8/ /15/ /48/ /49/
DR I
As per the registered PDD no calibration frequency has been established. As per the technical specification issued by the manufacturer, reported in the previous verification report it is not expected any recalibration for that type of instrument. Anyway the PP provides with the calibration. The related calibration certification has been checked and found to be correct:
- Calibration certificate n. C10T6152 of 04/2010 (date of calibration 08/04/2010) /48/;
- Declaration for additional control of 14/04/2010 /49/.
.
OK
B.3.10 Is the monitoring frequency adequate for all monitoring parameters? Is it in line with the registered monitoring plan?
/1/ /2/ /8/ /62/
DR I
Yes, it is adequate and it is in line with the registered monitoring plan. Following the internal procedure PRO-006 of 22/3/2010 the samples are taken from the belt discharge, the quantity of the samples should be around 100-500
OK
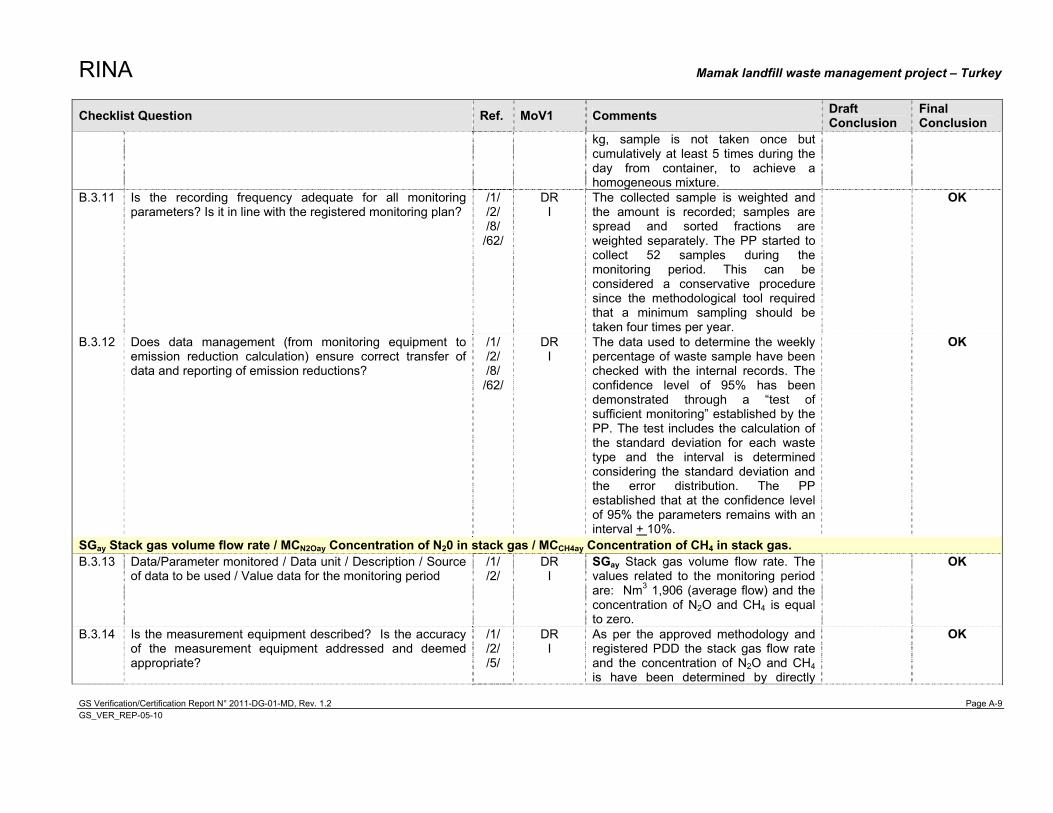
RINA Mamak landfill waste management project – Turkey
GS Verification/Certification Report N° 2011-DG-01-MD, Rev. 1.2 Page A-9 GS_VER_REP-05-10
Checklist Question Ref. MoV1 Comments Draft Conclusion
Final Conclusion
kg, sample is not taken once but cumulatively at least 5 times during the day from container, to achieve a homogeneous mixture.
B.3.11 Is the recording frequency adequate for all monitoring parameters? Is it in line with the registered monitoring plan?
/1/ /2/ /8/ /62/
DR I
The collected sample is weighted and the amount is recorded; samples are spread and sorted fractions are weighted separately. The PP started to collect 52 samples during the monitoring period. This can be considered a conservative procedure since the methodological tool required that a minimum sampling should be taken four times per year.
OK
B.3.12 Does data management (from monitoring equipment to emission reduction calculation) ensure correct transfer of data and reporting of emission reductions?
/1/ /2/ /8/ /62/
DR I
The data used to determine the weekly percentage of waste sample have been checked with the internal records. The confidence level of 95% has been demonstrated through a �“test of sufficient monitoring�” established by the PP. The test includes the calculation of the standard deviation for each waste type and the interval is determined considering the standard deviation and the error distribution. The PP established that at the confidence level of 95% the parameters remains with an interval + 10%.
OK
SGay Stack gas volume flow rate / MCN2Oay Concentration of N20 in stack gas / MCCH4ay Concentration of CH4 in stack gas. B.3.13 Data/Parameter monitored / Data unit / Description / Source
of data to be used / Value data for the monitoring period /1/ /2/
DR I
SGay Stack gas volume flow rate. The values related to the monitoring period are: Nm3 1,906 (average flow) and the concentration of N2O and CH4 is equal to zero.
OK
B.3.14 Is the measurement equipment described? Is the accuracy of the measurement equipment addressed and deemed appropriate?
/1/ /2/ /5/
DR I
As per the approved methodology and registered PDD the stack gas flow rate and the concentration of N2O and CH4 is have been determined by directly
OK
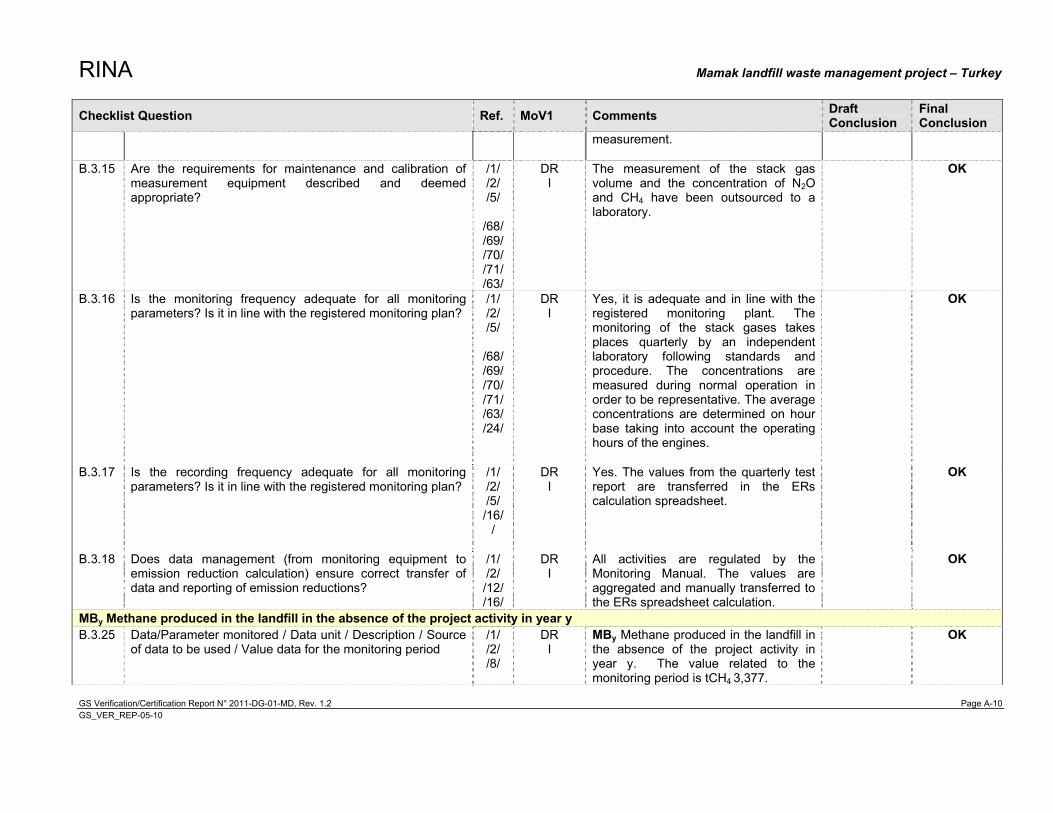
RINA Mamak landfill waste management project – Turkey
GS Verification/Certification Report N° 2011-DG-01-MD, Rev. 1.2 Page A-10 GS_VER_REP-05-10
Checklist Question Ref. MoV1 Comments Draft Conclusion
Final Conclusion
measurement.
B.3.15 Are the requirements for maintenance and calibration of measurement equipment described and deemed appropriate?
/1/ /2/ /5/
/68/ /69/ /70/ /71/ /63/
DR I
The measurement of the stack gas volume and the concentration of N2O and CH4 have been outsourced to a laboratory.
OK
B.3.16 Is the monitoring frequency adequate for all monitoring parameters? Is it in line with the registered monitoring plan?
/1/ /2/ /5/
/68/ /69/ /70/ /71/ /63/ /24/
DR I
Yes, it is adequate and in line with the registered monitoring plant. The monitoring of the stack gases takes places quarterly by an independent laboratory following standards and procedure. The concentrations are measured during normal operation in order to be representative. The average concentrations are determined on hour base taking into account the operating hours of the engines.
OK
B.3.17 Is the recording frequency adequate for all monitoring parameters? Is it in line with the registered monitoring plan?
/1/ /2/ /5/ /16/
/
DR I
Yes. The values from the quarterly test report are transferred in the ERs calculation spreadsheet.
OK
B.3.18 Does data management (from monitoring equipment to emission reduction calculation) ensure correct transfer of data and reporting of emission reductions?
/1/ /2/ /12/ /16/
DR I
All activities are regulated by the Monitoring Manual. The values are aggregated and manually transferred to the ERs spreadsheet calculation.
OK
MBy Methane produced in the landfill in the absence of the project activity in year y B.3.25 Data/Parameter monitored / Data unit / Description / Source
of data to be used / Value data for the monitoring period /1/ /2/ /8/
DR I
MBy Methane produced in the landfill in the absence of the project activity in year y. The value related to the monitoring period is tCH4 3,377.
OK
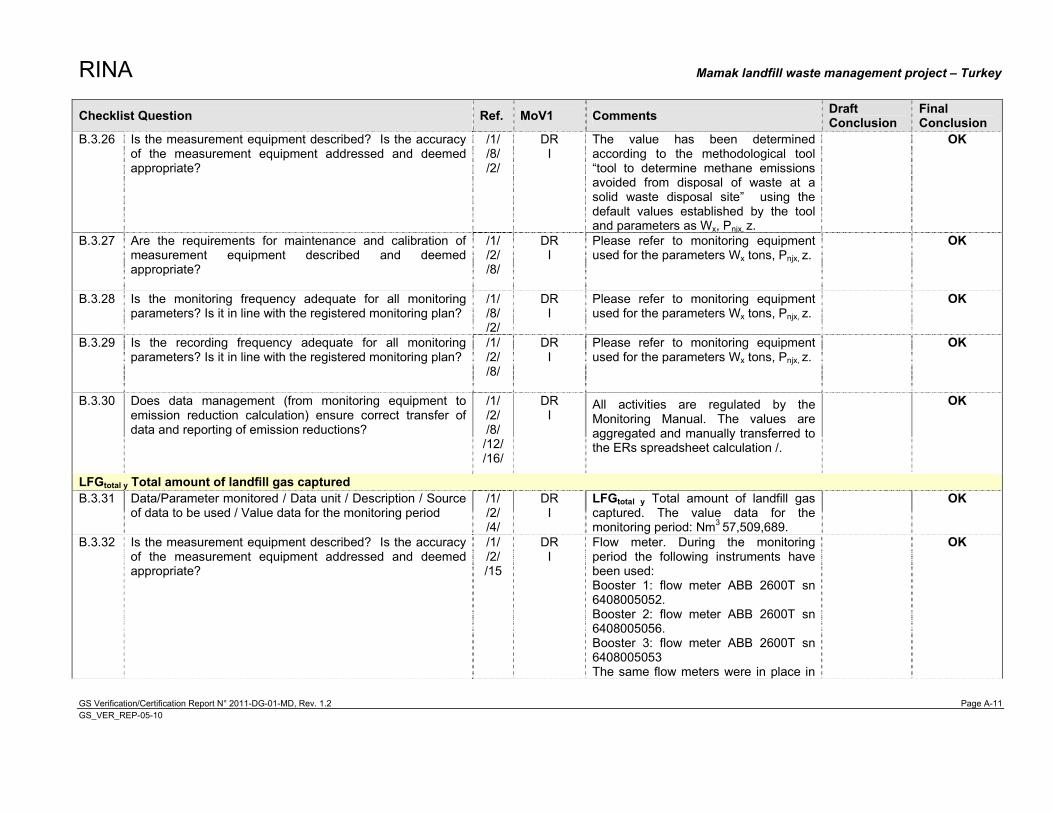
RINA Mamak landfill waste management project – Turkey
GS Verification/Certification Report N° 2011-DG-01-MD, Rev. 1.2 Page A-11 GS_VER_REP-05-10
Checklist Question Ref. MoV1 Comments Draft Conclusion
Final Conclusion
B.3.26 Is the measurement equipment described? Is the accuracy of the measurement equipment addressed and deemed appropriate?
/1/ /8/ /2/
DR I
The value has been determined according to the methodological tool �“tool to determine methane emissions avoided from disposal of waste at a solid waste disposal site�” using the default values established by the tool and parameters as Wx, Pnjx, z.
OK
B.3.27 Are the requirements for maintenance and calibration of measurement equipment described and deemed appropriate?
/1/ /2/ /8/
DR I
Please refer to monitoring equipment used for the parameters Wx tons, Pnjx, z.
OK
B.3.28 Is the monitoring frequency adequate for all monitoring parameters? Is it in line with the registered monitoring plan?
/1/ /8/ /2/
DR I
Please refer to monitoring equipment used for the parameters Wx tons, Pnjx, z.
OK
B.3.29 Is the recording frequency adequate for all monitoring parameters? Is it in line with the registered monitoring plan?
/1/ /2/ /8/
DR I
Please refer to monitoring equipment used for the parameters Wx tons, Pnjx, z.
OK
B.3.30 Does data management (from monitoring equipment to emission reduction calculation) ensure correct transfer of data and reporting of emission reductions?
/1/ /2/ /8/ /12/ /16/
DR I
All activities are regulated by the Monitoring Manual. The values are aggregated and manually transferred to the ERs spreadsheet calculation /.
OK
LFGtotal y Total amount of landfill gas captured B.3.31 Data/Parameter monitored / Data unit / Description / Source
of data to be used / Value data for the monitoring period /1/ /2/ /4/
DR I
LFGtotal y Total amount of landfill gas captured. The value data for the monitoring period: Nm3 57,509,689.
OK
B.3.32 Is the measurement equipment described? Is the accuracy of the measurement equipment addressed and deemed appropriate?
/1/ /2/ /15
DR I
Flow meter. During the monitoring period the following instruments have been used: Booster 1: flow meter ABB 2600T sn 6408005052. Booster 2: flow meter ABB 2600T sn 6408005056. Booster 3: flow meter ABB 2600T sn 6408005053 The same flow meters were in place in
OK
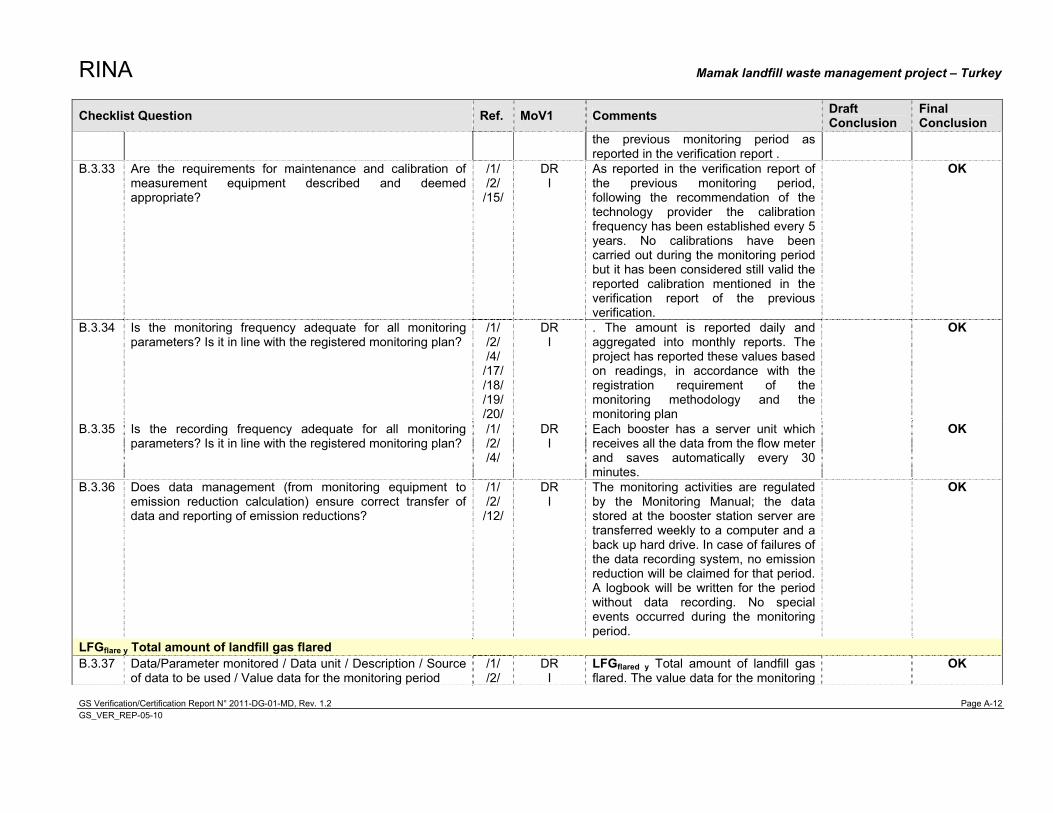
RINA Mamak landfill waste management project – Turkey
GS Verification/Certification Report N° 2011-DG-01-MD, Rev. 1.2 Page A-12 GS_VER_REP-05-10
Checklist Question Ref. MoV1 Comments Draft Conclusion
Final Conclusion
the previous monitoring period as reported in the verification report .
B.3.33 Are the requirements for maintenance and calibration of measurement equipment described and deemed appropriate?
/1/ /2/ /15/
DR I
As reported in the verification report of the previous monitoring period, following the recommendation of the technology provider the calibration frequency has been established every 5 years. No calibrations have been carried out during the monitoring period but it has been considered still valid the reported calibration mentioned in the verification report of the previous verification.
OK
B.3.34 Is the monitoring frequency adequate for all monitoring parameters? Is it in line with the registered monitoring plan?
/1/ /2/ /4/ /17/ /18/ /19/ /20/
DR I
. The amount is reported daily and aggregated into monthly reports. The project has reported these values based on readings, in accordance with the registration requirement of the monitoring methodology and the monitoring plan
OK
B.3.35 Is the recording frequency adequate for all monitoring parameters? Is it in line with the registered monitoring plan?
/1/ /2/ /4/
DR I
Each booster has a server unit which receives all the data from the flow meter and saves automatically every 30 minutes.
OK
B.3.36 Does data management (from monitoring equipment to emission reduction calculation) ensure correct transfer of data and reporting of emission reductions?
/1/ /2/ /12/
DR I
The monitoring activities are regulated by the Monitoring Manual; the data stored at the booster station server are transferred weekly to a computer and a back up hard drive. In case of failures of the data recording system, no emission reduction will be claimed for that period. A logbook will be written for the period without data recording. No special events occurred during the monitoring period.
OK
LFGflare y Total amount of landfill gas flared B.3.37 Data/Parameter monitored / Data unit / Description / Source
of data to be used / Value data for the monitoring period /1/ /2/
DR I
LFGflared y Total amount of landfill gas flared. The value data for the monitoring
OK
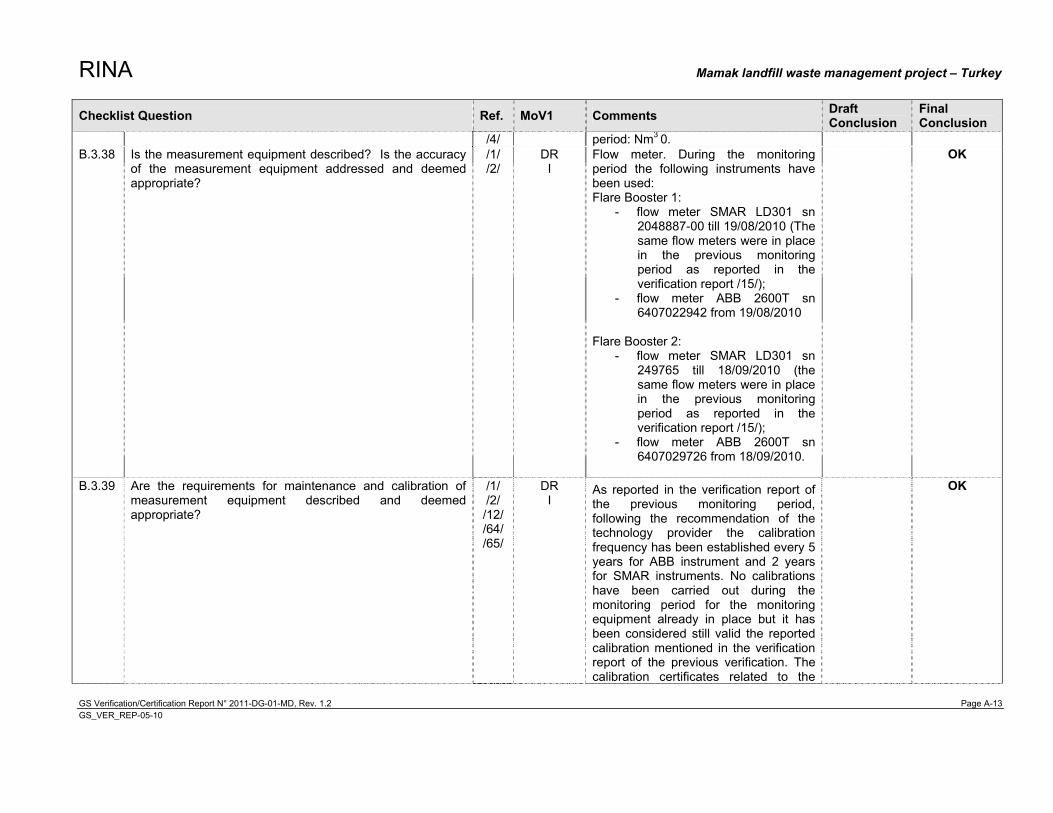
RINA Mamak landfill waste management project – Turkey
GS Verification/Certification Report N° 2011-DG-01-MD, Rev. 1.2 Page A-13 GS_VER_REP-05-10
Checklist Question Ref. MoV1 Comments Draft Conclusion
Final Conclusion
/4/ period: Nm3 0. B.3.38 Is the measurement equipment described? Is the accuracy
of the measurement equipment addressed and deemed appropriate?
/1/ /2/
DR I
Flow meter. During the monitoring period the following instruments have been used: Flare Booster 1:
- flow meter SMAR LD301 sn 2048887-00 till 19/08/2010 (The same flow meters were in place in the previous monitoring period as reported in the verification report /15/);
- flow meter ABB 2600T sn 6407022942 from 19/08/2010
Flare Booster 2:
- flow meter SMAR LD301 sn 249765 till 18/09/2010 (the same flow meters were in place in the previous monitoring period as reported in the verification report /15/);
- flow meter ABB 2600T sn 6407029726 from 18/09/2010.
OK
B.3.39 Are the requirements for maintenance and calibration of measurement equipment described and deemed appropriate?
/1/ /2/ /12/ /64/ /65/
DR I
As reported in the verification report of the previous monitoring period, following the recommendation of the technology provider the calibration frequency has been established every 5 years for ABB instrument and 2 years for SMAR instruments. No calibrations have been carried out during the monitoring period for the monitoring equipment already in place but it has been considered still valid the reported calibration mentioned in the verification report of the previous verification. The calibration certificates related to the
OK
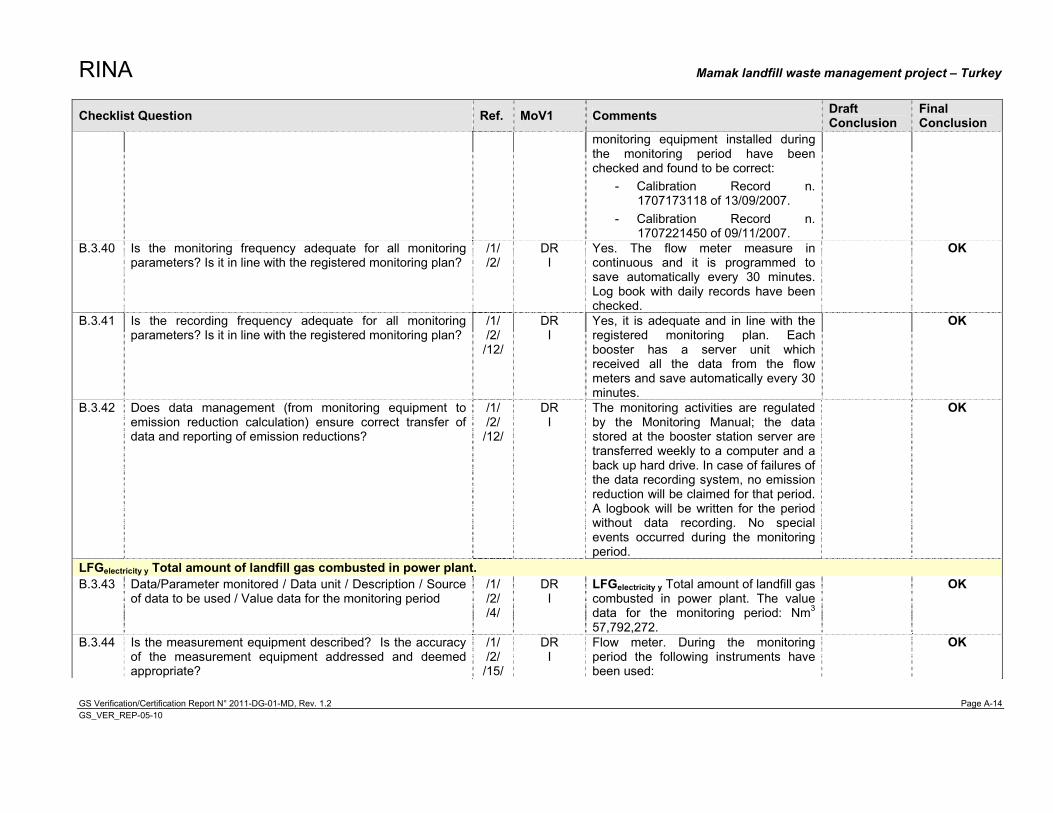
RINA Mamak landfill waste management project – Turkey
GS Verification/Certification Report N° 2011-DG-01-MD, Rev. 1.2 Page A-14 GS_VER_REP-05-10
Checklist Question Ref. MoV1 Comments Draft Conclusion
Final Conclusion
monitoring equipment installed during the monitoring period have been checked and found to be correct:
- Calibration Record n. 1707173118 of 13/09/2007.
- Calibration Record n. 1707221450 of 09/11/2007.
B.3.40 Is the monitoring frequency adequate for all monitoring parameters? Is it in line with the registered monitoring plan?
/1/ /2/
DR I
Yes. The flow meter measure in continuous and it is programmed to save automatically every 30 minutes. Log book with daily records have been checked.
OK
B.3.41 Is the recording frequency adequate for all monitoring parameters? Is it in line with the registered monitoring plan?
/1/ /2/ /12/
DR I
Yes, it is adequate and in line with the registered monitoring plan. Each booster has a server unit which received all the data from the flow meters and save automatically every 30 minutes.
OK
B.3.42 Does data management (from monitoring equipment to emission reduction calculation) ensure correct transfer of data and reporting of emission reductions?
/1/ /2/ /12/
DR I
The monitoring activities are regulated by the Monitoring Manual; the data stored at the booster station server are transferred weekly to a computer and a back up hard drive. In case of failures of the data recording system, no emission reduction will be claimed for that period. A logbook will be written for the period without data recording. No special events occurred during the monitoring period.
OK
LFGelectricity y Total amount of landfill gas combusted in power plant. B.3.43 Data/Parameter monitored / Data unit / Description / Source
of data to be used / Value data for the monitoring period /1/ /2/ /4/
DR I
LFGelectricity y Total amount of landfill gas combusted in power plant. The value data for the monitoring period: Nm3
57,792,272.
OK
B.3.44 Is the measurement equipment described? Is the accuracy of the measurement equipment addressed and deemed appropriate?
/1/ /2/ /15/
DR I
Flow meter. During the monitoring period the following instruments have been used:
OK
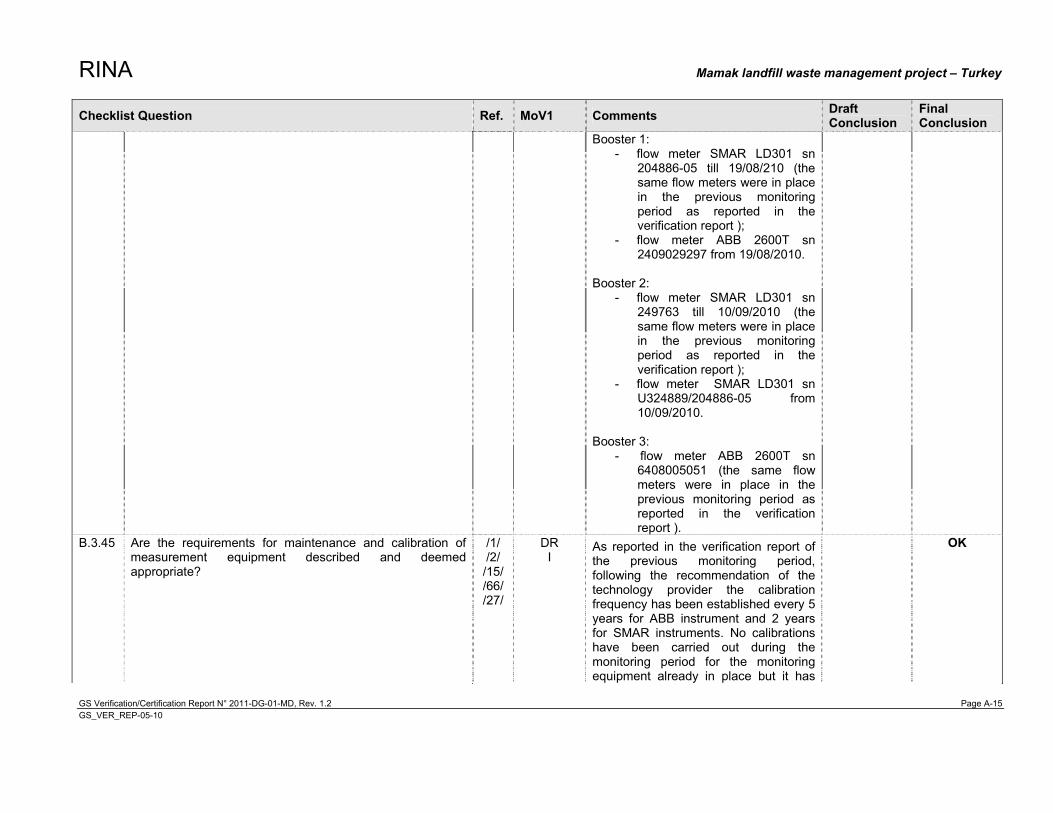
RINA Mamak landfill waste management project – Turkey
GS Verification/Certification Report N° 2011-DG-01-MD, Rev. 1.2 Page A-15 GS_VER_REP-05-10
Checklist Question Ref. MoV1 Comments Draft Conclusion
Final Conclusion
Booster 1: - flow meter SMAR LD301 sn
204886-05 till 19/08/210 (the same flow meters were in place in the previous monitoring period as reported in the verification report );
- flow meter ABB 2600T sn 2409029297 from 19/08/2010.
Booster 2: - flow meter SMAR LD301 sn
249763 till 10/09/2010 (the same flow meters were in place in the previous monitoring period as reported in the verification report );
- flow meter SMAR LD301 sn U324889/204886-05 from 10/09/2010.
Booster 3: - flow meter ABB 2600T sn
6408005051 (the same flow meters were in place in the previous monitoring period as reported in the verification report ).
B.3.45 Are the requirements for maintenance and calibration of measurement equipment described and deemed appropriate?
/1/ /2/ /15/ /66/ /27/
DR I
As reported in the verification report of the previous monitoring period, following the recommendation of the technology provider the calibration frequency has been established every 5 years for ABB instrument and 2 years for SMAR instruments. No calibrations have been carried out during the monitoring period for the monitoring equipment already in place but it has
OK
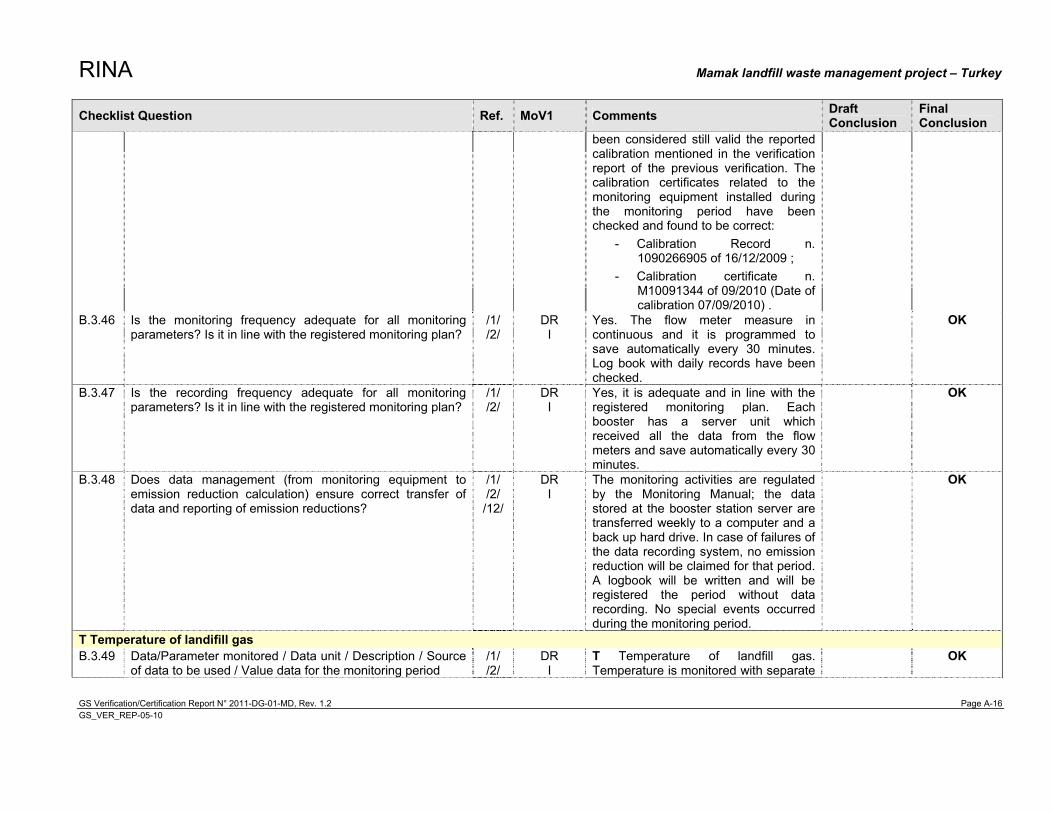
RINA Mamak landfill waste management project – Turkey
GS Verification/Certification Report N° 2011-DG-01-MD, Rev. 1.2 Page A-16 GS_VER_REP-05-10
Checklist Question Ref. MoV1 Comments Draft Conclusion
Final Conclusion
been considered still valid the reported calibration mentioned in the verification report of the previous verification. The calibration certificates related to the monitoring equipment installed during the monitoring period have been checked and found to be correct:
- Calibration Record n. 1090266905 of 16/12/2009 ;
- Calibration certificate n. M10091344 of 09/2010 (Date of calibration 07/09/2010) .
B.3.46 Is the monitoring frequency adequate for all monitoring parameters? Is it in line with the registered monitoring plan?
/1/ /2/
DR I
Yes. The flow meter measure in continuous and it is programmed to save automatically every 30 minutes. Log book with daily records have been checked.
OK
B.3.47 Is the recording frequency adequate for all monitoring parameters? Is it in line with the registered monitoring plan?
/1/ /2/
DR I
Yes, it is adequate and in line with the registered monitoring plan. Each booster has a server unit which received all the data from the flow meters and save automatically every 30 minutes.
OK
B.3.48 Does data management (from monitoring equipment to emission reduction calculation) ensure correct transfer of data and reporting of emission reductions?
/1/ /2/ /12/
DR I
The monitoring activities are regulated by the Monitoring Manual; the data stored at the booster station server are transferred weekly to a computer and a back up hard drive. In case of failures of the data recording system, no emission reduction will be claimed for that period. A logbook will be written and will be registered the period without data recording. No special events occurred during the monitoring period.
OK
T Temperature of landifill gas B.3.49 Data/Parameter monitored / Data unit / Description / Source
of data to be used / Value data for the monitoring period /1/ /2/
DR I
T Temperature of landfill gas. Temperature is monitored with separate
OK
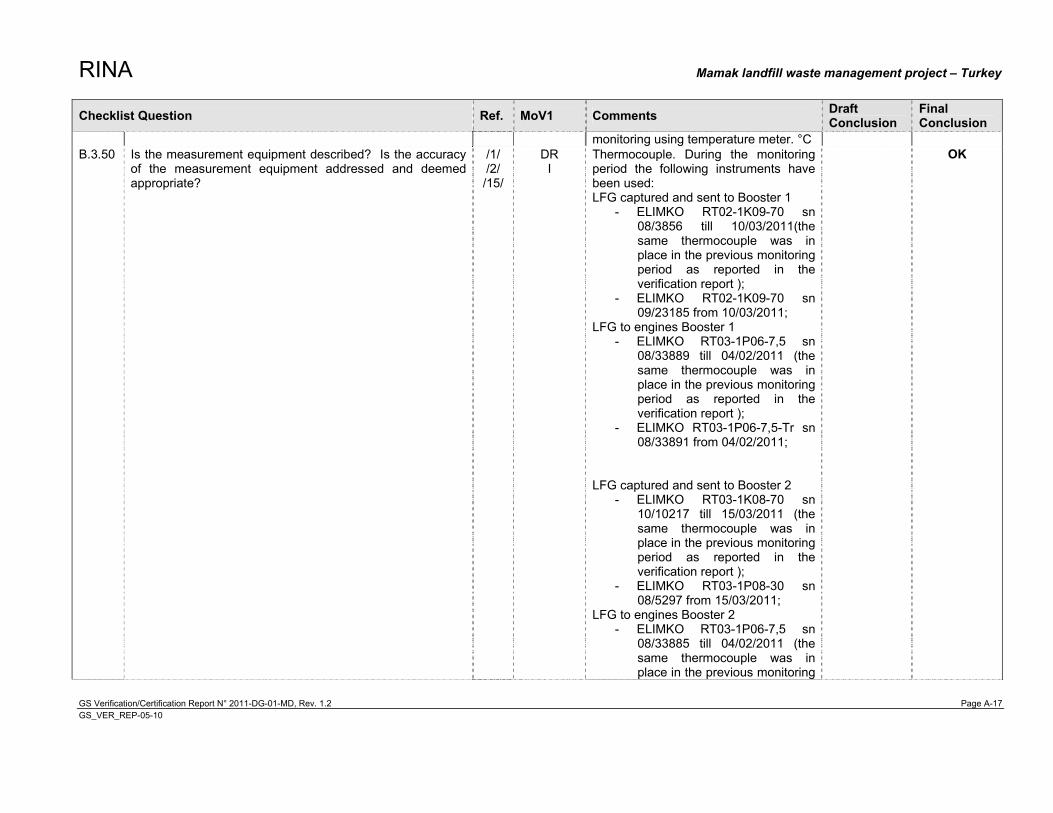
RINA Mamak landfill waste management project – Turkey
GS Verification/Certification Report N° 2011-DG-01-MD, Rev. 1.2 Page A-17 GS_VER_REP-05-10
Checklist Question Ref. MoV1 Comments Draft Conclusion
Final Conclusion
monitoring using temperature meter. °C B.3.50 Is the measurement equipment described? Is the accuracy
of the measurement equipment addressed and deemed appropriate?
/1/ /2/ /15/
DR I
Thermocouple. During the monitoring period the following instruments have been used: LFG captured and sent to Booster 1
- ELIMKO RT02-1K09-70 sn 08/3856 till 10/03/2011(the same thermocouple was in place in the previous monitoring period as reported in the verification report );
- ELIMKO RT02-1K09-70 sn 09/23185 from 10/03/2011;
LFG to engines Booster 1 - ELIMKO RT03-1P06-7,5 sn
08/33889 till 04/02/2011 (the same thermocouple was in place in the previous monitoring period as reported in the verification report );
- ELIMKO RT03-1P06-7,5-Tr sn 08/33891 from 04/02/2011;
LFG captured and sent to Booster 2
- ELIMKO RT03-1K08-70 sn 10/10217 till 15/03/2011 (the same thermocouple was in place in the previous monitoring period as reported in the verification report );
- ELIMKO RT03-1P08-30 sn 08/5297 from 15/03/2011;
LFG to engines Booster 2 - ELIMKO RT03-1P06-7,5 sn
08/33885 till 04/02/2011 (the same thermocouple was in place in the previous monitoring
OK
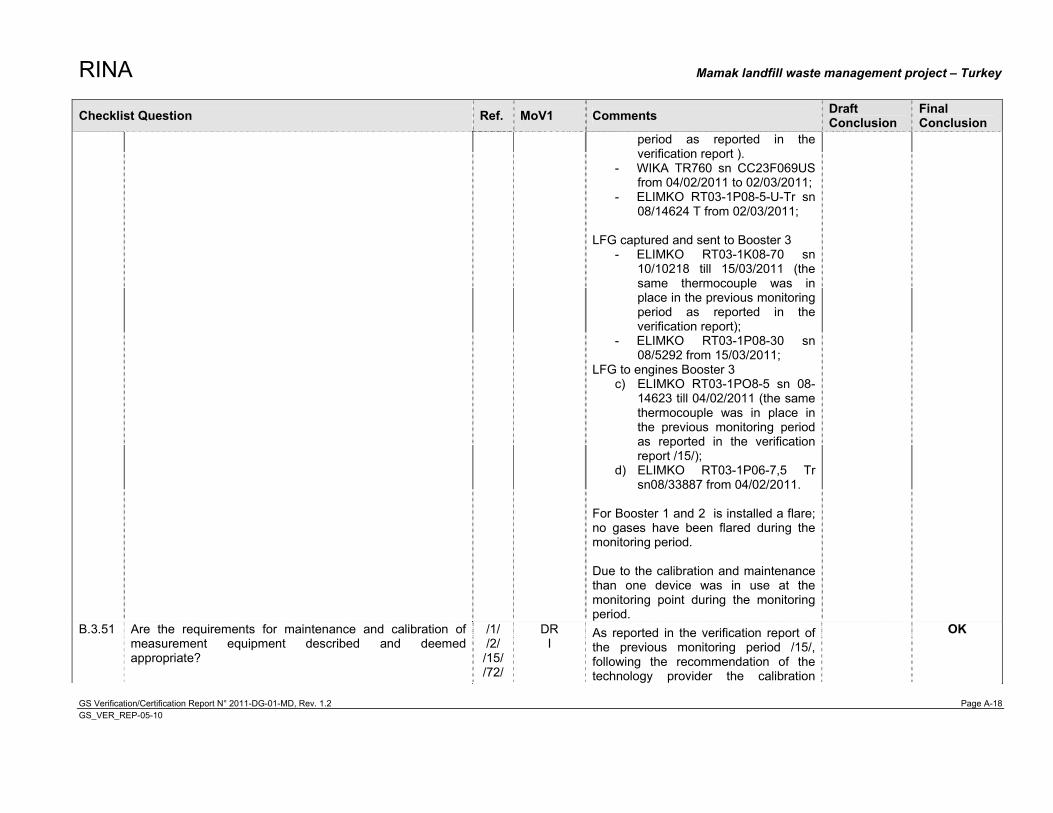
RINA Mamak landfill waste management project – Turkey
GS Verification/Certification Report N° 2011-DG-01-MD, Rev. 1.2 Page A-18 GS_VER_REP-05-10
Checklist Question Ref. MoV1 Comments Draft Conclusion
Final Conclusion
period as reported in the verification report ).
- WIKA TR760 sn CC23F069US from 04/02/2011 to 02/03/2011;
- ELIMKO RT03-1P08-5-U-Tr sn 08/14624 T from 02/03/2011;
LFG captured and sent to Booster 3
- ELIMKO RT03-1K08-70 sn 10/10218 till 15/03/2011 (the same thermocouple was in place in the previous monitoring period as reported in the verification report);
- ELIMKO RT03-1P08-30 sn 08/5292 from 15/03/2011;
LFG to engines Booster 3 c) ELIMKO RT03-1PO8-5 sn 08-
14623 till 04/02/2011 (the same thermocouple was in place in the previous monitoring period as reported in the verification report /15/);
d) ELIMKO RT03-1P06-7,5 Tr sn08/33887 from 04/02/2011.
For Booster 1 and 2 is installed a flare; no gases have been flared during the monitoring period. Due to the calibration and maintenance than one device was in use at the monitoring point during the monitoring period.
B.3.51 Are the requirements for maintenance and calibration of measurement equipment described and deemed appropriate?
/1/ /2/ /15/ /72/
DR I
As reported in the verification report of the previous monitoring period /15/, following the recommendation of the technology provider the calibration
OK
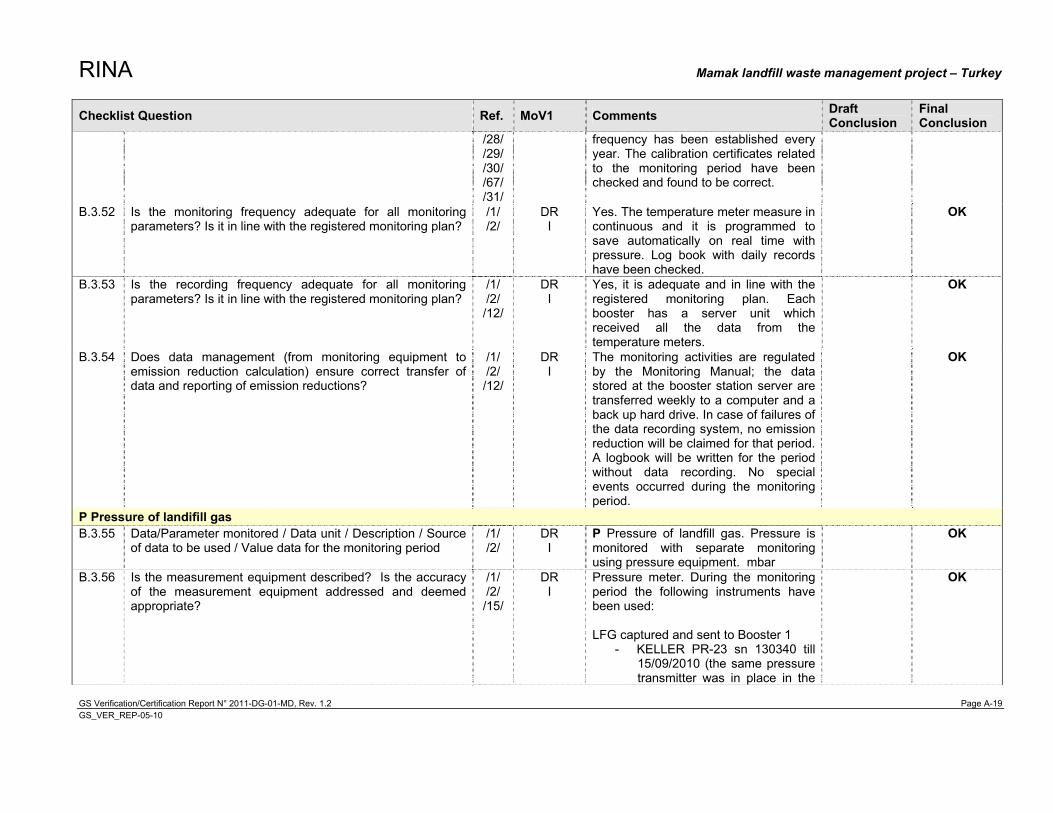
RINA Mamak landfill waste management project – Turkey
GS Verification/Certification Report N° 2011-DG-01-MD, Rev. 1.2 Page A-19 GS_VER_REP-05-10
Checklist Question Ref. MoV1 Comments Draft Conclusion
Final Conclusion
/28/ /29/ /30/ /67/ /31/
frequency has been established every year. The calibration certificates related to the monitoring period have been checked and found to be correct.
B.3.52 Is the monitoring frequency adequate for all monitoring parameters? Is it in line with the registered monitoring plan?
/1/ /2/
DR I
Yes. The temperature meter measure in continuous and it is programmed to save automatically on real time with pressure. Log book with daily records have been checked.
OK
B.3.53 Is the recording frequency adequate for all monitoring parameters? Is it in line with the registered monitoring plan?
/1/ /2/ /12/
DR I
Yes, it is adequate and in line with the registered monitoring plan. Each booster has a server unit which received all the data from the temperature meters.
OK
B.3.54 Does data management (from monitoring equipment to emission reduction calculation) ensure correct transfer of data and reporting of emission reductions?
/1/ /2/ /12/
DR I
The monitoring activities are regulated by the Monitoring Manual; the data stored at the booster station server are transferred weekly to a computer and a back up hard drive. In case of failures of the data recording system, no emission reduction will be claimed for that period. A logbook will be written for the period without data recording. No special events occurred during the monitoring period.
OK
P Pressure of landifill gas B.3.55 Data/Parameter monitored / Data unit / Description / Source
of data to be used / Value data for the monitoring period /1/ /2/
DR I
P Pressure of landfill gas. Pressure is monitored with separate monitoring using pressure equipment. mbar
OK
B.3.56 Is the measurement equipment described? Is the accuracy of the measurement equipment addressed and deemed appropriate?
/1/ /2/ /15/
DR I
Pressure meter. During the monitoring period the following instruments have been used: LFG captured and sent to Booster 1
- KELLER PR-23 sn 130340 till 15/09/2010 (the same pressure transmitter was in place in the
OK
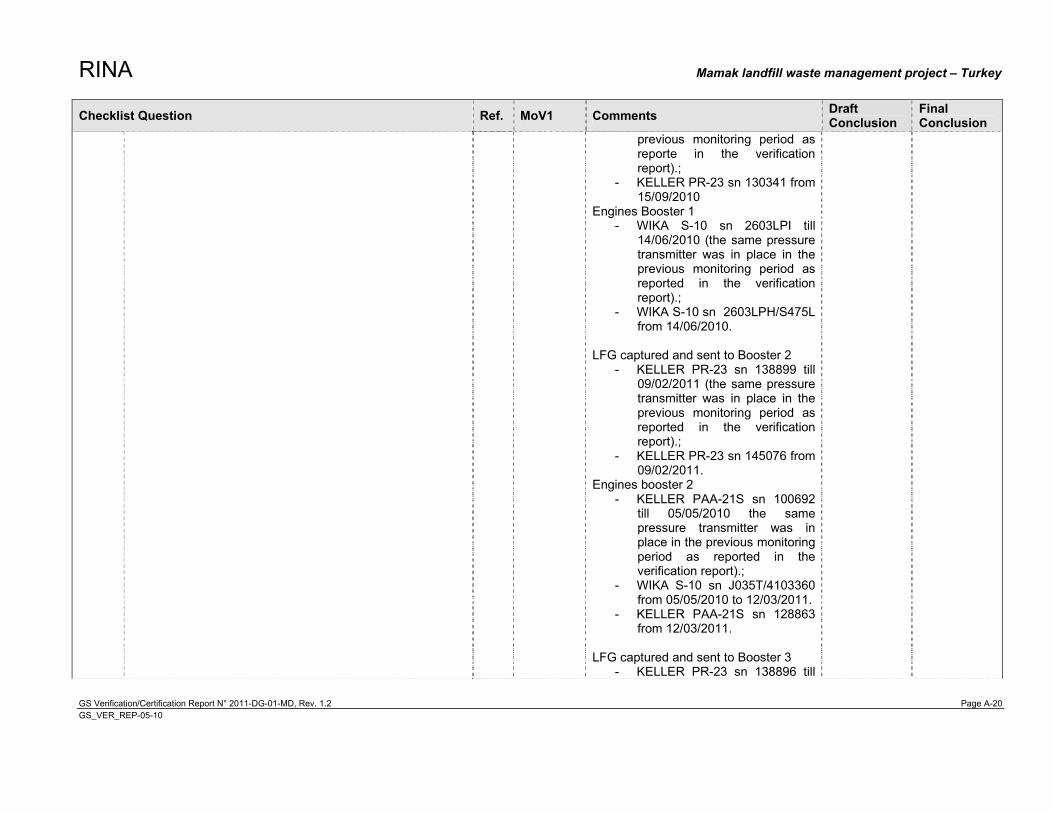
RINA Mamak landfill waste management project – Turkey
GS Verification/Certification Report N° 2011-DG-01-MD, Rev. 1.2 Page A-20 GS_VER_REP-05-10
Checklist Question Ref. MoV1 Comments Draft Conclusion
Final Conclusion
previous monitoring period as reporte in the verification report).;
- KELLER PR-23 sn 130341 from 15/09/2010
Engines Booster 1 - WIKA S-10 sn 2603LPI till
14/06/2010 (the same pressure transmitter was in place in the previous monitoring period as reported in the verification report).;
- WIKA S-10 sn 2603LPH/S475L from 14/06/2010.
LFG captured and sent to Booster 2 - KELLER PR-23 sn 138899 till
09/02/2011 (the same pressure transmitter was in place in the previous monitoring period as reported in the verification report).;
- KELLER PR-23 sn 145076 from 09/02/2011.
Engines booster 2 - KELLER PAA-21S sn 100692
till 05/05/2010 the same pressure transmitter was in place in the previous monitoring period as reported in the verification report).;
- WIKA S-10 sn J035T/4103360 from 05/05/2010 to 12/03/2011.
- KELLER PAA-21S sn 128863 from 12/03/2011.
LFG captured and sent to Booster 3
- KELLER PR-23 sn 138896 till
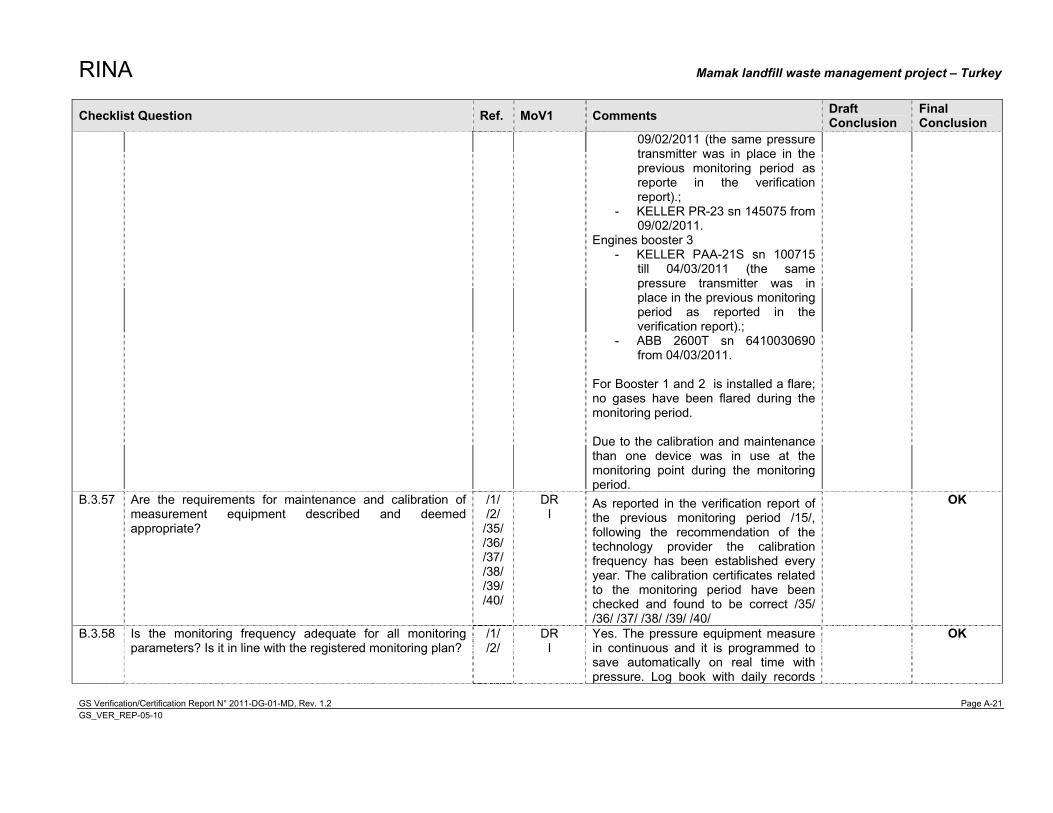
RINA Mamak landfill waste management project – Turkey
GS Verification/Certification Report N° 2011-DG-01-MD, Rev. 1.2 Page A-21 GS_VER_REP-05-10
Checklist Question Ref. MoV1 Comments Draft Conclusion
Final Conclusion
09/02/2011 (the same pressure transmitter was in place in the previous monitoring period as reporte in the verification report).;
- KELLER PR-23 sn 145075 from 09/02/2011.
Engines booster 3 - KELLER PAA-21S sn 100715
till 04/03/2011 (the same pressure transmitter was in place in the previous monitoring period as reported in the verification report).;
- ABB 2600T sn 6410030690 from 04/03/2011.
For Booster 1 and 2 is installed a flare; no gases have been flared during the monitoring period. Due to the calibration and maintenance than one device was in use at the monitoring point during the monitoring period.
B.3.57 Are the requirements for maintenance and calibration of measurement equipment described and deemed appropriate?
/1/ /2/ /35/ /36/ /37/ /38/ /39/ /40/
DR I
As reported in the verification report of the previous monitoring period /15/, following the recommendation of the technology provider the calibration frequency has been established every year. The calibration certificates related to the monitoring period have been checked and found to be correct /35/ /36/ /37/ /38/ /39/ /40/
OK
B.3.58 Is the monitoring frequency adequate for all monitoring parameters? Is it in line with the registered monitoring plan?
/1/ /2/
DR I
Yes. The pressure equipment measure in continuous and it is programmed to save automatically on real time with pressure. Log book with daily records
OK
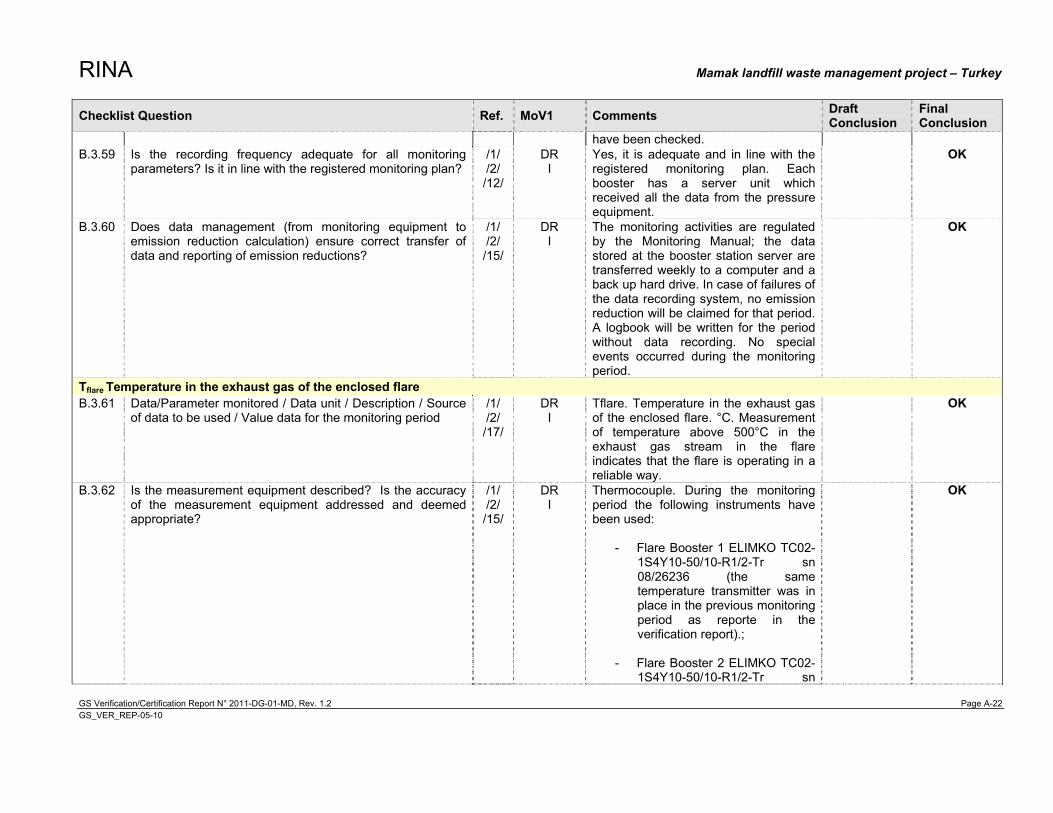
RINA Mamak landfill waste management project – Turkey
GS Verification/Certification Report N° 2011-DG-01-MD, Rev. 1.2 Page A-22 GS_VER_REP-05-10
Checklist Question Ref. MoV1 Comments Draft Conclusion
Final Conclusion
have been checked. B.3.59 Is the recording frequency adequate for all monitoring
parameters? Is it in line with the registered monitoring plan? /1/ /2/ /12/
DR I
Yes, it is adequate and in line with the registered monitoring plan. Each booster has a server unit which received all the data from the pressure equipment.
OK
B.3.60 Does data management (from monitoring equipment to emission reduction calculation) ensure correct transfer of data and reporting of emission reductions?
/1/ /2/ /15/
DR I
The monitoring activities are regulated by the Monitoring Manual; the data stored at the booster station server are transferred weekly to a computer and a back up hard drive. In case of failures of the data recording system, no emission reduction will be claimed for that period. A logbook will be written for the period without data recording. No special events occurred during the monitoring period.
OK
Tflare Temperature in the exhaust gas of the enclosed flare B.3.61 Data/Parameter monitored / Data unit / Description / Source
of data to be used / Value data for the monitoring period /1/ /2/ /17/
DR I
Tflare. Temperature in the exhaust gas of the enclosed flare. °C. Measurement of temperature above 500°C in the exhaust gas stream in the flare indicates that the flare is operating in a reliable way.
OK
B.3.62 Is the measurement equipment described? Is the accuracy of the measurement equipment addressed and deemed appropriate?
/1/ /2/ /15/
DR I
Thermocouple. During the monitoring period the following instruments have been used:
- Flare Booster 1 ELIMKO TC02-1S4Y10-50/10-R1/2-Tr sn 08/26236 (the same temperature transmitter was in place in the previous monitoring period as reporte in the verification report).;
- Flare Booster 2 ELIMKO TC02-
1S4Y10-50/10-R1/2-Tr sn
OK
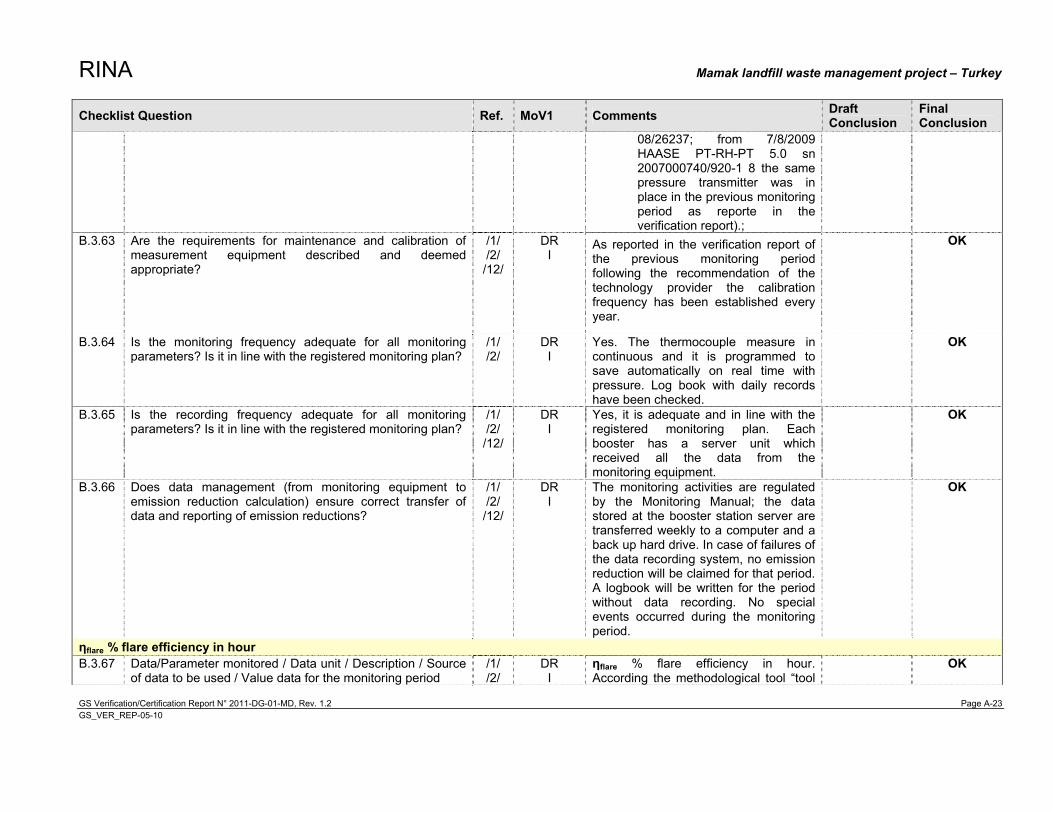
RINA Mamak landfill waste management project – Turkey
GS Verification/Certification Report N° 2011-DG-01-MD, Rev. 1.2 Page A-23 GS_VER_REP-05-10
Checklist Question Ref. MoV1 Comments Draft Conclusion
Final Conclusion
08/26237; from 7/8/2009 HAASE PT-RH-PT 5.0 sn 2007000740/920-1 8 the same pressure transmitter was in place in the previous monitoring period as reporte in the verification report).;
B.3.63 Are the requirements for maintenance and calibration of measurement equipment described and deemed appropriate?
/1/ /2/ /12/
DR I
As reported in the verification report of the previous monitoring period following the recommendation of the technology provider the calibration frequency has been established every year.
OK
B.3.64 Is the monitoring frequency adequate for all monitoring parameters? Is it in line with the registered monitoring plan?
/1/ /2/
DR I
Yes. The thermocouple measure in continuous and it is programmed to save automatically on real time with pressure. Log book with daily records have been checked.
OK
B.3.65 Is the recording frequency adequate for all monitoring parameters? Is it in line with the registered monitoring plan?
/1/ /2/ /12/
DR I
Yes, it is adequate and in line with the registered monitoring plan. Each booster has a server unit which received all the data from the monitoring equipment.
OK
B.3.66 Does data management (from monitoring equipment to emission reduction calculation) ensure correct transfer of data and reporting of emission reductions?
/1/ /2/ /12/
DR I
The monitoring activities are regulated by the Monitoring Manual; the data stored at the booster station server are transferred weekly to a computer and a back up hard drive. In case of failures of the data recording system, no emission reduction will be claimed for that period. A logbook will be written for the period without data recording. No special events occurred during the monitoring period.
OK
flare % flare efficiency in hour B.3.67 Data/Parameter monitored / Data unit / Description / Source
of data to be used / Value data for the monitoring period /1/ /2/
DR I
flare % flare efficiency in hour. According the methodological tool �“tool
OK
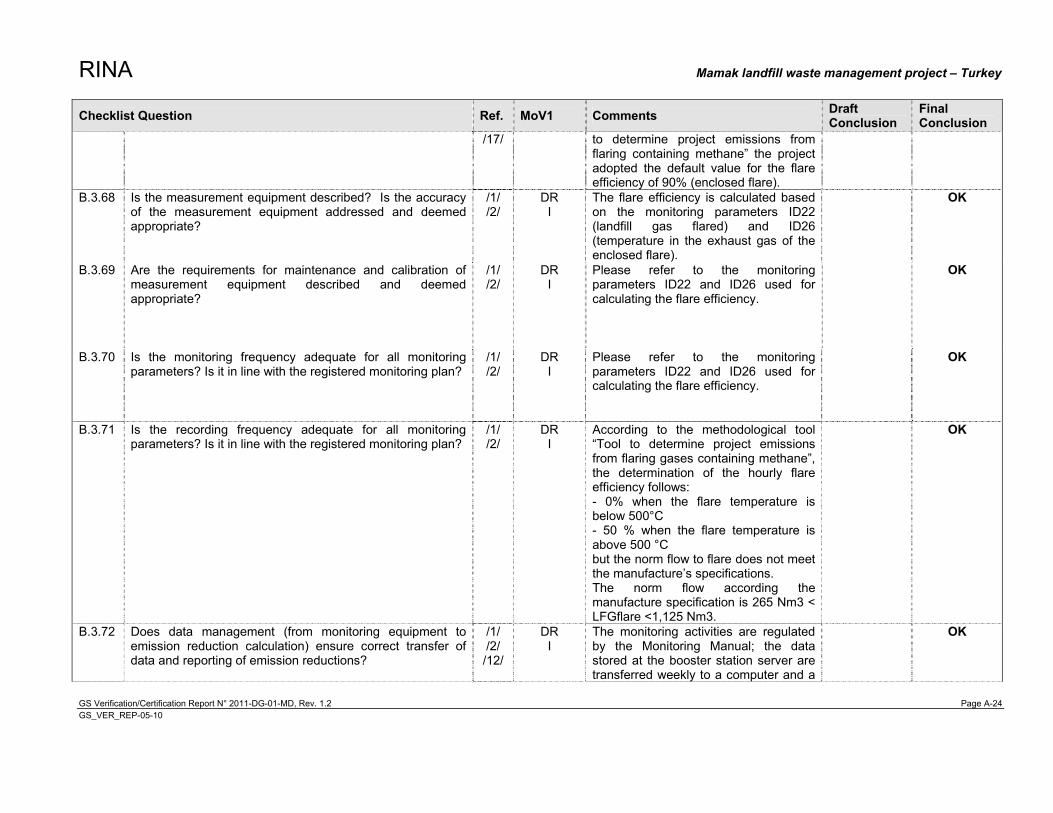
RINA Mamak landfill waste management project – Turkey
GS Verification/Certification Report N° 2011-DG-01-MD, Rev. 1.2 Page A-24 GS_VER_REP-05-10
Checklist Question Ref. MoV1 Comments Draft Conclusion
Final Conclusion
/17/ to determine project emissions from flaring containing methane�” the project adopted the default value for the flare efficiency of 90% (enclosed flare).
B.3.68 Is the measurement equipment described? Is the accuracy of the measurement equipment addressed and deemed appropriate?
/1/ /2/
DR I
The flare efficiency is calculated based on the monitoring parameters ID22 (landfill gas flared) and ID26 (temperature in the exhaust gas of the enclosed flare).
OK
B.3.69 Are the requirements for maintenance and calibration of measurement equipment described and deemed appropriate?
/1/ /2/
DR I
Please refer to the monitoring parameters ID22 and ID26 used for calculating the flare efficiency.
OK
B.3.70 Is the monitoring frequency adequate for all monitoring parameters? Is it in line with the registered monitoring plan?
/1/ /2/
DR I
Please refer to the monitoring parameters ID22 and ID26 used for calculating the flare efficiency.
OK
B.3.71 Is the recording frequency adequate for all monitoring parameters? Is it in line with the registered monitoring plan?
/1/ /2/
DR I
According to the methodological tool �“Tool to determine project emissions from flaring gases containing methane�”, the determination of the hourly flare efficiency follows: - 0% when the flare temperature is below 500°C - 50 % when the flare temperature is above 500 °C but the norm flow to flare does not meet the manufacture�’s specifications. The norm flow according the manufacture specification is 265 Nm3 < LFGflare <1,125 Nm3.
OK
B.3.72 Does data management (from monitoring equipment to emission reduction calculation) ensure correct transfer of data and reporting of emission reductions?
/1/ /2/ /12/
DR I
The monitoring activities are regulated by the Monitoring Manual; the data stored at the booster station server are transferred weekly to a computer and a
OK
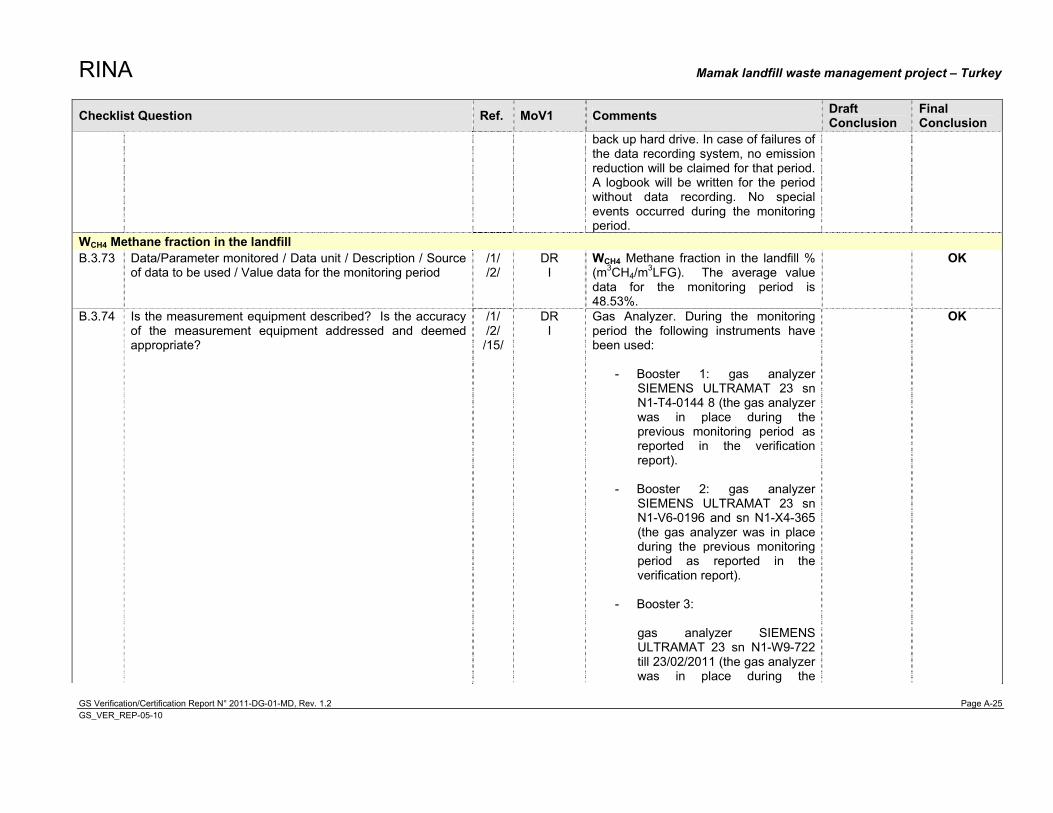
RINA Mamak landfill waste management project – Turkey
GS Verification/Certification Report N° 2011-DG-01-MD, Rev. 1.2 Page A-25 GS_VER_REP-05-10
Checklist Question Ref. MoV1 Comments Draft Conclusion
Final Conclusion
back up hard drive. In case of failures of the data recording system, no emission reduction will be claimed for that period. A logbook will be written for the period without data recording. No special events occurred during the monitoring period.
WCH4 Methane fraction in the landfill B.3.73 Data/Parameter monitored / Data unit / Description / Source
of data to be used / Value data for the monitoring period /1/ /2/
DR I
WCH4 Methane fraction in the landfill % (m3CH4/m3LFG). The average value data for the monitoring period is 48.53%.
OK
B.3.74 Is the measurement equipment described? Is the accuracy of the measurement equipment addressed and deemed appropriate?
/1/ /2/ /15/
DR I
Gas Analyzer. During the monitoring period the following instruments have been used:
- Booster 1: gas analyzer SIEMENS ULTRAMAT 23 sn N1-T4-0144 8 (the gas analyzer was in place during the previous monitoring period as reported in the verification report).
- Booster 2: gas analyzer
SIEMENS ULTRAMAT 23 sn N1-V6-0196 and sn N1-X4-365 (the gas analyzer was in place during the previous monitoring period as reported in the verification report).
- Booster 3:
gas analyzer SIEMENS ULTRAMAT 23 sn N1-W9-722 till 23/02/2011 (the gas analyzer was in place during the
OK
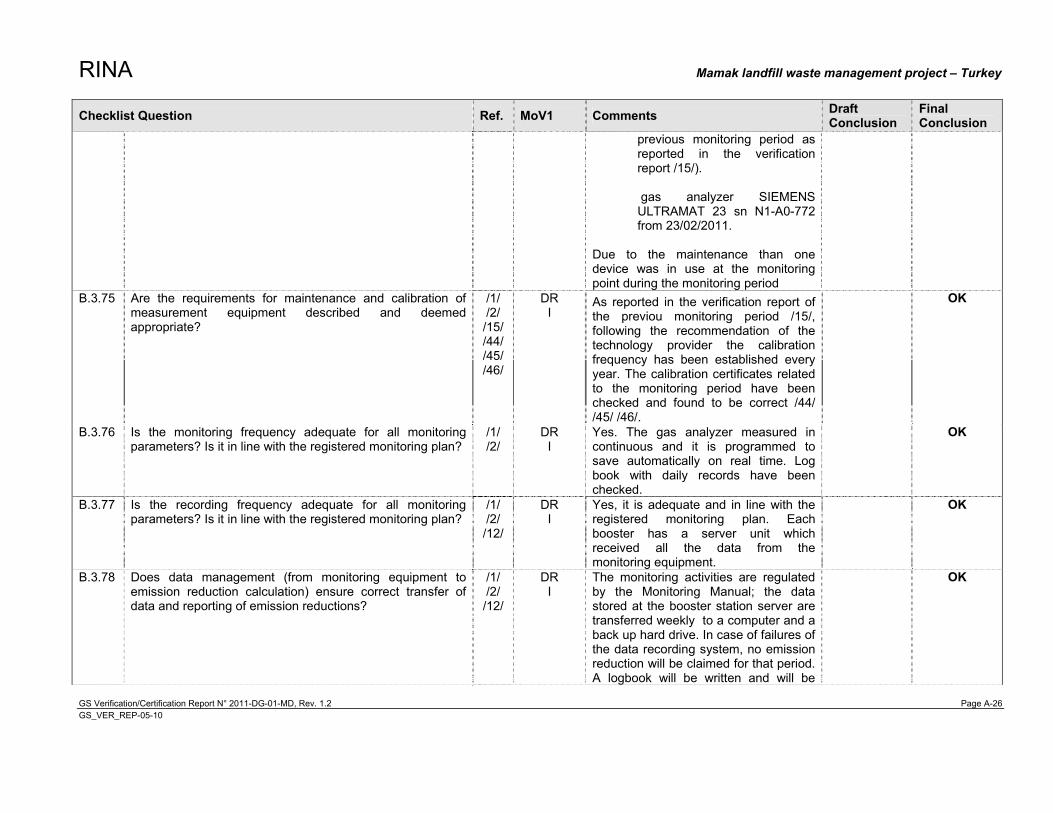
RINA Mamak landfill waste management project – Turkey
GS Verification/Certification Report N° 2011-DG-01-MD, Rev. 1.2 Page A-26 GS_VER_REP-05-10
Checklist Question Ref. MoV1 Comments Draft Conclusion
Final Conclusion
previous monitoring period as reported in the verification report /15/). gas analyzer SIEMENS ULTRAMAT 23 sn N1-A0-772 from 23/02/2011.
Due to the maintenance than one device was in use at the monitoring point during the monitoring period
B.3.75 Are the requirements for maintenance and calibration of measurement equipment described and deemed appropriate?
/1/ /2/ /15/ /44/ /45/ /46/
DR I
As reported in the verification report of the previou monitoring period /15/, following the recommendation of the technology provider the calibration frequency has been established every year. The calibration certificates related to the monitoring period have been checked and found to be correct /44/ /45/ /46/.
OK
B.3.76 Is the monitoring frequency adequate for all monitoring parameters? Is it in line with the registered monitoring plan?
/1/ /2/
DR I
Yes. The gas analyzer measured in continuous and it is programmed to save automatically on real time. Log book with daily records have been checked.
OK
B.3.77 Is the recording frequency adequate for all monitoring parameters? Is it in line with the registered monitoring plan?
/1/ /2/ /12/
DR I
Yes, it is adequate and in line with the registered monitoring plan. Each booster has a server unit which received all the data from the monitoring equipment.
OK
B.3.78 Does data management (from monitoring equipment to emission reduction calculation) ensure correct transfer of data and reporting of emission reductions?
/1/ /2/ /12/
DR I
The monitoring activities are regulated by the Monitoring Manual; the data stored at the booster station server are transferred weekly to a computer and a back up hard drive. In case of failures of the data recording system, no emission reduction will be claimed for that period. A logbook will be written and will be
OK
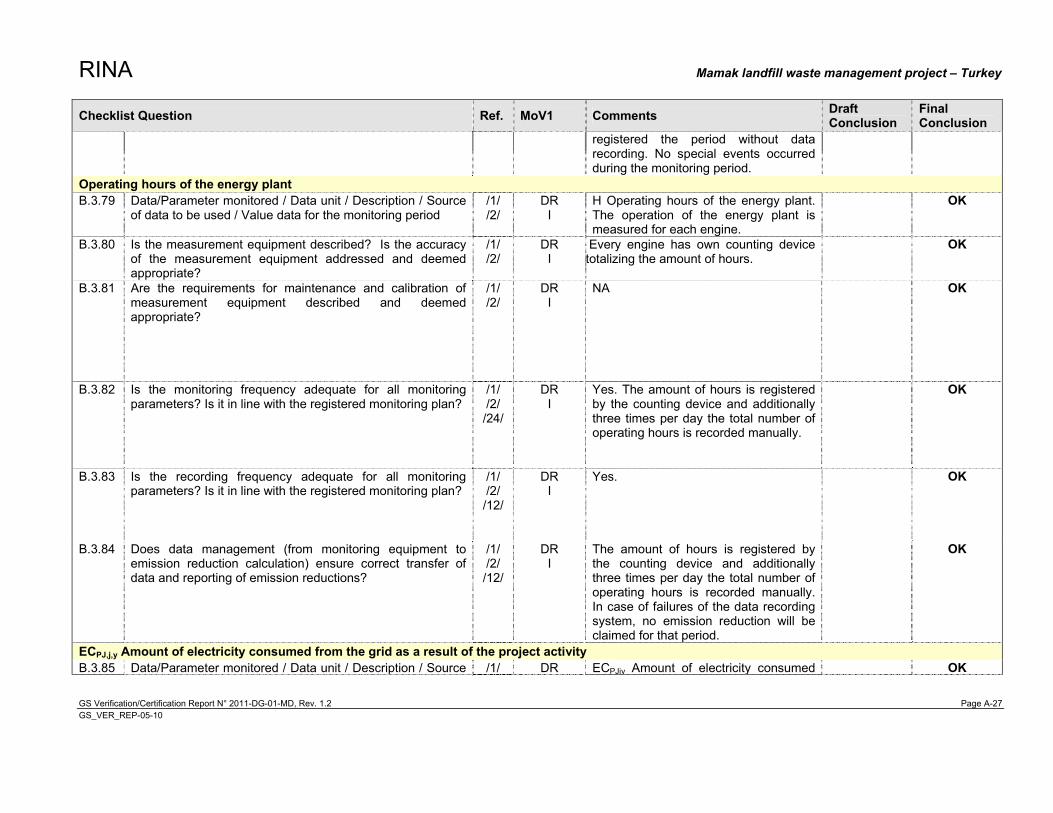
RINA Mamak landfill waste management project – Turkey
GS Verification/Certification Report N° 2011-DG-01-MD, Rev. 1.2 Page A-27 GS_VER_REP-05-10
Checklist Question Ref. MoV1 Comments Draft Conclusion
Final Conclusion
registered the period without data recording. No special events occurred during the monitoring period.
Operating hours of the energy plant B.3.79 Data/Parameter monitored / Data unit / Description / Source
of data to be used / Value data for the monitoring period /1/ /2/
DR I
H Operating hours of the energy plant. The operation of the energy plant is measured for each engine.
OK
B.3.80 Is the measurement equipment described? Is the accuracy of the measurement equipment addressed and deemed appropriate?
/1/ /2/
DR I
Every engine has own counting device totalizing the amount of hours.
OK
B.3.81 Are the requirements for maintenance and calibration of measurement equipment described and deemed appropriate?
/1/ /2/
DR I
NA OK
B.3.82 Is the monitoring frequency adequate for all monitoring parameters? Is it in line with the registered monitoring plan?
/1/ /2/ /24/
DR I
Yes. The amount of hours is registered by the counting device and additionally three times per day the total number of operating hours is recorded manually.
OK
B.3.83 Is the recording frequency adequate for all monitoring parameters? Is it in line with the registered monitoring plan?
/1/ /2/ /12/
DR I
Yes. OK
B.3.84 Does data management (from monitoring equipment to emission reduction calculation) ensure correct transfer of data and reporting of emission reductions?
/1/ /2/ /12/
DR I
The amount of hours is registered by the counting device and additionally three times per day the total number of operating hours is recorded manually. In case of failures of the data recording system, no emission reduction will be claimed for that period.
OK
ECPJ,j,y Amount of electricity consumed from the grid as a result of the project activity B.3.85 Data/Parameter monitored / Data unit / Description / Source /1/ DR ECPJjy Amount of electricity consumed OK
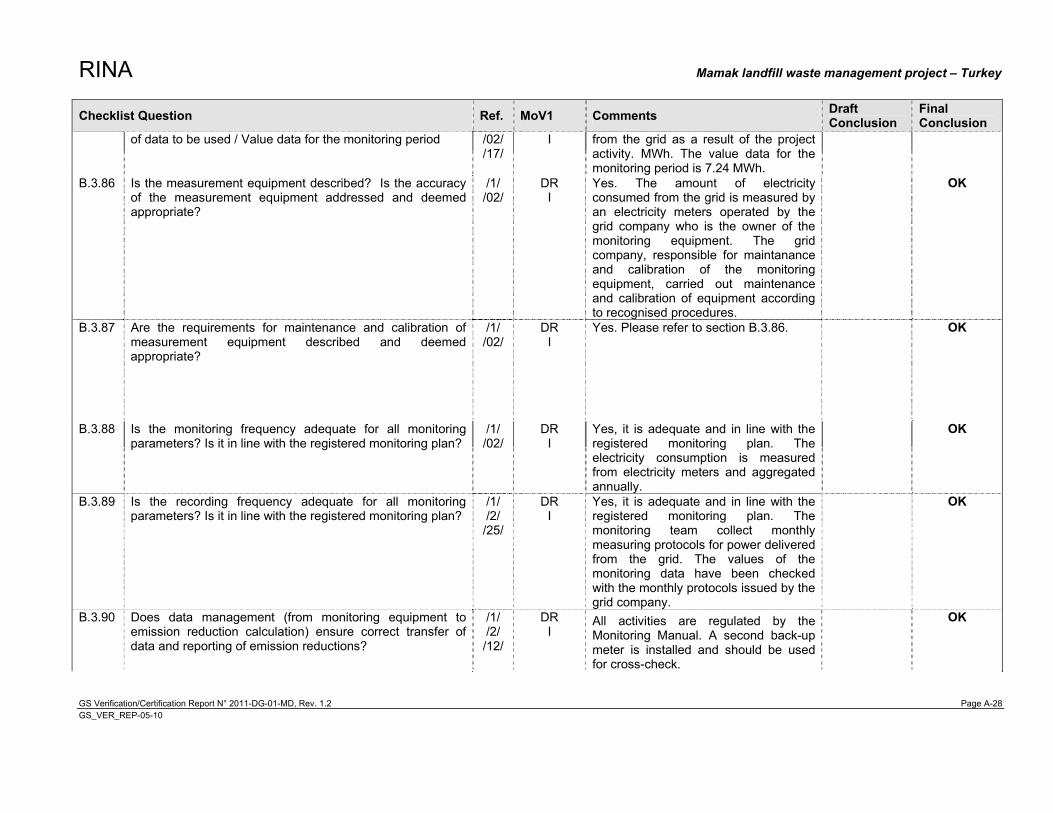
RINA Mamak landfill waste management project – Turkey
GS Verification/Certification Report N° 2011-DG-01-MD, Rev. 1.2 Page A-28 GS_VER_REP-05-10
Checklist Question Ref. MoV1 Comments Draft Conclusion
Final Conclusion
of data to be used / Value data for the monitoring period /02/ /17/
I from the grid as a result of the project activity. MWh. The value data for the monitoring period is 7.24 MWh.
B.3.86 Is the measurement equipment described? Is the accuracy of the measurement equipment addressed and deemed appropriate?
/1/ /02/
DR I
Yes. The amount of electricity consumed from the grid is measured by an electricity meters operated by the grid company who is the owner of the monitoring equipment. The grid company, responsible for maintanance and calibration of the monitoring equipment, carried out maintenance and calibration of equipment according to recognised procedures.
OK
B.3.87 Are the requirements for maintenance and calibration of measurement equipment described and deemed appropriate?
/1/ /02/
DR I
Yes. Please refer to section B.3.86. OK
B.3.88 Is the monitoring frequency adequate for all monitoring parameters? Is it in line with the registered monitoring plan?
/1/ /02/
DR I
Yes, it is adequate and in line with the registered monitoring plan. The electricity consumption is measured from electricity meters and aggregated annually.
OK
B.3.89 Is the recording frequency adequate for all monitoring parameters? Is it in line with the registered monitoring plan?
/1/ /2/ /25/
DR I
Yes, it is adequate and in line with the registered monitoring plan. The monitoring team collect monthly measuring protocols for power delivered from the grid. The values of the monitoring data have been checked with the monthly protocols issued by the grid company.
OK
B.3.90 Does data management (from monitoring equipment to emission reduction calculation) ensure correct transfer of data and reporting of emission reductions?
/1/ /2/ /12/
DR I
All activities are regulated by the Monitoring Manual. A second back-up meter is installed and should be used for cross-check.
OK
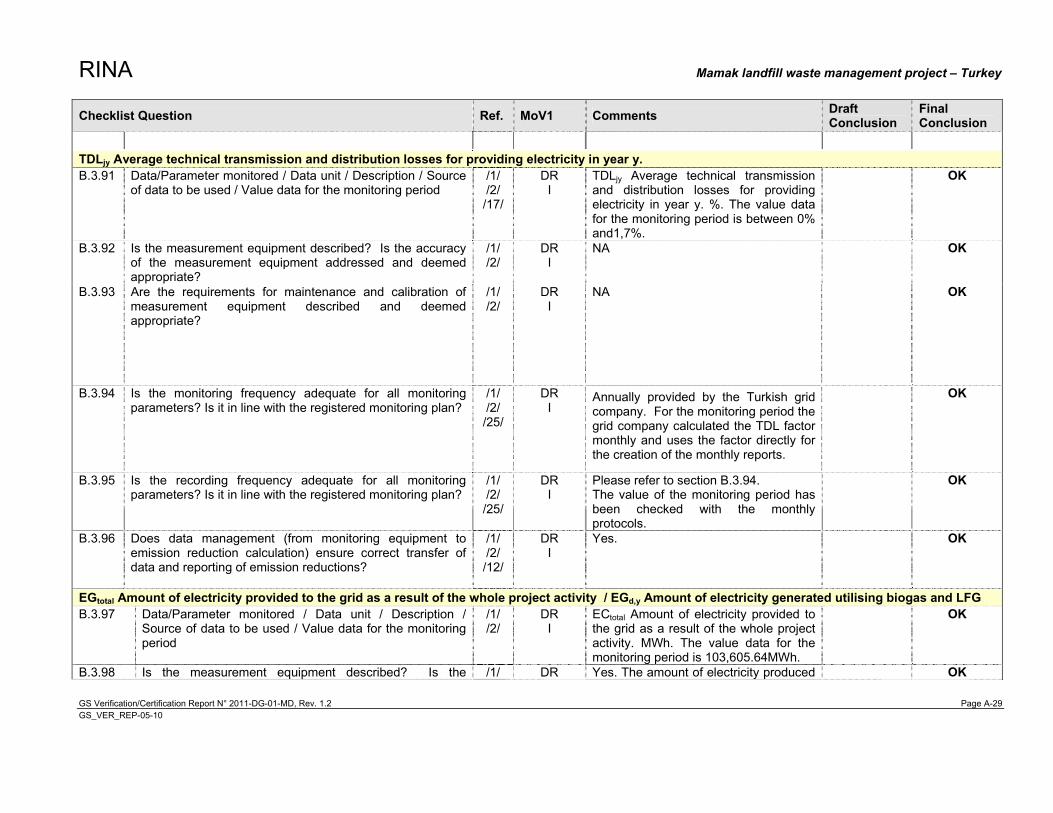
RINA Mamak landfill waste management project – Turkey
GS Verification/Certification Report N° 2011-DG-01-MD, Rev. 1.2 Page A-29 GS_VER_REP-05-10
Checklist Question Ref. MoV1 Comments Draft Conclusion
Final Conclusion
TDLjy Average technical transmission and distribution losses for providing electricity in year y. B.3.91 Data/Parameter monitored / Data unit / Description / Source
of data to be used / Value data for the monitoring period /1/ /2/ /17/
DR I
TDLjy Average technical transmission and distribution losses for providing electricity in year y. %. The value data for the monitoring period is between 0% and1,7%.
OK
B.3.92 Is the measurement equipment described? Is the accuracy of the measurement equipment addressed and deemed appropriate?
/1/ /2/
DR I
NA OK
B.3.93 Are the requirements for maintenance and calibration of measurement equipment described and deemed appropriate?
/1/ /2/
DR I
NA OK
B.3.94 Is the monitoring frequency adequate for all monitoring parameters? Is it in line with the registered monitoring plan?
/1/ /2/ /25/
DR I
Annually provided by the Turkish grid company. For the monitoring period the grid company calculated the TDL factor monthly and uses the factor directly for the creation of the monthly reports.
OK
B.3.95 Is the recording frequency adequate for all monitoring parameters? Is it in line with the registered monitoring plan?
/1/ /2/ /25/
DR I
Please refer to section B.3.94. The value of the monitoring period has been checked with the monthly protocols.
OK
B.3.96 Does data management (from monitoring equipment to emission reduction calculation) ensure correct transfer of data and reporting of emission reductions?
/1/ /2/ /12/
DR I
Yes. OK
EGtotal Amount of electricity provided to the grid as a result of the whole project activity / EGd,y Amount of electricity generated utilising biogas and LFG B.3.97 Data/Parameter monitored / Data unit / Description /
Source of data to be used / Value data for the monitoring period
/1/ /2/
DR I
ECtotal Amount of electricity provided to the grid as a result of the whole project activity. MWh. The value data for the monitoring period is 103,605.64MWh.
OK
B.3.98 Is the measurement equipment described? Is the /1/ DR Yes. The amount of electricity produced OK

RINA Mamak landfill waste management project – Turkey
GS Verification/Certification Report N° 2011-DG-01-MD, Rev. 1.2 Page A-30 GS_VER_REP-05-10
Checklist Question Ref. MoV1 Comments Draft Conclusion
Final Conclusion
accuracy of the measurement equipment addressed and deemed appropriate?
/2/ I by the project and delivered to the grid is measured by an electricity meters operated by the grid company who is the owner of the monitoring equipment. The grid company, responsible for maintanance and calibration of the monitoring equipment, carried out maintenance and calibration of equipment according to recognised procedures.
B.3.99 Are the requirements for maintenance and calibration of measurement equipment described and deemed appropriate?
/1/ /2/
DR I
Yes. Please refer to section B.3.98. OK
B.3.100 Is the monitoring frequency adequate for all monitoring parameters? Is it in line with the registered monitoring plan?
/1/ /2/
DR I
Yes, it is adequate and in line with the registered monitoring plan. The electricity production is measured from electricity meters and aggregated annually.
OK
B.3.101 Is the recording frequency adequate for all monitoring parameters? Is it in line with the registered monitoring plan?
/1/ /2/ /25/
DR I
Yes, it is adequate and in line with the registered monitoring plan. The monitoring team collect monthly measuring protocols and for power delivered to the grid. The values of the monitoring data have been checked with the monthly protocols issued by the grid company.
OK
B.3.102 Does data management (from monitoring equipment to emission reduction calculation) ensure correct transfer of data and reporting of emission reductions?
/1/ /2/ /12/
DR I
It is installed a second back-up meter which should use for cross-check. No special events occurred during the monitoring period.
OK
B.4 Monitoring of sustainable development indicators/environmental impacts B.4.1 Is the monitoring of sustainable development indicators/
environmental impacts warranted by legislation in the host country?
/1/ /2/
DR I
No. The project owner according to the Gold Standard requirements provided to monitor the sustainable indicators as
OK
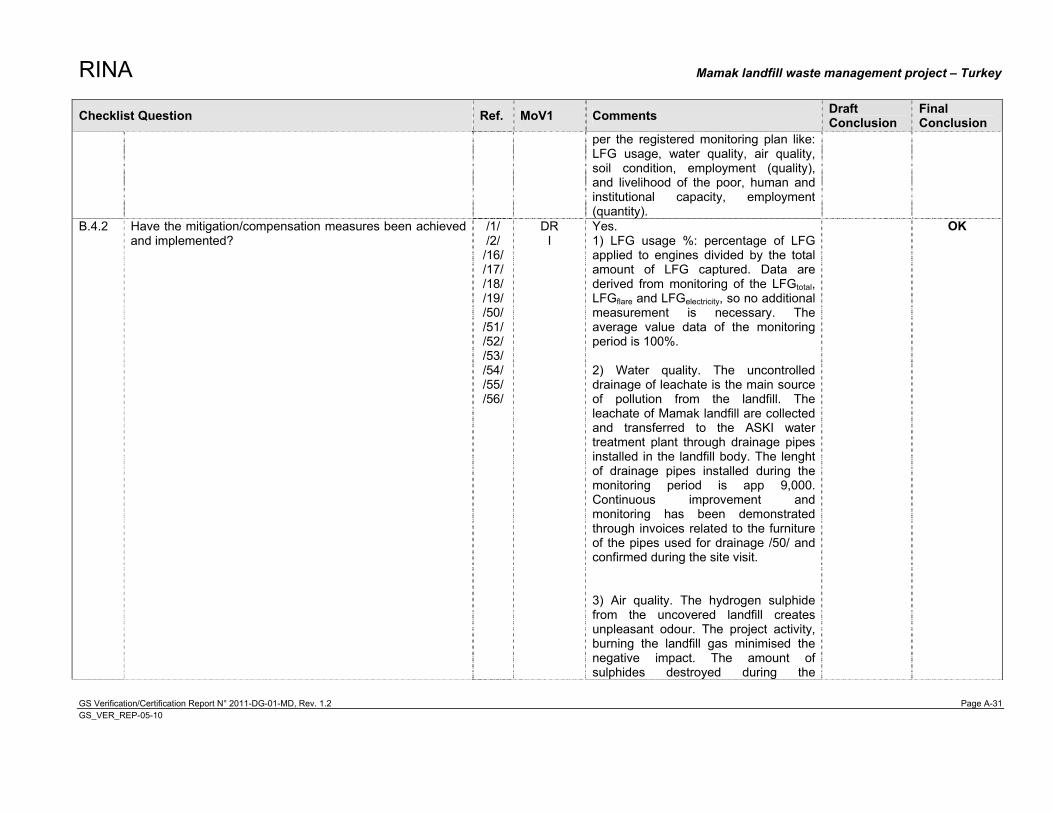
RINA Mamak landfill waste management project – Turkey
GS Verification/Certification Report N° 2011-DG-01-MD, Rev. 1.2 Page A-31 GS_VER_REP-05-10
Checklist Question Ref. MoV1 Comments Draft Conclusion
Final Conclusion
per the registered monitoring plan like: LFG usage, water quality, air quality, soil condition, employment (quality), and livelihood of the poor, human and institutional capacity, employment (quantity).
B.4.2 Have the mitigation/compensation measures been achieved and implemented?
/1/ /2/ /16/ /17/ /18/ /19/ /50/ /51/ /52/ /53/ /54/ /55/ /56/
DR I
Yes. 1) LFG usage %: percentage of LFG applied to engines divided by the total amount of LFG captured. Data are derived from monitoring of the LFGtotal, LFGflare and LFGelectricity, so no additional measurement is necessary. The average value data of the monitoring period is 100%. 2) Water quality. The uncontrolled drainage of leachate is the main source of pollution from the landfill. The leachate of Mamak landfill are collected and transferred to the ASKI water treatment plant through drainage pipes installed in the landfill body. The lenght of drainage pipes installed during the monitoring period is app 9,000. Continuous improvement and monitoring has been demonstrated through invoices related to the furniture of the pipes used for drainage /50/ and confirmed during the site visit. 3) Air quality. The hydrogen sulphide from the uncovered landfill creates unpleasant odour. The project activity, burning the landfill gas minimised the negative impact. The amount of sulphides destroyed during the
OK
RINA Mamak landfill waste management project – Turkey
GS Verification/Certification Report N° 2011-DG-01-MD, Rev. 1.2 Page A-32 GS_VER_REP-05-10
Checklist Question Ref. MoV1 Comments Draft Conclusion
Final Conclusion
monitoring period is Nm3 288,961.36. The amount of H2S is calculated based on the amount of LFG combusted in the engines and/or flares using. As per the registered PDD, in the calculation is used a conservative approach of 0.5% for the sulphide content. Data are derived from monitoring of LFGflare and LFGelectricity, so no additional measurement is necessary. 4) Soil condition. One of the factors of the soil degradation is the erosion. By terracing erosion will be reduced. The additional area at the landfill which has been terraced during the monitoring period is 47,670 m2. The area has been checked during the on site inspection and through the landfill map of terraced area. 5) Employment (quality). To improve job quality of employees the project owner carried out a number of specific training to ensure that the project can be controlled safely. The training certificates have been checked. 6) Livelihood of the poor. The project creates a number of jobs formalized with the social security. The PP monitoring the number of people employed by ITC with access to social security in specific period to who did not have social security before working at ITC. During the monitoring period 9 new people had access to social security. The registration documents have been
RINA Mamak landfill waste management project – Turkey
GS Verification/Certification Report N° 2011-DG-01-MD, Rev. 1.2 Page A-33 GS_VER_REP-05-10
Checklist Question Ref. MoV1 Comments Draft Conclusion
Final Conclusion
checked. Moreover the status of social security in Turkey is recorded on line and can be seen when the social security number for a specific person is available. During the site visit a sample of social security status has been checked; since they are personal information no data are stated in this report. 7) Human and institutional capacity. During the monitoring period the PP received many visitors to the Mamak plant confirmed by the list of visitors provided by the PP. Moreover during the monitoring period the PP organized an awareness campaign for the waste separation in neighboring areas in the Municipality of Golbasi Ambaji. 8) Employment quantity. The project activity creates a number of jobs. During the monitoring period 215 people were employed at Mamak plant. This is has been checked through the Employees monthly register which is an official documents expected by the Turkish Government.
B.4.3 Does the monitoring report provide for the collection and archiving of relevant data concerning environmental, social and economic impacts?
/17/ /18/ /19/ /50/ /51/ /52/ /53/ /54/ /55/ /56/
DR I
Yes, all the documented evidences related to the sustainable parameters monitored is collected and kept.
OK
RINA Mamak landfill waste management project – Turkey
GS Verification/Certification Report N° 2011-DG-01-MD, Rev. 1.2 Page A-34 GS_VER_REP-05-10
Checklist Question Ref. MoV1 Comments Draft Conclusion
Final Conclusion
B.5 Management, quality assurance and quality control B.5.1 How has it been assessed that the monitoring arrangements
described in the monitoring plan are feasible within the project design?
/1/ /2/
DR I
An on site inspection has been performed on 3-4/5/2010 and it is confirmed that the monitoring arrangements in the monitoring plan are feasible within the project design.
OK
B.5.2 Are procedures identified for day-to-day record handling (including what records to keep, storage area of records and how to process performance documentation)?
/1/ /2/ /12/
DR I
The monitoring activities are regulated by the Monitoring Manual; the data stored at the booster station server are transferred weekly to a computer and a back up hard drive. In case of failures of the data recording system, no emission reduction will be claimed for that period. A logbook will be written and will be registered the period without data recording. The original data from the electricity meter are edited monthly in the protocol signed by the project owner and by grid company. The data from the protocols are transferred to the excel sheet used for the emission reduction calculations.
OK
B.5.3 Are the data management and quality assurance and quality control procedures sufficient to ensure that the emission reductions achieved by/resulting from the project can be reported ex post and verified?
/1/ /2/ /12/
DR I
A Monitoring Manual has been provided establishing quality assurance and quality control procedures to ensure that the emission reductions resulting from the project can be reported and verified.
OK
B.5.4 Will all monitored data required for verification and issuance be kept for two years after the end of the crediting period or the last issuance of GS VERs, for this project activity, whichever occurs later?
/1/ /2/ /12/
DR I
The registered PDD expects storing the collected data during the monitoring period at least two years after the last issuance of GS VERs.
OK