Embed Size (px)
Citation preview

G O I N G B E Y O N D
E X P E C T A T I O N S

GOING BEYONDEXPECTAT IONS

VISIONTo be a successful gateway for the nation’s trade inventory and the pride of the nation in terms of employee relations, customer satisfaction and corporate citizenship.
MISSIONTo achieve 12 million TEUs and 12 million tonnes of cargo by 2020 with excellent returns for employees, shareholders and customers.
EXPECTAT IONS

VALUESTEAMWORKWestports believes in collective and co-operative teamwork which contributes to the achievement of the company’s vision and mission.
ACCOUNTABILITY AND INTEGRITYIntegrity is the bedrock on which trust is built and is the hidden key to success. Employees are embedded with a deep feeling of trust and integrity which provides transparency and positive work environment.
NOW CULTUREWestportians believe the attitude and process of treating key business as if one’s life is depended on it. It is about determination to stay focused and committed in delivering positive results. Westports cultivates a great sense of urgency and priority in every employee.
SAFETY AWARENESSSafety is an integral part in sustaining our business growth and success leading to an increase in productivity.
RESPONSIBLE This tenet is embraced by all employees where we are all responsible for our actions and conduct.
INNOVATION Westportians develop a passion for excellence and success through continuous innovation of new ideas and practices.
GOOD FAMILY VALUESWe work together as a family and practice candor, open communications and solve any issues or problems together. Things are done in good thoughts, good intentions and good deeds. Westports is a big family where everyone is treated with respect.


ABOUTWESTPOR TSWe are connected to the ports around the world through major shipping lines and feeder services.

WESTPOR TSFAR EAST ASIA
1. CHINA - Shenzhen / Nansha / Tianjin / Shanghai / Ningbo / Shekou / Yantian / Chiwan / Qingdao / Xiamen / Da Chan Bay / Dalian / Fuzhou / Xingang / Hong Kong
2. JAPAN - Osaka / Tokyo / Yokohama / Nagoya / Kobe / Yokkaichi / Hakata
3. SOUTH KOREA - Busan / Kwangyang / lncheon / Ulsan
4. TAIWAN - Kaohsiung / Taipei / Keelung / Taichung
SOUTH EAST ASIA
1. INDONESIA - Belawan / Jakarta / Perawang / Semarang / Surabaya / Benete Bay / Panjang / Buatan
2. MALAYSIA - Pasir Gudang / Tanjung Pelepas / Miri / Bintulu / Kota Kinabalu / Penang / Sibu / Kuching / Sandakan / Tawau / Labuan / Kuantan / Port Klang NP
3. MYANMAR - Yangoon4. SINGAPORE - Singapore5. THAILAND - Laem Chabang / Bangkok6. VIETNAM - Ho Chi Minh / Cat Lai /
Hai Phong / Qui Nhon / Da Nang7. BANGLADESH - Chittagong / Mongla8. BRUNEI - Muara9. CAMBODIA - Sihanoukville10. PHILIPPINES - Manila
AUSTRALASIA
1. AUSTRALIA - Fremantle / Brisbane / Sydney / Melbourne / Adelaide / Darwin / Esperance / Gladstone / Townsville
2. PAPUA NEW GUINEA - Port Moresby / Port of Lae / Rabaul / Madang / Kimbe
3. SOLOMON ISLANDS - Honiara
INDIAN SUBCONTINENT
1. INDIA - Pipavav / Haldia / Chennai / Nhava Sheva / Cochin / Mundra / Calcutta / Visakhapatnam
2. PAKISTAN - Karachi3. SRI LANKA - Colombo
BLACK SEA
1. RUSSIA - Novorossiysk / Vladivostok 2. UKRAINE - Odessa
MIDDLE EAST
1. IRAN - Bandar Abbas2. OMAN - Salalah3. SAUDI ARABIA - Dammam / Jeddah4. UNITED ARAB EMIRATES - Khor Fakkan /
Jebel Ali / Dubai
MEDITERRANEAN
1. EGYPT - Suez / Port Said / Damietta / Alexandria
2. ISRAEL - Ashdod / Haifa3. ITALY - Genoa / La Spezia / Trieste4. TURKEY - Ambarli / Mersin5. LEBANON - Beirut6. MALTA - Malta7. SLOVENIA - Koper8. CROATIA - Rijeka
WEST AFRICA
1. ANGOLA - Lobito / Luanda2. BENIN - Cotonou3. CONGO - Pointre Noire4. GHANA - Tema5. IVORY COAST - Abidjan6. MOROCCO - Tangier7. NAMIBIA - Walvis Bay8. NIGERIA - Apapa / Lagos / Onne /
Tin Can Island9. TOGO - Lome
EAST AFRICA
1. DJIBOUTI - Djibouti2. KENYA - Mombasa3. SOUTH AFRICA - Durban / Cape Town4. MADAGASCAR - Toamasina5. MAURITIUS - Port Louis6. MOZAMBIQUE - Beira / Nacala7. REUNION - Port Reunion8. SUDAN - Port Sudan9. TANZANIA - Dar Es Salaam / Zanzibar
WEST EUROPE
1. BELGIUM - Zeebrugge2. FRANCE - Fos sur Mer / Le Havre3. GERMANY - Hamburg4. UNITED KINGDOM - Tilbury /
Southampton / Felixstowe5. SPAIN - Valencia / Barcelona6. NETHERLANDS - Rotterdam
NORTH & CENTRAL AMERICA
1. USA - Seattle / Savannah / Norfolk / New York / Los Angeles / Oakland
2. CANADA - Vancouver
SOUTH AMERICA
1. ARGENTINA - Buenos Aires2. BRAZIL - ltapoa / Santos / Paranagua /
Rio Grande3. URUGUAY - Montevideo
Note : Above ports are directly connected by major shipping lines and feeder services

Westports was listed on the Main Market of Bursa Malaysia Securities Berhad (“Bursa Malaysia“) on 18 October 2013. Westports was included in the Morgan Stanley Capital Indices (“MSCI”) Index on 29 May 2015 and subsequently became constituent of FTSE Bursa Malaysia KLCI (“FBM KLCI”) Index on 22 June 2015.
Westports primarily manages port operations dealing in container and conventional cargo. It also provides a wide range of port services, including marine services, rental services and other ancillary services.
Westports is located in Port Klang and there are three main ports in the Straits of Malacca that handle gateway and transhipment container cargo all of which are located in close proximity to the main shipping route along the Straits of Malacca. These ports have the advantage of natural deep water berths which allow them to accommodate large vessels.
Westports serves as the main gateway for container and conventional cargo for central Peninsular Malaysia hinterland.
Our container business has grown exponentially from 200,000 Twenty-foot Equivalent Unit (“TEUs”) in 1996 to 9.1 million TEU in 2015. Our market share of container business represents 76% in Port Klang, 17% in Straits of Malacca and 9% in South East Asia as at 2015.
Our success is attributable to our strategic location, deepest channel and wharf, straight line berth, higher productivity, dedicated young and vibrant employees and connectivity to more than 350 ports around the world, amongst others.
We have 27 berths with the length of 7,242 metres, of which 20 berths are connected in a straight line measuring 5,400 metres. Our container handling capacity stands at 11 million TEUs and capacity utilisation ratio is at 83% in 2015. We are in the midst of expanding our capacity to Container Terminal 8.
Our conventional terminal handled 10.2 million tonnes of bulk cargo in 2015. The bulk cargo comprises of mixed steel, steel coils, project cargo, animal feed, human consumables, fertilizers, building related cargo, palm oil, petroleum, chemical and liquefied petroleum gas. It represents 57% market share of conventional cargo handled in Port Klang.
A B O U T W E S T P O R T S


010 HIGHLIGHTS 2015 Performance at a Glance Financial Highlights Marketing Highlights Productivity Snapshots Statement of Value Added and Distribution
021 PERSPECTIVE Chairman’s Statement CEO’s Statement Management Discussion and Analysis
054 OUR COMPANY Corporate Profile Group Corporate Structure Corporate Information
060 LEADERSHIP Profile of Directors Profile of Management Team
CONTENTS080 ACHIEVEMENTS 2015 Awards and Achievements Past Awards and Recognitions
086 CORPORATE RESPONSIBILITY Community Workplace Environmental Marketplace Sustainability Reporting Corporate Events Media Relations
118 ACCOUNTABILITY Corporate Governance Statement Statement on Risk Management and Internal Control Audit and Risk Management Committee Report
146 FINANCIAL STATEMENTS Directors’ Report Audited Financial Statements Statement by Directors Statutory Declaration Independent Auditors’ Report
214 OTHER INFORMATION Additional Compliance Information Analysis of Shareholdings List of Concession Assets
222 ANNUAL GENERAL MEETING INFORMATION Notice of Twenty-Third Annual General Meeting Form of Proxy

2015PERFORMANCEAT AGLANCE
010 W E S T P O R T S H O L D I N G S B E R H A D

CONTAINER THROUGHPUT
9.1million TEUs
RETURN ON ASSETS
12.5%
RETURN ON EQUITY
26.6%
* Earnings Before Interest, Tax, Depreciation and Amortisation ^ Market capitalisation as at 31 December 2015
+8%
EBITDA*
RM 869 million+10%
PROFIT AFTER TAX
RM 505 million-1%
CONVENTIONAL THROUGHPUT
10.2million tonnes-1%
OPERATIONAL REVENUE
RM 1.578 billion+5%
PROFIT BEFORE TAX
RM 650 million+12%
DIVIDEND PAID
RM 391 million+11%
MARKET CAPITALISATION^
RM 14.0 billion+22%
011A N N U A L R E P O R T 2 0 1 5

HIGHLIGHTSFINANCIAL
Group PerformanceFor the Financial Year Ended 31 December
012 W E S T P O R T S H O L D I N G S B E R H A D
(In RM’000) 2011 2012 2013 2014 2015
Revenue 1,387,374 1,492,262 1,712,618 1,562,079 1,681,783
Profit before tax 365,054 434,673 517,008 578,781 650,143
Profit attributable to owners of the Company 318,116 359,317 435,305 512,205 504,864
Shareholders’ equity 1,328,314 1,488,029 1,603,942 1,764,235 1,898,121
Total assets 3,100,680 3,214,425 3,573,984 3,846,122 4,029,555
Earnings per share (sen) 10.5 12.0 13.9 15.0 14.8
Dividend per share (sen) 6.7 9.0 9.6* 11.3 11.1
Dividend payout ratio (%) 63.1% 75.0% 75.0%* 75.0% 75.0%
Return on equity (%) 23.9% 24.1% 27.1% 29.0% 26.6%
Return on total assets (%) 10.3% 11.2% 12.2% 13.3% 12.5%
* Excluding special dividend

Shareholders’ Equity (RM’Mil)
Return On Equity (%) Return On Total Assets (%)
Dividend Payout Ratio (%) Dividend Per Share (Sen)
* Excluding special dividend * Excluding special dividend
013A N N U A L R E P O R T 2 0 1 5
Earnings Per Share (Sen)
2011 2012 2013 2014 201514
.8
15.0
10.5 12
.0 13.9
2011 2012 2013 2014 2015
26.6
29.0
23.9 24
.1
27.1
2011 2012 2013 2014 2015
75.0
75.0
63.1 75
.0
75.0
*
2011 2012 2013 2014 2015
1,89
8
1,76
4
1,32
8
1,48
8 1,60
4
2011 2012 2013 2014 201512
.513.3
10.3 11
.2 12.2
2011 2012 2013 2014 2015
11.1
11.3
6.7
9.0 9.
6*

HIGHLIGHTSMARKETING
014 W E S T P O R T S H O L D I N G S B E R H A D
Continuously Outperforming the Industry Growth Rate
Delivering Nation‘s Inventory as Largest Gateway Port in Malaysia
TOTAL CONTAINER VOLUME (MILLION TEUs)
1996 2003 2008 2013 2014 2015
CONTAINER IMPORT & EXPORT VOLUME (MILLION TEUs)
10.00
9.00
8.00
7.00
6.00
5.00
4.00
3.00
2.00
1.00
0
3.00
2.50
2.00
1.50
1.00
0.50
0
CAGR = 38%
CAGR = 29%
7.5
8.49.1
5.0
2.3
0.02
1996 2003 2008 2013 2014 2015
2.2
2.5 2.5
1.4
0.8
0.02
Compounded annual growth rate (“CAGR”) of 38% over a period of 19 years.
CAGR of 29% over a period of 19 years.

015A N N U A L R E P O R T 2 0 1 5
Continuously Winning Market Share
MARKET SHARE
WESTPORTS CONTAINER VOLUME BY REGION
90%
80%
70%
60%
50%
40%
30%
20%
10%
0
60%
50%
40%
30%
20%
10%
0
1998 2003 2008 2012 2013 2014 2015
26%
48%
62%
69%72%
76% 76%
3%8%
11%
7%5%2% 8% 8%
14% 14% 15% 17%
Port Klang Straits of Malacca South East Asia
48%
28%
12%
6%
6%
50%
26%
12%
7%
5%
50%
23%
13%
8%
6%
49%
23%
12%
8%
8% 8%
48%
25%
10%
9%
Intra Asia Asia Europe Asia Africa Asia Australia Others
Leveraging on Fastest Growing Trades
2011 2012 2013 2014 2015
9% 9%

KEY STRENGTHS
SNAPSHOTSPRODUCTIVITY
CRANEPRODUCTIVITY
HANDLINGCAPACITY
DEEPESTDRAFT
* mph denotes moves per hour.
2000 - 20 mph* 1996 - 1.0 mil TEUs 1996 - 15.0 m
NOW 30 - 35 mph* NOW 11 mil TEUs NOW 17.5 m
016 W E S T P O R T S H O L D I N G S B E R H A D
World leader in productivity with berth capability to accommodate the world’s largest vessels.

CONTAINER VESSEL SIZE
CONTAINERBERTHS
SHIP-TO-SHORE CRANES
NO. OFVESSELS
1996 - 600 m 1996 - 9 cranes 2004 - 4,346 vessels
NOW 4.6 km NOW 52 cranes NOW 9,362 vessels
19962,900TEUs
19996,600TEUs
20068,400TEUs
201114,100TEUs
201216,000TEUs
201318,000TEUs
NOW19,000TEUs
017A N N U A L R E P O R T 2 0 1 5

VALUE ADDED AND DISTRIBUTION
STATEMENT OF
018 W E S T P O R T S H O L D I N G S B E R H A D
(In RM’000) 2015 2014
VALUE ADDED:
Revenue 1,681,783 1,562,079Less: Construction revenue (103,485) (59,109)
Operational revenue 1,578,298 1,502,970Purchase of goods and services (489,738) (503,569)
Total value added available for distribution 1,088,560 999,401
DISTRIBUTION:
To employees - salaries and other staff costs 219,507 210,167
To government - income tax 145,279 66,576
To provider of capital - dividends 391,127 351,912 - finance costs (net) 63,730 63,942
Retained for future reinvestment & growth - depreciation and amortisation 155,180 146,511 - retained profits 113,737 160,293
Total distributed 1,088,560 999,401
RECONCILIATION
Profit for the year 504,864 512,205Add: Depreciation & amortisation 155,180 146,511 Finance costs (net) 63,730 63,942 Staff costs 219,507 210,167 Income tax 145,279 66,576
Total value added 1,088,560 999,401
For the Financial Year Ended 31 December
Value added is a measure of wealth created. The above statement shows the Group’s value added for 2015 and 2014 and its distribution by way of payments to employees, government and capital providers, with the balance retained in the Group for future reinvestment and growth.

019A N N U A L R E P O R T 2 0 1 5


Chairman’s Statement 022
CEO’s Statement 026
Management Discussion and Analysis 030
• Business Operational Review 031
- Container Services 031
- Conventional Services 034
- Marine Services 035
- Logistic and Rental Services 036
- IT Initiatives 036
• Financial Review 038
• 2016 Economic Outlook 043
• Investor Relations 044
• Risk Profile 048
• Our Strengths 050
PERSPECTIVE

STATEMENTCHAIRMAN’S
022 W E S T P O R T S H O L D I N G S B E R H A D

Dear Shareholders,
On behalf of the Board of Directors, it gives me great pleasure to present to you the Annual Report of Westports Holdings Berhad (“Westports” or “the Group”) for the financial year ended 31 December 2015.
The year under review marks the 21st anniversary of our business operations and our 3rd Annual Report post listing in Bursa Malaysia. We registered another set of stellar performance with our container volume recording 9.1 million TEUs, at 8% growth despite challenging times in the world economic front. It strengthened our position as a leading port in Malaysia.
ECONOMY AND SHIPPING LINES
The world economy registered a growth of approximately 3.1% in 2015 compared to 3.4% recorded in 2014, a slight contraction in the economies. This economic scenario was attributed by marginal growth in advance economies by 0.1% to 1.9% whilst there was slower growth in emerging markets and developing economies by 0.6% to 4.0%.
The US economy recorded growth attributed to increase in consumption and investment spending arising from favourable labour market conditions and lower fuel price. Eurozone economy also recorded growth in consumptions despite uncertainty arising from financial turmoil in Greece. Japan recorded modest growth arising from capital expenditure.
China being the second biggest economy in the world is transitioning to a new normal with slower but sustainable growth, mainly attributed by slower investment in real estate and capital expenditure. ASEAN economies recorded modest growth benefiting from lower oil prices as the region is a net oil importer. However, China’s slower growth has negated rapid growth for ASEAN economies as China is their biggest export market for commodity and products.
2015 also serves as an important milestone with the formation of the ASEAN Economic Community (“AEC”) which is expected to be a unified market and production base with free movement of goods, services, investments, skilled labour and flow of capital. AEC has a population of more than 600 million with economic size surpassing US$2.6 trillion mark making it the seventh largest economic region in the world.
In our home ground Malaysia, the economy posted lower growth arising from weaker domestic demand mainly from private and public investment. The growth was further affected by lower export growth amid weak global activities.
023A N N U A L R E P O R T 2 0 1 5

024 W E S T P O R T S H O L D I N G S B E R H A D
C H A I R M A N ’ S S T A T E M E N T
The shipping industry is also facing challenges with excess capacity, weak demand and falling freight rates. The lower bunker prices have softened the impact to their cost structure whilst the benefits were subsequently passed on to the shippers.
PERFORMANCE REVIEW
Westports is connected to more than 350 ports around the world by main line operators with transhipment container volume accounting for 72% of its volume. This indicates that our business is a mirror reflection of the global economy. Against this challenging backdrop, Westports has achieved commendable growth in volume by 8% to 9.1 million TEUs in 2015. The transhipment grew at a stronger pace of 12% while gateway volume remained at 2014 level. The transhipment volume growth is attributed to the Ocean 3 Alliance while the gateway volume is a reflection of local economy. The conventional cargo was down by 1% to 10.2 million tonnes, attributed to non-operation of bunker segment for 12 month in 2015. On RORO segment, we achieved 163 thousand vehicles, down by 2%.
Likewise, Westports operational revenue increased by 5% to RM1.578 billion whilst our profit before tax recorded a commendable growth of 12% to RM650 million. Higher profit before tax was due to lower fuel cost and slower pace of growth in expenses compared to revenue. However, profit after tax was marginally lower by 1% to RM505 million due to higher tax incentives received in 2014 as a result of higher capital expenditure capitalised for Container Terminal 7. On a comparable basis, our tax incentive in 2014 was RM83 million compared to nil in 2015 as the expansion works for Container Terminal 8 (“CT 8”) are at the work in progress phase as at end of 2015. The detailed analysis
of performance is reported in the Management Discussion and Analysis section of this report on page 30 to 53.
CORPORATE RESPONSIBILITY
We have started to incorporate some of the sustainable reporting requirements unveiled by Bursa Malaysia in October 2015 in this Annual Report, although the implementation is in 2016. Essentially, we are already operating our business in a sustainable manner, which is a testament for our phenomenal growth in the past 21 years.
We have reported our stakeholders’ engagement broadly into four categories namely community, workplace, environmental and market place. Our reporting of Corporate Social Responsibility (“CSR”) is now part of community stakeholder engagement. Westports CSR activities such as poverty eradication, enhancing education, refurbishment of community facilities, caring for the native community and ensuring the safety and security of people, were centred in Pulau Indah where we operate. Westportians participated on these CSR activities and contributed their part for the betterment of the community.
DIVIDEND
Westports has declared two interim dividends for 2015 with first interim dividend of 5.32 sen paid on 26 August 2015 and second interim dividend of 5.78 sen paid on 2 March 2016 with total amounting to 11.1 sen. The dividend paid was in line with our dividend policy of 75% of Profit After Tax.
OPERATIONAL REVENUE
RM
1.578 BIL.2014: RM1.503 BIL.
+5%
PROFIT BEFORE TAX
RM
650 MIL.2014: RM579 MIL.
+12%
MARKET CAPITALISATION
RM
14 BIL.2014: RM11.5 BIL.
+22%

025A N N U A L R E P O R T 2 0 1 5
C H A I R M A N ’ S S T A T E M E N T
MSCI AND FBM KLCI COUNTER
I am pleased to report that Westports is now an index counter. The first inclusion to the index was in 29 May 2015 to MSCI Malaysian Chapter. The MSCI Malaysia Index, with 42 constituents is designed to measure the performance of the large and middle capitalisation segments of the Malaysian market.
Second inclusion is to the FBM KLCI Index on 22 June 2015. FBM KLCI represents the performance of the largest Malaysian blue chip companies that pass the size, free float and liquidity screens. It represents approximately 60% of the Bursa Malaysia Main Market with 30 constituents in the index. Westports was reported as the best performing FBM KLCI Index Company in the month of August 2015 by 4.74% despite lower performance of FBM KLCI index by negative 6.41%.
Inclusion in both indexes reflects our underlying fundamental strengths and our business approach in a transparent and consistent manner. Subsequent to becoming MSCI Malaysia Index constituent, our foreign shareholding interest increased to 34.4% as at 31 December 2015 compared to 32.1% same period last year. The share price also surged by 23% to RM4.12 on 31 December 2015 compared to the same period last year. Our market capitalisation was valued at RM14.0 billion as at 31 December 2015 and is the 28th largest company in Bursa Malaysia by market capitalisation.
AWARDS RECEIVED
Westports has received four awards in 2015.
Alpha Southeast Asia conducted its fifth annual poll to find the region’s top institutions from participants across the region, US and Europe which include large institutional investors, insurance companies, pension funds, hedge funds, equity and fixed income brokers and analysts with investment interests in the South East Asian region.
Westports has received an Award for Malaysian chapter on category of Most Improved Investor Relations, Strongest Adherence to Corporate Governance and Most Consistent Dividend Policy at the 5th Annual Southeast Asia’s Institutional Awards for Corporates on 8 September 2015.
World Finance magazine of United Kingdom also awarded 2015 Entrepreneur of the Year in Logistic Sector, for Asia category to our CEO, Ruben Emir Gnanalingam. The magazine commended on the success of Westports on productivity, quick turnaround and keeping the leadership simple.
Westports has received Sahabat Negara SME award from SME Association of Malaysia. This award is bestowed to company that contributed significantly to the promotion and development of Small Medium Enterprises in Malaysia.
In recognition of my role and contributions through Westports towards promoting Malaysia and it’s economy, I was awarded Lifetime Achievement Award by Utusan
Business Awards 2015. The award was organised by Kumpulan Utusan Media Group and presented on 1 March 2016.
ACKNOWLEDGEMENT
On behalf of the Board of Directors, I would like express my gratitude to Dr John Edward Wenham Meredith for his contribution, guidance and invaluable services as a board member since Hutchison Port Holdings Limited became a strategic investor in year 2000. I would like to take this opportunity to welcome Ms. Ruth Sin Ling Tsim to the Board as a Non-Independent Non-Executive member on 16 November 2015. I also would like to welcome Mr. Raymond Pak Ying Law to the board as an Alternate Director to Mr. Ip Sing Chi and Ms. Ruth Sin Ling Tsim, both are Non-Independent Non-Executive Directors on 16 November 2015.
I would like to pay tribute to Westportians for their commitments and their invaluable contributions for another excellent year for our business. I express my sincere thanks and appreciation to our customers, business partners, government agencies, shareholders and other stakeholders for their unyielding confidence and support towards Westports.
Last but not least, I also wish to thank my distinguished colleagues on the Board for their invaluable support and contribution throughout the year.
Tan Sri Datuk G. GnanalingamExecutive Chairman

Dear Shareholders,
On behalf of the management and staff of Westports, it gives me great pleasure as the Chief Executive Officer (“CEO”)to present our performance for the financial year ended 31 December 2015 with continuous growth trajectory.
OUR PERFORMANCE
At Westports, we have always placed priority in our productivity and delivering the best-in-class level of service to our customers. We view the objectives of achieving record productivity service levels, generating favourable economic returns for our stakeholders and also managing our carbon footprint as mutually compatible and necessary today. Westports achieved ISO 14001:2004 certification for environmental management and during the year, we conducted emission monitoring for Rubber Tyre Ganty (“RTG”) cranes. On CSR, we have continued to engage with our community with initiatives focused on Pulau Indah.
2015 marks another milestone in our operations as we showcased our capabilities with a unique arrangement by having 12 Ship-to-Shore Cranes (“STS”) simultaneously servicing CMA CGM’s Kerguelen when she made her maiden call in April 2015. The 398-metre long vessel is among the newest in CMA CGM’s fleet of 460 vessels.
We have increased the usage of technology by adding tablets into our wharf operations last year. In 2015, we went one step further to develop smartphone applications and have access to our web-based e-Terminal Plus which allow our users to access information on their fingertips. Our commitment towards innovation will always be a pillar in the way we do things.
Westports achieved another all-time historical record by handling container volume of 9.1 million TEUs. This is an increase of 8% over the previous year’s volume of 8.4 million TEUs which was already a record back then. Cumulatively, we have handled about 75 million TEUs since we started the container operations in 1996.
For the non-container or conventional segment, we achieved a throughput volume of 10.2 million metric tonnes in 2015. The conventional segment has stable volumes as it mainly caters for the domestic economy’s input. Though some cargoes were gradually transported using containers, we were still able to capture the volume as a port. Meanwhile, our RORO volume was down by 2% to 163 thousand vehicles.
During the financial year under review, Westports operational revenue grew by 5% to RM1.578 billion while our profit before tax improved by 12% to RM650 million. We achieved a profit after tax of RM505 million in 2015.
026 W E S T P O R T S H O L D I N G S B E R H A D

STATEMENTCEO’S
027A N N U A L R E P O R T 2 0 1 5

SUSTAINABILITY REPORTING
Bursa Malaysia has issued directive in October 2015 for listed companies to report on sustainability issues effective from 2016 Annual Report. Starting from this Annual Report, we shall highlight the sustainability practices that are already in practise at Westports as this area is placed with more importance for shareholders, rating companies and regulators.
HUMAN RESOURCE
Our employees are our greatest asset as their passion, dedication and commitment have moved Westports to our current position. We have a total headcount of 4,275 Westportians as at December 2015. About 3,694 are operational staff and 581 are support staff. With the exception of 3 expatriates, all our employees are locals.
On 8 June 2015, we have launched a companywide safety campaign to enhance awareness on operational safety issues that can reduce accidents at the workplace. We have conducted various training programs until December 2015 to instil the importance of safety and its impact on our operations.
Every year, we organise companywide training with a particular theme. In 2015, our theme was cultural program centred on our Company values and objectives. The trainers structured the program with games, sketch play and essay writing towards focusing the mind on the importance of individual contribution towards achievement
of Company goals. These sessions proved to be highly motivational and inspirational for all Westportians.
CONTAINER TARIFF
The Ministry of Transport approved the revised container tariff rates and Phase One of the revision has been implemented on 1 November 2015 with an average approximate increase of 15% on key container tariff items. Phase Two would be implemented on 1 September 2018. The revised tariff rates would help to mitigate the cost increase associated with the investments and container terminal operations.
CT 8 EXPANSION
Westports has always been a supply-driven port since our inception and we believe in delivering the best facilities and services for long-term sustainable partnerships with our customers. We strengthened our commitment to our customers and also positioned the Company for the next growth phase as we embarked on the first phase of the CT 8 expansion that commenced in January 2015.
We are constructing CT 8 in two phases. As at the date of this annual report, we have received and commissioned into service two units of STS cranes and three units of Variable Speed RTG (“VS RTG”) cranes. The first phase of 300-meter wharf is scheduled to be fully completed by mid-2016.
The second container gate, second marshalling centre and maintenance building are expected to complete in the later part of 2016.
C E O ’ S S T A T E M E N T
028 W E S T P O R T S H O L D I N G S B E R H A D
CONTAINER THROUGHPUT
9.1 MIL. TEUS2014: 8.4 MIL TEUs.
+8%
NO OF VESSELS
9,362 VESSELS
2014: 8,656 vessels
+8%
WIDELY CONNECTED TO MORE THAN
350PORTS AROUND THE WORLD

We will commence on the second phase of CT 8 expansion in 2016. Further details is reported in the Management Discussion and Analysis section of this report under the header of Expansion Plan on page 34.
2016 OUTLOOK
Malaysia’s Ministry of Finance is expecting the economy to sustain a positive growth albeit at a more moderate pace of between 4% and 5% in 2016. Regionally within Asia-Pacific, China’s economic growth is also expected to be more moderate in 2016. With this economic environment, Westports expects its container volume to grow at a slower pace compared to 2015.
ACKNOWLEDGEMENT
I wish to express my heartfelt thanks to all our customers, partners, regulatory authorities, government agencies, staff and shareholders for your invaluable support and confidence in Westports. With your support in our “One Team One Dream” aspiration, we will forge ahead towards a better future for Port Klang and Malaysia.
Ruben Emir GnanalingamChief Executive Officer
029A N N U A L R E P O R T 2 0 1 5

030 W E S T P O R T S H O L D I N G S B E R H A D
DISCUSSION AND ANALYSIS
MANAGEMENT

031A N N U A L R E P O R T 2 0 1 5
DISCUSSION AND ANALYSIS
Business Operational Review
CONTAINER SERVICES
Shipping Industry
The container shipping industry experienced transformative changes in 2015 with the emergence of four global major strategic alliances consisting of 2M alliance, O3 alliance, CKYHE alliance and G6 alliance. On an aggregate basis, the four alliances contributed a significant portion of the global container trade services. Westports is currently servicing the Ocean Three (“O3”) alliance, which consists of CMA CGM, United Arab Shipping Co. (“UASC”) and China Shipping Container Lines Co (“CSCL”).
Container lines have made sizeable investment in fleet capacity building to reduce emission levels and container slot cost. With the delivery of more Ultra Large Container Vessel (“ULCV”) in 2015 which were being utilised especially for the long-haul Asia-Europe trade lane, existing vessels were increasingly being deployed to other regional and feeder services such as the north-south routes, including those from Asia to South America and Africa. The cascading effect of deployment of these vessels have impacted routes such as South America-Asia and Africa-Asia trades and also some intra-Asia routes.
In 2015, the world’s container ship capacity broke through the 20 million TEUs units barrier after carriers set a new record for the shortest time to add one million TEUs to the fleet. It took just seven-and-a-half months for the global fleet to expand to 20 million TEUs from 19 million TEUs in late January 2015. The strong supply in container shipping capacity exceeded the container shipping demand due to slower regional and global economic growth. Consequently, this contributed to the lacklustre container freight rates that affected many shipping lines and alliances.
Ocean Three Alliance
The O3 alliance, operates among the largest ULCV in the world and they have taken deliveries of large vessels more than 19,000 TEUs in 2015. Combined together, the O3 alliance has a market share of approximately 15% of the global container industry. With Westports supply-driven approach in investment in container terminal expansion, we are already accommodating the largest container vessels in the world carrying more than 19,000 TEUs. We have been able to accommodate and support O3 alliance expansion as they deployed these new ULCVs in the Asia-Europe routes and used Westports as one of their transhipment hubs.

032 W E S T P O R T S H O L D I N G S B E R H A D
M A N A G E M E N T D I S C U S S I O N A N D A N A L Y S I S
As global economic growth remained uneven with increased headwind as the year of 2015 progressed, the four shipping alliances, including O3, gradually introduced blank sailings in order to achieve better equilibrium to match the growth in supply in container slots arising from new vessels delivery and demand for container shipments across the world. The blank sailings basically maintained the geographical coverage and port of calls, including Westports, but with reduced frequency. As the size of the vessels deployed have grown larger, even with blank sailings, the available container capacity is more than adequate to meet shipping customers’ demand.
Container Volume
Westports achieved an all-time historical record by handling a container volume of 9.1 million TEUs in 2015, which is an increase of 8% over the previous year’s volume of 8.4 million TEUs. Transhipment containers increased by 12% to 6.6 million TEUs as gateway containers remained flat at 2.5 million TEUs. Therefore, out of the total volume of 9.1 million TEUs, the container mix for transhipment containers increased to 72% while gateway containers made up the remaining 28% of the total volume.
Analysing the total container volume by trade lane, 48% of Westports containers are destined within Intra-Asia. These containers were loaded at a port in Asia and shipped to the destination port within Asia. In 2015, the Intra-Asia container volume improved by 3% to 4.3 million TEUs as the regional Asia-Pacific experienced more moderate level of economic growth.
The Asia-Europe trade lane constituted 25% of Westports total container volume and it grew strongly by 17% in 2015 to 2.3 million TEUs. The increased volume in this trade lane is a testimony of the supportive relationship between Westports and members of the O3 alliance as the growth achieved in this particular trade lane outpaced the industry’s overall volume.
The remaining key volume at the other trade lanes consisted of Asia-Africa at 10%, Asia-Australasia at 9% and Asia-America at 6%. Westports experienced very strong increase at the Asia-America trade lane as our shipping customers have added more services to this route while North America’s
economies continued to experience improvements in their economic growth levels.
The Ministry of Transport approved the revised container tariff rates in August 2015 and the revision is being implemented in two phases. Phase One entails an average approximate increase of 15% on key container tariff items, particularly terminal handling charges (“THC”), which came into effect on 1 November 2015. The Phase Two of the revised container tariff rates will be on 1 September 2018. The revised tariff covers container THC for import, export, transhipment, shifting and re-stow, storage charges for container and handling charges for heavy lift or uncontainerized cargo.
The tariff revision would support Westports’ expansion plans and investment in the latest CT 8 which would be equipped with the latest energy efficient terminal operating equipment. With more than a decade since the last tariff revision, the higher tariff rates would also be needed to cover the cost increases associated with the operations, maintenance and investments for all its container terminals.
Preferred Hub Distribution Centre
Westports has been positioning itself as a preferred hub for distribution and trading operations in South East Asia.
The seamless and integrated business process in Westports and close proximity to Port Klang Free Zone (“PKFZ”) with mixed development comprising of manufacturing activities complemented by amenities designed to facilitate the growth of regional distribution centers or international procurement centers have made PKFZ a preferred distribution hub for many products or commodities such as polymer resin, ingot, steel, cotton, ammonium nitrate and others. We are preferred due to connectivity, simplified processes, abundance of space, proximity to the market and adequate labour supply among others.
We initiated this conscience effort five years ago to grow this market segment and achieved 150 thousand TEUs in 2015 as major industry shippers chose Westports as their hub.

033A N N U A L R E P O R T 2 0 1 5
M A N A G E M E N T D I S C U S S I O N A N D A N A L Y S I S
In 2015, through our close collaboration with cotton industry players, PKFZ, Port Klang Authority, Ministry of Agriculture and Intercontinental Exchange (“ICE”), Westports achieved major milestone after Malaysia has been approved as a world delivery point for cotton by ICE. With United States, Australia and Taiwan in the same league, Malaysia is placed fourth in the world.
Operational Review
CSCL Globe, a 19,100 TEUs vessel, which started calling in late 2014 remains as among the largest container vessels to ply the seas at an Length Overall (“LOA”) of 400m. In 2015, Westports had the honour of having UASC Barzan, a 18,800 TEUs vessel, regarded as the “Largest Eco-Friendly Vessel”. The continuous calls by these largest class vessels operated by CMA-CGM, CSCL and UASC, is a testament of our ability to provide top notch operational delivery services for the turnaround of any type of vessel.
One of the strongest competitive advantage Westports has is its drive to push for productivity. With a crane productivity target set at 30-35 moves per hour (“mph”) and vessel productivity target set at 130-180 mph, Westports has positioned itself as among the leading ports in the world for container operations productivity.
About 7,693 container vessels and barges called at Westports in 2015 compared to 7,006 container vessels in 2014.
We handle 1.98 TEUs per meter container berth spanning 4.6 kilometres. Likewise, we handle 175 thousand TEUs per STS with 52 units. Our capacity utilisation stand at 83% in 2015. These statistics show an improvement of 8% to 9% compared to 2014 performance.
Container Throughput 2015 2014 %
Million TEUs
Transhipment 6.6 5.9 +12%
Gateway 2.5 2.5 -
Total TEUs 9.1 8.4 +8%
TEUs over Berth – units 1.98 1.82 +9%
TEUs over STS – ‘000 175 161 +9%
Capacity utilisation 83% 76%
This commendable container throughput was achieved through the use of key equipment mentioned below. It is paramount for us to ensure the equipment are in reliable condition to maintain our productivity.
Key Equipment 2015 2014
Numbers
Ship-to-Shore Cranes 52 52
Normal RTG 115 115
Variable Speed RTG 30 30
Hybrid RTG 12 12
Terminal Tractors 476 418
Stackers 27 27 To achieve the reliability target, we are strictly complying with the preventative maintenance schedule proposed by Original Equipment Manufacturer (“OEM”). On a systematic basis, we also review obsolescence of spare parts or components. Obsolete parts will be replaced with the latest version as we have to provide continuous support for the spare parts. The new components can increase the efficiency in terms of energy consumption which indirectly can also enhance the reliability of our cranes. We measure the effectiveness

034 W E S T P O R T S H O L D I N G S B E R H A D
M A N A G E M E N T D I S C U S S I O N A N D A N A L Y S I S
of crane maintenance by a term called Mean Moves Before Failure (“MMBF”). MMBF measures the number of moves a crane can handle before it fails. The higher the moves the better would be the reliability of the crane, signifying effective maintenance. We recorded an improvement on MMBF by 30% for STS cranes and 1% for RTG cranes in 2015 compared to 2014. We work closely with suppliers and contractors and measure their performance in accordance with the standards agreed upon. We have outsourced the maintenance of terminal tractors and stackers to the local contractors and monitor their performance in accordance with our requirements.
In 2015, we have purchased 104 units of terminal tractors (“TT”) as replacements and to cater the increase in STS that were purchased in 2014.
As reported in the 2014 annual report, we have purchased 30 units of VS RTG Crane and 12 units of Hybrid RTG (“H RTG”) Crane. VS RTG and H RTG cranes are more expensive than normal RTG cranes. We have committed ourselves for a sustainable approach to safeguard our environment. It is proven that these RTG cranes have successfully reduced our diesel consumption and Greenhouse Gas (“GHG”) emissions.
The VS RTG cranes has reduced diesel fuel consumption by controlling the engine speed and matching it with the required container load. Meanwhile, the H RTG cranes features smaller engines that is complemented with Lithium Ion battery power to reduce fuel consumption and lower emissions. The H RTG cranes recover and convert the kinetic energy into electric energy that is stored inside the batteries when hoisting down the container, making it the most energy efficient cranes.
Diesel Consumptions 2015 2014 %
Million Litres
Fuel 41.8 39.9 +5%
Litres/ TEUs 4.6 4.8 -4%
As a result of the above concerted effort, our fuel consumption has increased at lower pace than the throughput while unit usage has dropped by 4% compared to 2014.
Vessel Incident
We experienced a challenge in terms of container operations with an incident involving a vessel having physical contact with the base of STS 26 during her berthing process on 1 August 2015. This has led to our STS 26 to be unfit for operations and the management has decided to dismantle STS 26 and will sell as scrap.
Expansion Plan
We reported in the last annual report on our expansion plan to CT 8 with the first phase of 300-meter length of wharf, supporting port equipment and facilities with completion expected by early 2016.
As at the date of this annual report, we have commissioned two units of STS cranes and three units of VS RTG cranes into service and we have already started using these equipment in our operations. The first phase of 300-meter wharf is scheduled to be fully completed by mid-2016.
The second container gate, second marshalling centre and maintenance building are expected to be completed in the later part of 2016.
In 2016, we intend to continue the expansion plan of CT 8 activities as described below:
a) Second 300-meter wharf with completion expected by 2017;
b) Container yard for CT 8 with completion expected by 2017; and
c) To receive another four units of STS cranes, three units of VS RTG cranes by 2016 and to purchase associated TT’s and trailers.
CONVENTIONAL SERVICES
Conventional services comprise of dry bulk, break bulk, liquid bulk, cement cargo and RORO. In 2015, the volume of cargo handled totalled 10.2 million metric tonnes compared to 10.3 million metric tonnes in 2014, representing a drop by 1%.

035A N N U A L R E P O R T 2 0 1 5
M A N A G E M E N T D I S C U S S I O N A N D A N A L Y S I S
The break bulk segment primarily consists of mixed steel, steel coils and project or general cargo. Break bulk represents 16% of the total bulk cargo volume.
Conventional 2015 2014%
change
Million metric tonne
Dry Bulk 4.0 4.0 -
Liquid Bulk 3.6 3.8 -5%
Break Bulk 1.6 1.6 -
Cement 1.0 0.9 +11%
Total Cargo 10.2 10.3 -1%
RORO – thousand units 163 166 -2%
The dry bulk segment is divided into two categories. In 2015, the agriculture bulk such as feed cargo that includes unrefined sugar, feed grains and wheat recorded decline in volume by 4% due to the increasing use of containers for sugar shipments. The second segment consists of minerals such as fertilizers and building related cargo types used by the construction industry grew by 7% compared to 2014. In total, the dry bulk volume contributed 39% to the total conventional business. The cement volume also grew by 11% in 2015 due to import of cement to meet local demand in the construction industry.
Liquid bulk cargo is categorised into non-bunker and bunker. In 2015, the entire volume recorded in liquid bulk is from non-bunker segment with cargo made up of palm oil, petroleum, chemical and liquefied petroleum gas. Non-bunker segment grew by 6% in 2015. No volume was recorded in bunker segment in 2015 as new operator would commence operation only in 2016. The under performance on liquid bulk segment is due to bunker segment. The liquid bulk contributed 35% to the overall conventional volume.
Our handling of RORO vehicles decreased to 163 thousand units in 2015 due to weaker domestic demand. We are also Port Klang’s gateway for both import and export of vehicles, handling 79% of Port Klang’s total volume.
We handled conventional cargo from 1,669 conventional vessel arrivals in 2015, of which RORO vessels numbered 281.
The entire operations of dry bulk and break bulk in conventional segment are handled by local outsourced contractors. Their productivity is very important to us and it is measured by Fastport Standards (“FS”). This measures the efficiency of operations in every aspect of conventional activities covering from pilots and tugs, berths, stevedore gangs and equipment, cargo handling, customs clearance, until the cargo exits from the conventional gate. We strive to match or perform better than the FS which ultimately leads to customer satisfaction. In 2015, we recorded an improvement in the FS in every segment of conventional operations ranging between 2% to 6%.
To improve our performance further, we have undertaken some initiatives. First, we upgraded and implemented a new conventional cargo terminal operating system called e-CCS (“Enhanced Conventional Cargo System”) which will streamline and automate the processes from wharf and yard operations to billing as part of our continuous efforts to enhance conventional cargo operations. Second, we implemented berthing policy for dry bulk and RORO segment to improve berthing waiting time of vessels. Thirdly, simultaneous discharge from liquid bulk segment was implemented to minimise the vessel stay in port. Lastly, we also introduced contractor score card for better performance management of contractors and improve vessel productivity.
MARINE SERVICES
Marine services consist of tugboat and pilotage services. All vessels arriving or departing Westports terminals are required to use this service.
We operate a fleet of 8 harbour tugs and the last harbour tug was added in December 2015. In 2015, we handled 9,362 vessel movements in both container and conventional terminals that registered an increase in number by 706 vessels compared to 2014.
In 2015, we have performed maintenance dredging to deepen our wharf and previous round of maintenance dredging was carried out in 2013.

036 W E S T P O R T S H O L D I N G S B E R H A D
M A N A G E M E N T D I S C U S S I O N A N D A N A L Y S I S
LOGISTIC AND RENTAL SERVICES
Our container gate system and streamlined customs processes enable hauliers to enter and exit our terminals on an average of 20 minutes.
This is achieved partly due to our support for comprehensive data interchange which enables fast exchange of information between parties in the supply chain and the local authorities.
With the second container gate to be ready in 2016, 14-lane gates will be dedicated for outbound traffic and existing container gate will be converted to 14-lanes dedicated for inbound traffic. We expect the movement of gateway volume to be more efficient with the new gate system.
Container and Conventional customers continue to lease land, storage facilities and office space from us with demand exceeding supply. However, demand for common storage facilities has dropped due to cargo being moved via container resulted in less demand for common storage facilities. On-Dock Depots (“ODD”) demand remains high with major customers setting up these facilities on our premises to repair and clean containers.
For our landed container customers who lease warehousing facilities, we provide internal haulage services to facilitate the movement of containers to and from container yards or ODD to support container freight station services.
IT INITIATIVES
Technology is integral to our operational excellence. Our Command and Control Center is equipped with real-time dashboards to ensure efficient control and monitoring of the entire container handling cycle and deployment of resources to continuously maintain our high productivity efficiencies and standards. The robust mobile tablet system which replaced the traditional handheld radio data terminal system at the wharf, allow operations to be managed effectively in real-time at an accelerated pace.
The introduction of self-service kiosks at container gate is part of our automation initiative. This project was initiated to generate cost savings through greater operational agility and efficiency as well as enhancing workforce performance. The improvement in haulier turnaround time at the terminal led to an increase in gate throughput and capacity.
Our customer portal, e-Terminal Plus, continues to enjoy more than 95% customer utilisation rate for Delivery Order (“e-DO”), e-Billing, submission of loading and discharging list and haulage pre-arrival booking. Among our Go-Green initiative in 2015 was the Paperless Gate Pass project which has reduced logistics costs and also cut bureaucratic delays faced by our customers. Our Paperless Gate Pass service has reached an adoption rate of 75%.

037A N N U A L R E P O R T 2 0 1 5
To continuously pursue our customer experiences in enriching their interactions and improving processes, we have developed our own smartphone application “e-Terminal On the Go”, comprising of the most popular modules from our customer portal, e-Terminal Plus such as Container, Vessel, Booking, Bill of Lading and Gate Pass Inquiries. Now, real-time information is available to our customers instantaneously through their smartphones.
With the implementation of a new Electronic Data Interchange (“EDI”) platform, the management and administration of EDI messages is made simplified, secured, reliable, faster and more efficient, enabling us to maintain our real-time communication service levels with our customers.
Investment in latest technology has been central to Westports dynamic and innovative approach in striving to provide even better customer services and achieving greater operational efficiencies.

038 W E S T P O R T S H O L D I N G S B E R H A D
Financial Review
REVENUE
The Group recorded gross revenue of RM1.682 billion in 2015, an improvement of 8% compared to 2014. Growth in operational revenue by 5% to RM1.578 billion was mainly driven by increase of container throughput and ship calls.
Revenue2015
RM million2014
RM million% of
change
Container 1,316 1,251 +5%
Conventional 144 137 +5%
Marine 82 77 +6%
Rental 35 38 -8%
Dividend Income 1 - n/a
Operational Revenue 1,578 1,503 +5%
Construction revenue 104 59 +76%
Gross Revenue 1,682 1,562 +8%
The construction revenue grew by 76% to RM104 million arising from first phase of CT 8 infrastructure works. It is appropriate to exclude construction revenue for the purposes of measuring our performance.
Construction revenue in accordance with IC interpretation 12 equals the fair value of port-related infrastructure under construction based on the stage of completion of the work performed. The fair value of such infrastructure is deemed to be the cost of construction as well as any additional construction-related cost. As construction works are contracted out to third parties, construction revenue reported equals construction cost.
Container Revenue
Container revenue comprises of Terminal Handling Charges (“THC”) for gateway and transhipment containers and income generated from Value-Added Services activities (“VAS”). Container revenue contributed 83% of the operational revenue for both years. Container revenue grew by 5% to RM1.316 billion in 2015 while the container throughput has increased by 8% to 9.1 million TEUs. The lower growth in
container revenue in comparison to container throughput is due to higher increase in transhipment throughput. The THC revenue rose by 6% to RM1.142 billion over the previous year contributed mainly by increase in transhipment throughput of 12% while gateway remained flat.
VAS revenue increased by 2% to RM174 million in 2015 with growth mainly derived from reefer service activities.
Conventional Revenue
Conventional revenue is generated from handling non-containerised cargo consisting mainly of break bulk, dry bulk, cement, liquid bulk, roll-on-roll-off (“RORO”) cargo services and other sundry income. Conventional revenue accounted for 9% of operational revenue for both 2015 and 2014.
Conventional throughput declined by 1% to 10.2 million tonnes compared to the previous year. Despite the drop in throughput, conventional revenue recorded a growth of 5% to RM144 million for 2015. All the conventional cargo services registered higher revenue compared to the previous year.
Break bulk cargo throughput remained at 1.6 million tonnes in 2015 but revenue has increased by 8% due to volume mix and changes in metrics of charging as set by Port Klang Authority (“PKA”).
Dry bulk cargo throughput remained flat at to 4 million tonnes in 2015 and revenue increased marginally by 1% due to volume mix.
Cement cargo throughput was at 1.0 million tonnes in 2015, which was an improvement by 11% compared to the throughput recorded in 2014. Cement cargo revenue also grew by 12% in line with throughput growth.
RORO throughput reduced by 2% to 163 thousand units of vehicles in 2015 due to uncertainty arising from imposition of GST and weaker Ringgit. However RORO revenue grew by 6% due to changes in the metrics of charging port charges.
Liquid bulk cargo recorded a drop in throughput by 5% to 3.6 million tonnes in 2015 compared to the previous year. The reduction was due to nil bunker volume recorded in 2015 due to cessation of bunker operator and the new operator will commence operations in early 2016. However, the revenue improved by 1% in 2015 due to volume mix.
M A N A G E M E N T D I S C U S S I O N A N D A N A L Y S I S

039A N N U A L R E P O R T 2 0 1 5
Marine Revenue
Marine revenue is generated from fees earned from tug boat services and pilotage services. Marine revenue accounted for 5% of the operational revenue for 2015 and 2014.
The marine revenue recorded a growth of 6% to RM82 million in 2015. The increase in marine revenue was attributable to 8% increase in the number of vessels calling at Westports.
Rental Revenue
Rental revenue is generated from the rental of our facilities, including the sublease of landed clients, warehouses, open yard, on-dock depots and business centre. Rental revenue accounted for 2% of the operational revenue for 2015 compared to 3% in 2014.
The rental revenue recorded a drop of 8% to RM35 million in 2015 mainly due to drop in storage requirement by customers.
COST OF SALES
Gross cost of sales increased by 7% to RM800 million in 2015 with operational cost increased by 1% and construction cost increased by 76%. Increase in construction cost by 76% is explained in the revenue section. It is also appropriate to exclude construction cost for the purposes of measuring our performance.
Operational cost of sales are categorised as per table below.
Cost of Sales2015
RM million2014
RM million% of
change
Container 242 226 +7%
Manpower 169 164 +3%
Depreciation & amortisation 132 124 +6%
Fuel 70 94 -26%
Marine 31 31 -
Electricity 29 27 +7%
Conventional 23 22 +5%
Operational Cost of Sales 696 688 +1%
Construction Cost 104 59 +76%
Gross Cost of Sales 800 747 +7%
Container cost comprises of marketing expenses, maintenance and repair expenses; and outsourced expenses for container operations. The increase in container cost was mainly derived from higher marketing cost which is in tandem with increase in container throughput. The container cost is the biggest cost component of operational cost of sales accounting for 35% in 2015.
Manpower cost increased by 3% although the operational manpower head count reduced by 72 to 3,694 staff in 2015. The increase in cost was attributed to annual increments. Manpower cost remains the second biggest cost in 2015 with 24% of operational cost of sales, similar to the ratio in 2014.
Depreciation and amortisation cost increased by for 6% growth in 2015 mainly due to Container Terminal 7 (“CT7”) operating equipment which was capitalised progressively in 2014. The depreciation and amortisation cost comprise of depreciation charge of terminal operating equipment while amortisation was related to concession assets and dredging expenses. This segment of cost increased by 1% to 19% as a component of operational cost of sales in 2015.
Fuel cost reduced by 26% to RM70 million attributed to decrease in global fuel price and reduction in fuel consumption per TEUs, offset partially by depreciation of the ringgit. Fuel was consumed by the terminal operating equipment such as TT’s, RTG cranes, stackers, forklifts and tug boats. Fuel cost has reduced by 4% to 10% as a component of operational cost in 2015.
Marine cost has remained same at RM31 million in 2015. Marine cost comprised of hiring cost for tug boats and pilot boats, berthing, unberthing and mooring expenses.
Electricity cost increased by 7% to RM29 million in tandem with the increase in container throughput. Electricity was used by STS cranes, reefer containers and port operational facilities.
Conventional cost has increased by 5% to RM23 million in 2015. Conventional cost included charges for the provision of stevedoring services relating to break bulk operations, handling services and maintenance cost of dry bulk equipment.
M A N A G E M E N T D I S C U S S I O N A N D A N A L Y S I S

040 W E S T P O R T S H O L D I N G S B E R H A D
GROSS PROFIT
Gross profit (“GP”) improved by 8% to RM882 million arising from the growth in operational revenue by 5% and comparatively slower rate of increase in operational cost of sales by 1%. The GP margin has increased accordingly to 56% in 2015 from 54% recorded in 2014.
2015 2014 % ofResults RM million RM million change
Operational Revenue 1,578 1,503 +5%
Operational Cost of Sales (696) (688) +1%
Gross Profit 882 815 +8%
Other Income 6 10 -40%
Adminstrative expenses (28) (36) -22%
Other expenses (146) (146) -
Operating Profit 714 643 +11%
EBITDA 869 789 +10%
Gross profit margin 56% 54%
Operating profit margin 45% 43%
EBITDA margin 55% 52%
OTHER INCOME
Other income comprised of payments from conventional customers who were unable to meet their guaranteed conventional throughput commitments and sundry income.
Other income reduced by 40% to RM6 million, mainly due to one-off sundry income received from insurance claim for non-utilisation of berth in 2014.
ADMINISTRATIVE EXPENSES
Administrative expenses comprised of professional fees, travelling and entertainment expenses, provision for doubtful debts and general administrative expenses.
Administrative expenses reduced by 22% to RM28 million in 2015 mainly due to lower write-offs. In 2014 the Group has written-off two units of obsolete STS cranes and unutilised slag and fertilizer conveyor system in dry bulk operations as a result of change in modus operandi amounting to RM11.6
million. In 2015, the Group written-down concession asset amounting to RM6.2 million due to impairment of the concession assets.
OTHER EXPENSES
Other expenses consisted mainly of manpower costs relating to non-operational staff, IT related expenses, general repair and maintenance, lease expenses, staff-related costs, other depreciation cost, insurance, promotion and advertising as well as utilities cost.
Other expenses remained at RM146 million as reported in 2014. It was attributed to lower maintenance expenses which was offset by higher non-operational employee related cost.
OPERATING PROFIT
Operating profit has increased by 11% to RM714 million in 2015. The growth is higher than GP mainly due to slower pace of increase in administrative and other expenses. Consequently, the operating profit margin increased to 45% in 2015 from 43% in 2014.
EBITDA
Earnings before interest, tax, depreciation and amortisation (“EBITDA”) grew by 10% to RM869 million in 2015. EBITDA in comparison to operating profit registered lower growth mainly due to higher depreciation and amortisation costs. Accordingly, the EBITDA margin improved to 55% from 52% in 2014.
FINANCE INCOME
Finance income increased by 36% to RM15 million in 2015 due to increase in interest income from fixed deposit with higher rates.
FINANCE EXPENSES
Finance expenses comprised of profit payments pursuant to Sukuk Medium Term Note (“SMTN”) and concession liability charges pursuant to the Lease Agreement.
Finance expenses increased by 5% to RM79 million in 2015 primarily due to the full impact of the draw down of RM250 million from SMTN for financing the capital expenditure projects in April 2014.
M A N A G E M E N T D I S C U S S I O N A N D A N A L Y S I S

041A N N U A L R E P O R T 2 0 1 5
CASH FLOWS
Cash and cash equivalents less pledged deposits have decreased by 12% to RM365 million in 2015. Net cash generated from operating activities has increased by 26% of which 9% is attributable to operations while the remaining 17% was due to increase in payment to creditors mainly in relation to CT 7 capital expenditure. Investing activities in 2015 increased by 4% due to increase in capital expenditure for CT 8 and investment in securities. Net cash used in financing activities increased by 139%. In 2014, the Group has drawn down SMTN to finance the CT 7 capital expenditure. Excluding this draw down, the growth will be 9% mainly due to increase in dividend payment and interest expenses.
TOTAL ASSETS
The Group total assets increased by 5% to RM4.030 billion as at 31 December 2015 attributed by the increase in property, plant and equipment (“PPE”), concession assets, investment in securities, trade receivables and offsetted by lower cash and cash equivalents. Increase in PPE and concession assets were primarily due to progress payments for CT 8 terminal operating equipment and infrastructure works.
TOTAL LIABILITIES
Total liabilities increased by RM50 million to RM2.132 billion in 2015 and the increase was on trade and other payables, deferred tax and tax payables offsetted by reduction in services concession obligations.
SHAREHOLDERS’ EQUITY
Shareholders’ equity increased by RM134 million in 2015 due to PAT of RM505 million, recognition of fair value gain from investment in securities of RM20 million and offsetted by dividend payment of RM391 million. Return on Equity for 2015 is 27%, reduced by 2% compared to 29% recorded in 2014.
2015 2014 % ofCash Flows RM million RM million change
Operating profit before working capital changes 875 803 +9%
Net cash from operating activities 771 613 +26%
Net cash used in investing activities (322) (309) +4%
Net cash used in financing activities (498) (208) +139%
Net (decrease)/increase in cash and cash equivalents (49) 96 -151%
Opening cash and cash equivalents (less pledged deposits) 414 318 +30%
Closing cash and cash equivalents (less pledged deposits) 365 414 -12%
M A N A G E M E N T D I S C U S S I O N A N D A N A L Y S I S
2015 2014 % ofResults RM million RM million change
Operating profit 714 643 +11%
Finance income 15 11 +36%
Finance expenses (79) (75) +5%
Profit before tax 650 579 +12%
Taxation (145) (67) +116%
Profit after tax 505 512 -1%
PBT margin 41% 39%
PAT margin 32% 34%
Effective tax rate 22% 12%
* PBT and PAT margin computed from operational revenue
PROFIT BEFORE TAX (“PBT”)
PBT improved by 12% to RM650 million mainly attributed by increase in revenue and slow growth of expenses. The PBT margin has mproved to 41% from 39% in 2014.
PROFIT AFTER TAX (“PAT”)
PAT has decreased by 1% to RM505 million in 2015. Lower tax expenses in 2014 were due to tax incentive received for capitalisation of port infrastructure and terminal operating equipment.
In 2015, the CT 8 infrastructure works are in progress phase and yet to be completed towards end of the year, hence tax incentive not available. The tax expenses were lower than statutory rate due to reduction in corporate tax rate from 25% to 24% used in computation of deferred tax and over provision of tax expenses in 2014. Accordingly, the effective tax in 2015 is 22%. The PAT margin is 32% in 2015 in comparison with 34% in 2014.

042 W E S T P O R T S H O L D I N G S B E R H A D
M A N A G E M E N T D I S C U S S I O N A N D A N A L Y S I S
Summarised Group Statements of Financial Position
TOTAL ASSETS (RM MILLION )
2015 2014
Property, Plant and Equipment 1,370 1,322Concession Assets 1,921 1,877Trade and Other Receivables 240 203Investment in Securities 103 -Cash and Cash Equivalents 396 444
Total Assets 4,030 3,846
TOTAL EQUITY & LIABILITES (RM MILLION)
2015 2014
Share Capital 341 341Share Premium and Reserves 1,557 1,423
Total Equity 1,898 1,764
Borrowings 1,150 1,150Service Concession Obligation 399 426Deferred Tax & Tax Payables 327 278Trade and Other Payables 256 228
Total Liabilities 2,132 2,082
Total Equity & Liabilities 4,030 3,846
Property, Plant and Equipment
Concession Assets
Trade and Other Receivables
Investment in Securities
Cash and Cash Equivalents
Share Capital
Share Premium and Reserves
Borrowings
Service Concession Obligation
Deferred Tax & Tax Payables
Trade and Other Payables
2014
30%
37% 9%
6%
7%
11%
201548%
34%
10%
2%6%
2014
49%
34%
5%12%
2015
39%
29%
8%
6%
10%
8%

043A N N U A L R E P O R T 2 0 1 5
M A N A G E M E N T D I S C U S S I O N A N D A N A L Y S I S
2016 Economic Outlook
Malaysia’s Ministry of Finance is expecting the economy to sustain a positive growth trajectory whilst expanding at a more moderate pace of between 4% and 5% in 2016. Both business and consumer spending growth are expected to grow moderately with rising price pressure and depreciation of the ringgit against the US dollar. Within Asia-Pacific region, China’s economic growth is expected to be more moderate in 2016 after decades of sterling growth.
In this economic environment, Westports expects its container volume to grow at a slower pace in 2016 as compared to previous years’ growth rate. However, we expect revenue growth to be at a more favourable pace as the Company
would be able to register the full year’s revenue contribution from the revision in container tariff that was implemented with effect from 1 November 2015.
The Phase 1 of the CT 8 expansion is scheduled to be completed in 2016. Equipped with the state-of-art STS cranes and more energy-efficient container terminal handling equipment, Westports would be able to accommodate the growing trend of the container shipping industry in deploying larger vessels. This will enable Westports to continue being a prominent regional transhipment hub and accommodate the country’s growing trading requirements.

044 W E S T P O R T S H O L D I N G S B E R H A D
Investor Relations
Westports is committed in maintaining a strong relationship with our investors. We continuously engage with our investors and keep them updated with our operational and financial performance and prospects to enable them to make informed decisions about their investment in our Company. The engagement meetings with our investors are attended by the CEO, Chief Financial Officer, Head of Commercial, Head of Marketing or Head of Investor Relations.
QUARTERLY FINANCIAL RESULTS AND ANALYST COVERAGE
Upon releasing the quarterly financial results to Bursa Malaysia, Westports issues press releases and conducts briefings or conference calls with analysts and fund managers. The briefings or conference calls are to provide a balanced and updated perspective of our operational and financial performance, of our expansion plan, the Company’s prospects and outlook. It also serves as a platform for analysts and fund managers to seek clarification and have their queries responded to by the Company. To ensure consistent transparency of the external communication, the material intended for the briefings and conference calls are made available immediately on our website at www.westportsholdings.com and also sent by emails to those on our Investor Relations contact list after we have released the announcement to Bursa Malaysia. The number of local and regional analysts providing coverage for Westports has increased from 14 at the end of 2014 to 19 analysts currently.
MEETINGS, CONFERENCES AND ROADSHOWS
While Westports continues to attract interest from local and international investors, it also recognises the importance of maintaining regular contact and building rapport with local and international investors. To achieve these objectives, our investor relations initiatives include one-to-one meetings with investors, participation in major investment conferences and engaging investors in non-deals roadshows covering the major financial market centres in Singapore, Hong Kong, United Kingdom and United States of America. Westports
has participated in a total of 20 conferences and non-deals roadshows locally and internationally in 2015. We also have hosted a total of 65 meetings in our office, port tours and conference calls with analysts and investors to have a more informed and updated understanding of our business.
INCLUSION INTO INDICES
Westports has been included in the well-followed and widely-benchmarked MSCI Malaysia Index with effect from 29 May 2015. And on the local front, on 22 June 2015, Westports has also been included in the highly-regarded FTSE Bursa Malaysia KLCI index which comprises the largest 30 companies listed on the Main Board of Bursa Malaysia. These inclusions reflect international and local investors’ interest and confidence in the Company. Westports also indirectly became the designated representative Company in these indices for the transport and logistics sector in Malaysia.
AWARDS
In Alpha Southeast Asia’s 5th annual poll that was conducted between February 2015 and June 2015, where it tallied votes from 520 investors, pension funds, hedge funds, equity and fixed income brokers and buy-side and sell-side analysts with investment interests in the Southeast Asia region, Westports has scored favourably with global investors and we were voted to be among the best in Malaysia for the following categories:
• Strongest Adherence to Corporate Governance
• Most Consistent Dividend Policy
• Most Improved Investor Relations
DIVIDEND POLICY
It is the policy of our Board of Directors (“Board”) in recommending dividends to allow shareholders to participate in our profits while retaining adequate profits and reserves for our working capital requirements and capital expenditure to invest for future growth. The declaration of interim dividends and the recommendation of final dividends are subject to the discretion of our Board and any final dividend for the year is subjected to our shareholders’ approval. Our financial
M A N A G E M E N T D I S C U S S I O N A N D A N A L Y S I S

045A N N U A L R E P O R T 2 0 1 5
capacity to pay dividends or make other distributions to our shareholders will depend upon a number of factors, including:
• the level of our cash, gearing, return on equity and retained earnings;
• our expected financial performance;
• our projected levels of capital expenditure and other investment plans;
• our working capital requirements; and
• our existing and future debt obligations.
We propose to pay dividends out of cash generated from our operations after setting aside the necessary funding for capital expenditure and working capital requirements. As part of this policy, our Company targets a dividend payout ratio of not less than 75% of our consolidated profit attributable to our equity holders under MFRS and IFRS, beginning 1 January 2013.
You should note that this dividend policy merely describes our Company’s present intention and shall not constitute legally binding statements in respect of our Company’s future dividends that are subject to modification at our Board’s discretion.
DIVIDEND
For the financial year ended 31 December 2015, Westports has declared dividends amounting to RM378.51 million, as follows:
• 1st interim dividend of 5.32 sen per share amounting to RM181.412 million, paid on 26 August 2015; and
• 2nd interim dividend of 5.78 sen per share amounting to RM197.098 million, paid on 2 March 2016.
The total dividend declared to our shareholders represents 75% of profit after taxation for the financial year ended 2015. It represents a total payout of 11.10 sen per share.
SHAREHOLDER BASE
As at 31 December 2015, Westports had 5,410 shareholders comprising of institutional, private and retail shareholders holding a total of 3.41 billion shares. Foreign shareholdings interest in Westports was 34.43% as at 31 December 2015 and this included South Port Investment Holdings Limited’s shareholding of 23.55% in the Company.
CREDIT RATING
Westports continues to exhibit strong operational performance, financial fundamentals and balance sheet strength, enabling us to obtain a credit rating of AA+IS issued by Malaysia Rating Corporation Berhad since January 2008. The last review was done in May 2015.
M A N A G E M E N T D I S C U S S I O N A N D A N A L Y S I S

046 W E S T P O R T S H O L D I N G S B E R H A D
M A N A G E M E N T D I S C U S S I O N A N D A N A L Y S I S
STOCK TRADING PERFORMANCE
In 2015, Westports’ share price outperformed the benchmark FTSE Bursa Malaysia KLCI Index by achieving a share price appreciation of 23% for the year. The share price performance reflected increased investors’ confidence, interest and investments in Westports as the Company reported strong operational performance growth and operational profits throughout the year.
Investors’ interest and investment in Westports were also supported by the Revised Container Tariff Rates that were implemented on 1 November 2015. The new rates are being implemented in two phases. This would allow the Company to enhance its revenue base gradually in the coming years. Westports’ share price closed at RM4.12 for the year.

047A N N U A L R E P O R T 2 0 1 5
M A N A G E M E N T D I S C U S S I O N A N D A N A L Y S I S
WESTPORTS SHARE PRICE PERFORMANCE VS FBMKLCI INDEX
SHARE PRICE AND VOLUME TRADEDHIGHEST-LOWEST SHARE PRICE & MONTHLY TRADING VOLUME
4.50
4.00
3.50
3.00
2.50
2.00Jan 15 Feb 15 Mar 15 Apr 15 May 15 Jun 15 Jul 15 Aug 15 Sep 15 Oct 15 Nov 15 Dec 15
Share Price (RM) Number of Shares(million)
400
350
300
250
200
150
100
50
0
Volume Highest (RM) Lowest (RM)
1,9005.00
4.60
4.20
3.80
3.40
3.00
1,850
1,800
1,750
Jan
15
Jan
15
Jan
15
Feb
15
Feb
15
Mar
15
Mar
15
Apr
15
Apr
15
May
15
May
15
Jun
15
Jun
15
Jul 1
5
Jul 1
5
Jul 1
5
Aug
15
Aug
15
Sep
15
Sep
15
Oct
15
Oct
15
Nov
15
Nov
15
Dec
15
Dec
15
Share Price (RM) FBM KLCI Index
Westports share price FBM KLCI Index

048 W E S T P O R T S H O L D I N G S B E R H A D
Risk Profile
Risk is an inherent component of doing business. The objective of risk management is to provide a systematic means to identify, prioritise and manage risks. By embedding risk management in business processes, we would be able to manage risks arising from operating environment.
Our risk appetite and tolerance for risk dictate the nature and level of risks that are acceptable to us. We have a comprehensive risk register with review carried out on quarterly intervals. New risks identified are included and risks no longer applicable are excluded from the risk register. Based on our risk register, the key risks that could have high impact on our business are elaborated below along with our mitigation plans.
KEY RISK IMPACT MITIGATION
Macro Economy Global trade uncertainty is prevalent with slowing down of China economy and weak Eurozone economy. Significant portion of container throughput dependent on transhipment segment might be affected by slowdown in the international trade. Local economy is also showing signs of slowdown due to higher inflation as a result of GST implementation, weakening of Ringgit as well as political scenario.
Our performance in 2015 was not affected by the slowdown of the global economy. When there are signs of slowdown in container throughput, necessary steps would be taken such as controlling discretionary expenses, scrutinising costs, reviewing capital expenditures on need basis only, reviewing financial position at regular intervals and intensifying marketing initiatives on new market development.
Customer Concentration Significant portion of container revenue is derived from few shipping lines. This resulted from consolidation in the shipping industry after unsustainable expansion.
We ensure our productivity and customer satisfaction remain as our top priorities. We have close engagement with customers and get regular feedback on our performance. We strive to improve our service levels on areas of concern highlighted by our customers for mutual benefit. We are able to successfully overcome such issues based on our past experience.
M A N A G E M E N T D I S C U S S I O N A N D A N A L Y S I S

049A N N U A L R E P O R T 2 0 1 5
KEY RISK IMPACT MITIGATION
Customer Consolidation Two shipping lines from China has merged and other shipping lines within various alliances may explore the possibility of further realignment changes. Westports container throughput can be affected if new alliances or their members decide to re-allocate some of their transhipment volume elsewhere.
Westports has strengths in productivity, capacity, IT capability, lower port charges and customer relations. Shipping lines may consider all these factors when considering their choice of a new hub. As an ongoing process, we always look out for new customers to meet our container throughput target.
Currency fluctuation risk Depreciation of Ringgit against foreign currencies has caused an increase in our purchase price for certain items. Our capital expenditure on CT8 cranes are denominated in US Dollar. Fuel price has increased due to depreciation of Ringgit but offsetted by falling of global fuel price. Our revenue is denominated in Ringgit and hence not affected by currency fluctuations.
We did not hedge against our US Dollar as our exposure is only confined to purchase of cranes and fuel. The progress payments for cranes is covered for the period of two years and we believe Ringgit will strengten in the near future. With weak global fuel prices, we believe the fuel price per litre in Ringgit term would remain at current level. Westports may enjoy an increase in transhipment volume in view of the weaker Ringgit.
New port development Currently there are two port operators in Port Klang. The government is getting proposals to set up a new port. Westports container throughput volume might be affected by the new port.
Our port expansion for CT 8 is on-going and CT 9 will be implemented upon reaching our target capacity utilisation. We have provided our existing shipping lines with the capacity they require for their expansion. We believe our customers will continue to support us due to our proven capabilities.
M A N A G E M E N T D I S C U S S I O N A N D A N A L Y S I S

050 W E S T P O R T S H O L D I N G S B E R H A D
Our Strengths
We are well positioned to maintain as one of the largest and most efficient gateway port operator in Peninsular Malaysia and leading transhipment hub. We are able to achieve this dominant position due to our strengths and capabilities as described below:
a. Strategic location with strong connectivity with the ports around the world
We are located in Port Klang, approximately 12 nautical miles from Straits of Malacca shipping trade line with sailing time of approximately 1 hour to the pilot station. Straits of Malacca is the second busiest waterway in the world after the English Channel. More than 50,000 vessels sail through the Straits of Malacca annually. It serves as the shortest trading route between countries in African continent, European and Middle Eastern sub-continent, Indian sub-continent to Far East Countries such as China, South Korea, Japan, Taiwan and South East Asian countries.
Transhipment port
We are a transhipment hub serving two types of transhipment, namely Hub & Spoke and Relay.
• Hub & Spoke transhipment is a scenario whereby one port acts as a transhipment “Hub” with many smaller ports around it called as “Spoke” ports. Main line vessels call on the Hub port and load or discharge containers destined for or originated from the smaller ports (Spoke) located around this Hub port. The movement between Hub and Spoke ports are undertaken by feeder vessels.
• Relay transhipment port involves two main line vessel tranships at a port at which both vessels call. The container is discharged by first main line vessel at the port and the same container will be moved to the second main line vessel bound to the final destination.
The transhipment hub has made Westports well-connected with more than 350 ports around the world, providing customers with an efficient global and regional connectivity along major trade routes. We are able to provide such connectivity through approximately 84 main line services calling at our port which are complemented by approximately 71 feeder services.
In Port Klang, our market share represents 76% in 2015. Westports handled 6.6 million of TEUs accounting for 83% of transhipment volume in Port Klang recorded in 2015.
Gateway port
Port Klang is the hinterland gateway for import and export of cargo for Klang Valley covering Kuala Lumpur and Selangor; and Central part of Peninsular Malaysia covering Negeri Sembilan, Pahang and Perak. This hinterland is estimated to have a population of 10 million people based on July 2010 population statistics which represents 34% of the Malaysian population. Klang Valley is the heartland of Malaysia’s industry and commerce with industrial and commercial hubs located in Shah Alam, Petaling Jaya and PKFZ. Our strategic location has ensured stable growth of import and export cargo through Port Klang, providing an attractive base load of demand for shipping lines calling at Port Klang.
Numerous intermodal connections within Peninsular Malaysia and with neighbouring countries have also contributed to our position as a preferred gateway for import and export cargo. The extensive highway network runs North to South bordering with Thailand in North and Singapore in South has given good connectivity. This network along with the Western connectivity expressway plays an important role in the distribution of cargo between Port Klang and its hinterland. Westports has the capability to use the rail network to connect to Penang and Bangkok in the North and Singapore in the South as well as use of inland depots located in strategic locations along the rail network in Ipoh, Nilai, Padang Besar and Segamat Cargo Terminals.
M A N A G E M E N T D I S C U S S I O N A N D A N A L Y S I S

051A N N U A L R E P O R T 2 0 1 5
In 2015, Westports handled 2.5 million TEUs container gateway cargo which represents a market share of 63% of Port Klang gateway TEUs and the largest gateway container TEUs handled in Malaysia.
Westports handled conventional cargo of 10.2 million metric tonnes of bulk cargo which represents market share of 57% in Port Klang and 6% for Malaysia.
b. Geographic attributes with linear berth and surrounding amenities
The channel fronting our berths is a protected harbour naturally sheltered by an island that buffers our terminal from strong currents as well as against possible damage from potential tsunamis. This natural shelter eliminates the need to construct costly artificial breakwaters.
Westports is located at the southern approach of Port Klang which has a deeper channel of at least 17 metres compared to northern approach. Southern approach has shorter travel time compared to northern approach. The deeper channel and shorter distance have attracted many Main Line Operators (“MLO”) to call on Westports which further strengthened our transhipment hub position.
Container Terminal (“CT”) 6 and CT7 are our deepest berths with 17.5 meters capable of handling largest vessels in service.
We have a total of 27 berths with 7.2 km length of which 20 berths are continuously connected in 4.6 km straight line, providing a maximum usable quay length and flexibility in berthing vessels. Container yard measuring 150.8 hectares along our container berths provides ample space for efficient manoeuvring, storage and retrieval of containers which is integral to our operations.
Westports enjoys easy and convenient access to PKFZ, an integrated 405 hectares customs-free commercial and industrial zone next to the port where international cargo distribution and consolidation, procurement, export manufacturing and other cargo value added services are undertaken. PKFZ attracts investors through various investment incentives such as tax exemptions, subsidies, incentives for research and development, training and export.
There is also adequate land surrounding Westports that supports the operations of a well-established ecosystem of shippers, freight forwarders and third party logistics service providers and provides them space for future growth.
c. Expansion plan
Westports has a long term concession from the Government of Malaysia to operate the port until 2054. This provides us the assurance to make further long-term investments in port infrastructure and enhances customer’s confidence in our ability to support their operations and growth.
We have commenced expansion plan to CT 8 in 2015 in two phases with first phase of 300 meters of wharf and necessary handling equipment which is scheduled to be completed by early part of second quarter of 2016. The second phase of 300 meters of wharf and necessary handling equipment is expected to be completed by 2017. Upon receiving entire handling equipment, our handling capacity will increase to 13.5 million TEUs.
We will pursue the expansion plan to CT 9 upon achieving capacity utilisation ratio of above 75% on the capacity of 13.5 million TEUs. With CT 9 expansion, our capacity will potentially increase to 16 million TEUs and our yard container area will increase to 196.1 hectares. Our berth will also increase to 31 berths with 8.4 km length.
This expansion allows us to accommodate the growth in volume envisaged from existing customers and new customers coming on board.
d. Operational excellence
We have consistently grown our container throughput over the years. We have achieved high level of productivity for our STS crane operations and routinely exceed 30 to 35 moves per hour per crane for larger vessels. Our capabilities allow us to provide the full range of port services round the clock, with minimal cost, delay and damages. The operational excellence was attributed by various factors as described in next page.
M A N A G E M E N T D I S C U S S I O N A N D A N A L Y S I S

052 W E S T P O R T S H O L D I N G S B E R H A D
Leading infrastructure
We continuously invest in our infrastructure to improve work flow and productivity. We have the state-of-art STS cranes equipped with twin-lift spreader with up to 24-outreach, which enable us to handle larger size vessels.
Comprehensive IT infrastructure
Westports operates two operating systems, namely container terminal operating system for container segment and conventional cargo system for general cargos segment. In short, these systems plan and manage the activities across berth, vessel, yard, rail and gate to enable faster processing of containers and cargos (“terminals”), maximising berth utilisation, improving the utilisation of terminals handling equipment and efficient resource deployment.
The role of technology is vital to ensure smooth communication in coordinating the movement in numerous terminals. We have wireless vehicle data gadgets installed on the rubber tyre gantry cranes and terminal tractors, wireless hand held gadgets for rail and gate operations; and mobile tablets in wharf operations for ship-to-shore cranes. These devices are connected wireless to the terminal operating systems for terminals movement instructions and real-time update which is essential for high productivity, equipment efficiency and optimal resource utilisation. In addition, we have a comprehensive CCTV system for security surveillance as well as operational monitoring and management.
Westports also supports Electronic Data Interchange (“EDI”) which facilitates efficient communication with our customers and authorities. Through our one-stop customer portal, e-Terminal Plus together with the newly launched mobile e-Terminal On-the-Go, we are able to leverage latest technology for the benefit of our customers.
We use integrated ERP system for our back-office operations. Westports has embraced e-bidding and e-procurement to provide visibility and transparency in the procurement process. This has resulted in the reduction of cycle time and cost savings.
Efficient and customer-focused operational processes
Westports adopts integrated planning and proactively manages capacity growth and utilisation. This enables us to minimise operational bottlenecks and supply chain inefficiencies resulting in achievement of efficient operational processes. It allows us to offer our customers berthing on arrival, fast loading or unloading and short port stay time for vessels. We also have the flexibility and capacity to cater for special requests from our customers. On many occasions, we allocated additional handling resources to accelerate loading or unloading for vessels that were behind schedule, which in turn assisted the vessels concerned to meet their planned schedule at their next port of call.
Best-in-Class workforce
Westports has one of the best workforce in the industry with positive employee relations and strong employee loyalty. The average length of employment of our existing workforce is approximately seven (7) years, with approximately 17% of our employees having been with us for over 14 years. We have a stable workforce and almost all of our employees are local. We provide our employees with long-term career prospects within our Group and job rotation opportunities to develop multiple skills. Our productivity driven reward structure motivates our employees to reach our competitive productivity standards and continuously seek for improvements.
We believe in investing in training and development of our employees. In this regard, we provide our staff with continuous training programmes to equip them with best practices and stay ahead in industry trend. Annually, we send selected managers to Senior Management Development Programme organised by the Harvard Business School Alumni Club of Malaysia which demonstrates our commitment in staff development.
e. Long-term relationships with customers and other stakeholders
Our business approach and proactive conduct have created a long term relationship with our customers. Currently, we have more than 30 main shipping lines.
M A N A G E M E N T D I S C U S S I O N A N D A N A L Y S I S

053A N N U A L R E P O R T 2 0 1 5
We also offer shippers and logistics service providers fast gate clearance and streamlined processes with e-documentation, which result in shorter end-to-end cycle times for cargo movements.
We believe this allows them to optimise the utilisation of their vehicles and personnel, hence scheduling more trips in a single day.
We believe that our ability to offer ‘one-stop’ services through our electronic customer portal, e-Terminal Plus, high productivity, shorter turnaround times and consistent reliability to our customers helps to ensure customer satisfaction and loyalty. Our differentiated quality service offerings and competitive pricing relative to regional competitors have enabled us to attract and retain customers over the years.
Security and safety are a top priority at our port operations and extensive measures are undertaken to secure the port and cargo providing necessary protection for our customers, employees and port users.
We also have positive relationships with our stakeholders such as regulators, government agencies and communities. We have committed to protect the environment by having low energy consumption equipment, recycle oil process and disposal of scheduled waste at approved locations.
In Pulau Indah where we operate, as a responsible corporate citizen, we have carried out various programmes on poverty eradication, enhancing education and contribution to native community. We also provide safety and security services on a daily basis to Pulau Indah.
f. Experienced Management team
Westports Management team is led by Ruben Emir Gnanalingam, CEO, with the guidance and support of board of directors under the Chairmanship of Tan Sri Datuk G. Gnanalingam.
We have a highly experienced Management team that has served our Group for an average of 13 years. With a large pool of home grown talent, our Management team is well tuned to the domestic, regional, global dynamics and challenges of the industry. Our Management team has a proven track record in project management, infrastructure development and phased expansion. We have consistently been on target or ahead of schedule for all our expansion projects.
Representatives of our major shareholders on our Board bring an invaluable set of expertise and relationships to guide our long-term strategic growth. Hutchison Port Holdings Limited is a leading global port operator having established strong relationships with shipping lines globally and has deep commercial, technical and operational expertise in managing container terminals. This provides us the opportunity to enhance our network of shipping line customers and learn the best practices from their network of ports around the world.
As a testimony to our strength elaborated above, we have received numerous accolades and awards in the transport industry as disclosed in the achievements section of this annual report.
M A N A G E M E N T D I S C U S S I O N A N D A N A L Y S I S

Corporate Profile 056
Group Corporate Structure 057
Corporate Information 058
OUR COMPANY


Our Company was incorporated in Malaysia under the Companies Act, 1965 as a private company limited by shares on 27 April 1993. The Company is principally involved in investment holding and the provision of management services to our subsidiary, namely, Westports Malaysia Sdn. Bhd. (“WMSB”). We commenced our business on 1 August 1994 and converted from a private company limited by shares to a public company limited by shares on 26 April 2013.
WMSB was incorporated on 24 January 1990 under the Companies Act, 1965 as a private limited company under the name of Kelang Multi Terminal Sdn. Bhd. and its principal activity is port development and management of port operations. WMSB assumed its present name on 29 December 2006.
PROFILECORPORATE
056 W E S T P O R T S H O L D I N G S B E R H A D

GROUP CORPORATE STRUCTURE
100%
WESTPORTSHOLDINGS BERHAD
One (1)
Special Share
The Ministry of Finance Incorporated
Westports MalaysiaSdn. Bhd.
057A N N U A L R E P O R T 2 0 1 5

INFORMATIONCORPORATE
058 W E S T P O R T S H O L D I N G S B E R H A D
Board of Directors
Tan Sri Datuk Gnanalingam A/L Gunanath Lingam (Executive Chairman)
Tan Sri Dato’ Nik Ibrahim Kamil Bin Tan Sri Nik Ahmad Kamil (Independent Non-Executive Director)
Tan Sri Ismail Bin Adam (Independent Non-Executive Director)
Dato’ Abdul Rahim Bin Abu Bakar (Independent Non-Executive Director)
Dato’ Yusli Bin Mohamed Yusoff (Independent Non-Executive Director)
Ruben Emir Gnanalingam Bin Abdullah (Chief Executive Officer)
Ip Sing Chi (Non-Independent Non-Executive Director)
Chan Chu Wei (Non-Independent Non-Executive Director)
Jeyakumar Palakrishnar (Independent Non-Executive Director)
Kim, Young So (Independent Non-Executive Director)
Ruth Sin Ling Tsim(Non-Independent Non-Executive Director)
Raymond Pak Ying Law(Alternate Director to Ip Sing Chi and Ruth Sin Ling Tsim, bothNon-Independent Non-Executive Directors)
Audit and Risk Management Committee
Dato’ Yusli Bin Mohamed Yusoff (Chairman)
Tan Sri Dato’ Nik Ibrahim Kamil Bin Tan Sri Nik Ahmad Kamil (Member)
Dato’ Abdul Rahim Bin Abu Bakar (Member)
Nomination, Remuneration and Corporate Governance Committee
Tan Sri Dato’ Nik Ibrahim Kamil Bin Tan Sri Nik Ahmad Kamil (Chairman)
Dato’ Abdul Rahim Bin Abu Bakar (Member)
Dato’ Yusli Bin Mohamed Yusoff (Member)
Jeyakumar Palakrishnar (Member)

059A N N U A L R E P O R T 2 0 1 5
Company Secretaries
Tai Yit Chan (MAICSA 7009143)
Tan Ai Ning (MAICSA 7015852)
Registrar
Boardroom Corporate Services (KL) Sdn BhdLot 6.05, Level 6, KPMG Tower8, First Avenue, Bandar Utama47800 Petaling JayaSelangor Darul EhsanTel: +603 – 7720 1188Fax: +603 –7720 1111
Auditors
KPMGLevel 10, KPMG Tower8, First Avenue, Bandar Utama47800 Petaling JayaSelangor Darul EhsanTel: +603 – 7721 3388
Registered Office
Lot 6.05, Level 6, KPMG Tower8, First Avenue, Bandar Utama47800 Petaling JayaSelangor Darul EhsanTel: +603 – 7720 1188Fax: +603 – 7720 1111
Principal Bankers
Malayan Banking Berhad
AmInvestment Bank Berhad
Standard Chartered Bank Malaysia Berhad
Alliance Bank Berhad
CIMB Bank Berhad
OCBC Bank (Malaysia) Berhad
Stock Exchange
Main Market of Bursa Malaysia Securities BerhadCode: WPRTS 5246

Profile of Directors 062
Profile of Management Team 075
LEADERSHIP


DIRECTORSPROFILE OF
TAN SRI DATUK GNANALINGAM A/L GUNANATH LINGAMExecutive ChairmanMalaysian, Age 71 years
Tan Sri Datuk Gnanalingam was appointed as Director of the Company on 1 January 2009 and as Executive Chairman of WMSB, the wholly-owned subsidiary of the Company in 2000. Prior to that, he was the Managing Director of WMSB from 1995 to 1999.
Tan Sri Datuk Gnanalingam attended the Royal Military College from 1960 until 1964 before obtaining his Bachelor of Arts degree from University of Malaya in 1968. He has also attended the Advanced Management Programme at Harvard Business School in Boston, US in 1991.
Tan Sri Datuk Gnanalingam started his career with the British American Tobacco group in 1968 as a sales representative with the marketing division before being promoted as Marketing Director in 1980. In 1988, he started his own marketing company called G-Team Consultants Sdn Bhd which acted as the Corporate Consultant for the marketing operations of Radio Television Malaysia from 1988 to 2000. He successfully secured the concession to operate Westports in 1994.
He was recognised for his efforts when he was named Transport Man of the Year in 2001 by the Ministry of Transport, Malaysia. In 2007, he received the Small and Medium Enterprise (SME) Platinum Award, the Chartered Institute of Logistics and Transport (“CILT”) Malaysia Achiever of the Year Award and was admitted as a Chartered Fellow by the CILT, UK. He was also presented with the Outstanding American Alumnus Award 2007 in the field of Logistics and Transport by the American Universities Alumni Malaysia for outstanding entrepreneurial skills and leadership excellence.
He sat on the National PEMUDAH committee, which is a special task force set-up by the then Prime Minister of Malaysia to facilitate businesses in Malaysia by identifying improvements to existing government processes and regulations based on global benchmarking reports and public feedback, from 2007 until 2012. He was re-appointed to the National PEMUDAH committee in 2014. In March 2015, he was appointed a member of the National Export Council.
Tan Sri Datuk Gnanalingam is the Non-Executive Director and shareholder of Pembinaan Redzai Sdn Bhd (“PRSB”), a substantial shareholder of the Company involved in management services including port management. He, however, does not handle the day-to-day operations in PRSB. His interest held in PRSB does not affect his contribution to the Company.
His eldest son, Ruben Emir Gnanalingam, is the Chief Executive Officer of the Company.
062 W E S T P O R T S H O L D I N G S B E R H A D

063A N N U A L R E P O R T 2 0 1 5

064 W E S T P O R T S H O L D I N G S B E R H A D
P R O F I L E O F D I R E C T O R S
TAN SRI DATO’ NIK IBRAHIM KAMIL BIN TAN SRI NIK AHMAD KAMILIndependent Non-Executive DirectorMalaysian, Age 73 years
Tan Sri Dato’ Nik Ibrahim Kamil was appointed to the Board on 7 September 1994. He obtained a Bachelor of Science degree in Economics and Business Administration from Georgetown University, Washington D.C., US in 1966. He has more than 48 years of managerial and business experience in various industries ranging from mining, petroleum, media, manufacturing, merchant banking and finance, stock broking, port management, trading to golf resort development.
He started his career in 1966 as an Assistant Company Secretary with Associated Mines Sdn Bhd which is principally involved in tin mining. Subsequently he joined Shell Malaysia Ltd in 1967 as the Head of Market Development for West Malaysia, East Malaysia and Brunei. In 1971, he joined The New Straits Times Press (Malaysia) Berhad (“NSTP”) as an Assistant General Manager and was with the company until 1991 where his last position held was as the Managing Director of the NSTP group.
Since then, he has been appointed to the board of many public and private companies. He was the Executive Vice Chairman of Palm Resort Berhad, a Director of Camerlin Group Berhad (now known as Adjuvant Resources Berhad), Chairman of Southern Investment Bank Berhad, Chairman of QSR Brands Berhad and Chairman of KFC Holdings (Malaysia) Berhad. He is currently the Non-Executive Chairman of OCB Berhad and Non-Executive Chairman of LionGold Corp Ltd, a company listed on the catalyst board of the Singapore Stock Exchange. He also sits on the board of several other private limited companies.
Tan Sri Dato’ Nik Ibrahim Kamil currently serves as the Chairman of the Nomination, Remuneration and Corporate Governance Committee and a member of the Audit and Risk Management Committee of the Company. He has no family relationship with any director or major shareholder of the Company nor has any conflict of interest with the Company.

065A N N U A L R E P O R T 2 0 1 5
P R O F I L E O F D I R E C T O R S
TAN SRI ISMAIL BIN ADAMIndependent Non-Executive DirectorMalaysian, Age 65 years
Tan Sri Ismail Bin Adam was appointed as Independent Non-Executive Director of the Company on 30 August 2013. Tan Sri Ismail obtained a Bachelor of Arts (Economics) degree from University of Malaya in 1972, a Diploma in Public Administration from University of Malaya in 1975 and a Master of Arts (Economics) from Vanderbilt University, US in 1979. He has attended the Advanced Management Programme at Harvard Business School in Boston, US in 2002.
He started his career in 1972 as an Officer of the Malaysian Administrative and Diplomatic Service and was posted as an Assistant Director in the Ministry of Trade and Industry. Throughout his career with the civil service, he has held senior positions including Chief Administrative Officer in the Department of Statistics Malaysia, Director General of the National Productivity Corporation (now known as the Malaysia Productivity Corporation), the Secretary General of the Ministry of Health and the Director General of Public Service. He retired from civil service in 2010.
Currently, he serves as an Independent Non-Executive Director of BIMB Holdings Berhad, as Group Chairman of Prasarana Malaysia Berhad and as an Independent Non-Executive Director of Malaysian Pharmaceutical Industries Sdn Bhd.
Tan Sri Ismail has no family relationship with any director or major shareholder of the Company nor has any conflict of interest with the Company.

066 W E S T P O R T S H O L D I N G S B E R H A D
P R O F I L E O F D I R E C T O R S
DATO’ ABDUL RAHIM BIN ABU BAKARIndependent Non-Executive DirectorMalaysian, Age 70 years
Dato’ Abdul Rahim Bin Abu Bakar was appointed to the Board on 1 April 2003. Dato’ Abdul Rahim obtained a Bachelor of Science (Honours) degree in Electrical Engineering from Brighton College of Technology, UK in 1969. He is a Professional Engineer registered with the Board of Engineers Malaysia, a member of the Institute of Engineers Malaysia and holds the Electrical Engineer Certificate of Competency Grade 1.
He started his career with National Electricity Board (“NEB”) of the States of Malaya in 1969 and served the organisation until 1979, holding various technical and engineering positions. His last position in NEB was as a Senior District Manager.
From 1979, he was with Pernas Charter Management Sdn Bhd, a management company for the tin mining industry as an Area Electrical Engineer and subsequently in late 1983, he was appointed to the post of Chief Electrical Engineer.
In 1984, he moved to Malaysia Mining Corporation Berhad (“MMC”) as the General Manager of business development until 1991. In November 1991, he was appointed as the Managing Director of MMC Engineering Services Sdn Bhd and later as Managing Director of MMC Engineering Group Bhd. In May 1995, he joined PETRONAS Gas Berhad (“PGB”) to assume the position of Managing Director and Chief Executive Officer, until August 1999. In September 1999, he moved on to take up the post of Vice President of Petroliam Nasional Berhad (“PETRONAS”), in charge of the petrochemical business. He retired from PETRONAS on 31 August 2002 and subsequently resigned from all board positions within the PETRONAS group.
Since then, he has been appointed to the board of several private and public companies. He is currently the Independent Non-Executive Director of Telekom Malaysia Berhad and Global Maritime Ventures Berhad. He is a member of the Nomination, Remuneration and Corporate Governance Committee and the Audit and Risk Management Committee of the Company. He has no family relationship with any director or major shareholder of the Company nor has any conflict of interest with the Company.

067A N N U A L R E P O R T 2 0 1 5
P R O F I L E O F D I R E C T O R S
DATO’ YUSLI BIN MOHAMED YUSOFFIndependent Non-Executive DirectorMalaysian, Age 57 years
Dato’ Yusli Bin Mohamed Yusoff was appointed to the Board on 13 March 2013. Dato’ Yusli graduated with a Bachelor of Economics degree from University of Essex, UK in 1981 and is a member of the Institute of Chartered Accountants in England and Wales, the Malaysian Institute of Accountants and is also an honorary member of the Institute of Internal Auditors Malaysia.
He began his career with Peat, Marwick, Mitchell & Co in London, UK in late 1981 and subsequently joined Hugin Sweda PLC, London in 1986 before returning to Malaysia in 1990. He then held various key positions in a number of public listed and private companies in Malaysia including senior financial and general management roles within Renong group before leaving as Chief Operating Officer/Executive Director of Renong Berhad in 1995. He was the Group Managing Director of Shapadu Corporation Sdn Bhd from 1995 to 1996 and the Chief General Manager of Sime Merchant Bankers Berhad from 1996 to 1998. He served concurrently as the Executive Vice Chairman of Intria Berhad and Managing Director of Metacorp Berhad from 1998 to 1999. He then ventured into stockbroking as the Chief Executive Director of CIMB Securities Sdn Bhd from 2000 to 2004 and served as Chairman of the Association of Stockbroking Companies Malaysia in 2003.
Dato’ Yusli also served as Chief Executive Officer/Executive Director of Bursa Malaysia Berhad from 2004 to 2011 and led Bursa Malaysia Berhad to its listing in 2005. He also served as a Director of the Capital Market Development Fund and was a member of the executive committee of the Financial Reporting Foundation of Malaysia from 2004 to 2011.
Currently, Dato’ Yusli serves as Director on the boards of YTL Power International Berhad, Mudajaya Group Berhad, Mulpha International Berhad and AirAsia X Berhad. He also sits on the boards of Australaysia Resources & Minerals Berhad and Malaysian Institute of Corporate Governance. He complies with Paragraph 15.06 of the MMLR and does not exceed the number of directorships held in listed issuers.
Dato’ Yusli currently serves as the Chairman of the Audit and Risk Management Committee and also acts as a member of the Nomination, Remuneration and Corporate Governance Committee of the Company. He has no family relationship with any director or major shareholder of the Company nor has any conflict of interest with the Company.

068 W E S T P O R T S H O L D I N G S B E R H A D
P R O F I L E O F D I R E C T O R S
RUBEN EMIR GNANALINGAM BIN ABDULLAHChief Executive OfficerMalaysian, Age 39 years
Ruben Emir Gnanalingam Bin Abdullah was appointed as Director of the Company on 5 July 2005. He attended Eton College in UK from 1994 until 1995 and graduated with a Bachelor of Science (Honours) degree in Economics from the London School of Economics and Political Science, UK in 1998. He also holds a diploma in Port Management awarded by the University of Cambridge Local Examinations Syndicate obtained in 2001 and has attended the Leadership Development Programme from 2006 to 2007 at the Harvard Business School in Boston, US.
He started his career as a trainee at the operational level in WMSB in 1999 before resigning to set up a venture capitalist business known as The Makmal Group in 2000. He sold his investments and exited this business in mid-2005.
Ruben Emir Gnanalingam was appointed to the Board in July 2005 and was designated as Executive Director in early 2006 before being appointed Chief Executive Officer on 15 January 2009. His main responsibilities include business development, technology enhancement, process engineering and management of procurement.
He is the eldest son of our Executive Chairman.
He is the Non-Executive Director and shareholder of PRSB, which is a substantial shareholder of the Company involved in management services including port management. He, however, does not handle the day-to-day operations in PRSB and his interest held in PRSB does not affect his contribution to the Company.

069A N N U A L R E P O R T 2 0 1 5
P R O F I L E O F D I R E C T O R S
IP SING CHINon-Independent Non-Executive DirectorChinese, Age 62 years
Ip Sing Chi was appointed as Non-Independent Non-Executive Director on 5 April 2013. He graduated with a Bachelor of Arts degree from Coventry University, UK in 1979. He began his career in the maritime business when he joined Sun Hing Shipping Co., Ltd. in 1979 as an account executive. Subsequently, he joined Hongkong International Terminals Limited in 1993 as General Manager of commercial and acted as the Managing Director from 1998 to 2011. In 2005, he was appointed to the board of Hutchison Port Holdings Limited (“HPH”), and is currently the Group Managing Director of HPH.
He has been an Executive Director of Hutchison Port Holdings Management Pte. Limited, the Trustee-Manager of Hutchison Port Holdings Trust (a business trust listed in Singapore), since February 2011. He is currently the chairman of Yantian International Container Terminals Limited, an outside Director of Hyundai Merchant Marine Co., Ltd. (a company listed on the Korea Exchange) and an Independent Non-Executive Director of COSCO Pacific Limited and China Shipping Development Company Limited (both are listed on the Stock Exchange of Hong Kong Limited).
Ip Sing Chi has over 35 years of experience in the maritime industry. He was a member of the Hong Kong Port Development Council until the end of December 2014 and the founding Chairman (in 2000-2001) of the Hong Kong Container Terminal Operators Association Limited.
HPH, through South Port Investment Holdings Limited, is a major shareholder of the Company. He, however, is not involved in the management and day-to-day operations of the Company.

070 W E S T P O R T S H O L D I N G S B E R H A D
P R O F I L E O F D I R E C T O R S
CHAN CHU WEINon-Independent Non-Executive DirectorMalaysian, Age 62 years
Chan Chu Wei was first appointed to the Board on 15 December 2000. Ms. Chan obtained a Bachelor of Social Science degree from University Sains Malaysia in 1977 and has attended the International Senior Managers Programme by Harvard Business School in Boston, US in 1993, as well as the Advance Management Programme by Templeton College in Oxford, UK in 1997. She began her career with Tourist Development Corporation of Malaysia as Assistant Director in 1977 and moved on to join Malaysian Tobacco Company Berhad a year later, where she worked in the human resources and marketing divisions over a ten (10) year period.
In 1988, she joined G-Team Consultants Sdn Bhd as a General Manager. G-Team Consultants Sdn Bhd acted as the Corporate Consultant for the marketing operations of Radio Television Malaysia from 1988 to 2000. Ms. Chan joined WMSB in 1994 as an Executive Director and assisted in drawing up the blueprint proposal that secured the concession for Westports. She oversaw both marketing and operational leadership roles until 2008, especially in container operations. She has been a Non-Executive Director of PKT Logistic Group Sdn Bhd since 2014.
Ms. Chan was re-designated as a Non-Independent Non-Executive Director in 2008. She is a Non-Executive Director of PRSB, which is a substantial shareholder of the Company involved in management services including port management. She, however, does not handle the day-to-day operations in PRSB nor the Company.

071A N N U A L R E P O R T 2 0 1 5
P R O F I L E O F D I R E C T O R S
JEYAKUMAR PALAKRISHNARIndependent Non-Executive DirectorMalaysian, Age 47 years
Jeyakumar Palakrishnar was appointed as Independent Non-Executive Director of the Company on 13 March 2013. He obtained a Bachelor of Law (Honours) degree from University of London, UK in 1993 and was called to the Malaysian Bar in 1995 and has since been practising as an advocate and solicitor. He is the founding partner of the legal firm, Messrs Zahir Jeya & Zainal, established in 1996. He also serves as a panel member of the Disciplinary Committee appointed by the Malaysian Bar Advocates & Solicitors’ Disciplinary Board.
Mr. Jeyakumar is a member of the Nomination, Remuneration and Corporate Governance Committee of the Company. He has no family relationship with any director or major shareholder of the Company nor has any conflict of interest with the Company.

072 W E S T P O R T S H O L D I N G S B E R H A D
P R O F I L E O F D I R E C T O R S
KIM, YOUNG SOIndependent Non-Executive DirectorSouth Korean, Age 53 years
Kim, Young So was appointed as Independent Non-Executive Director of the Company on 5 September 2013. He graduated with a Bachelor of Arts degree in Business Administration from Korea University, South Korea in 1985 and subsequently obtained his Master in Business Administration from George Washington University, US in 1988. He also attended executive courses at The Wharton School of the University of Pennsylvania, US.
Mr. Kim began his career with Banque Paribas as a Manager of the corporate banking division in 1989. He joined Dow Chemical Korea Ltd in 1992 as a Credit Manager and was subsequently promoted to a Treasurer in 1994. In 1996, he joined Hanjin Shipping Co., Ltd. as a General Manager and was subsequently promoted to a Managing Director for South East and West Asia. In 2009, he started an investment advisory business known as Braintrust Partner Co., Ltd. and has been the Executive Managing Director since then.
He is also a member of the Investment Committee of RRJ Capital group.
Mr. Kim has no family relationship with any director or major shareholder of the Company nor has any conflict of interest with the Company.

073A N N U A L R E P O R T 2 0 1 5
P R O F I L E O F D I R E C T O R S
RUTH SIN LING TSIMNon-Independent Non-Executive DirectorCanadian, Age 59 years
Ruth Sin Ling Tsim was appointed as Non-Independent Non-Executive Director of the Company on 16 November 2015. She is a qualified accountant and holds a Master of Business Administration degree from the Chinese University of Hong Kong. She is an Associate Member of The Institute of Chartered Accountants in England and Wales, a Fellow Member of the Chartered Association of Certified Accountants and the Hong Kong Institute of Certified Public Accountants, and a Member of the Certified General Accountants Association of Canada.
Ms. Ruth has been with both public accounting firm and several different industries in the commercial sector with roles in financial controllership. She joined the HPH Group in 2001 and has extensive background in internal auditing and controls, financial analysis and reporting. She is currently the Group Chief Financial Officer of HPH.
HPH, through South Port Investment Holdings Limited, is a major shareholder of the Company. She, however, is not involved in the management and day-to-day operations of the Company.

074 W E S T P O R T S H O L D I N G S B E R H A D
P R O F I L E O F D I R E C T O R S
RAYMOND PAK YING LAW Alternate Director to Ip Sing Chi and Ruth Sin Ling Tsim, both Non-Independent Non-Executive DirectorsBritish, Age 59 years
Raymond Pak Ying Law was appointed as Alternate Director to Ip Sing Chi and Ruth Sin Ling Tsim on 16 November 2015. He received his education in Hong Kong and England. After graduating with a Bachelor of Science Degree in Economics, he worked for KPMG in Hong Kong and New York and held directorships in a number of international companies (publicly-listed and private). He is a Chartered Accountant and a Fellow member of the Institute of Chartered Accountants in England and Wales and the Hong Kong Institute of Certified Public Accountants.
Mr. Raymond is currently an Executive Director of HPH and Managing Director of Korea and Malaysia of HPH portfolio. He is also a Director of Westports Malaysia Sdn. Bhd., a subsidiary of Westports Holdings Berhad. He has held various senior positions at the HPH Group since joining in 1995, including Head of Finance, Head of Business Development, Managing Director of Korea, Middle East and Africa, Group Director - Port and Strategic Investments, Group Economic Director and Managing Director of Australasia and North Asia.
HPH, through South Port Investment Holdings Limited, is a major shareholder of the Company. He, however, is not involved in the management and day-to-day operations of the Company.
Note: None of the Directors have any convictions for offences within the past 10 years.

075A N N U A L R E P O R T 2 0 1 5
MANAGEMENT TEAM
PROFILE OF
LIM BENG KEEM Lim Beng Keem is our Chief Financial Officer (“CFO”). He obtained a Management Accountancy degree from Chartered Institute of Management Accountants in 1981. He has been a Fellow member of Chartered Institute of Management Accountants since 1995 and a member of Malaysian Institute of Accountants since 1988. He also attended the Senior Management Development Programme (“SMDP”) organised by the Harvard Business School Alumni Club of Malaysia in collaboration with senior faculty members of the Harvard Business School, Boston, US in 2000.
He started his career as an accountant in Paper Products (M) Bhd in 1981 and later joined Sincere Leasing Sdn Bhd in 1983. He subsequently joined Dimet (Malaysia) Sdn Bhd as the Commercial Manager in 1987 followed by Innpower Electronics Sdn Bhd in 1989 as the Group Accountant.
He joined our Group in 1996 as General Manager – Finance, before opting for early retirement in 2009 after 13 years with the Company. He was involved in the Company’s financial related matters. In November 2010, he took an overseas assignment with Hutchinson Ports Holding Limited as Chief Financial Officer until April 2013.
He re-joined our Group in November 2013 as Head of Internal Audit where he was responsible for overseeing our Company’s internal audit function before being moved to re-join the Finance Department as Acting CFO, in June 2014. He was promoted to CFO on 1 December 2015.
He has 32 years of experience in the field of accounting and finance.
RUBEN EMIR GNANALINGAM BIN ABDULLAHChief Executive Officer(As expressed in page 68 of the Directors’ Profile.)

076 W E S T P O R T S H O L D I N G S B E R H A D
P R O F I L E O F M A N A G E M E N T T E A M
YEE WING PANG Yee Wing Pang is our Chief Engineer and was appointed on 15 July 2013. He is responsible for port infrastructure and facilities maintenance and port expansion projects. He also attended the SMDP organised by the Harvard Business School Alumni Club of Malaysia in collaboration with senior faculty members of the Harvard Business School, Boston, US in 2014.
He obtained a Bachelor of Engineering (Electrical) degree from University of Malaya in 1986. He is registered as a Professional Engineer with the Board of Engineers, Malaysia and has been a Corporate Member of the Institution of Engineers, Malaysia since 1995.
Prior to joining our Group, he worked with JT International Tobacco Sdn Bhd from 1998 in various management positions involving electrical and electronic maintenance, building and facilities maintenance, tobacco processing operations as well as Environment, Health and Safety management.
Before 1998, he was attached with various engineering consultants and contractors and involved with electrical engineering design, installation, commissioning and project management of transmission substation, power generation plant and factory power distribution projects.
He has more than 22 years of experience in the engineering field.
LEE MUN TAT Lee Mun Tat is our Head of Commercial. He obtained a Bachelor of Business with a major in Accounting degree from Edith Cowan University, Australia in 1994 and has been a member of the CPA Australia since 19 November 1998 and the Malaysian Institute of Accountants since 24 July 1999.
He was attached to Matsushita Electronics Components (M) Sdn Bhd from 1995 to 1996 as an accounts executive, followed by Jutajaya Holdings Berhad where he joined as a senior accounts executive in 1997 and left as a finance manager in 2001.
Subsequently, he joined All Best Furniture (M) Sdn Bhd from 2001 to 2003 as the group’s finance manager. He joined our Group in May 2003 as finance manager and assumed his present position in July 2007.
As the Head of Commercial, he is currently responsible for all commercial matters including business negotiations, tariff hike, terminal service contracts, statistics and credit control. He took on additional role of investor relations when the Company went public in 2013.
He also attended the SMDP organised by the Harvard Business School Alumni Club of Malaysia in collaboration with senior faculty members of the Harvard Business School, Boston, US in 2004 and has been accepted by the Harvard Business School, Boston to attend the General Management Programme (GMP).
He has more than 9 years of experience in commercial affairs.
AHMAD DAMANHURY BIN IBRAHIM Ahmad Damanhury Bin Ibrahim is our Head of Port Projects. Ahmad Damanhury joined Westports in July 1995 as a civil engineer and assumed his present position in July 2007. He is currently responsible for port expansion projects and technical feasibility studies.
He has more than 20 years’ experience in civil and marine engineering works. His notable accomplishments in Westports include the introduction of container yards pavement sub-structures alternative design and corner slabs stacking yard which are cheaper, faster to construct and easy to maintain. Prior to joining our Group, he worked with a project management company involved in the planning and construction of the PLUS and Metramac Highways projects. Thereafter, he was attached to a consultancy firm from 1992 to 1995 as a design and project engineer involved in the Subang Airport Redevelopment project and the KLIA project.
He has a degree in Civil Engineering from Syracuse University, New York, US in 1990 and obtained a Diploma in Port Management from University of Cambridge Local Examinations Syndicate in 2001. He also has a Master of Science in Management obtained in 2006 from University of Technology MARA.

077A N N U A L R E P O R T 2 0 1 5
P R O F I L E O F M A N A G E M E N T T E A M
He attended the Harvard Business School’s SMDP in 1998. He is a member of the Institution of Engineers and the Board of Engineers, Malaysia, a member of Project Management Institute (PMI, USA) and an Associate Member of the Harvard Business School Alumni Club of Malaysia.
VIJAYA KUMAR PUSPOWANAMVijaya Kumar Puspowanam is our Head of Marketing. He joined Westports in January 2000 as Gate Operations Executive and has since served under various departments such as gate, vessel operations and terminal planning prior to assuming his present position in January 2008.
He is currently responsible for marketing activities to meet the volume projections for both Container and Conventional business, regional efforts to grow more feeder services and volume from target regional markets, inducing new logistics business to strengthen the volume base for the terminal and also customer services initiatives to increase our competitive advantage against competitors.
He has 15 years of experience and in-depth terminal operations knowledge. Having served under a few Port Klang Authority and the Ministry of Transport Task Forces, he is also well versed in the overall logistics industry matters.
He obtained a degree in Business Administration (International Business) from University Kebangsaan Malaysia in 1999 and attended the Harvard Business School’s SMDP in 2004. He presently represents the Company in the Port Consultative Committee (PCC) under the purview of Port Klang Authority and also a member of the Logistics and Infrastructure Council, Malaysian International Chamber of Commerce & Industry, Malaysia.
LEE HOOI HUANG Lee Hooi Huang is our Head of Information Technology (“IT”). She joined Westports on 1 January 1997 as a System Manager and assumed her present position in 2005. She is currently responsible for overseeing IT projects and development.
She has more than 27 years’ of experience in application development and project implementation. Prior to joining our Group, she was with G Team Consultants from 1989 to 31 December 1996 as a systems analyst. Throughout her career, she was responsible for the enterprise wide project implementation of Cosmos Container Terminal Operating System, SAP ERP and e-Terminal Plus as well as IT Infrastructure outsourcing initiatives at Westports.
She obtained a degree in Bachelor of Applied Science in Computer Studies from South Australian Institute of Technology in 1988.
JOANNE SEE YOKE ENGJoanne See Yoke Eng is our Head of Human Resources. She joined Westports in April 2001 as an Executive Trainee, right after graduating in March 2001.
Joanne is responsible for the effectiveness of human resources function and ensuring strategies on human capital development are in line with the Company’s goals, both long term and short term. With her direct involvement, Westports successfully secured 4 Best Employer Awards from the Human Resources Ministry and Pembangunan Sumber Manusia as well as Gold Award from SOBA, The Star. More recent awards are the “Best Companies to Work for in Asia 2014” in August 2014 and Best Employer Award 2014 from the Employees Provident Fund in September 2014.
Joanne obtained her degree in Human Resources from Universiti Utara Malaysia and attended the Harvard Business School’s SMDP in 2008. She is a member of the Harvard Business School Alumni Club of Malaysia.
She has 15 years of experience in various aspects of human resources.

078 W E S T P O R T S H O L D I N G S B E R H A D
P R O F I L E O F M A N A G E M E N T T E A M
NANTHAKUMAR A/L MUROKANA @ MURUGANNanthakumar a/l Murokana @ Murugan is our Head of Container Operations. He obtained a Bachelor of Business Administration degree from Western Michigan University, US in 1998. He also attended the SMDP organised by the Harvard Business School Alumni Club of Malaysia in collaboration with senior faculty members of the Harvard Business School, Boston, US in 2006.
Prior to joining our Group, he worked for Wal Mart in Detroit, US as an assistant manager in 1998 before returning to Malaysia in 1999. He joined our Group in May 1999 as a management trainee focusing on yard planning. Thereafter, he was transferred to the container operations department in 2003 to manage the operations team. In 2006, he headed the container department overseeing the planning, operations and resource functions. He also focuses on succession planning and competencies development through constant coaching and training.
He has 15 years of experience in container operations.
TAN WEI CHUNTan Wei Chun is our Head of Port Planning. He obtained a degree in transportation and logistics from the Chartered Institute of Transport in 1997. He also attended the SMDP organised by the Harvard Business School Alumni Club of Malaysia in collaboration with senior faculty members of the Harvard Business School, Boston, US in 2004. He has been a member of the Chartered Institute of Transport since 25 September 1997.
Prior to joining our Group, he worked with Kontena Nasional Berhad from 1993 to 1998 in various positions involving haulage, customer services, CFS and depot management.
He joined our Group in September 1998 as an operations executive and has since been attached to various departments including operations, customer services, gate and logistic operations, berth planning, vessel planning and yard planning prior to assuming his present position in January 2011. He is currently responsible for overall yard, berth and vessel planning.
He has 17 years of experience in areas of capacity planning, strategic yard planning, vessel stowage planning, cargo terminal operations, control room operations, project management and operations IT development.
YUSMIN ZUHAIRI ADNANYusmin Zuhairi Adnan is our Head of Conventional Operations since January 2015. He joined Westports in May 2006 as Logistics Executive and since then served in various functions such as warehouse operations, container gate and vessel operations. Yusmin has initiated many projects such as Smart Card Security System and Haulage Pre Arrival Booking System in Westports.
He left Westports in 2011 to join Kuching Port Authority as the General Manager of SM Inland Port Sdn Bhd. He re-joined Westports in January 2015 and assumed the current position since then.
Yusmin started his career as Logistics Executive with MISC Integrated Logistics Sdn Bhd from the year 2000 until 2004. He then joined Diperdana Terminal Services Sdn Bhd as a Warehouse Executive in 2004 before joining Westports in 2006.
He obtained his Bachelors Degree in Accounting from Monash University in Melbourne, Australia in March 2000. He also attended the SMDP organised by the Harvard Business School Alumni Club of Malaysia in collaboration with senior faculty members of the Harvard Business School, Boston, US in 2015.
Yusmin has 10 years of experience in port industry.
MEGAT KHAIRUL AMINMegat Khairul Amin was appointed on 2 June 2014 and he is responsible for overseeing our Company’s internal audit function.
He obtained a Bachelor of Accountancy (Hons) degree from the University of Technology MARA in 2004. He qualified as a Certified Information System Auditor (CISA) in 2012 and has been a member of ISACA since 2009, a member

079A N N U A L R E P O R T 2 0 1 5
P R O F I L E O F M A N A G E M E N T T E A M
of Malaysian Institute of Accountants (MIA) in 2013 and a member of the Institute of Internal Auditors Malaysia (IIAM) in 2014.
He began his career with KPMG Malaysia as an Audit Associate before progressing to Senior Audit Associate. He subsequently joined Malaysia Airlines System Berhad as a Senior Accountant before he later re-joined KPMG Malaysia and was attached with KPMG Management & Risk Consulting Sdn Bhd in IT advisory services.
Prior to joining our Group, he worked with Celcom Axiata Berhad Internal Audit Division. He has over 9 years of experience in the audit and assurance field specialising in the area of financial accounting, system and process.
VEERANAIDU A/L RAMANDUVeeranaidu a/l Ramandu is our Head of Corporate Finance. He joined our Group in June 2011 as a senior finance manager and assumed the post of Head of Finance in December 2011. He assumed the current position on January 2015. He is currently responsible for risk management and corporate matters.
He obtained a Bachelor of Accountancy degree from Universiti Pertanian Malaysia in 1995 and has been a member of the Malaysian Institute of Accountants since 1999. He also attended the SMDP organised by the Harvard Business School Alumni Club of Malaysia in collaboration with senior faculty members of the Harvard Business School, Boston, US in 2014.
He started his career with the Hong Leong Group where he was employed from 1995 to 2002 as an accounts executive. Subsequently, he worked with Lingkaran Trans Kota Holdings Berhad from May 2002 to March 2005 as a senior accountant. He then re-joined the Hong Leong Group as a finance manager from 2005 to 2011. Throughout his career, he has been exposed to general management, treasury functions, costing, tax planning, project evaluations, strategic management and human resource functions.
He has 20 years of experience in the field of finance.


2015 Awards and Achievements 082
Past Awards and Recognitions 083
ACHIEVEMENTS

ACHIEVEMENTS2015 AWARDS AND
082 W E S T P O R T S H O L D I N G S B E R H A D
Sahabat Negara SME Award by SME Malaysia, 2015
Entrepreneur of the year in the Logistic sector of Asia,for Ruben Emir Gnanalingam, by World Finance, 2015
Lifetime Achievement Award for Tan Sri Datuk G. Gnanalingam by Utusan Business Awards, 2015
5th Annual South East Asia’s Institutional Corporate Awards, 2015

083A N N U A L R E P O R T 2 0 1 5
Anugerah Prestasi Cemerlang Maritimby Marine Department of Malaysia, 2014
Special Achievement Award for Tan Sri Datuk G. Gnanalingam by Asia Pacific Entrepreneurship Awards, 2014
Best Companies to Work For In Asia Award by HR Asia, 2014
Selangor Excellence Business Awards, 2014- Industry Class in Logistics for Westports Malaysia- Lifetime Achievement Awards for Tan Sri Datuk
G. Gnanalingam
RECOGNITIONSPAST AWARDS AND
Emerging CEO of the Year Award for Ruben Emir Gnanalingam by the Chartered Institute of Logistics and Transport (CILT), 2014
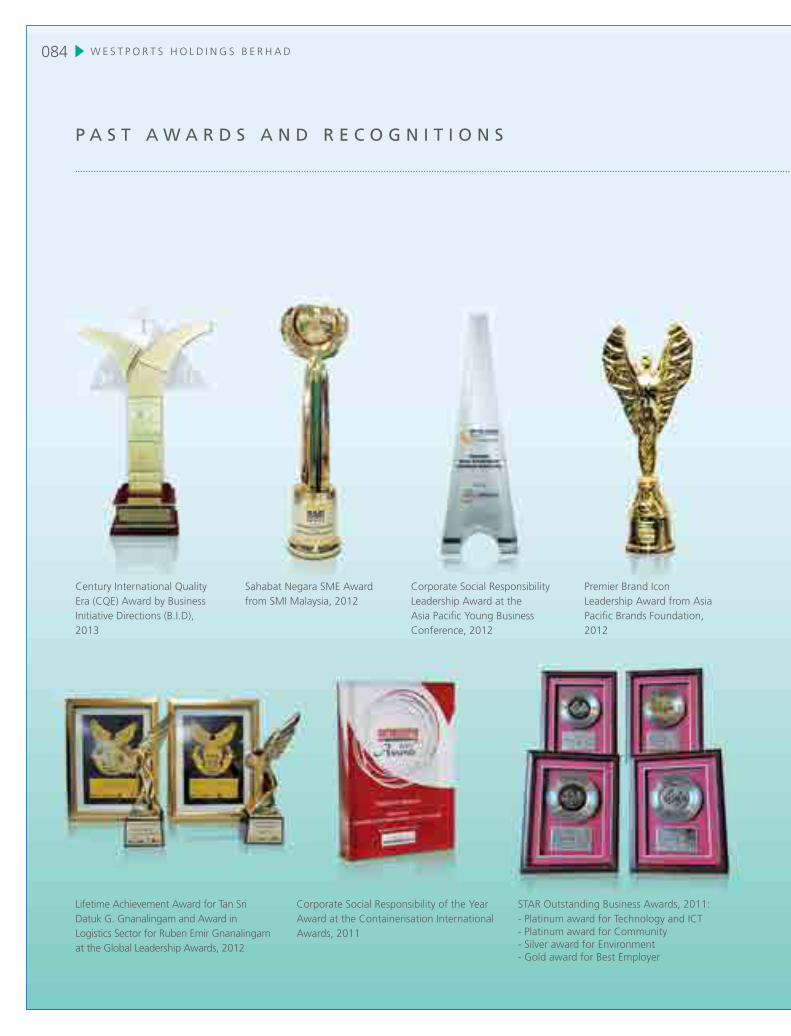
084 W E S T P O R T S H O L D I N G S B E R H A D
Century International Quality Era (CQE) Award by Business Initiative Directions (B.I.D), 2013
Sahabat Negara SME Award from SMI Malaysia, 2012
Corporate Social Responsibility Leadership Award at the Asia Pacific Young Business Conference, 2012
Premier Brand Icon Leadership Award from Asia Pacific Brands Foundation, 2012
Lifetime Achievement Award for Tan Sri Datuk G. Gnanalingam and Award in Logistics Sector for Ruben Emir Gnanalingam at the Global Leadership Awards, 2012
Corporate Social Responsibility of the Year Award at the Containerisation International Awards, 2011
STAR Outstanding Business Awards, 2011: - Platinum award for Technology and ICT- Platinum award for Community- Silver award for Environment- Gold award for Best Employer
P A S T A W A R D S A N D R E C O G N I T I O N S

085A N N U A L R E P O R T 2 0 1 5
Emerging CEO Award for Ruben Emir Gnanalingam, 2011
Asia Human Resource Development Congress Award, 2010
Lifetime Achievement Award by the Malay Chamber of Commerce at the Malaysia Business Leadership Awards, 2009
BrandLaureate Best Brands Award in logistics category by the Asia Pacific Brands Foundation, 2009
Other Awards1) Best Emerging Terminal Award by Lloyd’s List Maritime Asia, 1999
2) FIABCI Award – Best Public Sector Development by Federation Internationale des Administrateurs de Bien Conseils Immobiliers, 2000
3) Silver Screen Award for Port of New Millennium, 2000
4) Top 10 Container Ports Award at the Asian Freight Industry Awards (AFIA), 2001
5) Superbrands Award by the Malaysian Superbrands Council, 2002
6) National Landscape Award for the 2nd private building category by the Ministry of Housing and Local Government, 2003
7) Best Employer Award for competent employers facing competitive globalisation by the Ministry of Human Resources, 2004
8) Best Infrastructure Design Award by BPIMB, 2005
9) Technology Business Review Award for excellence in logistics – port services, 2006
10) BrandLaureate Best Brands Award in ports/terminal category by the Asia Pacific Brands Foundation, 2007
11) Silver Award for safety excellence by National Council for Occupational Safety & Health, 2007
12) Silver Award for safety by the International Association of Ports & Harbors (IAPH), 2007
13) The Peace Honorary Certificate of Excellence, 2007
14) Excellence in Logistics Award at the Technology Business Review ASEAN Awards for IT application in port management, 2007
15) CILT Achiever of the Year Award for Tan Sri Datuk G. Gnanalingam, 2007
16) SME Platinum Award for Tan Sri Datuk G. Gnanalingam, 2007
17) Human Resource Development Award by the Human Resources Minister, 2007
18) Gold Award for IT by the International Association of Ports & Harbors (IAPH), 2007
19) Lifetime Achievement Award by Malaysian Indian Business Association (MIBA) for Tan Sri G. Gnanalingam, 2009
20) Lifetime Achievement Award by Social Entrepreneurs Network (SeNet) for Tan Sri G.Gnanalingam, 2009
21) BrandLaureate SME Chapter Award by Asia Pacific Brands Foundation, 2010
22) Old Putra Of the Year Award for Tan Sri G Gnanalingam, Royal Military College Old Boys Association, 2010
23) BrandLaureate Top 10 Masters Award in logistics by Asia Pacific Brands Foundation, 2011
24) Entrepreneur Par Excellence Award for Ruben Emir Gnanalingam from Malaysia Tatler, 2012
25) Accreditations for Health, Safety and Environment - ISO 27001, ISO 14001 and OHSAS 18001
P A S T A W A R D S A N D R E C O G N I T I O N S