Embed Size (px)
Citation preview
THE JOURNAL OF BIOLOGICAL CHEMISTRY 0 1993 by The American Society for Biochemistry and Molecular Biology, Inc.
Vol. 268, No. Issue of October 15, pp. 22119-22126.1993 Printed in U.S.A.
Glucose Transport in L6 Myoblasts Overexpressing GLUT1 and GLUT4*
(Received for publication, April 22, 1993)
Randall Robinson$, Linda J. Robinsons, David E. James$, and John C. Lawrence, Jr.SII From the Departments of $Molecular Biology and Pharmacology and §Cell Biology and Physiology, Washington University School of Medicine, St. Louis, Missouri 63110
The roles of the glucose transporter isoforms, GLUTl and GLUT4, in mediating insulin-stimulated glucose transport were investigated by stably overex- pressing the transporters in L6 myoblasts. Levels of GLUTl and GLUT4 in myoblasts from the cell lines having the highest content of these transporters were approximately 16- and 30-fold higher, respectively, than levels in nontransfected cells. The basal rate of 2- de~xy[~H]glucose uptake was severalfold higher in cells overexpressing GLUTl than in the parent L6 myoblasts or in control cell lines that were generated by transfecting cells with expression vectors lacking transporter insert. The basal rate was not elevated in any of the lines expressing GLUT4. The net increase in 2-deo~y[~H]glucose uptake produced by insulin was larger in both the GLUTl and GLUT4 cells than in the control cells. Insulin increased uptake in GLUT4 cells by as much as 6-fold; whereas, the fold increase over basal uptake produced by insulin in GLUTl cells was comparable to that (2-fold) observed in the control myocytes. Thus, both GLUTl and GLUT4 can mediate insulin-stimulated glucose transport in L6 myoblasts, although GLUT4 is needed to observe large percentage increases comparable to those observed in skeletal muscle fibers in vivo. In contrast to insulin, the protein phosphatase inhibitors, okadaic acid and calyculin A, inhibited glucose transport in cells expressing either GLUTl or GLUT4. Calyculin A, which produced a half-maximum effect at 10 nM, was approximately 100 times more potent than okadaic acid in decreasing both basal and insulin-stimulated 2-deoxyglucose uptake. Inhibition of uptake by calyculin A was associated with a decrease in the cell surface concentration of both GLUTl and GLUT4. These results indicate that in- creased protein phosphorylation can lead to inhibition of transport mediated by both GLUTl and GLUT4.
GLUTl and GLUT4 are members of a family of homolo- gous glucose transport proteins (for review, see Refs. 1 and 2). GLUTl is almost ubiquitous in its tissue distribution (3). GLUT4 is expressed at high levels in skeletal and cardiac muscle cells and brown and white adipocytes, cell types that exhibit the highest levels of insulin-stimulated glucose trans-
Grants AR41180, DK28312 and DK42503 and by the Washington * This work was supported in part by National Institutes of Health
University Diabetes Research and Training Center. The costs of publication of this article were defrayed in part by the payment of page charges. This article must therefore be hereby marked “aduer- tisement” in accordance with 18 U.S.C. Section 1734 solely to indicate this fact.
11 To whom correspondence should be addressed Dept. of Molec- ular Biology and Pharmacology, Box 8103, Washington University School of Medicine, 660 South Euclid Ave., St. Louis, MO 63110.
port (4,s). Insulin stimulates glucose transport by promoting translocation of transporters from an intracellular store to the plasma membrane (1, 2, 6). Okadaic acid and calyculin A, compounds originally isolated from the sea sponges, Hali- chondria okadaii and Discodermia calyx, respectively, are po- tent inhibitors of PP2a and PP1, two protein phosphatases with relatively broad substrate specificities (7). Effects of calyculin A on glucose transport have not been reported, but incubating rat adipocytes (8, 9) and skeletal muscle (10) with okadaic acid has been found to increase glucose transport, suggesting that increased protein phosphorylation is involved in insulin-stimulated translocation of GLUT4.
Both GLUTl and GLUT4 may be translocated to the plasma membrane in response to insulin (11-14). Under basal conditions GLUTl is found at relatively high levels in the plasma membrane, where very little GLUT4 can be detected (11-14). Thus, the percentage change in the plasma mem- brane concentration elicited by insulin is much greater for GLUT4 than for GLUT1. Overexpressing human GLUTl by %fold in 3T3L1 adipocytes specifically increased basal trans- port (15). A current concept is that GLUT4 mediates insulin- stimulated glucose transport, and that GLUTl is responsible for basal transport; however, it is clear that the presence of GLUT4 per se is not sufficient to produce insulin-stimulated transport in all cells. For example, insulin stimulated neither glucose transport nor the movement of GLUT4 to the plasma membrane in transfected cell lines of fibroblasts (16, 17), Chinese hamster ovary cells (18), or C2C12 muscle cells (19) overexpressing GLUT4.
L6 is a skeletal muscle cell line that has been used to investigate insulin action (20-22). L6 myoblasts exhibit in- sulin-stimulated glucose transport, although the magnitude of the stimulatory effect (approximately 2-fold) is less than the severalfold increases observed in skeletal muscles (23,24). To define further the roles of GLUTl and GLUT4, and to investigate the mechanisms involved in translocation of the transporters, the effects of insulin and the phosphatase inhib- itors, okadaic acid and calyculin A, on glucose transport were evaluated in L6 myoblasts that stably overexpressed either GLUTl or GLUT4.
EXPERIMENTAL PROCEDURES
Preparation of cDNA Constructs-cDNA encoding human GLUTl (3) or rat GLUT4 (4) were inserted into the expression vectors pSFFVneo (25) or pRc/CMVneo (Invitrogen). Briefly, the GLUTl coding region was excised from the pUC13 backbone with HindIII, blunted with Klenow, and inserted into the EcoRI cloning site of pSFFVneo. The EcoRI fragment containing the GLUT4 coding region was ligated into the EcoRI site of pSFFVneo. The HindIII-XbaI fragment containing GLUT4 cDNA was inserted into pRc/CMVneo that had been cut with the same restriction enzymes. Plasmids with proper orientations of the GLUTl and GLUT4 inserts were identified by mapping with restriction endonucleases.
22119
22120 GLUT1 and GLUT4 Ouerexpression in L6 Myoblasts Transfection and Selection of Cells Expressing GLUT1 and
GLUT4"To minimize problems associated with clonal variability, L6 myoblasts were subcloned and stored as frozen stocks in liquid nitrogen. The cells were thawed and cultured in growth medium, which was composed of Dulbecco's modified Eagle's medium (DMEM)' containing 10% fetal calf serum. The cDNA constructs (100 pg/lOO-rnm diameter culture dish) were introduced into the cells (approximately 20% confluent, passage number 2-5 after thawing) by using cationic liposomes (Lipofectin reagent, Bethesda Research Laboratories). Other cells were transfected with the plasmids lacking the transporter inserts. Cells were cultured in medium containing 2 mg/ml of the neomycin analogue, G418 (Life Technologies Inc.), and resistant colonies were isolated with cloning cylinders (Bellco). Stock cultures of the cell lines were maintained in growth medium contain- ing 0.2 mg/ml (2418, to limit growth of revertants. For the cell lines described in this report, expression of GLUTl and GLUT4 was stable for at least 12 passages.
Cell Culture-L6 cells were carried as myoblasts for no more than 10 passages in growth medium essentially as described previously (26). To passage the cells, cultures were rinsed with Solution A (135 mM NaCl, 5.4 mM KCl, and 10 mM Nap,, pH 7.4), then incubated at 36 "C in the same buffer containing 0.02% trypsin for 5 min. The cells were harvested by centrifugation, and seeded (day 0) into plastic culture dishes at a density of 3000 cells/cm2. The medium was replaced after 2 days, and cells were used in experiments on day 4.
Detection of Glucose Transporters by Immunoblotting-Cells were rinsed twice with Solution A, then scraped from the dish and homog- enized in Solution B (1 ml/l0-cm diameter dish). Solution B was composed of 0.25 M sucrose, 1 mM EDTA, and 10 mM NaHEPES, pH 7.4. In some experiments a microsomal fraction was prepared by centrifuging the homogenate a t 20,000 X g for 30 min, then centrifug- ing the supernatant at 150,000 X g for 90 min. The microsomal pellet was suspended in Solution B. Samples of the homogenates or micro- somal membranes were subjected to SDS-PAGE by the method of Laemmli (27). For the experiment in Fig. 4, rat adipocytes (28), cardiac myocytes (29). and 3T3L1 adipocytes (10-days post differen- tiation) (30) were prepared as described previously. The cells were washed 3 times in Solution A to remove BSA and other serum proteins, and then homogenized in Solution B that had been supple- mented with 1% SDS. Proteins were electrophoretically transferred from the 10% acrylamide gels to nylon membranes (Immobilon, Millipore). To identify GLUT1, GLUTS, and GLUT4, the sheets were incubated with polyclonal antibodies against synthetic peptides having the sequence of the last 12-15 amino acids in the COOH termini of the respective transporters. The monoclonal GLUT4 Ab, 1F8, was used in some experiments (5).' Transporters were detected by using '251-labeled protein A and autoradiography (28) or by using enhanced chemiluminescence (ECL, Amersham). ECL was at least 100-fold more sensitive than '251-labeled protein A, and was necessary to detect the relatively low levels of GLUT4 present in homogenates of nontransfected L6 cells. The relative amounts of transporters were determined by band intensities, which were quantitated by using a laser scanning densitometer (Molecular Dynamics).
2-Deoxy~Hjglucose Uptake-Cells were incubated at 37 "C in DMEM without serum for 5 h (20). Unless otherwise indicated the cells were incubated for 20 min in medium composed of Krebs-Ringer phosphate buffer (135 mM NaCI, 5.4 mM KCl, 1.4 mM CaC12, 1.4 mM MgSO,, and 10 mM NaPi, pH 7.4) containing 5 mM glucose and 1% BSA (crystalline, Sigma). To initiate uptake, the medium was re- placed with glucose-free medium (37 "C) having the same additions plus 50 p~ 2-deo~y[~H]glucose. Under the conditions of these exper- iments, 2-deo~y[~H]glucose uptake increased linearly with time for at least 30 min. Therefore, to assess initial rates of uptake, assays were conducted with an incubation period with 2-deo~y[~H]glucose of 20 min or less. Uptake was terminated by washing the cells three times with Krebs-Ringer phosphate buffer (2 ml of 0 "C buffer/wash). The total time required for the wash was 5 s. NaOH (0.5 ml of 0.4 N) was added to each well to dissolve the cells. After neutralization, radioactivity was measured by scintillation counting. Values for up- take are expressed in terms of protein, which was measured by the bicinchoninic acid method (31). Uptake values obtained in the pres-
' The abbreviations used are as follows: DMEM, Dulbecco's mod- ified Eagle's medium; Ab, antibody; BSA, bovine serum albumin; ECL, enhanced chemiluminescence; IGF-1, insulin-like growth factor 1; PAGE, polyacrylamide gel electrophoresis.
'R. Robinson, L. J. Robinson, D. E. James, and J. C. Lawrence, Jr., unpublished observations.
ence of the glucose transport inhibitor cytochalasin B (10 PM) were subtracted to correct for the amount of 2-deo~y[~H]glucose recovered as a result of glucose transport-independent processes.
Preparation of Plasma Membrane Fragments (Lawns) and Detection of GLUT4 by Immunofluorescence Microscopy-Plasma membrane lawns were isolated using an adaptation (32) of the method described by Moore et al. (33). Briefly, the cells were seeded on glass coverslips, but otherwise cultured as described above. After treatment with insulin or calyculin A, the cells were rinsed with Solution A and incubated for 30 s in Solution A containing 0.5 mg/ml poly-t-lysine, followed by incubations of 5 s each in hypotonic solution (23 mM KCI, 1.7 mM MgC12, 1 mM EGTA, and 10 mM Hepes, pH 7.5). The coverslips were then placed in Solution C and sonicated (power setting of 15 on a Kontes 115-V disrupter) for 2 s by using a 3.2 X 48-mm tapered probe centered 0.3 cm above the coverslip. Coverslips were then placed in Solution C containing 2% paraformaldehyde. Solution c was composed of 70 mM KCl, 5 mM MgCI2, 3 mM EGTA, 1 mM dithiothreitol, 0.1 mM phenylmethylsulfonyl fluoride, and 30 mM Hepes, pH 7.5. Double immunofluorescence labeling was employed to
either GLUTl or GLUT4. Incubations with antibodies to GLUTl detect clathrin, which was used as a plasma membrane marker, and
and GLUT4 were conducted as described previously (34). A mono- clonal Ab to the heavy chain of clathrin (mAb X22, Ref. 35, provided by Dr. Francis Brodsky) was used at a concentration of 5 pg/ml. Immunolabeling with GLUTl or GLUT4 Ab was detected with fluo- rescein isothiocyanate-conjugated goat anti-rabbit Ab (Cappel Labo- ratories), and immunolabeling with the clathrin Ab was detected with Texas Red-conjugated anti-mouse Ab. Lawns were examined with a Zeis Axioplan microscope equipped with a Bio-Rad MRC-500 laser confocal imaging system. Images for each Ab were scaled identically, and fluorescence intensities of lawns from at least eight randomly selected fields labeled with either GLUTl or GLUT4 Ab were deter- mined by using the analysis software (Bio-Rad) as described previ- ously (32). Fluorescence units are arbitrary, but were obtained from images scaled identically for each Ab. Thus, while it is not appropriate to make quantitative comparisons between the intensities of staining observed with the GLUTl and GLUT4 Ab, comparisons can be made between treatment groups of the same cell line or between different cell lines when staining was performed with the same Ab.
Other Materials-Insulin and IGF-1 were gifts from Lilly and Kabi Peptide Hormones, respectively. Cytochalasin B was obtained from Aldrich. Okadaic acid (ammonium salt) and calyculin A were obtained from LC Biochemicals. 2-[1,2-3H]Deoxy-~-glucose was purchased from Du Pont-New England Nuclear. Other commonly used chemi- cals were from Sigma.
RESULTS
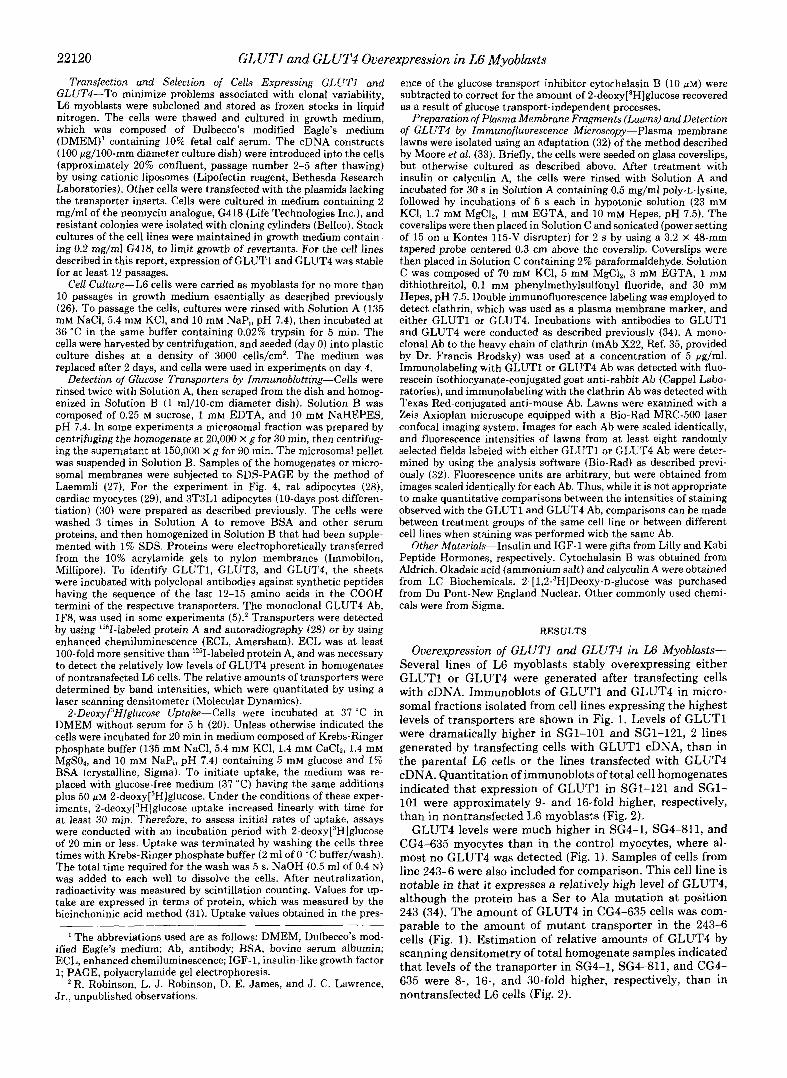
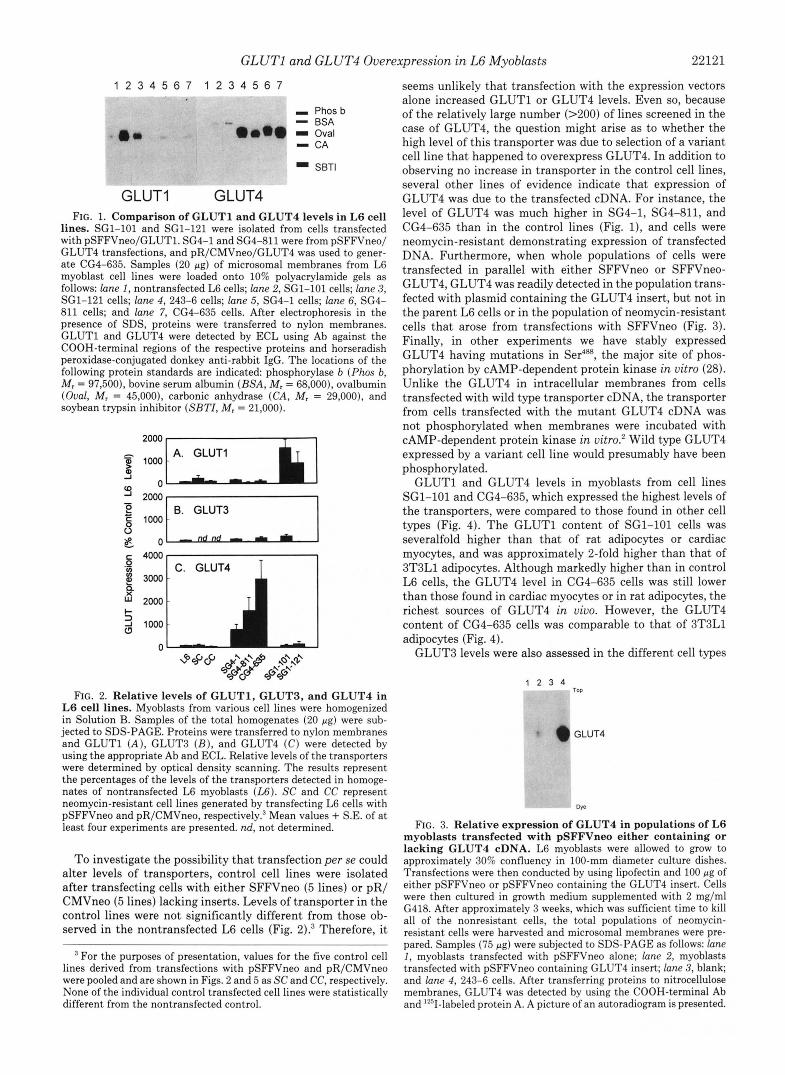
Overexpression of GLUTl and GLUT4 in L6 Myoblasts- Several lines of L6 myoblasts stably overexpressing either GLUTl or GLUT4 were generated after transfecting cells with cDNA. Immunoblots of GLUTl and GLUT4 in micro- somal fractions isolated from cell lines expressing the highest levels of transporters are shown in Fig. 1. Levels of GLUTl were dramatically higher in SG1-101 and SG1-121, 2 lines generated by transfecting cells with GLUTl cDNA, than in the parental L6 cells or the lines transfected with GLUT4 cDNA. Quantitation of irnmunoblots of total cell homogenates indicated that expression of GLUTl in SG1-121 and SGI- 101 were approximately 9- and 16-fold higher, respectively, than in nontransfected L6 myoblasts (Fig. 2).
GLUT4 levels were much higher in SG4-1, SG4-811, and CG4-635 myocytes than in the control myocytes, where al- most no GLUT4 was detected (Fig. l). Samples of cells from line 243-6 were also included for comparison. This cell line is notable in that it expresses a relatively high level of GLUT4, although the protein has a Ser to Ala mutation at position 243 (34). The amount of GLUT4 in CG4-635 cells was corn- parable to the amount of mutant transporter in the 243-6 cells (Fig. 1). Estimation of relative amounts of GLUT4 by scanning densitometry of total homogenate samples indicated that levels of the transporter in SG4-1, SG4-811, and CG4- 635 were 8-, 16-, and 30-fold higher, respectively, than in nontransfected L6 cells (Fig. 2).
GLUT1 and GLUT4 Overexpression in L6 Myoblasts 22121
1 2 3 4 5 6 7 1 2 3 4 5 6 7
I Phos b - BSA - Oval - CA
SBTl
GLUT1 GLUT4 FIG. 1. Comparison of GLUTl and GLUT4 levels in L6 cell
lines. SG1-101 and SG1-121 were isolated from cells transfected with pSFFVneo/GLUTl. SG4-1 and SG4-811 were from pSFFVneo/ GLUT4 transfections, and pR/CMVneo/GLUT4 was used to gener- ate CG4-635. Samples (20 pg) of microsomal membranes from L6 myoblast cell lines were loaded onto 10% polyacrylamide gels as follows: lane I , nontransfected L6 cells; lane 2, SG1-101 cells; lune 3, SG1-121 cells; lane 4, 243-6 cells; lune 5, SG4-1 cells; lane 6, SG4- 811 cells; and lane 7, CG4-635 cells. After electrophoresis in the presence of SDS, proteins were transferred to nylon membranes. GLUTl and GLUT4 were detected by ECL using Ab against the COOH-terminal regions of the respective proteins and horseradish peroxidase-conjugated donkey anti-rabbit IgG. The locations of the following protein standards are indicated phosphorylase b (Phos b, M, = 97,500), bovine serum albumin (BSA, M, = 68,000), ovalbumin (Oval, M, = 45,000), carbonic anhydrase (CA, M, = 29,000), and soybean trypsin inhibitor (SBTZ, M, = 21,000).
0- 4000 r 1
FIG. 2. Relative levels of GLUT1, GLUT3, and GLUT4 in L6 cell lines. Myoblasts from various cell lines were homogenized in Solution B. Samples of the total homogenates (20 pg) were sub- jected to SDS-PAGE. Proteins were transferred to nylon membranes and GLUTl ( A ) , GLUT3 ( B ) , and GLUT4 ( C ) were detected by using the appropriate Ab and ECL. Relative levels of the transporters were determined by optical density scanning. The results represent the percentages of the levels of the transporters detected in homoge- nates of nontransfected L6 myoblasts (U). SC and CC represent neomycin-resistant cell lines generated by transfecting L6 cells with pSFFVneo and pR/CMVneo, re~pectively.~ Mean values + S.E. of a t least four experiments are presented. nd, not determined.
To investigate the possibility that transfection per se could alter levels of transporters, control cell lines were isolated after transfecting cells with either SFFVneo (5 lines) or pR/ CMVneo (5 lines) lacking inserts. Levels of transporter in the control lines were not significantly different from those ob- served in the nontransfected L6 cells (Fig. Z).3 Therefore, it
For the purposes of presentation, values for the five control cell lines derived from transfections with pSFFVneo and pR/CMVneo were pooled and are shown in Figs. 2 and 5 as SC and CC, respectively. None of the individual control transfected cell lines were statistically different from the nontransfected control.
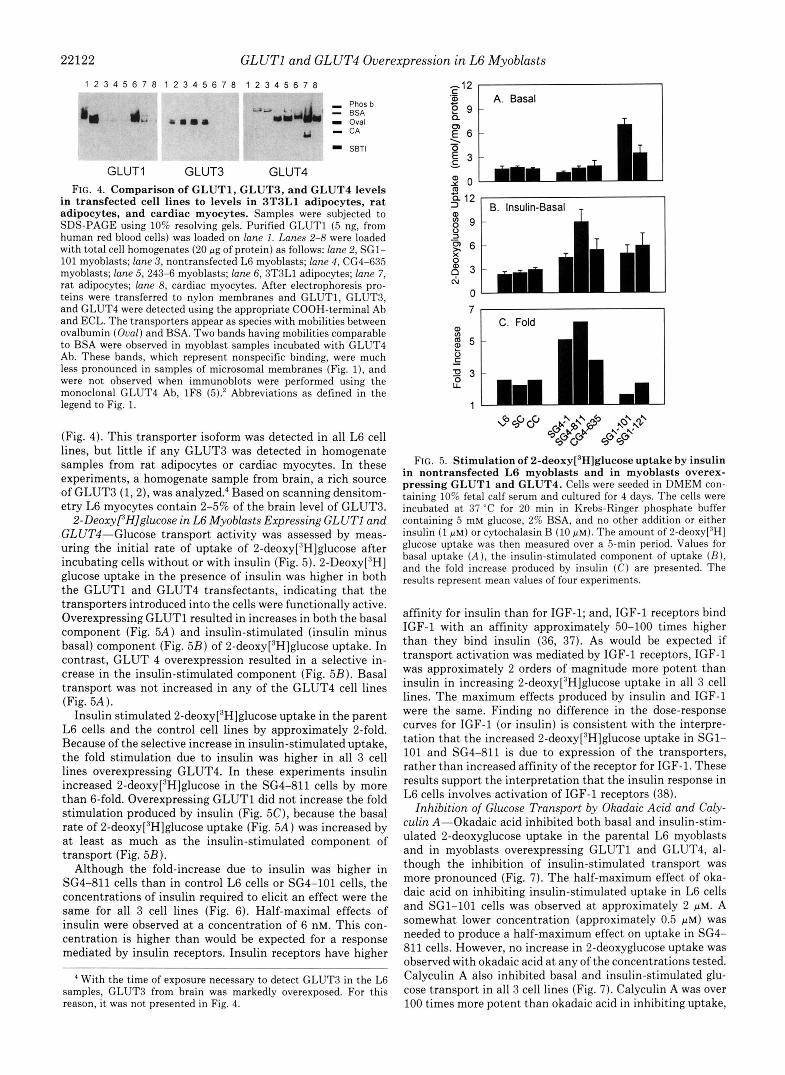
seems unlikely that transfection with the expression vectors alone increased GLUTl or GLUT4 levels. Even so, because of the relatively large number (>ZOO) of lines screened in the case of GLUT4, the question might arise as to whether the high level of this transporter was due to selection of a variant cell line that happened to overexpress GLUT4. In addition to observing no increase in transporter in the control cell lines, several other lines of evidence indicate that expression of GLUT4 was due to the transfected cDNA. For instance, the level of GLUT4 was much higher in SG4-1, SG4-811, and CG4-635 than in the control lines (Fig. l), and cells were neomycin-resistant demonstrating expression of transfected DNA. Furthermore, when whole populations of cells were transfected in parallel with either SFFVneo or SFFVneo- GLUT4, GLUT4 was readily detected in the population trans- fected with plasmid containing the GLUT4 insert, but not in the parent L6 cells or in the population of neomycin-resistant cells that arose from transfections with SFFVneo (Fig. 3). Finally, in other experiments we have stably expressed GLUT4 having mutations in Ser4%, the major site of phos- phorylation by CAMP-dependent protein kinase i n vitro (28). Unlike the GLUT4 in intracellular membranes from cells transfected with wild type transporter cDNA, the transporter from cells transfected with the mutant GLUT4 cDNA was not phosphorylated when membranes were incubated with CAMP-dependent protein kinase in vitro.' Wild type GLUT4 expressed by a variant cell line would presumably have been phosphorylated.
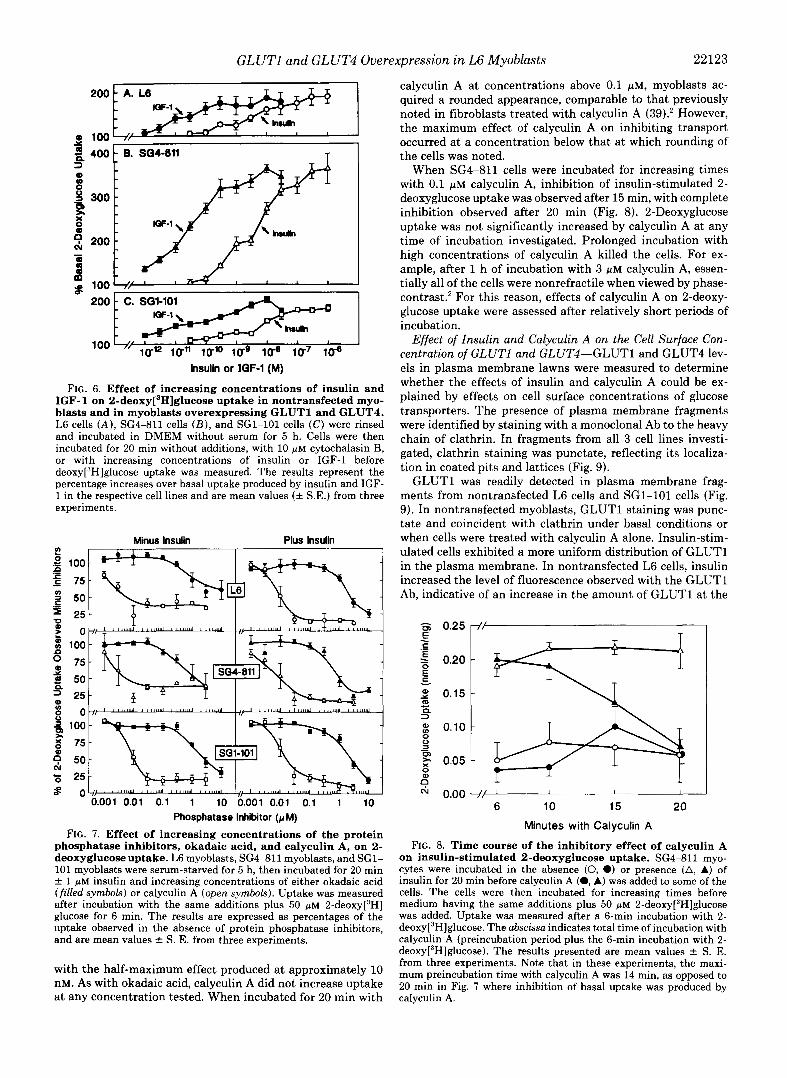
GLUTl and GLUT4 levels in myoblasts from cell lines SG1-101 and CG4-635, which expressed the highest levels of the transporters, were compared to those found in other cell types (Fig. 4). The GLUTl content of SG1-101 cells was severalfold higher than that of rat adipocytes or cardiac myocytes, and was approximately 2-fold higher than that of 3T3L1 adipocytes. Although markedly higher than in control L6 cells, the GLUT4 level in CG4-635 cells was still lower than those found in cardiac myocytes or in rat adipocytes, the richest sources of GLUT4 in uiuo. However, the GLUT4 content of CG4-635 cells was comparable to that of 3T3L1 adipocytes (Fig. 4).
GLUT3 levels were also assessed in the different cell types
1 2 3 4 TOP
GLUT4
QP
FIG. 3. Relative expression of GLUT4 in populations of L6 myoblasts transfected with pSFFVneo either containing or lacking GLUT4 cDNA. L6 myoblasts were allowed to grow to approximately 30% confluency in 100-mm diameter culture dishes. Transfections were then conducted by using lipofectin and 100 pg of either pSFFVneo or pSFFVneo containing the GLUT4 insert. Cells were then cultured in growth medium supplemented with 2 mg/ml G418. After approximately 3 weeks, which was sufficient time to kill all of the nonresistant cells, the total populations of neomycin- resistant cells were harvested and microsomal membranes were pre- pared. Samples (75 pg) were subjected to SDS-PAGE as follows: lune I , myoblasts transfected with pSFFVneo alone; lane 2, myoblasts transfected with pSFFVneo containing GLUT4 insert; lane 3, blank; and lane 4, 243-6 cells. After transferring proteins to nitrocellulose membranes, GLUT4 was detected by using the COOH-terminal Ab and 12sI-labeled protein A. A picture of an autoradiogram is presented.
22122 GLUTl and GLUT4 Overexpression in L6 Myoblasts 1 2 3 4 5 6 7 8 1 2 3 4 5 6 7 8 1 2 3 4 5 6 7 8 . ~. . . . .~..* "" -.. .",,_._ , .
' - Phosb -adm&& - 6SA
I Oval - CA
S6Tl
GLUT1 GLUT3 GLUT4 FIG. 4. Comparison of GLUT1. GLUT3, and GLUT4 levels
in transfected cell lines to levels in 3T3L1 adipocytes, rat adipocytes, and cardiac myocytes. Samples were subjected to SDS-PAGE using 10% resolving gels. Purified GLUTl (5 ng, from human red blood cells) was loaded on lane 1. Lanes 2-8 were loaded with total cell homogenates (20 pg of protein) as follows: lane 2, SG1- 101 myoblasts; lane 3, nontransfected L6 myoblasts; lane 4, CG4-635 myoblasts; lane 5, 243-6 myoblasts; lane 6, 3T3L1 adipocytes; lane 7, rat adipocytes; lane 8, cardiac myocytes. After electrophoresis pro- teins were transferred to nylon membranes and GLUT1, GLUT3, and GLUT4 were detected using the appropriate COOH-terminal Ab and ECL. The transporters appear as species with mobilities between ovalbumin (Oval) and BSA. Two bands having mobilities comparable to BSA were observed in myoblast samples incubated with GLUT4 Ab. These bands, which represent nonspecific binding, were much less pronounced in samples of microsomal membranes (Fig. l), and were not observed when immunoblots were performed using the monoclonal GLUT4 Ab, 1F8 (5).* Abbreviations as defined in the legend to Fig. 1.
(Fig. 4). This transporter isoform was detected in all L6 cell lines, but little if any GLUT3 was detected in homogenate samples from rat adipocytes or cardiac myocytes. In these experiments, a homogenate sample from brain, a rich source of GLUT3 (1,2), was analyzed: Based on scanning densitom- etry L6 myocytes contain 2-5% of the brain level of GLUT3.
2-Deoxyf'H]glucose in L6 Myoblasts Expressing GLUTl and GLUT4-Glucose transport activity was assessed by meas- uring the initial rate of uptake of 2-deo~y[~H]glucose after incubating cells without or with insulin (Fig. 5). 2-Deoxy['H] glucose uptake in the presence of insulin was higher in both the GLUTl and GLUT4 transfectants, indicating that the transporters introduced into the cells were functionally active. Overexpressing GLUTl resulted in increases in both the basal component (Fig. 5A) and insulin-stimulated (insulin minus basal) component (Fig. 5B) of 2-deo~y[~H]glucose uptake. In contrast, GLUT 4 overexpression resulted in a selective in- crease in the insulin-stimulated component (Fig. 5B). Basal transport was not increased in any of the GLUT4 cell lines (Fig. 5A).
Insulin stimulated 2-deo~y[~H]glucose uptake in the parent L6 cells and the control cell lines by approximately 2-fold. Because of the selective increase in insulin-stimulated uptake, the fold stimulation due to insulin was higher in all 3 cell lines overexpressing GLUT4. In these experiments insulin increased 2-deo~y[~H]glucose in the SG4-811 cells by more than 6-fold. Overexpressing GLUTl did not increase the fold stimulation produced by insulin (Fig. 5C), because the basal rate of 2-deo~y[~H]glucose uptake (Fig. 5A) was increased by at least as much as the insulin-stimulated component of transport (Fig. 5B).
Although the fold-increase due to insulin was higher in SG4-811 cells than in control L6 cells or SG4-101 cells, the concentrations of insulin required to elicit an effect were the same for all 3 cell lines (Fig. 6). Half-maximal effects of insulin were observed at a concentration of 6 nM. This con- centration is higher than would be expected for a response mediated by insulin receptors. Insulin receptors have higher
' With the time of exposure necessary to detect GLUT3 in the L6 samples, GLUT3 from brain was markedly overexposed. For this reason, it was not presented in Fig. 4.
%. 12 I B. Insulin-Basal m
7 , I
C. Fold
LL
FIG. 5. Stimulation of 2-deo~y[~H]glucose uptake by insulin
pressing GLUTl and GLUT4. Cells were seeded in DMEM con- in nontransfected L6 myoblasts and in myoblasts overex-
taining 10% fetal calf serum and cultured for 4 days. The cells were incubated at 37 "C for 20 min in Krebs-Ringer phosphate buffer containing 5 mM glucose, 2% BSA, and no other addition or either insulin (1 p M ) or cytochalasin B (10 PM). The amount of 2-deoxy['H] glucose uptake was then measured over a 5-min period. Values for basal uptake ( A ) , the insulin-stimulated component of uptake ( B ) , and the fold increase produced by insulin ( C ) are presented. The results represent mean values of four experiments.
affinity for insulin than for IGF-1; and, IGF-1 receptors bind IGF-1 with an affinity approximately 50-100 times higher than they bind insulin (36, 37). As would be expected if transport activation was mediated by IGF-1 receptors, IGF-1 was approximately 2 orders of magnitude more potent than insulin in increasing 2-deo~y[~H]glucose uptake in all 3 cell lines. The maximum effects produced by insulin and IGF-1 were the same. Finding no difference in the dose-response curves for IGF-1 (or insulin) is consistent with the interpre- tation that the increased 2-deo~y[~H]glucose uptake in SG1- 101 and SG4-811 is due to expression of the transporters, rather than increased affinity of the receptor for IGF-1. These results support the interpretation that the insulin response in L6 cells involves activation of IGF-1 receptors (38).
Inhibition of Glucose Transport by Okadaic Acid and Caly- culin A-Okadaic acid inhibited both basal and insulin-stim- ulated 2-deoxyglucose uptake in the parental L6 myoblasts and in myoblasts overexpressing GLUTl and GLUT4, al- though the inhibition of insulin-stimulated transport was more pronounced (Fig. 7). The half-maximum effect of oka- daic acid on inhibiting insulin-stimulated uptake in L6 cells and SG1-101 cells was observed at approximately 2 pM. A somewhat lower concentration (approximately 0.5 p M ) was needed to produce a half-maximum effect on uptake in SG4- 811 cells. However, no increase in 2-deoxyglucose uptake was observed with okadaic acid a t any of the concentrations tested. Calyculin A also inhibited basal and insulin-stimulated glu- cose transport in all 3 cell lines (Fig. 7). Calyculin A was over 100 times more potent than okadaic acid in inhibiting uptake,
GLUTl and GLUT4 Overexpression i n L6 Myoblasts 22123
200
Y 0 100
400 C G 4 - 8 1 1 T I
Insulin or IGF-1 (M)
FIG. 6. Effect of increasing concentrations of insulin and IGF-1 on 2-deo~y[~H]glucose uptake in nontransfected myo- blasts and in myoblasts overexpressing GLUTl and GLUT4. L6 cells ( A ) , SG4-811 cells ( B ) , and SG1-101 cells (C) were rinsed and incubated in DMEM without serum for 5 h. Cells were then incubated for 20 min without additions, with 10 p~ cytochalasin B, or with increasing concentrations of insulin or IGF-1 before de~xy[~H]glucose uptake was measured. The results represent the percentage increases over basal uptake produced by insulin and IGF- 1 in the respective cell lines and are mean values (f S.E.) from three experiments.
Minus Insulin Plus Insulin
- 0.001 0.01 0.1 1 10 0.001 0.01 0.1 1 10 Phosphatase Inhibitor (pM)
FIG. 7. Effect of increasing concentrations of the protein phosphatase inhibitors, okadaic acid, and calyculin A, on 2- deoxyglucose uptake. L6 myoblasts, SG4-811 myoblasts, and SG1- 101 myoblasts were serum-starved for 5 h, then incubated for 20 min f 1 p~ insulin and increasing concentrations of either okadaic acid (filled symbols) or calyculin A (open symbols). Uptake was measured after incubation with the same additions plus 50 p~ 2-de0xy[~H] glucose for 6 min. The results are expressed as percentages of the uptake observed in the absence of protein phosphatase inhibitors, and are mean values f S. E. from three experiments.
with the half-maximum effect produced at approximately 10 nM. As with okadaic acid, calyculin A did not increase uptake
calyculin A at concentrations above 0.1 FM, myoblasts ac- quired a rounded appearance, comparable to that previously noted in fibroblasts treated with calyculin A (39).' However, the maximum effect of calyculin A on inhibiting transport occurred at a concentration below that at which rounding of the cells was noted.
When SG4-811 cells were incubated for increasing times with 0.1 FM calyculin A, inhibition of insulin-stimulated 2- deoxyglucose uptake was observed after 15 min, with complete inhibition observed after 20 min (Fig. 8). 2-Deoxyglucose uptake was not significantly increased by calyculin A at any time of incubation investigated. Prolonged incubation with high concentrations of calyculin A killed the cells. For ex- ample, after 1 h of incubation with 3 PM calyculin A, essen- tially all of the cells were nonrefractile when viewed by phase- contrast.' For this reason, effects of calyculin A on 2-deoxy- glucose uptake were assessed after relatively short periods of incubation.
Effect of Insulin and Calyculin A on the Cell Surface Con- centration of GLUTl and GLUT4"GLUTl and GLUT4 lev- els in plasma membrane lawns were measured to determine whether the effects of insulin and calyculin A could be ex- plained by effects on cell surface concentrations of glucose transporters. The presence of plasma membrane fragments were identified by staining with a monoclonal Ab to the heavy chain of clathrin. In fragments from all 3 cell lines investi- gated, clathrin staining was punctate, reflecting its localiza- tion in coated pits and lattices (Fig. 9).
GLUTl was readily detected in plasma membrane frag- ments from nontransfected L6 cells and SG1-101 cells (Fig. 9). In nontransfected myoblasts, GLUTl staining was punc- tate and coincident with clathrin under basal conditions or when cells were treated with calyculin A alone. Insulin-stim- ulated cells exhibited a more uniform distribution of GLUTl in the plasma membrane. In nontransfected L6 cells, insulin increased the level of fluorescence observed with the GLUTl Ab, indicative of an increase in the amount of GLUTl at the
6 10 15 20 Minutes with Calyculin A
FIG. 8. Time course of the inhibitory effect of calyculin A on insulin-stimulated 2-deoxyglucose uptake. SG4-811 myo- cytes were incubated in the absence (0, 0) or presence (A, A) of insulin for 20 min before calyculin A (0, A) was added to some of the cells. The cells were then incubated for increasing times before medium having the same additions plus 50 p~ 2-deo~y[~H]glucose was added. Uptake was measured after a 6-min incubation with 2- de~xy[~H]glucose. The abscissa indicates total time of incubation with calyculin A (preincubation period plus the 6-min incubation with 2- de~xy[~H]glucose). The results presented are mean values f S. E. from three experiments. Note that in these experiments, the maxi- mum preincubation time with calyculin A was 14 min, as opposed to 20 min in Fig. 7 where inhibition of basal uptake was produced by
at any concentration tested. When incubated for 20 min with calyculin A.
22124 GLUTl and GLUT4 Overexpression in L6 Myoblasts
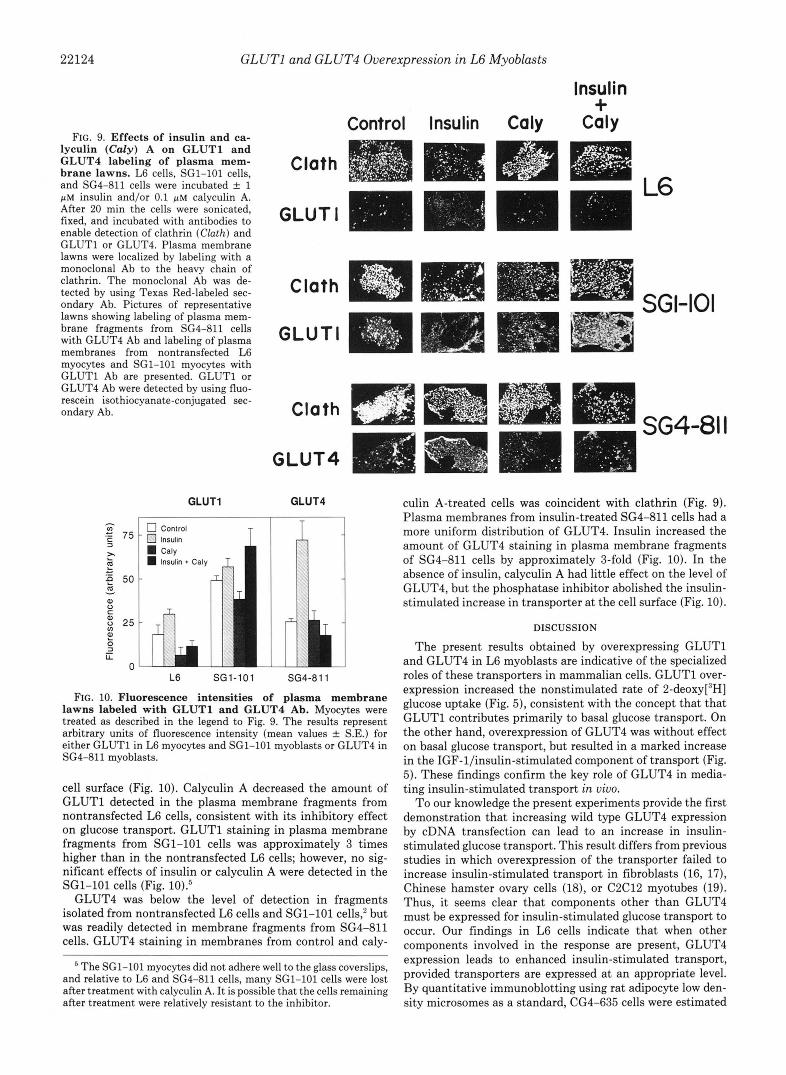
FIG. 9. Effects of insulin and ca- lyculin (Caly) A on GLUTl and GLUT4 labeling of plasma mem- brane lawns. L6 cells, SG1-101 cells, and SG4-811 cells were incubated f 1 pM insulin and/or 0.1 pM calyculin A. After 20 min the cells were sonicated, fixed, and incubated with antibodies to enable detection of clathrin (Clath) and GLUTl or GLUT4. Plasma membrane lawns were localized by labeling with a monoclonal Ab to the heavy chain of clathrin. The monoclonal Ab was de- tected by using Texas Red-labeled sec- ondary Ab. Pictures of representative lawns showing labeling of plasma mem- brane fragments from SG4-811 cells with GLUT4 Ab and labeling of plasma membranes from nontransfected L6 myocytes and SG1-101 myocytes with GLUTl Ab are presented. GLUTl or GLUT4 Ab were detected by using fluo- rescein isothiocyanate-conjugated sec- ondary Ab.
GLUTl
1 L6 S G I - I O 1
Insulin + Control Insulin Caly Coly
SGI-IO1
Cloth
GLUT4
SG4-81 I
GLUT4
SG4-8 1 1
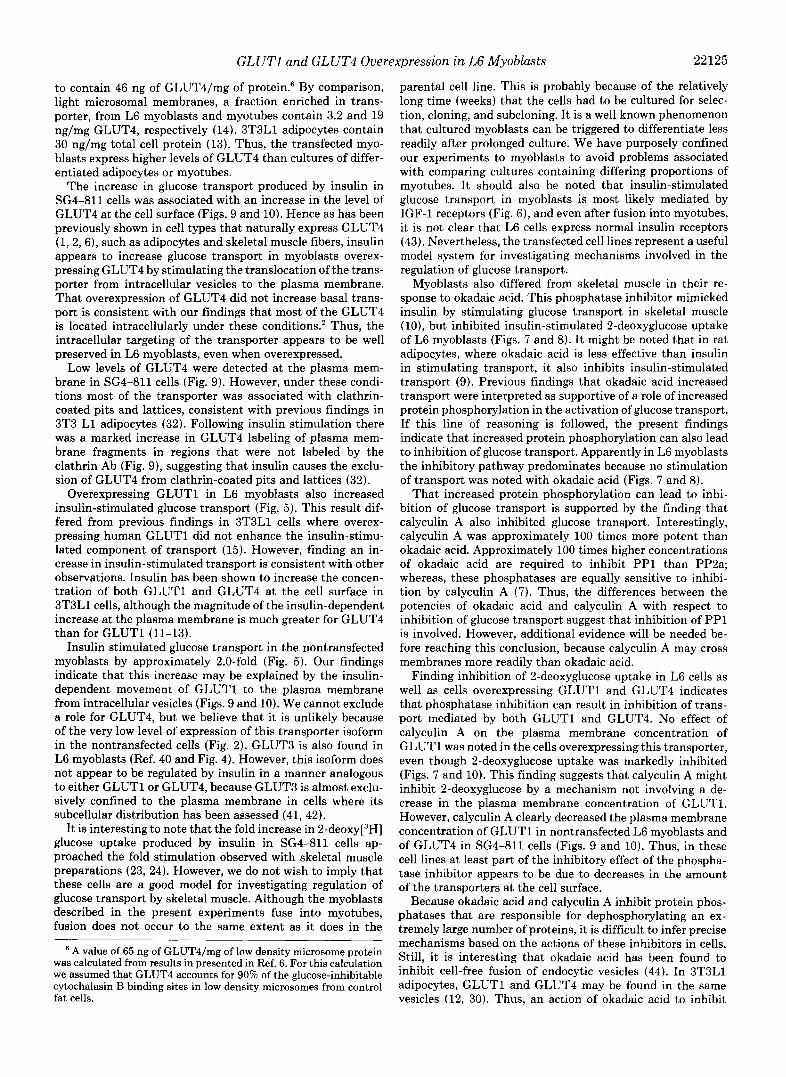
FIG. 10. Fluorescence intensities of plasma membrane l awns labeled with GLUTl a n d GLUT4 Ab. Myocytes were treated as described in the legend to Fig. 9. The results represent
either GLUTl in L6 myocytes and SG1-101 myoblasts or GLUT4 in arbitrary units of fluorescence intensity (mean values f S.E.) for
SG4-811 myoblasts.
cell surface (Fig. 10). Calyculin A decreased the amount of GLUTl detected in the plasma membrane fragments from nontransfected L6 cells, consistent with its inhibitory effect on glucose transport. GLUTl staining in plasma membrane fragments from SG1-101 cells was approximately 3 times higher than in the nontransfected L6 cells; however, no sig- nificant effects of insulin or calyculin A were detected in the SG1-101 cells (Fig. 10):
GLUT4 was below the level of detection in fragments isolated from nontransfected L6 cells and SG1-101 cells: but was readily detected in membrane fragments from SG4-811 cells. GLUT4 staining in membranes from control and caly-
' The SG1-101 myocytes did not adhere well to the glass coverslips, and relative to L6 and SG4-811 cells, many SGl-101 cells were lost after treatment with calyculin A. It is possible that the cells remaining after treatment were relatively resistant to the inhibitor.
culin A-treated cells was coincident with clathrin (Fig. 9). Plasma membranes from insulin-treated SG4-811 cells had a more uniform distribution of GLUT4. Insulin increased the amount of GLUT4 staining in plasma membrane fragments of SG4-811 cells by approximately 3-fold (Fig. 10). In the absence of insulin, calyculin A had little effect on the level of GLUT4, but the phosphatase inhibitor abolished the insulin- stimulated increase in transporter at the cell surface (Fig. 10).
DISCUSSION
The present results obtained by overexpressing GLUTl and GLUT4 in L6 myoblasts are indicative of the specialized roles of these transporters in mammalian cells. GLUTl over- expression increased the nonstimulated rate of 2-de0xy[~H] glucose uptake (Fig. 5), consistent with the concept that that GLUTl contributes primarily to basal glucose transport. On the other hand, overexpression of GLUT4 was without effect on basal glucose transport, but resulted in a marked increase in the IGF-l/insulin-stimulated component of transport (Fig. 5). These findings confirm the key role of GLUT4 in media- ting insulin-stimulated transport in uiuo.
To our knowledge the present experiments provide the first demonstration that increasing wild type GLUT4 expression by cDNA transfection can lead to an increase in insulin- stimulated glucose transport. This result differs from previous studies in which overexpression of the transporter failed to increase insulin-stimulated transport in fibroblasts (16, 17), Chinese hamster ovary cells (l8), or C2C12 myotubes (19). Thus, it seems clear that components other than GLUT4 must be expressed for insulin-stimulated glucose transport to occur. Our findings in L6 cells indicate that when other components involved in the response are present, GLUT4 expression leads to enhanced insulin-stimulated transport, provided transporters are expressed at an appropriate level. By quantitative immunoblotting using rat adipocyte low den- sity microsomes as a standard, CG4-635 cells were estimated
G L U T l and GLUT4 Overexpression in L6 Myoblasts 22125
to contain 46 ng of GLUT4/mg of protein.6 By comparison, light microsomal membranes, a fraction enriched in trans- porter, from L6 myoblasts and myotubes contain 3.2 and 19 ng/mg GLUT4, respectively (14). 3T3Ll adipocytes contain 30 ng/mg total cell protein (13). Thus, the transfected myo- blasts express higher levels of GLUT4 than cultures of differ- entiated adipocytes or myotubes.
The increase in glucose transport produced by insulin in SG4-811 cells was associated with an increase in the level of GLUT4 at the cell surface (Figs. 9 and 10). Hence as has been previously shown in cell types that naturally express GLUT4 (1,2,6), such as adipocses and skeletal muscle fibers, insulin appears to increase glucose transport in myoblasts overex- pressing GLUT4 by stimulating the translocation of the trans- porter from intracellular vesicles to the plasma membrane. That overexpression of GLUT4 did not increase basal trans- port is consistent with our findings that most of the GLUT4 is located intracellularly under these conditions.* Thus, the intracellular targeting of the transporter appears to be well preserved in L6 myoblasts, even when overexpressed.
Low levels of GLUT4 were detected at the plasma mem- brane in SG4-811 cells (Fig. 9). However, under these condi- tions most of the transporter was associated with clathrin- coated pits and lattices, consistent with previous findings in 3T3 L1 adipocytes (32). Following insulin stimulation there was a marked increase in GLUT4 labeling of plasma mem- brane fragments in regions that were not labeled by the clathrin Ab (Fig. 9), suggesting that insulin causes the exclu- sion of GLUT4 from clathrin-coated pits and lattices (32).
Overexpressing GLUTl in L6 myoblasts also increased insulin-stimulated glucose transport (Fig. 5). This result dif- fered from previous findings in 3T3L1 cells where overex- pressing human GLUTl did not enhance the insulin-stimu- lated component of transport (15). However, finding an in- crease in insulin-stimulated transport is consistent with other observations. Insulin has been shown to increase the concen- tration of both GLUTl and GLUT4 at the cell surface in 3T3L1 cells, although the magnitude of the insulin-dependent increase at the plasma membrane is much greater for GLUT4 than for GLUTl (11-13).
Insulin stimulated glucose transport in the nontransfected myoblasts by approximately 2.0-fold (Fig. 5 ) . Our findings indicate that this increase may be explained by the insulin- dependent movement of GLUTl to the plasma membrane from intracellular vesicles (Figs. 9 and 10). We cannot exclude a role for GLUT4, but we believe that it is unlikely because of the very low level of expression of this transporter isoform in the nontransfected cells (Fig. 2). GLUT3 is also found in L6 myoblasts (Ref. 40 and Fig. 4). However, this isoform does not appear to be regulated by insulin in a manner analogous to either GLUTl or GLUT4, because GLUT3 is almost exclu- sively confined to the plasma membrane in cells where its subcellular distribution has been assessed (41, 42).
I t is interesting to note that the fold increase in 2-de0xy[~H] glucose uptake produced by insulin in SG4-811 cells ap- proached the fold stimulation observed with skeletal muscle preparations (23, 24). However, we do not wish to imply that these cells are a good model for investigating regulation of glucose transport by skeletal muscle. Although the myoblasts described in the present experiments fuse into myotubes, fusion does not occur to the same extent as it does in the
A value of 65 ng of GLUT4/mg of low density microsome protein was calculated from results in presented in Ref. 6. For this calculation we assumed that GLUT4 accounts for 90% of the glucose-inhibitable cytochalasin B binding sites in low density microsomes from control fat cells.
parental cell line. This is probably because of the relatively long time (weeks) that the cells had to be cultured for selec- tion, cloning, and subcloning. I t is a well known phenomenon that cultured myoblasts can be triggered to differentiate less readily after prolonged culture. We have purposely confined our experiments to myoblasts to avoid problems associated with comparing cultures containing differing proportions of myotubes. It should also be noted that insulin-stimulated glucose transport in myoblasts is most likely mediated by IGF-1 receptors (Fig. 6), and even after fusion into myotubes, it is not clear that L6 cells express normal insulin receptors (43). Nevertheless, the transfected cell lines represent a useful model system for investigating mechanisms involved in the regulation of glucose transport.
Myoblasts also differed from skeletal muscle in their re- sponse to okadaic acid. This phosphatase inhibitor mimicked insulin by stimulating glucose transport in skeletal muscle (IO), but inhibited insulin-stimulated 2-deoxyglucose uptake of L6 myoblasts (Figs. 7 and 8). It might be noted that in rat adipocytes, where okadaic acid is less effective than insulin in stimulating transport, it also inhibits insulin-stimulated transport (9). Previous findings that okadaic acid increased transport were interpreted as supportive of a role of increased protein phosphorylation in the activation of glucose transport. If this line of reasoning is followed, the present findings indicate that increased protein phosphorylation can also lead to inhibition of glucose transport. Apparently in L6 myoblasts the inhibitory pathway predominates because no stimulation of transport was noted with okadaic acid (Figs. 7 and 8).
That increased protein phosphorylation can lead to inhi- bition of glucose transport is supported by the finding that calyculin A also inhibited glucose transport. Interestingly, calyculin A was approximately 100 times more potent than okadaic acid. Approximately 100 times higher concentrations of okadaic acid are required to inhibit PP1 than PP2a; whereas, these phosphatases are equally sensitive to inhibi- tion by calyculin A (7). Thus, the differences between the potencies of okadaic acid and calyculin A with respect to inhibition of glucose transport suggest that inhibition of PPI is involved. However, additional evidence will be needed be- fore reaching this conclusion, because calyculin A may cross membranes more readily than okadaic acid.
Finding inhibition of 2-deoxyglucose uptake in L6 cells as well as cells overexpressing GLUTl and GLUT4 indicates that phosphatase inhibition can result in inhibition of trans- port mediated by both GLUTl and GLUT4. No effect of calyculin A on the plasma membrane concentration of GLUTl was noted in the cells overexpressing this transporter, even though 2-deoxyglucose uptake was markedly inhibited (Figs. 7 and 10). This finding suggests that calyculin A might inhibit 2-deoxyglucose by a mechanism not involving a de- crease in the plasma membrane concentration of GLUT1. However, calyculin A clearly decreased the plasma membrane concentration of GLUTl in nontransfected L6 myoblasts and of GLUT4 in SG4-811 cells (Figs. 9 and 10). Thus, in these cell lines at least part of the inhibitory effect of the phospha- tase inhibitor appears to be due to decreases in the amount of the transporters at the cell surface.
Because okadaic acid and calyculin A inhibit protein phos- phatases that are responsible for dephosphorylating an ex- tremely large number of proteins, it is difficult to infer precise mechanisms based on the actions of these inhibitors in cells. Still, it is interesting that okadaic acid has been found to inhibit cell-free fusion of endocytic vesicles (44). In 3T3L1 adipocytes, GLUTl and GLUT4 may be found in the same vesicles (12, 30). Thus, an action of okadaic acid to inhibit
22126 GLUT1 and GLUT4 Overexpression in L6 Myoblasts
vesicle fusion could lead to decreased concentrations of both transporters in the plasma membrane.
The nontransfected L6 cells used in the present experi- ments expressed endogenous GLUT1, but little GLUT4, even after fusion into myotubes.2 In this respect the present cells differ from those studied by Klip and co-workers (20, 22). This difference most likely is attributable to the fact that the L6 cells used by various groups have diverged significantly. We have found that primary cultures of rat myotubes express little, if any, GLUT4.2 Therefore, the failure of the parent L6 cells to express GLUT4 is not a unique property of an abnor- mal cell line. Rather, it is likely a reflection of the fact that muscle cells in culture do not fully differentiate. In this regard, it might be noted that nontransfected C2C12 myotubes failed to express significant levels of GLUT4 (19).
Factors such as innervation that have an important role in muscle differentiation in vivo are absent in culture. Dener- vation of skeletal muscle markedly decreases both insulin- stimulated glucose transport (23) and the level of GLUT4 (45). The present findings support the conclusion that a deficit of GLUT4 partly explains the relatively small stimu- lation of glucose transport by insulin in denervated skeletal muscle in vivo and in uninnervated muscle cells in vitro.
Acknowledgments-We thank Xianming Kong and Elise Tegt- meyer for expert technical assistance.
REFERENCES
2. 1.
3.
4. 5.
6.
7 .
8.
9.
10.
11.
Silverman, M. (1991) Annu. Reu. Biochem. 6 0 , 757-794 Pessin, J. E., and Bell, G. I. (1992) Annu. Reu. Physiol. 5 4 , 911-930 Mueckler, M., Caruso, C., Baldwin, S., Panico, M., Blench, I., Morris, H.
941-945 R., Allard, W. J., Lienhard, G. E., and Lodish, H. F. (1985) Science 2 2 9 ,
James, D. J., Strube, M., and Mueckler, M. (1989) Nature 338,83-87 James, D. E., Brown, R., Navarro, J., and Pilch, P. F. (1988) Nature 3 3 3 ,
Simpson, I. A., and Cushman, S. W. (1986) Annu. Reu. Biochem. 56,1059-
Shinolikar, S., and Nairn, A. C. (1991) Adu. Second Messenger Phospho-
Haystead, T. A. J., Sim, A. T. R., Carling, D., Honnor, R. C., Tsuikitani,
Lawrence, J. C., Jr., Hiken, J. F., and James, D. E. (1990) J. Biol. Chem.
Tanti, J.-F., Gremeaux, T., Van Obberghen, E., and Le Marchand-Brustel,
Zorzano, A,, Wilkinson, W., Kotliar, N., Thoidis, G., Wadzinkski, B. E.,
183-185
1089
protein Res. 23 , 1-121
Y., Cohen, P., and Hardie, D. G. (1989) Nature 337,78-81
265,19768-19776
Y. (1991) J. Biol. Chem. 266,2099-2103
Ruoho, A,, and Pilch, P. F. (1989) J. Biol. Chem. 264,12358-12363
12. Piper, R. C., Hess, L. J., and James, D. E. (1991) Am. J. Physiol. 2 6 0 , c.57n-c.5811
13. Calderhead. D.. Kitacawa. K.. Tanner. L.. Holman. G.. and Lienhard. G. " _ _
14. 15.
16.
17.
E. (1990) J. bid. chem.'265, 13800-13808 '
Mitsumoto, Y., and Klip, A. (1992) J. Bid. Chem. 267,4957-4962 Harmon, S. A,, Buxton, J. M., Clancy, B. M., and Czech, M. P. (1990) J.
Haney, P. M., Slot, J. W., Piper, R. C., James, D. E., and Mueckler, M.
Hudson, A. W., Ruiz, M. L., and Birnbaum, M. J. (1992) J. Cell Biol. 116 ,
Biol. Chem. 265,20106-20116
(1991) J. Cell. Biol. 114 , 689-699
7 R K - 7 4 7
18. Asano, T., Takata, K., Katagiri, H., Tsukuda, K., Lin, J.-L., Isbihara, H.,
267,19636-19641 Inukai, K., Hirano, H., Yazaki, Y., and Oka, Y. (1992) J. Biol. Chem.
."" ,",
19. Kotliar, N., and Pilch, P. F. (1992) Mol. Endocrinol. 6 , 337-345 20. Klip,,A., Li, G., and Logan, W. J. (1984) Am. J. Physiol. 2 4 7 , E291-E296 21. Bermmot. F.. Kahn. C. R.. Moses. A. C.. and Smlth. R. J. (1986) J. Bid.
&em. 260; 15892-15898
J. E., and Klip, A. (1990) J. Biol. Chem. 265,1516-1523
2207
(1984) Am. J. Physiol. 2 4 6 , E476-E482
Proc. at1 Acad Scr. U. S. A. 85,5649-5653
22. Walker, P. S., Ramlal, T., Sarabia, V., Koivisto, U.-M., Bilan, P. J., Pessin,
23. Smith, R. L., and Lawrence, J. C., Jr. (1984) J. B~ol. Chem. 2 5 9 , 2201-
24. Richter, E. A., Garetto, L. P., Goodman, M. N., and Ruderman, N. B.
25. Fuhlbrigae, R C., Fine, S. M., Unanue, E. R., and Chaplin, D. D. (1988)
26. Lawrence, J. C., and Catterall, W. A. (1981) J. Biol. Chem. 256,6213-6222 27. Laemmli, U. K. (1970) Nature 227,680-685 28. Lawrence. J. C.. Jr.. Hiken. J. F.. and James. D. E. (1990) J. Biol. Chem. , ,
265,2324-2332 29. Bo le, W. A,, and Nerbonne, J. M. (1991) Am. J. Physiol. 260 , H1236-
Xl?*7 30. Robinson, L. J., and James, D. E. (1992) Am J. Physiol. 2 6 3 , E383-E393 31. Smith, P. K., Krohn, R. I., Hermanson, G. T., Mallia, A. K., Gartner, F.
H., Provenzano, M. D., Fu'imoto, E K , Goeke, N. M., Olson, B. J., and
32. Robinson, L. J., Pang, S., Harris, D. S., Heuser, J., and James, D. E. (1992) Klenk, D. C. (1985) Anal. hiochern. '150, 76-85
33. Moore. M. S.. Mahaffev. D. T.. Brodskv. F. M.. and Anderson. R. G. W. J. Cell Biol. 117 , 1181-1196
"" ~.
.~ ~~~~~~
(198jj Scieke236~~j58-563' 34. Lawrence, J. C., Jr., Piper, R. C., Robinson, L. J., and James, D. E. (1992)
35. Brodsky, F. M. (1985) J. Cell Biol. 101,2047-2054 36. Zapf, J.. Froescb. E. R., and Humbel, R. E. (1981) Curr. Top. Cell. Regul.
Proc. Natl. Acad. Sci. U. S. A. 8 9 , 3493-3497
37. Czech,M. P.-(1982) Cell 31,8-10 38. Bilan P. J. Ramlal T. and Klip, A. (1991) in Molecular Biolo y and
Ph$siolog; of Zmukn dnd Insulin-like Growth Factors (Raizada, %I. K., and LeRoith, D., eds) pp. 273-288, Plenum Press, New York
39. Chartier, L., Rankin, L. L., Allen, R. E., Kato, Y., Fusetani, N., Karaki, H., Watabe, S., and Hartshorne, D. J. (1991) Cell Motil. Cytoskeleton 18 ,
40.
41.
42.
Bilan, P. J., Mitsumoto, Y., Maher, F., Simpson, I. A., and Klip, A. (1992) 26-40
Harris, D. S., S c t , J. W.; Geuze, H. J., and James, D. E. (1992) Proc. Natl. Bwchem. Bio hys Res Commun. 186,1129-1137
Asano T., Katagiri H. Takata, K., Tsukuda, K., Lin, J. L., Ishihara, H., Acad. Sci. U. S. A. 8 9 , 7556-7560
Inukai, K., Hiraio, H.. Yazaki, Y., and Oka, Y. (1992) Biochem J. 2 8 8 ,
43. Burant, C. F., Treutelaar, M. K., Allen, K. D., Sens, D. A,, and Buse, M.
44. Woodman, P. G., Mundy, D. I., Cohen, P., and Warren, G. (1992) J . Cell
45. Block, N. E., Menick, D. R., Robinson, K. A,, and Buse, M. G. (1991) J.
189-193
G. (1987) Biochim. Biophys. Acta 147,100-107
Biol. 116,331-338
Clin. Znuest. 88, 1546-1552