Embed Size (px)
DESCRIPTION
Globalizing India. Dev Nathan Institute for Human Development New Delhi Duke University, USA. Why Economic Growth?. For itself? As means to human development ? Two measures Economic development – GDP or GDP per capita Human development – HDI - PowerPoint PPT Presentation
Citation preview
Globalizing India
Dev NathanInstitute for Human Development
New DelhiDuke University, USA
Why Economic Growth?
• For itself?• As means to human development?
• Two measures– Economic development – GDP or GDP per capita– Human development – HDI
• Is there a relation between GDP (GNI) and HDI?
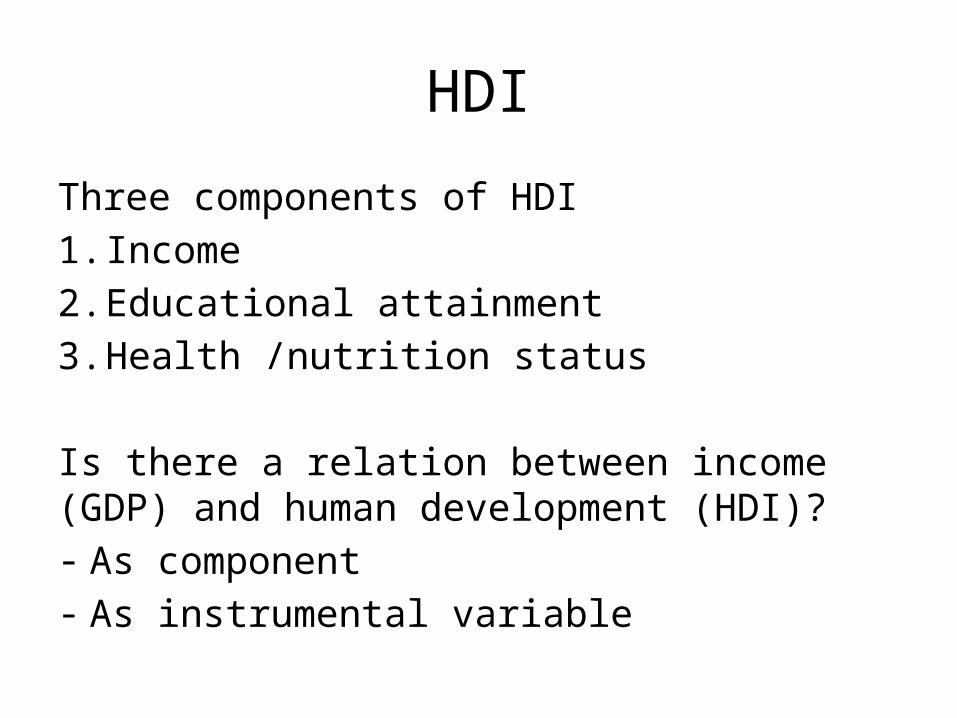
HDI
Three components of HDI1. Income2. Educational attainment3. Health /nutrition status
Is there a relation between income (GDP) and human development (HDI)? - As component- As instrumental variable
0 10000 20000 30000 40000 50000 60000 70000 80000 90000 100000 110000 1200000.0
0.1
0.2
0.3
0.4
0.5
0.6
0.7
0.8
0.9
1.0
1.1
0.547
0.687
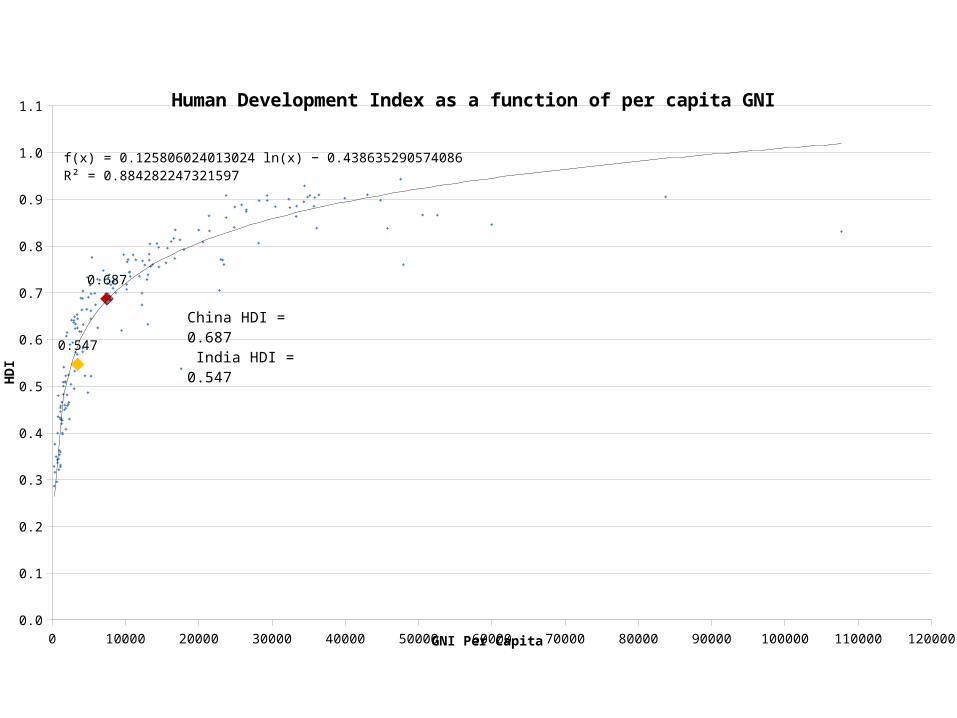
f(x) = 0.125806024013024 ln(x) − 0.438635290574086R² = 0.884282247321597
Human Development Index as a function of per capita GNI
GNI Per Capita
HDI
China HDI = 0.687 India HDI = 0.547
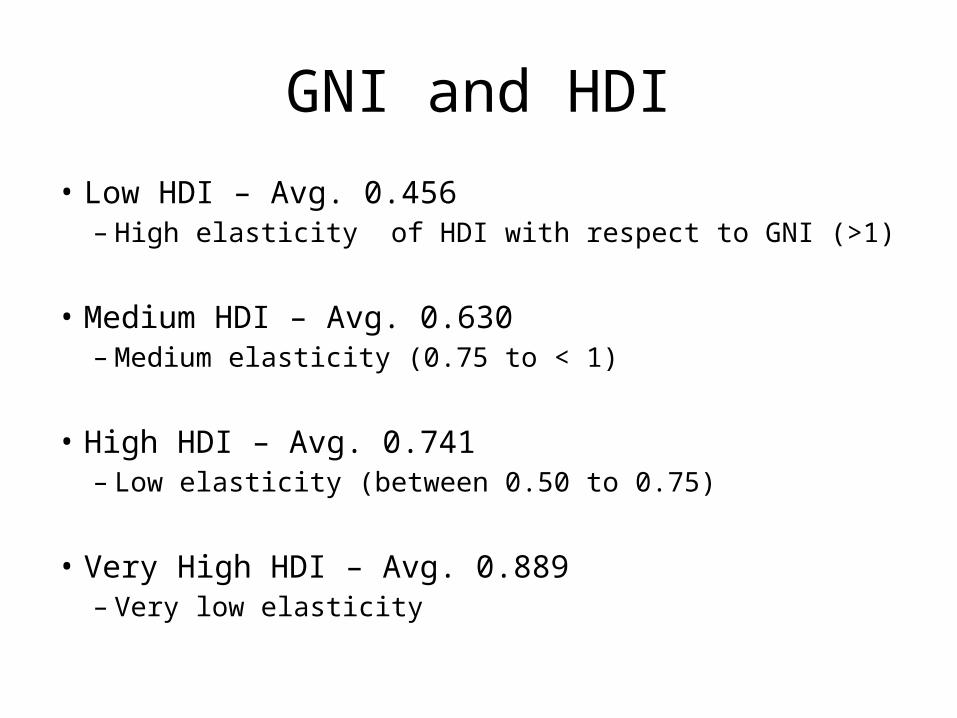
GNI and HDI
• Low HDI – Avg. 0.456 – High elasticity of HDI with respect to GNI (>1)
• Medium HDI – Avg. 0.630– Medium elasticity (0.75 to < 1)
• High HDI – Avg. 0.741– Low elasticity (between 0.50 to 0.75)
• Very High HDI – Avg. 0.889– Very low elasticity
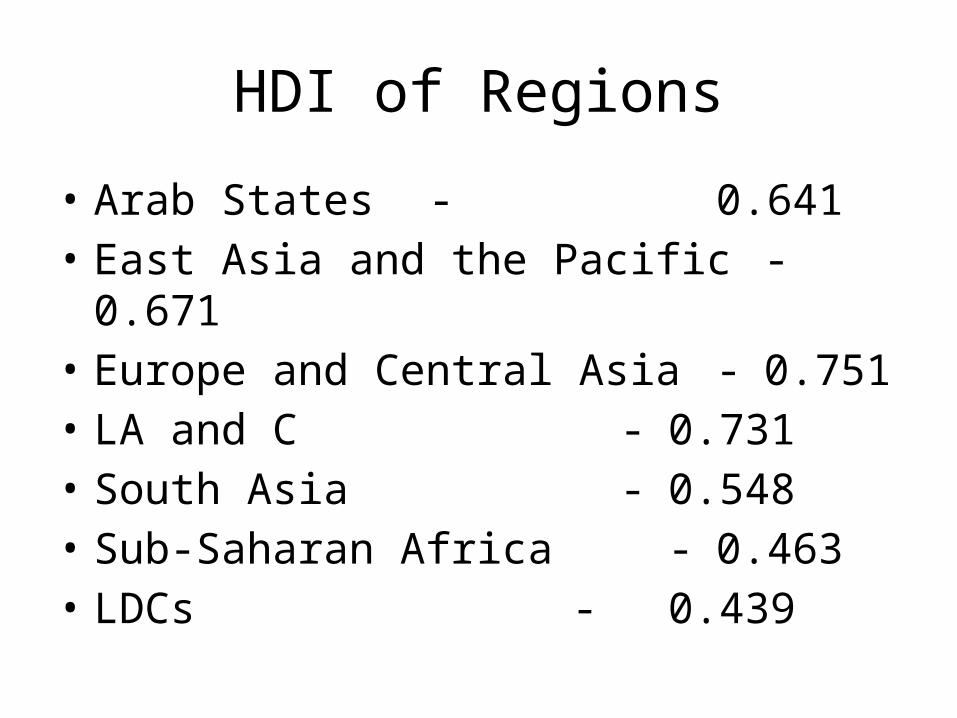
HDI of Regions
• Arab States - 0.641
• East Asia and the Pacific - 0.671• Europe and Central Asia - 0.751• LA and C -
0.731• South Asia -
0.548• Sub-Saharan Africa - 0.463• LDCs -
0.439
Does we need economic growth for human development?
• Distinguish between countries at different HDI levels
• Need for growth falls with increase in HDI
• Our need for growth as instrumental to human development is different from the need of capital to grow
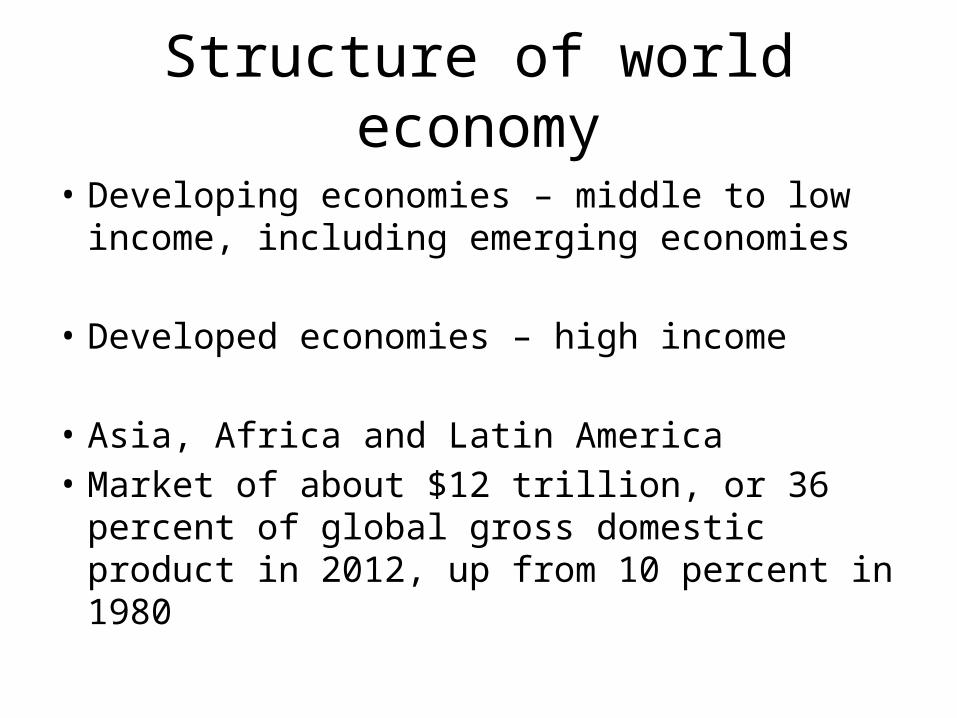
Structure of world economy
• Developing economies – middle to low income, including emerging economies
• Developed economies – high income
• Asia, Africa and Latin America• Market of about $12 trillion, or 36 percent of
global gross domestic product in 2012, up from 10 percent in 1980
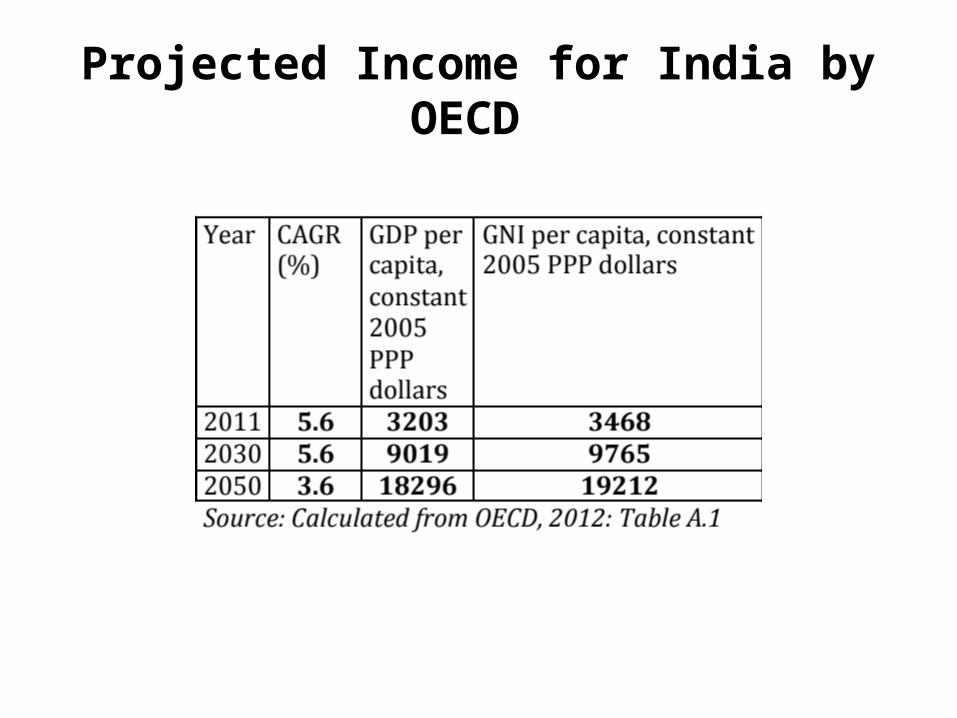
Projected Income for India by OECD
Size of economies
• GDP - per capita income and population size
• With population more than thrice that of USA, at one-third the per capita income, the Chinese and Indian economies will be larger than that of the US
• In PPP terms even earlier
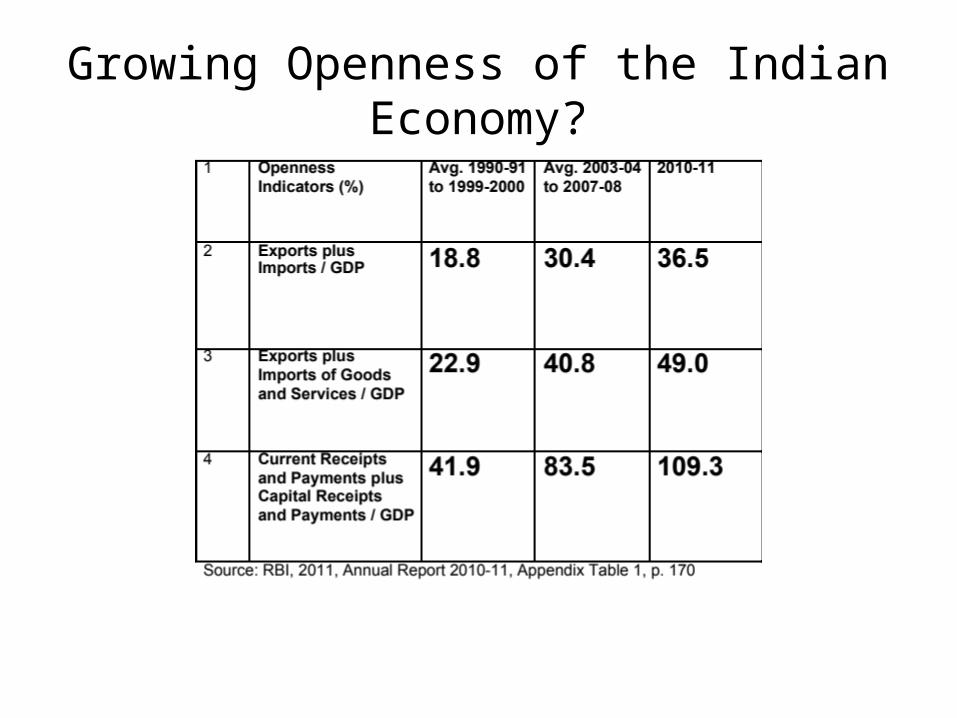
Growing Openness of the Indian Economy?
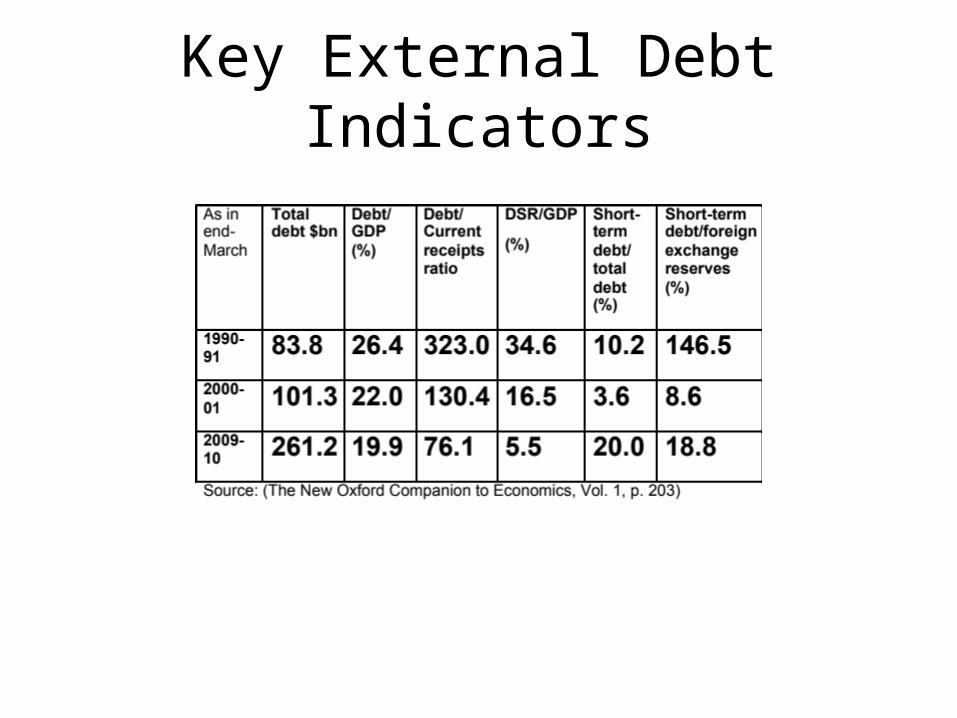
Key External Debt Indicators
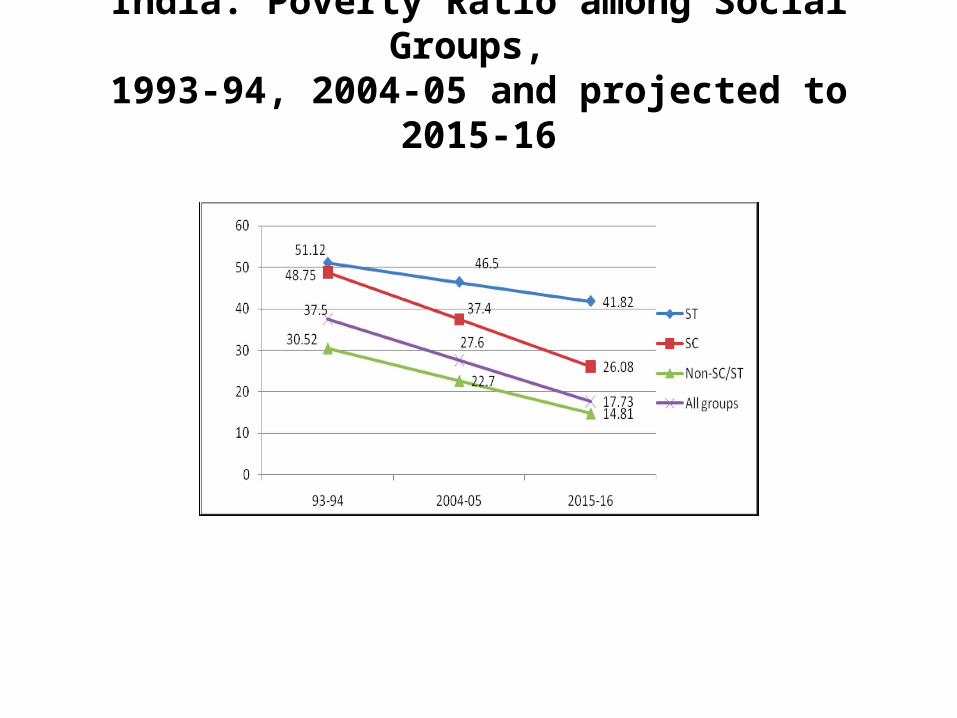
India: Poverty Ratio among Social Groups, 1993-94, 2004-05 and projected to 2015-16