Embed Size (px)
Citation preview

Working Papers in Trade and Development
Global Production Sharing in the Japanese
Automobile Industry: A Comparative Analysis
Shuhei Nishitateno
March 2012 Working Paper No. 2012/02
Arndt Corden Department of Economics Crawford School of Economics and Government
ANU College of Asia and the Pacific


Global Production Sharing in the Japanese
Automobile Industry: A Comparative Analysis
Shuhei Nishitateno Arndt-Corden Department of Economics
Crawford School of Economics and Government ANU College of Asia and the Pacific
Corresponding Address : Shuhei Nishitateno Coombs Building 9
Arndt-Corden Department of Economics Crawford School of Economics and Government
Australian National University Canberra, ACT 0200
Email: [email protected]
March 2012 Working paper No. 2012/02

This Working Paper series provides a vehicle for preliminary circulation of research results in the fields of economic development and international trade. The series is intended to stimulate discussion and critical comment. Staff and visitors in any part of the Australian National University are encouraged to contribute. To facilitate prompt distribution, papers are screened, but not formally refereed.
Copies may be obtained at WWW Site http://www.crawford.anu.edu.au/acde/publications/

Global Production Sharing in the Japanese Automobile Industry: A Comparative Analysis
Shuhei Nishitateno
Arndt-Corden Department of Economics Crawford School of Economics and Government
College of Asia and the Pacific Australian National University
Abstract This paper undertakes a comparative study of global production sharing by automakers in Japan, the United States and Western Europe, with emphasis on the interlocking relationships among Japanese automakers and parts suppliers within keiretsu networks in determining global production sharing of Japanese automakers. The findings suggest that the extent and modality of production sharing by Japanese automakers are significantly different compared to their counterparts in the United States and Western Europe. In particular, for Japanese automakers overseas production by their subsidiary plants is far less important in determining parts and components exports from Japan, given the general tendency of their part suppliers to internationalise their operations following the automakers. Keywords: Global production sharing, keiretsu, automobile industry JEL classification: F14, L23

1
Global Production Sharing in the Japanese Automobile Industry: A Comparative Analysis
1. INTRODUCTION
Global production sharing i
Production sharing is particularly important for automakers due to the nature of the product. A car
is composed of thousands of parts and components (P&C, hereafter), ranging from engine components to
power-train, steering, suspension, brakes, wheels/tyres, exterior/interior trim, and body electronic
components. It is not efficient for automakers to produce all these components in-house because of
diseconomies of scale and capacity limitation.
- intra-product specialisation where the production process is sliced into
discrete activities which are then allocated across multiple countries - has been a central feature of the
automobile industry over past decades. The production process of automobiles is made of marketing,
design, testing, pressing, welding, painting, parts production, assembly, logistics, sales and so on. Initially,
all of these steps were geographically concentrated and internalised by automakers. However, this
integrated production process began to separate as technological developments in transportation and
communication made long-distance transactions feasible (Dicken 2003). Furthermore, the development of
information technology and the liberalisation of trade and investment have dramatically reduced
communication and transaction costs, enabling automakers to outsource an increasing amount of their
production process abroad and organise their value chains globally.
The modality and intensity of production sharing with parts suppliers varies according to
automakers. The important feature of production sharing by Japanese automakers is the high dependence
on their parts suppliers based on a long-standing relationship.ii This Japanese-style of production sharing
has been called a ‘hybrid’ system, making it possible to gain benefits from both vertical integration and

2
market forces and contributing to the competitiveness of Japanese automakers (Williamson 1979,
Womack et al 2007).
The objective of this study is to examine the hypothesis that this unique characteristics of the
production system and supplier relationships in Japan matter in determining the extent and modality of
production sharing. Specifically, the roles of the ‘following-leader’ pattern of Japanese overseas
investment (i.e. suppliers’ investments following automakers’ investment abroad) and of interlocking
relationships among firms (keiretsu networks) in determining the trade in P&C, are analysed. In order to
highlight these unique characteristics, the role of global production operations of Japanese automakers in
determining trade in P&C are compared with automakers headquartered in the United States, Germany,
France, Italy and Sweden.
Research on Japan’s peculiarity has so far focused solely on bilateral trade with the United
States and Western European countries (Fung 1991, Lawrence 1991). However, there is little research
that compares Japanese experiences with those of other countries (Encarnation 1992, Diehl 2001). This
study contributes to the latter in two ways. This is the first comparative analysis involving an econometric
exercise. The existing literature has been limited to descriptive analysis. This study also analyses a newly-
constructed product-level dataset that makes it possible to control for product-specific characteristics that
might affect trade flows but are difficult to capture (Head et al 2004).
My methodology involves estimating an augmented version of a gravity equation using three-
dimensional panel data covering 6 traditional auto-producing countries: Japan, the United States,
Germany, France, Italy, and Sweden (hereafter, TPCs), 49 auto-producing countries, and 90 auto parts
over the 7-year period from 2002 to 2008. The automakers headquartered in TPCs are the key players that
spread production networks worldwide therefore the performance of other TPCs becomes a benchmark by
which to examine Japan’s unique features. It is important to incorporate multiple countries into an
analysis because the leading automobile producers are expanding production networks encompassing not

3
only developed countries but also developing countries especially newly auto-producing countries
(hereafter, NPCs). The period from 2002 to 2008 is chosen for the study due to data availability.
The plan for this chapter is as follows. Section 2 summarises the historical process of production
sharing by the Japanese automobile industry followed by discussion of the unique features of global
production sharing by Japanese automakers relative to automakers in the United States and Western
Europe. In Section 3, the econometric approach, variable construction, and data issues are discussed.
Section 4 reports the results. Section 5 concludes.
2. GLOBAL PRODUCTION SHARING
This section overviews the process of production sharing in the Japanese automobile industry and reveals
the characteristics in comparison with other TPCs. First, it is shown that the ratio of Japan’s P&C trade to
total (domestic + overseas) production by Japanese automakers is much smaller than that of other TPCs,
suggesting that Japanese automakers are less involved in global production sharing. Second, I discuss
possible factors that affect this feature, focusing on the keiretsu networks and following-leader pattern of
investments.
The Process
At the formative stage, automobile production in Japan was characterised as craftsmanship and the
production process was entirely internalised by automakers. Every auto part was customised and the
chassis and body were made by hand. In addition, the limited scale of the domestic market and
underdeveloped supporting industries prevented automakers from developing production sharing at this
stage (Nihon Jidosha Kogyokai 1988).
Production sharing began in the 1930s and 1940s when the wartime economy caused
skyrocketing military demand for motor vehicles and Japanese automakers subcontracted some auto parts
production to independent suppliers as a convenient means of meeting the rapid surges in demand

4
(Nishiguchi 1994).iii This production sharing process was reinforced by technological development in
machine tools and development in infrastructure such as national transportation and communication
systems, alleviating transaction costs between automakers and parts suppliers. Government policy
intervention also mattered. In 1940, the Ministry of Commerce and Industry issued the Rationalisation
Outline of the Machinery and Iron and Steel Industries, which was aimed at restructuring the anarchic
subcontracting in the Japanese manufacturing industry (Nishiguchi 1994).
Production sharing was orchestrated through a just-in-time delivery system adopted by Japanese
automakers in the 1960s and 1970s. In the case of Toyota, the just-in-time system was first introduced in
1954 and had spread to every Toyota factory by 1963. In addition, the just-in-time system began bringing
in first-tier suppliers in the 1960s and the just-in-time system was completed in the late 1970s after the oil
shocks (Fujimoto 1999).
In the 1960s production sharing with parts suppliers expanded toward not only parts production
but also their designs and R&D. The advent of motorisation that led to growing demand for passenger
vehicles encouraged Japanese automakers to move into offering a full line of products by increasing the
number of basic platforms. This product proliferation meant that workloads increased rapidly, not only in
production but also in product development (Fujimoto 1999). Japanese automakers expanded the range of
outsourcing to parts suppliers in order to reduce such workload pressure.
The Japanese automobile industry has experienced global production sharing since the middle of
the 1980s when Japanese automakers began to increase overseas production as a response to political
pressure from the US and Western European governments arising from trade frictions (Figure 1). The
unprecedented appreciation of the Japanese yen accelerated the reallocation from exporting to producing
abroad further. In the course of internationalisation, Japanese automakers have established international
production networks, leading to the development of global production sharing that increases cross-border
transactions of P&C.

5
-Figure 1 about here-
Global production sharing takes four forms. iv The first is an intra-firm transaction between
automakers’ headquarters in Japan and their overseas plants. Second is an inter-firm transaction between
headquarters’ plants of suppliers in Japan and automakers’ overseas plants. Third is an intra-firm
transaction between headquarters’ plants of suppliers in Japan and their overseas plants. This is the case
where a headquarter plant of a supplier in Japan ships sub-components and materials to its overseas
affiliate and the affiliate assembles them into the final product supplied to automakers in a given country.
Fourth is an inter-firm transaction between headquarters’ plants of automakers in Japan and the overseas
plants of suppliers. This is the case where an overseas affiliate of a supplier directly ships its products to
automakers’ plants in Japan.
Figure 2 shows the trend of P&C trade in Japan and its ratio to total (domestic + overseas)
production by Japanese automakers. As can be seen, Japan experienced a rapid increase in trade in P&C
from 24 billion US dollars in 1988 to 89 billion US dollars in 2008. The development of global
production sharing becomes more apparent when looking at the ratio of trade in P&C to total production
by Japanese automakers, which indicates the dependence of production sharing across borders.v That the
ratio tends to rise over the past two decades indicates that the growth of trade in P&C has been faster than
that of automobile production by Japanese automakers.
-Figure 2 about here-
However, the most interesting feature of global production sharing in the Japanese automobile
industry lies in its limited extent when comparing with others. Although trade in P&C in Japan and its
ratio to total production by Japanese automakers is growing, the ratio has been much lower than that of

6
other TPCs (Figure 3). Sweden and Italy were the top two countries, followed by Germany, France and
the United States. Japan was at the bottom in both 2001/2 and 2007/8.vi
-Figure 3 about here-
The limited degree of global production sharing in Japan is largely explained by the import side.
The value of P&C imports to Japan has remained much smaller than exports, leading to a substantial trade
surplus over time in automobile P&C. Japan’s import value has also been continuously smaller than those
of all other TPCs except for Sweden over the past two decades.vii The existing literature argues that the
existence of a unique vertical network called keiretsu - a long-standing business relationship between an
automaker and its parts suppliers through personnel exchange, cross-share holding, and information
sharing - makes it difficult for foreign companies to penetrate the Japanese market (Lawrence 1991 and
Qiu and Spencer 2002). Due to the strong automaker-supplier relationship in Japan, companies outside
the production network would face a cost disadvantage in selling their products to insiders of networks.
The empirical issue is whether keiretsu networks create trade among insiders of networks across
borders. Theory predicts that the strong assembler-supplier relationship in Japan facilitates reverse
imports from Japanese affiliates in a host country because it reduces market entry costs for the insiders of
production networks (Greaney 2003). Greaney (2005, 2009) and Head et al (2004) present empirical
evidence that the existence of a keiretsu network facilitates reverse imports from Japanese firms abroad,
suggesting that the network trade plays an important role in determining Japan’s imports. However, the
increase in Japan’s auto parts imports might be explained by global sourcing adopted by Japanese
automakers since the middle of the 1990s. The shift toward global sourcing has encouraged Japanese
automakers to procure auto parts from the most competitive company anywhere in the world, suggesting
an increase in auto parts trade with companies outside networks.

7
Another possible factor that explains the limited degree of global production sharing by
Japanese automakers lies in the export side. It is well established that when Japanese automakers build
production plants abroad, they attempt to transplant the efficient supplier relationships forged in Japan to
achieve their competitive advantages such as the just-in-time inventory system and quality control. As a
result, Japanese parts suppliers follow automakers’ investment abroad (Head et al 1995, Blonigen et al
2005). This following-leader pattern of Japanese investments seems to substitute auto parts exports from
Japan to the extent that exporting and investments are alternative strategies for suppliers. Blonigen (2001)
and Head et al (2004) show empirical evidence that there exists a substitution relationship between auto
parts exports from Japan and Japanese suppliers’ investment abroad.
3. EMPIRICAL ANALYSIS
This section examines the roles of the ‘following-leader’ pattern of Japanese overseas investment and
vertical keiretsu networks in determining the trade in P&C by estimating an augmented version of a
gravity model with three-dimensional panel data. I first discuss the model specification followed by a
discussion on variable construction and data sources.
Model
The gravity equation has become the ‘work-horse’ for modeling bilateral trade flows. In empirical studies
the gravity equation normally takes a stochastic form in order to allow for other factors impacting on
trade flows. Also, the multiplicative nature of the gravity equation enables taking natural logs to obtain a
constant-elasticity relationship between dependent and independent variables as follows;
𝑙𝑛𝑇𝑖𝑗 = 𝛼1 + 𝛼2𝑙𝑛𝑀𝑖 + 𝛼3𝑙𝑛𝑀𝑗 + 𝛼4𝑙𝑛𝐷𝑖𝑗 + 𝜀𝑖𝑗 (1)
where 𝛼1 is a constant term and 𝜀𝑖𝑗 is a stochastic error term assumed to be statistically independent of the
regressors. Although the gravity equation explains bilateral trade flows between economies well with just
the sizes of the economies and their distances, there is a huge amount of variation in trade that cannot be

8
explained. Therefore, the gravity equation is often augmented with variables such as GDP per capita,
adjacency, common language and other variables of interest.
For the purpose of this study, the basic gravity model is augmented by adding a number of other
variables, which are discussed here. Overseas production (OSP) allows for the role of production
networks in determining trade in P&C for TPCs and its coefficient is expected to be positive, suggesting
the existence of global production sharing. Domestic auto production (DAP) is included to capture the
market size and supply capacity of auto parts instead of GDP, which is another essential variable of a
gravity equation. Because the dependent variables are specific to trade in auto parts, domestic auto
production is a more appropriate variable to capture its market size.viii Real per capita GDP (PGDP) is
used to allow for the fact that more developed countries have better ports and communication systems and
other trade-related infrastructure as well as better institutional arrangements for contract enforcement that
facilitate trade. Adjacency (ADJ) and common language (LAN) between countries are included to control
for country-specific characteristics that might affect trade flow. The real exchange rate (RER) is included
to capture the relative competitiveness of traded-goods between economies.
A Japan dummy (JAP) is included to see whether Japan’s trade pattern of P&C is different from
that of other TPCs conditional on the other variables included in the model. The sign of the coefficient is
expected to be different between exports and imports. However, the real importance lies in the
interpretation of the coefficient. Controlling for overseas production (OSP) that captures cross-border
transactions among companies within networks, a positive coefficient would imply Japan’s P&C trade is
more related to arm’s-length transactions compared with other TPCs. The interaction term (JAP×OSP) is
the key variable in the model because it allows for testing the key hypothesis in this study. The coefficient
for exports is expected to be negative, suggesting the ‘following-leader’ pattern of Japanese overseas
investment substitutes P&C exports from Japan. The coefficient for imports is expected to be positive,
implying that vertical keiretsu networks facilitate P&C imports into Japan.

9
A set of year dummy variables (T) is included to control for time-varying effects such as
technological changes in automobile industries. The inclusion of a set of regional dummy variables (R) is
important to control for regional differences such as free trade areas and historical links within regions.
The importance of regional linkage is reflected in the high intensity of intra-regional trade. A set of host-
country dummy variables (C) is included to control for unobservable country-specific characteristics such
as trade and industry polices in the host country.
The augmented version of the gravity equation is:
ln𝑇_𝑃&𝐶𝑖,𝑗,𝑡 = 𝛼 + β1ln𝑂𝑆𝑃𝑖,𝑗,𝑡 + β2ln𝐷𝐴𝑃𝑖,𝑡 + β3ln𝐷𝐴𝑃𝑗,𝑡 + β4ln𝐷𝐼𝑆𝑖,𝑗 + β5ln𝑃𝐺𝐷𝑃𝑖,𝑡 +
β6ln𝑃𝐺𝐷𝑃𝑗,𝑡 + β7𝐴𝐷𝐽𝑖,𝑗 + β8𝐿𝐴𝑁𝑖,𝑗 + β9ln𝑅𝐸𝑅𝑖,𝑗,𝑡 + β10 𝐽𝐴𝑃𝑖 + β11�𝐽𝐴𝑃𝑖 × ln𝑂𝑆𝑃𝑖,𝑗,𝑡� +
𝛿𝑇 + 𝜔𝑅 + 𝜕𝐶 + 𝑢𝑖,𝑗,𝑡 (2)
where subscript i stands for sample countries including Japan, the United States, Germany, France, Italy,
and Sweden, j stands for trading partners covering 49 countries worldwide and t stands for the years from
2002 to 2008.ix The ln before variables stands for the natural logarithm. The dependent variable (T_P&C)
has three different forms of real bilateral trade values of parts and components: (1) total trade, (2) exports,
and (3) imports. The independent variables are listed and defined below, with the expected signs of the
regression coefficients given in brackets:
OSP Overseas production in country j by automobile producers headquartered in country i (+) DAP Domestic auto production in country i and country j (+) DIS Distance between capital cities in country i and country j (-) PGDP Real per capita GDP in country i and country j (+) ADJ A binary variable assuming the value 1 if country i and country j share a common land border
and 0 otherwise (+) LAN A binary variable assuming the value 1 if country i and country j share a common official
language and 0 otherwise (+) RER An index of bilateral real exchange rate which measures the international competitiveness of
country i against country j (+or-) JAP A binary variable assuming the value 1 if country i is Japan and 0 otherwise (+or-) T A set of time dummy variables R A set of regional dummy variables

10
C A set of host country dummy variables α A constant term u A stochastic error term
Data and estimation method
Data on domestic auto production (DAP) are extracted from the website of the International Organisation
of Motor Vehicle Manufacturers, which provides information on the volume of motor vehicle production
in each country. Real per capita GDP (PGDP) measured in $US at constant 2005 prices is from the World
Development Indicators. Distance (DIS), adjacency (ADJ), and common language (LAN) between
countries are obtained from the CEPII database. Distance is measured using the geographical coordinates
of the capital cities. The adjacency dummy variable indicates whether the two countries are contiguous.
The common language is a dummy variable indicating whether countries share a common official
language. The real exchange rate (RER) is constructed based on the formula,
𝑅𝐸𝑅𝑖𝑗 = 𝑁𝐸𝑅𝑖𝑗 ∗ (𝑃𝑗𝑤/𝑃𝑖𝐷)
where NER is the nominal exchange rate index, 𝑃𝑊 is the producer price measured by the wholesale price
index, and 𝑃𝐷 is the domestic price measured by the GDP deflator. These data are obtained from the
World Development Indicators.
Data on overseas production (OSP) are obtained from the International Organisation of Motor
Vehicle Manufacturers, which provides information on production volume by manufacturer and country.
Using these data, I calculate overseas production in each trading country by automobile producers
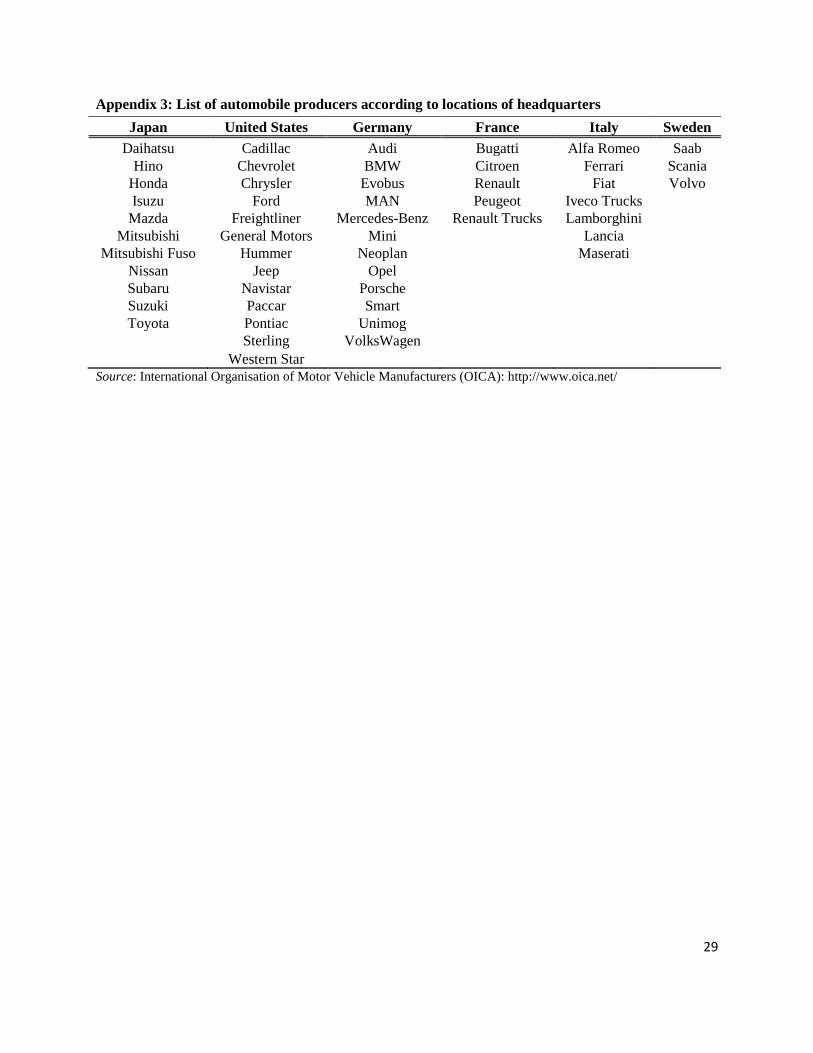
headquartered in the TPCs. The automobile producers classified by the location of their headquarters are
listed in Appendix 3. While a classification based on ownership would be more appropriate, this study
does not employ such a classification for two reasons. First is the difficulty because there are wide
varieties of degree of ownership and alliances.x In addition, the degree of ownership has changed over
time and alliances between automakers have sometimes been dissolved.xi On the other hand, the locations
of their headquarters can be easily identified because they normally do not move even when merged into

11
another company (e.g. Opel has been headquartered in Germany). Second, the ownership-based
calculation might lead to more measurement error, causing a biased and inconsistent estimator. As an
example, take the Nissan (Japanese auto maker) and Renault (French automobile producer) alliance, in
which Nissan owns a 15% Renault share and Renault owns a 44% Nissan share. Suppose that Nissan has
an overseas plant in Thailand but Renault does not. If Nissan is regarded as a subsidiary of Renault,
Nissan’s overseas plant in Thailand belongs to Renault. This treatment is able to capture the impact of
intra-firm trade between Renault’s headquarters in France and the overseas plant in Thailand on trade in
P&C between France and Thailand. However, it fails to capture the impact of intra-firm trade between
Nissan’s headquarters in Japan and the overseas plant in Thailand on bilateral trade between Japan and
Thailand. Since the latter has a more significant implication for bilateral trade in P&C, the measurement
based on their headquarters’ location is more appropriate rather than one based on ownership.
A detailed list of variable definitions and data sources is provided in Appendix 4. Summary
statistics are presented in Table 1.
-Table 1 about here-
The model is estimated by the fixed effect model (FEM) that controls for host country-specific
characteristics and time effects by adding dummy variables. The selection of estimation model between
the FEM and the random effect model (REM) is based on the underlying assumption: the FEM allows the
unobserved host country effects to be correlated with explanatory variables whereas the REM does not
(Wooldridge 2002). In this study, it is suspected that unobserved country-specific factors such as trade
and industry policy in the host country are strongly correlated with overseas production of the automakers
(Head and Ries 2001). Historically, the import-substitution policy in the developing countries and the
creation of a free trade area has played an important role in encouraging automakers to set up production
plants in the host country. This leads to superiority of the FEM over the REM.xii

12
Estimation is carried out in two steps. The first is to estimate determinants of total trade (exports
+ imports) in order to see the impact of production networks on total P&C trade as well as Japan’s unique
features controlling for other relevant variables. The second step is to estimate determinants of exports
and imports, separately. This treatment matters because the overseas production of Japanese automakers
is expected to have different effects on exports and imports as already discussed. Overseas production of
Japanese automakers induces Japanese suppliers’ investment to substitute exports of P&C from Japan. On
the other hand, the expansion of global production networks might increase reverse imports from insiders
of the vertical keiretsu networks.
4. RESULTS
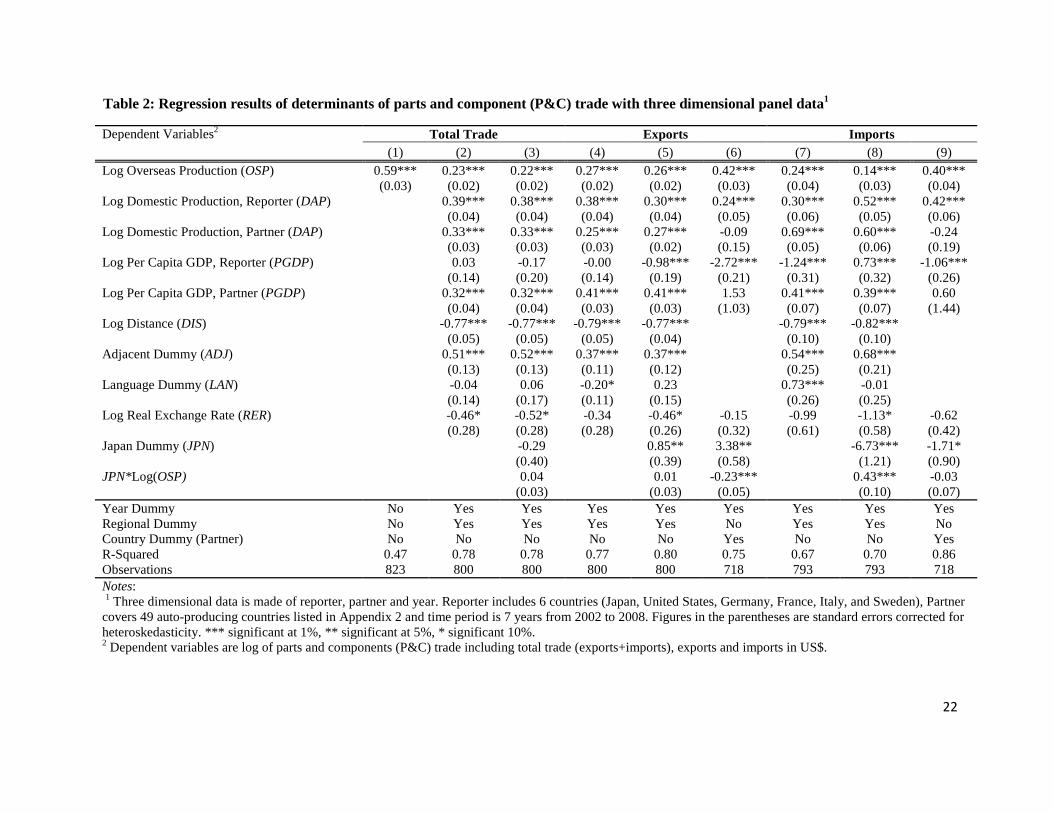
Table 2 reports the augmented gravity equation estimated using three-dimensional panel data. With 6
sample countries, 49 trading partners, and the 7 years from 2002 to 2008 and allowing for missing
observations, the estimates are based on 823 observations for total trade, 800 for exports and 793 for
imports.
-Table 2 about here-
The first three columns show estimates for total trade. As can be seen in the first column, the
coefficient of overseas production (OSP), which captures the impact of cross-border production networks
on total trade in P&C, is positive and significant as expected. This suggests the existence of a causal
relationship between production networks and P&C trade. This result is robust to adding other relevant
variables to the estimating equation (Column 2). After controlling for the relevant variables, on average, a
1% expansion of overseas production by automobile producers leads to a 0.23% increase in P&C trade
with that trade partner for TPCs. The interpretation is that global production sharing plays an important

13
role in determining trade flows. The coefficients of the two central gravity variables have expected signs
with significant levels. Auto production for both reporter and partner are positive and a highly significant
predictor of bilateral trade in auto parts.xiii Distance is negative and significant at the 1 per cent level,
reflecting the importance of proximity for trade. The positive and significant coefficient of the adjacency
dummy supports the importance of geographical clusters in the automobile industry. The coefficient of
partners’ GDP per capita is a positive and significant predictor of bilateral trade whereas that of reporters’
counterpart is statistically insignificant. This unexpected result is not meaningful because reporters, that
are TPCs, are all developed countries with better ports and communications systems and other trade-
related infrastructure as well as better institutional arrangements for contract enforcement that facilitate
trade. Common language does not seem to be an important determinant of trade in P&C. This is not
surprising because a global sourcing that procures auto parts from the most competitive company
anywhere in the world has been a common strategy among global automakers and suppliers. The
coefficient of the real exchange rate (RER) is negative and significant at the 10 percent level. However,
the interpretation is not suggestive because the dependent variable includes both exports and imports.
The third column shows results when the Japan dummy (JAP) and its interaction term with
overseas production (JAP×Log (OSP)) are added. Both coefficients are not statistically significant,
suggesting the pattern of Japan’s total P&C trade is not different from that of the other TPCs. However, it
remains unclear about Japan’s uniqueness because the focus so far has been on total trade (exports +
imports). More importantly, as discussed above, the overseas production of Japanese automakers is
expected to have different implications for auto parts exports and imports, respectively. It would seem,
therefore, that further investigation is needed by estimating determinants of exports and imports
separately.
The fourth to sixth columns of Table 2 show estimates related to exports. The fourth column,
controlling for gravity and other relevant variables, shows a similar result to that for total trade in the

14
second column. The effect of overseas production is positive and significant at the 1 percent level,
predicting that a 1% expansion of overseas production leads to an increase in P&C exports to that country
by 0.27%. The interpretation is that a cross-border transaction within networks plays an important role in
determining P&C exports for TPCs. The fifth column shows results when the Japan dummy (JAP) and its
interaction term with overseas production (JAP×Log (OSP)) are added. The coefficient of the Japan
dummy is positive and significant at the 5 percent level, suggesting that, after allowing for the other
relevant variables, on average, Japan exports more P&C than other TPCs. However, the coefficient of the
interaction term is statistically insignificant. The sixth column reports the results when country dummy
variables are added to control for time-invariant aspects of industrial policy of individual host countries
(partners).xiv This variable addition is justified because the relationship between overseas production and
trade flows could well be influenced by country-specific distortions in trade and industry policy. With this
specification, the coefficient of the interaction term between the Japan dummy and overseas production
(JAP×Log (OSP)) becomes negative and significant at the 1 percent level. The result suggests that the
magnitude of the interlink between Japan’s P&C exports and overseas production by Japanese
automakers is 0.23 percentage points smaller comparing with the magnitude of the average relationship
estimated for all TPCs. The interpretation is as follows: import substitution and local content requirement
policies in host countries encourage automakers to build plants in these countries and parts suppliers to
follow them. As discussed above, following-leader investment that probably substitutes a direct supply of
P&C for exports from home country, is more prevalent among Japanese automakers and their suppliers in
comparison with the case of the US and European counterparts.
The seventh to ninth columns of Table 2 show estimates related to imports. Interestingly, the
results are very similar to those for exports. The coefficient of overseas production (OSP) is positive and
significant in all three equations, suggesting that production networks facilitate imports of P&C. Overall,
the gravity variables are statistically significant with the expected signs. However, the signs of the
coefficients of the Japan dummy (JAP) and its interaction term with overseas production (JAP×Log

15
(OSP)) are different from those of the exports equations. As can be seen in the eighth column, the
coefficient of the Japan dummy is negative and significant at the 1 percent level and that of the interaction
term is positive and highly significant. Japan’s P&C imports is 6.73% smaller but the interlink between
Japan’s P&C imports and overseas production by Japanese car makers is 0.43 percentage points larger
than is the case for other TPCs.
The ninth column shows the result when country dummies are added as in the case of exports.
The coefficient of the Japan dummy is still negative and significant (10 percent level) whereas that of the
interaction term becomes insignificant. However, the result might implicitly reflect Japan’s smaller
involvement with arms-length transactions with companies outside networks comparing with those of
other TPCs. This is because the negative coefficient of the Japan dummy controlling for overseas
production probably captures the role of cross-border production sharing with companies outside
networks. That is to say, the result implies that the proportion of P&C imports that Japan is engaging with
global production sharing within networks is higher than for the counterparts of other TPCs.
On the other hand, another interpretation of the result in the ninth column is possible. The
development of information technology and its prevalence are facilitating a shift in the assembler-supplier
relationships in Japan from the closed form with stability to the open form with flexibility (Steffensen
1998). For example, the CAD/CAM (computer-aided design and computer-aided manufacturing) and
Japanese automotive Network eXchange (JNX) would reduce the communication and transaction costs
when overseas suppliers do business with Japanese automakers.xv Therefore, the increase in Japan’s auto
parts imports might be attributed to growth in overseas procurement beyond the keiretsu networks by
Japanese automakers, leading to a smaller difference in global production sharing between Japanese
automakers and the US and European automakers.

16
5. CONCLUSION
In this paper, I have undertaken a comparative analysis of global production sharing by automakers in
Japan, the United States and Western Europe, with emphasis on the roles of the following-leader pattern
of Japanese overseas investment and interlocking relationships among firms (keiretsu networks) in
determining global production sharing of Japanese automakers. The results suggest that the relationship
between parts and components exports from home country and overseas production is much weaker for
the Japanese automakers compared to their counterparts headquartered in the United States, Germany,
France, Italy and Sweden. This finding is consistent with following-leader relationship between Japanese
automakers and their part suppliers. By contrast, no such statistically significant difference in the
relationship between imports of parts and components to the home country and overseas production. This
implies the overseas procurement patterns among automakers in TPCs are more similar than before.
The findings of this study in relation to the following-leader patterns of overseas operations of
Japanese automakers are consistent with those of Blonigen (2001). That study focused solely on the
experiences of Japan, while a specific focus on the relationship between overseas part suppliers and final
assemblers. However, this study has placed this unique feature of global operations of Japanese
automakers in comparative perspective. Nevertheless, the findings in this study and Blonigen (2001)
could complement each other to support the existence of the following-leader pattern of investments by
parts suppliers.
ACKOWLEDGEMENT
I am grateful for comments from Prema-Chandra Athukorala, Hodaka Morita, and Paul Burke.

17
NOTES i In the recent literature an array of alternative terms have been used to describe this phenomenon
including ‘fragmentation’ and ‘international outsourcing’ (Jones and Kierzkowski 1990, Helpman 2006).
ii Production sharing in the US automobile industry is characterised as vertical integration through
mergers and acquisitions of parts suppliers. On the other hand, production sharing in the European
automobile industry is characterised as arm’s length-transactions through the market. See Shimokawa
(1994) for more information.
iii For example, Toyota found it necessary to externalise part of their production activities, leading to
increasing reliance on purchasing from parts suppliers: the share of purchased parts in the manufacturing
cost per vehicle was 51% in 1936 but had risen to 66% by 1939 (Nishiguchi 1994).
ivThis paper focuses on the production sharing between headquarters and overseas subsidiaries. Although
global production sharing could also facilitate trade in P&C among their overseas subsidiaries, this study
is not able to capture it due to data limitations.
v The total auto production by automakers represents the demand size of auto parts therefore the ratio
suggests the degree of global production sharing for each automaker.
vi This limited degree of global production sharing by Japanese automakers can be observed using the
share of P&C in total automobile trade (P&C + final goods), which is commonly used as an indicator of
the intensity of global production sharing (Yeats 1998, Athukorala and Yamashita 2006). In 2007/8,
Sweden (57%) was a top country which has the largest share of P&C in total automobile trade, followed
by France (51%), Italy (49%), Germany (45%) and the United States (44%). Japan was at the bottom with
a 38% share.
vii In 2007/8, the United States (105 billion US$) was a top importer of automobile P&C, followed by
Germany (74 billion), France (39 billion), Italy (22 billion), Japan (19 billion) and Sweden (13 billion).
viii I thank Theresa M. Greaney for this point.
ix Refer to Appendix 2 for the list of 49 trading partners.

18
x For example, while Opel, a German carmaker, has been a complete subsidiary of General Motors since
1929, Mazda, a Japanese automobile producer, has been more loosely allied with Ford.
xi For example, Chrysler, a US carmaker was purchased by Daimler Benz, a German car maker, creating a
combined entity, DaimlerChrysler in 1998. However, this alliance was dissolved in 2007.
xii I acknowledge that the FEM has disadvantages (Wooldridge 2002). First, the introduction of many
variables into the model reduces the degrees of freedom. Second, as the number of independent variables
increases, the problem of multicollinearity is more likely to arise. Third, the FEM makes it difficult to
identify the impacts of time-invariant variables such as distance, language, and adjacency.
xiii Reporter includes 6 TPCs (Japan, United States, Germany, France, Italy, and Sweden) and partner
includes 49 auto-producing countries.
xiv I exclude regional dummy variables and variables to capture country specific characteristics such as
distance, adjacent dummy and language dummy.
xv On the contrary, Morita and Nakahara (2004) show that the information-technology revolution can
strengthen several aspects of vertical networks.

19
REFERENCES
Athukorala, P.C., Yamashita, N., 2006. Production fragmentation and trade integration: East Asia in a global context. The North American Journal of Economics and Finance 17, 233-256.
Blonigen, B.A., 2001. In search of substitution between foreign production and exports. Journal of. International Economics 53, 81-104.
Blonigen, B.A., Ellis, C. J., Fausten, D., 2005. Industrial groupings and foreign direct investment. Journal of International Economics 65, 75– 91.
Dicken, P., 2003. Global Shift: Reshaping the Global Economic Map in the 21st Century. New York: The Guilford Press.
Diehl, M., 2001. International Trade in Intermediate Inputs: The Case of the Automobile Industry. Kiel Working Paper, No. 1027.
Encarnation, D. J., 1992. Rivals Beyond Trade: America versus Japan in Global Competition. New York: Cornel University Press.
Fujimoto, T., 1999. The Evolution of a Manufacturing System at Toyota. New York: Oxford University Press.
Fung, K.C., 1991. Characteristics of Japanese industrial groups and their potential impact on US-Japan trade. In: Baldwin, R. (Eds.). Empirical Studies of Commercial Policy. Chicago: University of Chicago Press, 137-168.
Greaney, T. M., 2003. Reverse Importing and Asymmetric Trade and FDI: A Networks Explanation. Journal of International Economics 61, 453-465.
Greaney, T.M., 2005. Measuring network effects on trade: Are Japanese affiliates distinctive?. Journal of Japanese and International Economics 19, 194-214.
Greaney, T.M., 2009. Measuring network effects on trade: A reexamination. Japan and the World Economy 21, 219-225.
Head, K., Ries, J., Swenson, D., 1995. Agglomeration benefits and location choice: Evidence from Japanese manufacturing investments in the United States. Journal of International Economics 38, 223-247.
Head, K., Ries, J., 2001. Overseas Investment and Firm Exports. Review of International Economics 9, 108-122.
Head, K., Ries, J., Spencer, B.J., 2004. Vertical Networks and Auto Parts Exports: Is Japan different? Journal of Economics and Management Strategy 13, 37-67.
Helpman, E., 2006. Trade, FDI, and the Organization of Firms. Journal of Economics Literature XLIV, 589-630.

20
Jones, R.W., Kierzkowski, H., 1990. The Role of Services in Production and International Trade: A Theoritical Framework. In: Jones, R., Krueger, A.O., (Eds.). The Political Economy of International Trade: Essays in Honor of Robert E. Baldwin. Oxford: Basil Blackwell, 31-47.
Lawrence, R.Z., 1991. Efficient or Exclusionist?: The Import Behavior of Japanese Corporate Groups. Brookings Papers on Economic Activity 1, 311-330.
Morita, H., Nakahara, H., 2004. Impacts of the Information-Technology Revolution on Japanese Manufacturer-Supplier Relationships. Journal of the Japanese and International Economics 18, 390-415.
Nihon Jidosha Kogyokai [Japan Automobile Manufacturers Association (JAMA)]., 1988. Nihon jidosha sangyoshi [History of Japanese automobile history]. Tokyo: Nihon Jidosha Kogyokai.
Nishiguchi, T., 1994. Strategic Industrial Sourcing: the Japanese Advantage. New York: Oxford University Press.
Qiu, L.D., Spencer, B.J., 2002. Keiretsu and Relationship-Specific Investment: Implications for Market-Opening Trade Policy. Journal of International Economics 58, 49-79.
Shimokawa, K., 1994. The Japanese Automobile Industry: A Business History. London: The Athlone Press.
Steffensen, S.K., 1998. Informational network industrialization and Japanese business management. Journal of Organizational Change Management 11, 515-529.
Williamson, O, E., 1979. Transaction-Cost Economics: The Governance of Contractual Relations. The Journal of Law and Economics 22, 233-261.
Womack, J.P., Jones, D.T., Roos, D., 2007. The Machine That Changed the World: The Story of Lean Production-- Toyota's Secret Weapon in the Global Car Wars That Is Now Revolutionizing World Industry. New York: Free Press.
Wooldridge, J.M., 2002. Econometric Analysis of Cross Section and Panel Data. Cambridge, Massachusetts and London: The MIT Press.
Yeats, A.J., 1998. Just How Big is Global Production Sharing? Policy Research Working Paper 1871, Washington, DC: The World Bank.

21
Table 1: Summary statistics1
Variables Units Mean Standard Deviation Min Max
Log P&C Total Trade2 US$ 19.52 2.29 7.62 24.78 Log P&C Exports US$ 18.96 2.22 7.62 24.32 Log P&C Imports US$ 17.87 3.37 4.9 23.99 Log Domestic Production, Reporter Volume 14.99 1.24 4.36 16.32 Log Domestic Production, Partner Volume 12.79 2.19 4.36 16.32 Log Overseas Production Volume 10.94 2.29 0.69 15.03 Log Per Capita GDP, Reporter US$ 10.23 0.25 9.88 10.61 Log Per Capita GDP, Partner US$ 8.68 1.3 5.91 10.61 Log Distance km 8.35 1.06 5.16 9.83 Log Real Exchange Rate Index 4.61 0.14 4.04 5.14 Adjacency Dummy Binary 0.07 0.25 0 1 Common-Language Dummy Binary 0.06 0.24 0 1 Japan Dummy Binary 0.16 0.37 0 1
Notes: 1 The summary statistics are for three dimensional data (reporter, partner, year). Reporter includes 6 countries (Japan, United States, Germany, France, Italy, and Sweden), Partner covers 49 auto-producing countries listed in Appendix 2 and time period is 7 years from 2002 to 2008.Three dimensional dataset (reporter, partner and year) Time period is 7 years from 2002 to 2008. 2 P&C stand for parts and components. Total trade is exports plus imports.
22
Table 2: Regression results of determinants of parts and component (P&C) trade with three dimensional panel data1
Dependent Variables2 Total Trade Exports Imports (1) (2) (3) (4) (5) (6) (7) (8) (9)
Log Overseas Production (OSP) 0.59*** 0.23*** 0.22*** 0.27*** 0.26*** 0.42*** 0.24*** 0.14*** 0.40*** (0.03) (0.02) (0.02) (0.02) (0.02) (0.03) (0.04) (0.03) (0.04) Log Domestic Production, Reporter (DAP) 0.39*** 0.38*** 0.38*** 0.30*** 0.24*** 0.30*** 0.52*** 0.42*** (0.04) (0.04) (0.04) (0.04) (0.05) (0.06) (0.05) (0.06) Log Domestic Production, Partner (DAP) 0.33*** 0.33*** 0.25*** 0.27*** -0.09 0.69*** 0.60*** -0.24 (0.03) (0.03) (0.03) (0.02) (0.15) (0.05) (0.06) (0.19) Log Per Capita GDP, Reporter (PGDP) 0.03 -0.17 -0.00 -0.98*** -2.72*** -1.24*** 0.73*** -1.06*** (0.14) (0.20) (0.14) (0.19) (0.21) (0.31) (0.32) (0.26) Log Per Capita GDP, Partner (PGDP) 0.32*** 0.32*** 0.41*** 0.41*** 1.53 0.41*** 0.39*** 0.60 (0.04) (0.04) (0.03) (0.03) (1.03) (0.07) (0.07) (1.44) Log Distance (DIS) -0.77*** -0.77*** -0.79*** -0.77*** -0.79*** -0.82*** (0.05) (0.05) (0.05) (0.04) (0.10) (0.10) Adjacent Dummy (ADJ) 0.51*** 0.52*** 0.37*** 0.37*** 0.54*** 0.68*** (0.13) (0.13) (0.11) (0.12) (0.25) (0.21) Language Dummy (LAN) -0.04 0.06 -0.20* 0.23 0.73*** -0.01 (0.14) (0.17) (0.11) (0.15) (0.26) (0.25) Log Real Exchange Rate (RER) -0.46* -0.52* -0.34 -0.46* -0.15 -0.99 -1.13* -0.62 (0.28) (0.28) (0.28) (0.26) (0.32) (0.61) (0.58) (0.42) Japan Dummy (JPN) -0.29 0.85** 3.38** -6.73*** -1.71* (0.40) (0.39) (0.58) (1.21) (0.90) JPN*Log(OSP) 0.04 0.01 -0.23*** 0.43*** -0.03 (0.03) (0.03) (0.05) (0.10) (0.07) Year Dummy No Yes Yes Yes Yes Yes Yes Yes Yes Regional Dummy No Yes Yes Yes Yes No Yes Yes No Country Dummy (Partner) No No No No No Yes No No Yes R-Squared 0.47 0.78 0.78 0.77 0.80 0.75 0.67 0.70 0.86 Observations 823 800 800 800 800 718 793 793 718 Notes: 1 Three dimensional data is made of reporter, partner and year. Reporter includes 6 countries (Japan, United States, Germany, France, Italy, and Sweden), Partner covers 49 auto-producing countries listed in Appendix 2 and time period is 7 years from 2002 to 2008. Figures in the parentheses are standard errors corrected for heteroskedasticity. *** significant at 1%, ** significant at 5%, * significant 10%. 2 Dependent variables are log of parts and components (P&C) trade including total trade (exports+imports), exports and imports in US$.

23
Figure 1: Total production of Japanese automakers, 1945-2008
Notes: Total production consists of domestic production and overseas production. The gray bar shows domestic production volume of Japanese automakers. The black bar shows overseas production volume of Japanese automakers. Data on overseas production before 1985 are not available. Source: Japan Automobile Manufactures Association (JAMA)
0
5
10
15
20
25M
illio
ns, V
olum
e

24
Figure 2: Trade in parts and components (P&C) in Japan1 and its ratio to total production by Japanese automakers2, 1988-2009
Notes: 1The bar shows trade in parts and components (P&C) in Japan presented on the left axis. The P&C are listed in Appendix 1. 2The line shows the ratio of total trade in P&C in Japan to total (domestic + overseas) production by Japanese automakers. This ratio is presented on the right axis. Sources: Compiled from UN Comtrade Database and Japan Automobile Manufactures Association (JAMA)
-
500
1,000
1,500
2,000
2,500
3,000
3,500
4,000
4,500
-
10
20
30
40
50
60
70
80
90
100
Bill
ions
, US$

25
Figure 3: Ratio of trade in parts and components (P&C) to auto production: A comparison with traditional auto producing countries (TPCs), 2001/2 and 2007/2008
Note: The values are two-year averages. The bars are ordered as follows for both 2001/2 and 2007/8: Japan. The top left is Japan followed by the United States, Germany, France, Italy and Sweden. Sources: Compiled from UN Comtrade Database, International Organisation of Motor Vehicle Manufacturers (OICA)
0
5,000
10,000
15,000
20,000
25,000
30,000
2001/2 2007/8
Japan US Germany France Italy Sweden

Appendix 1: List of parts and components (P&C) Serial
Number HS
Code Name
1 392690 Articles of plastics&articles of other materials of headings 39.01 to 39.14, n.e.s. in Ch 39
2 400910 Rubber tube, pipe or hose not reinforced, no fittings 3 400920 Rubber tube, pipe, hose, metal reinforced, no fitting 4 400930 Rubber tube, pipe, hose textile-reinforced no fitting 5 400940 Rubber tube, pipe or hose, reinforced nes, no fitting 6 401110 Pneumatic tyres new of rubber for motor cars 7 401120 New pneumatic tyres, of rubber, of a kind used on buses/lorries 8 401140 Pneumatic tyres new of rubber for motorcycles 9 401199 Pneumatic tyres new of rubber nes 10 401220 Pneumatic tyres used 11 401310 Inner tubes of rubber for motor vehicles 12 401691 Floor coverings, mats of rubber except cellular, hard 13 401699 Articles of vulcanised rubber nes, except hard rubber 14 570242 Carpets of manmade yarn, woven pile, made up,nes 15 570320 Carpets nylon, polyamides, tufted 16 570330 Carpets of other manmade textile materials, tufted 17 570490 Carpets of felt of textile materials, > 0.3 m2 18 700711 Safety glass (tempered) for vehicles, aircraft, etc 19 700721 Safety glass (laminated) for vehicles, aircraft, etc 20 700910 Rear-view mirrors for vehicles 21 732010 Leaf springs/leaves thereof, iron or steel 22 732020 Springs, helical, iron or steel 23 732090 Springs, iron or steel, except helical/leaf 24 830120 Locks of a kind used for motor vehicles of base metal 25 830230 Motor vehicle mountings, fittings, of base metal, nes 26 840729 Marine propulsion spark-ignition engines nes 27 840731 Engines, spark-ignition reciprocating, <50 cc 28 840732 Engines, spark-ignition reciprocating, 50-250 cc 29 840733 Engines, spark-ignition reciprocating, 250-1000 cc 30 840734 Engines, spark-ignition reciprocating, over 1000 cc 31 840790 Engines, spark-ignition type nes 32 840820 Engines, diesel, for motor vehicles 33 840991 Parts for spark-ignition engines except aircraft 34 840999 Parts for diesel and semi-diesel engines 35 841459 Electric fans, motor > 125 watts 36 841490 Parts of vacuum pumps, compressors,fans,blowers,hoods 37 841590 Parts for air conditioners 38 842123 Oil/petrol filters for internal combustion engines 39 842129 Filtering/purifying machinery for liquids nes 40 842131 Intake air filters for internal combustion engines 41 842199 Parts for filter/purifying machines for liquid/gas 42 842542 Hydraulic jacks/hoists except for garages 43 848310 Transmission shafts and cranks, cam and crank shafts 44 848320 Bearing housings etc incorporating ball/roller bearin 45 848330 Bearing housings, shafts, without ball/roller bearing 46 848350 Flywheels & pulleys, incl. pulley blocks 47 848390 Parts of power transmission etc equipment

27
48 848410 Gaskets & similar joints of metal sheeting combined with other material/of 2/more layers of metal
49 850211 Generating sets, diesel, output < 75 kVA 50 850710 Lead-acid electric accumulators (vehicle) 51 851110 Sparking plugs 52 851120 Ignition magnetos, magneto-generators and flywheels 53 851130 Distributors and ignition coils 54 851140 Starter motors 55 851150 Generators and alternators 56 851180 Glow plugs & other ignition or starting equipment nes 57 851190 Parts of electrical ignition or starting equipment 58 851220 Lighting/visual signalling equipment nes 59 851230 Sound signalling equipment 60 851240 Windscreen wipers, defrosters & demisters of a kind used for cycles/motor vehicles 61 851290 Parts of cycle & vehicle light, signal, etc equipment 62 852719 Radio-broadcast receivers capable of operating without an external source of power
(excl. of 8527.12 & 8527.13) 63 852721 Radio receivers, external power,sound reproduce/recor 64 852729 Radio receivers, external power, not sound reproducer 65 853910 Sealed beam lamp units 66 853921 Filament lamps, tungsten halogen 67 853990 Parts of electric filament or discharge lamps 68 854430 Ignition/other wiring sets for vehicles/aircraft/ship 69 854460 Electric conductors, for over 1,000 volts, nes 70 870710 Bodies for passenger carrying vehicles 71 870790 Bodies for tractors, buses, trucks etc 72 870810 Bumpers & parts thereof of the motor vehicles of 87.01-87.05 73 870821 Safety seat belts for motor vehicles 74 870829 Parts and accessories of bodies nes for motor vehicle 75 870831 Mounted brake linings for motor vehicles 76 870839 Brake system parts except linings for motor vehicles 77 870840 Transmissions for motor vehicles 78 870850 Drive axles with differential for motor vehicles 79 870860 Non-driving axles/parts for motor vehicles 80 870870 Wheels including parts/accessories for motor vehicles 81 870880 Shock absorbers for motor vehicles 82 870891 Radiators for motor vehicles 83 870892 Mufflers and exhaust pipes for motor vehicles 84 870893 Clutches and parts thereof for motor vehicles 85 870894 Steering wheels, columns & boxes for motor vehicles 86 870899 Motor vehicle parts nes 87 871411 Motorcycle saddles 88 871419 Motorcycle parts except saddles 89 910400 Instrument panel clocks etc for vehicles/aircraft etc 90 940120 Seats, motor vehicles
Source: Japan Auto Parts Industries Association (JAPIA)

28
Appendix 2: List of trading partners Asia Americas Europe Others China Argentina Austria Australia India Brazil Belgium Botswana
Indonesia Canada Czech Republic. Egypt Iran Chile Finland Kenya
Japan Colombia France Morocco Malaysia Ecuador Germany Nigeria Pakistan Mexico Hungary South Africa
Philippines Uruguay Italy Tunisia South Korea United States Netherlands
Thailand Venezuela Poland Viet Nam
Portugal
Romania
Russian Federation
Slovakia
Slovenia
Spain
Sweden
Turkey
United Kingdom
Uzbekistan
29
Appendix 3: List of automobile producers according to locations of headquarters Japan United States Germany France Italy Sweden
Daihatsu Cadillac Audi Bugatti Alfa Romeo Saab Hino Chevrolet BMW Citroen Ferrari Scania
Honda Chrysler Evobus Renault Fiat Volvo Isuzu Ford MAN Peugeot Iveco Trucks
Mazda Freightliner Mercedes-Benz Renault Trucks Lamborghini Mitsubishi General Motors Mini
Lancia
Mitsubishi Fuso Hummer Neoplan
Maserati Nissan Jeep Opel
Subaru Navistar Porsche Suzuki Paccar Smart Toyota Pontiac Unimog
Sterling VolksWagen
Western Star Source: International Organisation of Motor Vehicle Manufacturers (OICA): http://www.oica.net/

30
Appendix 4: List of definitions and data sources of variables Variables Definition Data Source E_P&C Real value of exports of parts and components
in US$, deflated by motor vehicle parts manufacturing sub-index of the US producer price index at 2002
UN Comtrade: (http://comtrade.un.org/) US Bureau of Labour Statistics: (http://www.bls.gov/)
I_P&C Real value of imports of parts and components in US$, deflated by motor vehicle parts manufacturing sub-index of the US producer price index at 2002
UN Comtrade: (http://comtrade.un.org/) US Bureau of Labour Statistics: (http://www.bls.gov/)
E_CBU Real value of trade in completely-built units in US$, deflated by motor vehicle manufacturing sub-index of the US producer price index at 2002
UN Comtrade: (http://comtrade.un.org/) US Bureau of Labour Statistics: (http://www.bls.gov/)
I_CBU Real value of trade in completely-built units in US$, deflated by motor vehicle manufacturing sub-index of the US producer price index at 2002
UN Comtrade: (http://comtrade.un.org/) US Bureau of Labour Statistics: (http://www.bls.gov/)
DAP Volume of domestic auto production International Organisation of Motor Vehicle Manufacturers: (http://oica.net/category/about-us/)
MRK Volume of domestic auto sales Automotive information platform: (http://www.marklines.com/en/index.jsp). Nikkan Jidosha Shinbun and Nikkan Jidosha Kaigisho [Automobile Newspaper and Automobile Business Association of Japan] (2008).
OSP Volume of overseas production by automobile producers headquartered in traditional auto-producing countries (TPCs)
International Organisation of Motor Vehicle Manufacturers: (http://oica.net/category/about-us/)
PGDP Real per capita GDP in US$ (at 2002 price) World Development Indicators: (http://www.worldbank.org/)
RER Real exchange rate, 𝑅𝐸𝑅𝑖𝑗 = 𝑁𝐸𝑅𝑖𝑗 ∗ (𝑃𝑗𝑤/𝑃𝑖𝐷) where NER is the nominal exchange rate index, 𝑃𝑊 is the producer price measured by the wholesale price index, and 𝑃𝐷 is the domestic price measured by the GDP deflator
World Development Indicators: (http://www.worldbank.org/)
DIS Geographical distance between the capital cities in kilometres
CEPII database: (http://www.cepii.fr/anglaisgraph/bdd/fdi.htm)
ADJ Dummy variable indicating whether the two countries are contiguous
CEPII database: (http://www.cepii.fr/anglaisgraph/bdd/fdi.htm)
LAN Dummy variable indicating whether the two countries share a common official language
CEPII database: (http://www.cepii.fr/anglaisgraph/bdd/fdi.htm)

Working Papers in Trade and Development List of Papers (including publication details as at 2012)
10/01 PREMA-CHANDRA ATHUKORALA, ‘Trade Liberalisation and The Poverty of Nations:
A Review Article’ 10/02 ROSS H McLEOD, ‘Institutionalized Public Sector Corruption: A Legacy of the Soeharto
Franchise’ 10/03 KELLY BIRD and HAL HILL, ‘Tiny, Poor, Landlocked, Indebted, but Growing: Lessons
for late Reforming Transition Economies from Laos’ 10/04 RAGHBENDRA JHA and TU DANG, ‘Education and the Vulnerability to Food
Inadequacy in Timor-Leste’ 10/05 PREMA-CHANDRA ATHUKORALA and ARCHANUN KOHPAIBOON, ‘East Asia in
World Trade: The Decoupling Fallacy, Crisis and Policy Challenges’ 10/06 PREMA-CHANDRA ATHUKORALA and JAYANT MENON, ‘Global Production
Sharing, Trade Patterns and Determinants of Trade Flows’ 10/07 PREMA-CHANDRA ATHUKORALA, ‘Production Networks and Trade Patterns in East
Asia: Regionalization or Globalization? 10/08 BUDY P RESOSUDARMO, ARIANA ALISJAHBANA and DITYA AGUNG
NURDIANTO, ‘Energy Security in Indonesia’ 10/09 BUDY P RESOSUDARMO, ‘Understanding the Success of an Environmental Policy: The
case of the 1989-1999 Integrated Pest Management Program in Indonesia’ 10/10 M CHATIB BASRI and HAL HILL, ‘Indonesian Growth Dynamics’ 10/11 HAL HILL and JAYANT MENON, ‘ASEAN Economic Integration: Driven by Markets,
Bureaucrats or Both? 10/12 PREMA-CHANDRA ATHUKORALA, ‘ Malaysian Economy in Three Crises’ 10/13 HAL HILL, ‘Malaysian Economic Development: Looking Backwards and Forward’ 10/14 FADLIYA and ROSS H McLEOD, ‘Fiscal Transfers to Regional Governments in
Indonesia’ 11/01 BUDY P RESOSUDARMO and SATOSHI YAMAZAKI, ‘Training and Visit (T&V)
Extension vs. Farmer Field School: The Indonesian’ 11/02 BUDY P RESOSUDARMO and DANIEL SURYADARMA, ‘The Effect of Childhood
Migration on Human Capital Accumulation: Evidence from Rural-Urban Migrants in Indonesia’
11/03 PREMA-CHANDRA ATHUKORALA and EVELYN S DEVADASON, ‘The Impact of
Foreign Labour on Host Country Wages: The Experience of a Southern Host, Malaysia’

11/04 PETER WARR, ‘Food Security vs. Food Self-Sufficiency: The Indonesian Case’ 11/05 PREMA-CHANDRA ATHUKORALA, ‘Asian Trade Flows: Trends, Patterns and
Projections’ 11/06 PAUL J BURKE, ‘Economic Growth and Political Survival’ 11/07 HAL HILL and JUTHATHIP JONGWANICH, ‘Asia Rising: Emerging East Asian
Economies as Foreign Investors’ 11/08 HAL HILL and JAYANT MENON, ‘Reducing Vulnerability in Transition Economies:
Crises and Adjustment in Cambodia’ 11/09 PREMA-CHANDRA ATHUKORALA, ‘South-South Trade: An Asian Perspective’ 11/10 ARMAND A SIM, DANIEL SURYADARMA and ASEP SURYAHADI, ‘The
Consequences of Child Market Work on the Growth of Human Capital’ 11/11 HARYO ASWICAHYONO and CHRIS MANNING, ‘Exports and Job Creation in
Indonesia Before and After the Asian Financial Crisis’ 11/12 PREMA-CHANDRA ATHUKORALA and ARCHANUN KOHPAIBOON, ‘Australia-
Thailand Trade: Has the FTA Made a Difference? 11/13 PREMA-CHANDRA ATHUKORALA, ‘Growing with Global Production Sharing: The
Tale of Penang Export Hub’ 11/14 W. MAX CORDEN, ‘The Dutch Disease in Australia: Policy Options for a Three-Speed
Economy’ 11/15 PAUL J BURKE and SHUHEI NISHITATENO, ‘Gasoline prices, gasoline consumption,
and new-vehicle fuel economy: Evidence for a large sample of countries’ 12/01 BUDY P RESOSUDARMO, ANI A NAWIR, IDA AJU P RESOSUDARMO and NINA L
SUBIMAN, ‘Forest Land use Dynamics in Indonesia’ 12/02 SHUHEI NISHITATENO, ‘Global Production Sharing in the Japanese Automobile
Industry: A Comparative Analysis’