Embed Size (px)
DESCRIPTION
Optical sensors are electronic detectors which work on the presence or absence of light or infrared rays and convert the same into an electronic signal. Usually they are part of a much larger system where this electronic signal is interpreted or analyzed in different ways to produce a result like presence of a person, capturing an image, movement of an object or position of an object and so on. The Global Optical sensor market is rapidly growing across the globe due to the increase in demand for the handheld devices like tablets and smart phones. Smart phones and tablets are very rapidly growing and are here to stay and as long as the market persists there will be increase in demand for optical sensors like light and proximity sensors. Light and proximity sensors based on the estimation are expected to grow to a $1.5bn industry by 2018 due to steady rise in the market for handheld devices. The Global Optical sensor market is slated to grow at 5-6 % CAGR year on year for next 5 years.
Citation preview
IndustryARC
Global Optical Sensors Market Analysis and Forecast (2013 – 2018)
By Type (Position, Ambient Light, Motion, Proximity, Image); Verticals (Industrial, Automotive, Defense, Commercial)
IndustryARC | 1
TABLE OF CONTENTS
1. Global Optical Sensors – Market Overview
2. Executive Summary
3. Global Optical Sensors – Market Landscape
3.1. Market Share Analysis
3.2. Comparative Analysis
3.2.1. Product Benchmarking
3.2.2. End user profiling
3.2.3. Patent Analysis
3.2.4. Top 5 Financials Analysis
4. Global Optical Sensors – Market Forces
4.1. Market Drivers
4.2. Market Constraints
4.3. Market Challenges
4.4. Attractiveness of the Optical Sensors Industry
4.4.1. Power of Suppliers
4.4.2. Power of Customers
4.4.3. Threat of New entrants
4.4.4. Threat of Substitution
4.4.5. Degree of Competition
5. Global Optical Sensors – Strategic Analysis
5.1. Value Chain Analysis
5.2. Pricing Analysis
5.3. Opportunities Analysis
IndustryARC | 2
5.4. Product/Market Life Cycle Analysis
5.5. Suppliers and Distributors
6. Global Optical Sensors Market – Product Types Analysis
6.1. Introduction
6.2. Position Sensor
6.3. Ambient Light Sensor
6.4. Photodiodes
6.5. Photoresistors
6.6. Image Sensor
6.6.1. CCD
6.6.2. CMOS
6.7. Proximity Sensor
6.8. Color Detection Sensors
6.8.1. Color Sensor
6.8.2. Luminescence Sensor
6.8.3. Brightness Sensor
6.8.4. Contrast Sensor
6.8.5. Color Mark Sensor
6.9. Motion Detector
6.10. Presence or Occupancy Sensor
6.11. IR Sensor
7. Global Optical Sensors Market – End Use Verticals Analysis
7.1. Food and Beverage
7.2. Automotive
7.3. Textiles
IndustryARC | 3
7.4. Chemical
7.5. Pharmaceutical
7.6. Water Treatment
7.7. Packaging
7.8. Paper and Pulp
7.9. Factory Automation
7.10. Aerospace & Defense
7.11. Others
8. Global Optical Sensors Market – Geographic Analysis
8.1. Introduction
8.2. Americas
8.2.1. North America
8.2.2. Brazil
8.2.3. Argentina
8.2.4. Mexico
8.3. Europe
8.3.1. UK
8.3.2. France
8.3.3. Germany
8.4. APAC
8.4.1. China
8.4.2. South Korea
8.4.3. Japan
8.4.4. Australia
8.5. ROW
IndustryARC | 4
9. Market Entropy
9.1. New Product Launches
9.2. M&As, Collaborations, JVs and Partnerships
10. Investment Opportunities – Analysis by Target companies/customers, Capital Investments, ROI, Payback Period and Source of Funds.
11. Company Reports (Overview, Financials, SWOT Analysis, Developments, Product Portfolio)
11.1. Steinel
11.2. B.E.G Luxomat
11.3. Wattstopper
11.4. Honeywell
11.5. Busch Jaeger
11.6. Omron
11.7. Eaton
11.8. Rockwell Automation
11.9. Sick AG
11.10. Turck
11.11. Pepperl+Fuchs
11.12. Bosch Sensortech GmbH
11.13. Hamamatsu Photonics K.K.
11.14. EMX Industries Inc
11.15. SICK AG
11.16. Banner Engineering
11.17. Atlas Scientific LLC
11.18. Cypress
11.19. Analog Devices
IndustryARC | 5

11.20. Atmel Corp
11.21. STMicroelectronics
11.22. Aptina Imaging
11.23. Hitachi
11.24. Omnivision
11.25. Teledyne Dalsa
11.26. Banpil Photonics
11.27. Alps Electric Co Ltd
11.28. Invensense
11.29. Maxim IC
12. Appendix
12.1. Abbreviations
12.2. Sources
12.3. Research Methodology
12.4. Bibliography
12.5. Compilation of Expert Insights
12.6. Disclaimer
IndustryARC | 6
LIST OF TABLES
Table 1 Optical Sensors Market, List of Companies Covered
Table 2 Position Sensor Market Competitive Share Analysis, 2013 (%)
Table 3 Global Ambient Light Sensor Market Competitive Share Analysis, 2013 (%)
Table 4 Global Photodiodes Market Competitive Share Analysis, 2013 (%)
Table 5 Global Photoresistors Market Competitive Share Analysis, 2013 (%)
Table 6 Global Image Sensor Market Competitive Share Analysis, 2013 (%)
Table 7 Global Proximity Sensor Market Competitive Share Analysis, 2013 (%)
Table 8 Global Color Detection Sensor Market Competitive Share Analysis, 2013 (%)
Table 9 Global Motion Detectors Market Competitive Share Analysis, 2013 (%)
Table 10 Global Occupancy Sensor Market Competitive Share Analysis, 2013 (%)
Table 11 Global IR Sensor Market Competitive Share Analysis, 2013 (%)
Table 12 Global Optical Sensors Market Revenue, 2012 – 2018 ($M)
Table 13 Global Optical Sensors Market Volume, 2012 – 2018 (Million Units)
Table 14 Global Optical Sensors Market Revenue, By Product Type, 2012 – 2018 ($M)
Table 15 Global Optical Sensors Market Volume, By Product Type, 2012 – 2018 (Million Units)
Table 16 Global Optical Sensors Market Share Analysis, By Company Revenue, 2013 (%)
Table 17 Top 5 Financials Analysis, 2011 – 2013
Table 18 Global Optical Sensors Market, Pricing Analysis of Product Types, 2012 – 2018 ($)
Table 19 Average Selling Price Analysis, Position Sensor, 2012 – 2018 ($)
Table 20 Average Selling Price Analysis, Ambient Light Sensor, 2012 – 2018 ($)
Table 21 Average Selling Price Analysis, Photodiodes, 2012 – 2018 ($)
Table 22 Average Selling Price Analysis, Photoresistors, 2012 – 2018 ($)
Table 23 Average Selling Price Analysis, Image Sensor, 2012 – 2018 ($)
Table 24 Average Selling Price Analysis, Proximity Sensor, 2012 – 2018 ($)
Table 25 Average Selling Price Analysis, Color Detection Sensor, 2012 – 2018 ($)
Table 26 Average Selling Price Analysis, Luminescence Sensor, 2012 – 2018 ($)
Table 27 Average Selling Price Analysis, Brightness Sensor, 2012 – 2018 ($)
Table 28 Average Selling Price Analysis, Contrast Sensor, 2012 – 2018 ($)
Table 29 Average Selling Price Analysis, Color Mark Sensor, 2012 – 2018 ($)
Table 30 Average Selling Price Analysis, Motion Detectors, 2012 – 2018 ($)
Table 31 Average Selling Price Analysis, Occupancy Sensor, 2012 – 2018 ($)
Table 32 Average Selling Price Analysis, Infrared Sensor, 2012 – 2018 ($)
Table 33 Position Sensor Market Volumes, 2012 – 2018 (Million Units)
IndustryARC | 7
Table 34 Position Sensor Market Revenue, 2012 – 2018 ($bn)
Table 35 Global Ambient Light Sensor Market Volumes, 2012 – 2018 (Million Units)
Table 36 Global Ambient Light Sensor Market Revenue, 2012 – 2018 ($bn)
Table 37 Global Photodiodes Market Volumes, 2012 – 2018 (Million Units)
Table 38 Global Photodiodes Market Revenue, 2012 – 2018 ($bn)
Table 39 Global Photoresistors Market Volumes, 2012 – 2018 (Million Units)
Table 40 Global Photoresistors Market Revenue, 2012 – 2018 ($bn)
Table 41 Global Image Sensor Market Volumes, 2012 – 2018 (Million Units)
Table 42 Global Image Sensor Market Revenue, 2012 – 2018 ($bn)
Table 43 Global Proximity Sensor Market Volumes, 2012 – 2018 (Million Units)
Table 44 Global Proximity Sensor Market Revenue, 2012 – 2018 ($bn)
Table 45 Global Color Detection Sensor Market Volumes, 2012 – 2018 (Million Units)
Table 46 Global Color Detection Sensor Market Revenue, 2012 – 2018 ($bn)
Table 47 Global Motion Detectors Market Volumes, 2012 – 2018 (Million Units)
Table 48 Global Motion Detectors Market Revenue, 2012 – 2018 ($bn)
Table 49 Global Occupancy Sensor Market Volumes, 2012 – 2018 (Million Units)
Table 50 Global Occupancy Sensor Market Revenue, 2012 – 2018 ($bn)
Table 51 Global IR Sensor Market Volumes, 2012 – 2018 (Million Units)
Table 52 Global IR Sensor Market Revenue, 2012 – 2018 ($bn)
Table 53 Global Optical Sensors Market Unit Shipments, By End Use Verticals, 2012 – 2018 (Million Units)
Table 54 Global Optical Sensors Market Revenue, By End Use Verticals, 2012 – 2018 ($M)
Table 55 Food and Beverage Industry, Optical Sensors Market Revenue, 2012 – 2018 ($M)
Table 56 Food and Beverage Industry, Optical Sensors Unit Shipments, 2012 – 2018 ($M)
Table 57 Automotive Industry, Optical Sensors Market Revenue, 2012 – 2018 ($M)
Table 58 Automotive Industry, Optical Sensors Unit Shipments, 2012 – 2018 ($M)
Table 59 Textiles Industry, Optical Sensors Market Revenue, 2012 – 2018 ($M)
Table 60 Textiles Industry, Optical Sensors Unit Shipments, 2012 – 2018 ($M)
Table 61 Chemical Industry, Optical Sensors Market Revenue, 2012 – 2018 ($M)
Table 62 Chemical Industry, Optical Sensors Unit Shipments, 2012 – 2018 ($M)
Table 63 Pharmaceutical Industry, Optical Sensors Market Revenue, 2012 – 2018 ($M)
Table 64 Pharmaceutical Industry, Optical Sensors Unit Shipments, 2012 – 2018 ($M)
Table 65 Water Treatment Industry, Optical Sensors Market Revenue, 2012 – 2018 ($M)
Table 66 Water Treatment Industry, Optical Sensors Unit Shipments, 2012 – 2018 ($M)
Table 67 Packaging Industry, Optical Sensors Market Revenue, 2012 – 2018 ($M)
Table 68 Packaging Industry, Optical Sensors Unit Shipments, 2012 – 2018 ($M)
IndustryARC | 8

Table 69 Paper and Pulp Industry, Optical Sensors Market Revenue, 2012 – 2018 ($M)
Table 70 Paper and Pulp Industry, Optical Sensors Unit Shipments, 2012 – 2018 ($M)
Table 71 Factory Automation, Optical Sensors Market Revenue, 2012 – 2018 ($M)
Table 72 Factory Automation, Optical Sensors Unit Shipments, 2012 – 2018 ($M)
Table 73 North America Optical Sensors Market Revenue, 2012 – 2018($M)
Table 74 South America Optical Sensors Market Revenue, 2012 – 2018($M)
Table 75 Europe Optical Sensors Market Revenue, 2012 – 2018($M)
Table 76 Asia Pacific Optical Sensors Market Revenue, 2012 – 2018($M)
Table 77 Middle East and Africa Optical Sensors Market Revenue, 2012 – 2018($M)
Table 78 Recent Product Developments, Optical Sensors Industry
Table 79 M&A, JV, Agreements, Optical Sensors Industry
IndustryARC | 9
LIST OF FIGURES Figure 1 Segmentation of Optical Sensors Market by Product Type
Figure 2 Segmentation of Optical Sensors Market by End Use Verticals
Figure 3 Optical Sensors Market, List of Companies Covered
Figure 4 Position Sensor Market Competitive Share Analysis, 2013 (%)
Figure 5 Global Ambient Light Sensor Market Competitive Share Analysis, 2013 (%)
Figure 6 Global Photodiodes Market Competitive Share Analysis, 2013 (%)
Figure 7 Global Photoresistors Market Competitive Share Analysis, 2013 (%)
Figure 8 Global Image Sensor Market Competitive Share Analysis, 2013 (%)
Figure 9 Global Proximity Sensor Market Competitive Share Analysis, 2013 (%)
Figure 10 Global Color Detection Sensor Market Competitive Share Analysis, 2013 (%)
Figure 11 Global Motion Detectors Market Competitive Share Analysis, 2013 (%)
Figure 12 Global Occupancy Sensor Market Competitive Share Analysis, 2013 (%)
Figure 13 Global IR Sensor Market Competitive Share Analysis, 2013 (%)
Figure 14 Global Process Automation and Instrumentation Market Revenue, 2012 - 2018 ($bn)
Figure 15 Average Selling Price Analysis of Optical Sensors ($), 2012 – 2018
Figure 16 Global Optical Sensors Market Revenue, By End Use Application, 2012 – 2018($M)
Figure 17 Global Optical Sensors Market Revenue, By Geographic Region, 2012 – 2018($M)
IndustryARC | 10
REPORT SCOPE & STAKEHOLDERS SCOPE The Optical Sensor Market has been segmented on the basis of products and regional markets. Detailed analysis is given for each of its product types along with its drivers, restraints and challenges in terms of revenue from 2013 to 2018. This report is also segmented in terms of region and gives sales of optical sensors with respect to each region. Therefore, regional data on a detailed level has been provided for the U.S. market. This segment discusses the demand of optical sensors for various products in this region, with respect to revenue. The optical sensor market has some key players who hold major stakes in the market. ABB, Eaton, Sick AG, Analog Devices, Atmel are some of the leading manufacturers present in the market. ABB was the largest company leading the optical sensor market in 2013.The report contains the most detailed and in-depth segmentation of the global optical sensor market STAKEHOLDERS The following are the key stakeholders in the optical sensor market. Sensor Manufacturers
Product OEMs
Contract manufacturer
Service providers
Distributors
Component suppliers
System integrators
Maintenance companies
IT and Automation Software Providers
Engineering and Designing companies
Project Testing and Commissioning Companies
IndustryARC | 11
EXECUTIVE SUMMARY
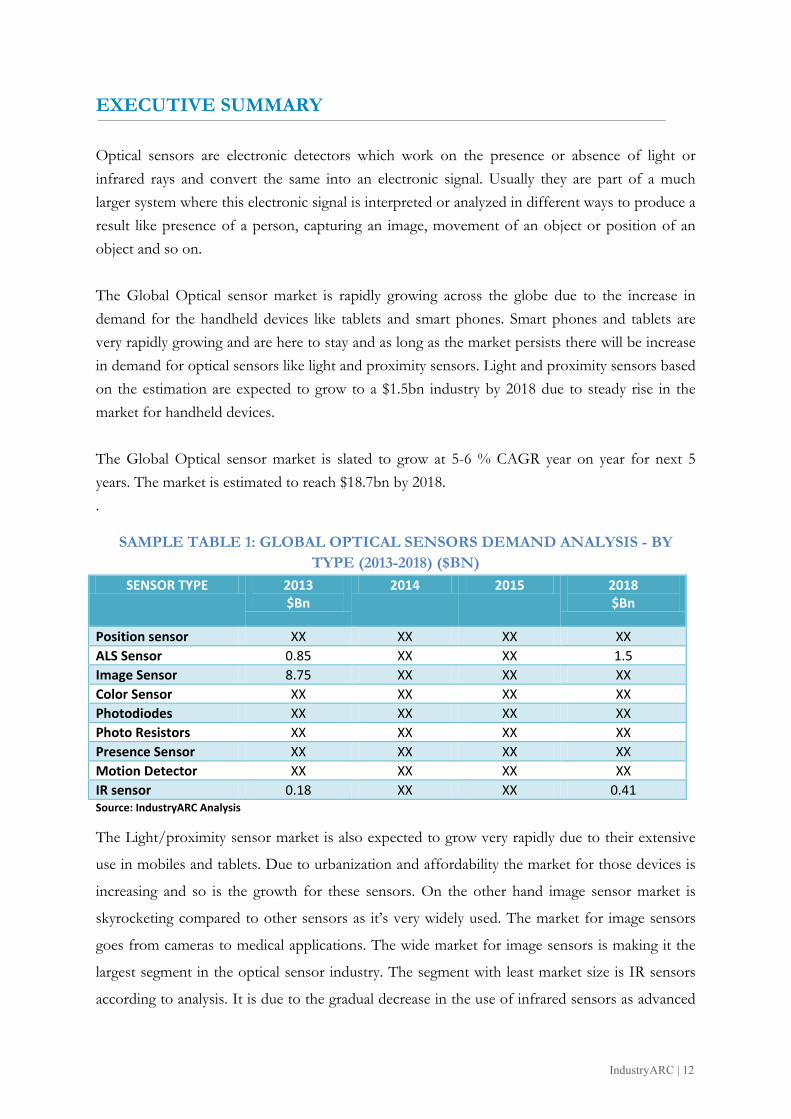
Optical sensors are electronic detectors which work on the presence or absence of light or infrared rays and convert the same into an electronic signal. Usually they are part of a much larger system where this electronic signal is interpreted or analyzed in different ways to produce a result like presence of a person, capturing an image, movement of an object or position of an object and so on. The Global Optical sensor market is rapidly growing across the globe due to the increase in demand for the handheld devices like tablets and smart phones. Smart phones and tablets are very rapidly growing and are here to stay and as long as the market persists there will be increase in demand for optical sensors like light and proximity sensors. Light and proximity sensors based on the estimation are expected to grow to a $1.5bn industry by 2018 due to steady rise in the market for handheld devices. The Global Optical sensor market is slated to grow at 5-6 % CAGR year on year for next 5 years. The market is estimated to reach $18.7bn by 2018. .
SAMPLE TABLE 1: GLOBAL OPTICAL SENSORS DEMAND ANALYSIS - BY TYPE (2013-2018) ($BN)
SENSOR TYPE 2013 $Bn
2014 2015 2018 $Bn
Position sensor XX XX XX XX ALS Sensor 0.85 XX XX 1.5 Image Sensor 8.75 XX XX XX Color Sensor XX XX XX XX Photodiodes XX XX XX XX Photo Resistors XX XX XX XX Presence Sensor XX XX XX XX Motion Detector XX XX XX XX IR sensor 0.18 XX XX 0.41 Source: IndustryARC Analysis The Light/proximity sensor market is also expected to grow very rapidly due to their extensive
use in mobiles and tablets. Due to urbanization and affordability the market for those devices is
increasing and so is the growth for these sensors. On the other hand image sensor market is
skyrocketing compared to other sensors as it’s very widely used. The market for image sensors
goes from cameras to medical applications. The wide market for image sensors is making it the
largest segment in the optical sensor industry. The segment with least market size is IR sensors
according to analysis. It is due to the gradual decrease in the use of infrared sensors as advanced
IndustryARC | 12
sensors are with much accuracy and more sensitivity are coming into the market. The infrared
sensors were very widely used in their inception but now the usage of infrared sensors is
gradually decreasing and is expected to be limited to scientific researches in the future.
Innovative products are gradually capturing the global optical sensor market. Companies such as
SICK are offering new products with better functionality and efficiency. ABB and Eaton are
trying to make the product cheaper without reducing the efficiency to increase the market range.
This report on the Global Optical Sensor Market identifies many such insights and M&A
opportunities, besides providing a detailed analysis of the different segments in Optical sensor
market.
IndustryARC | 13
KEY MARKET INSIGHTS
Growing demand for Optical sensors from Asia Pacific on account of growing innovations,
cheaper technology and growing urban population in these regions are expected to open new
opportunities for the market.
The light and proximity sensor market will increase from around $850m in 2013 to reach
$xx bn in 2018 due to increasing shipments of tablet PCs and smart phones.
IR sensors market is expected to increase from around $180m in 2013 to around $xx m
by 2018.
The global Image sensor market is expected to reach $10.5bn by 2018 from around
$8.75bn in 2013 with CMOS sensors occupying more than 90% share.
IndustryARC | 14
3. GLOBAL OPTICAL SENSORS – MARKET LANDSCAPE
3.1 MARKET SHARE ANALYSIS Market share of all the major companies operating the individual sensor market type of the
overall optical sensors market are analyzed in this section.
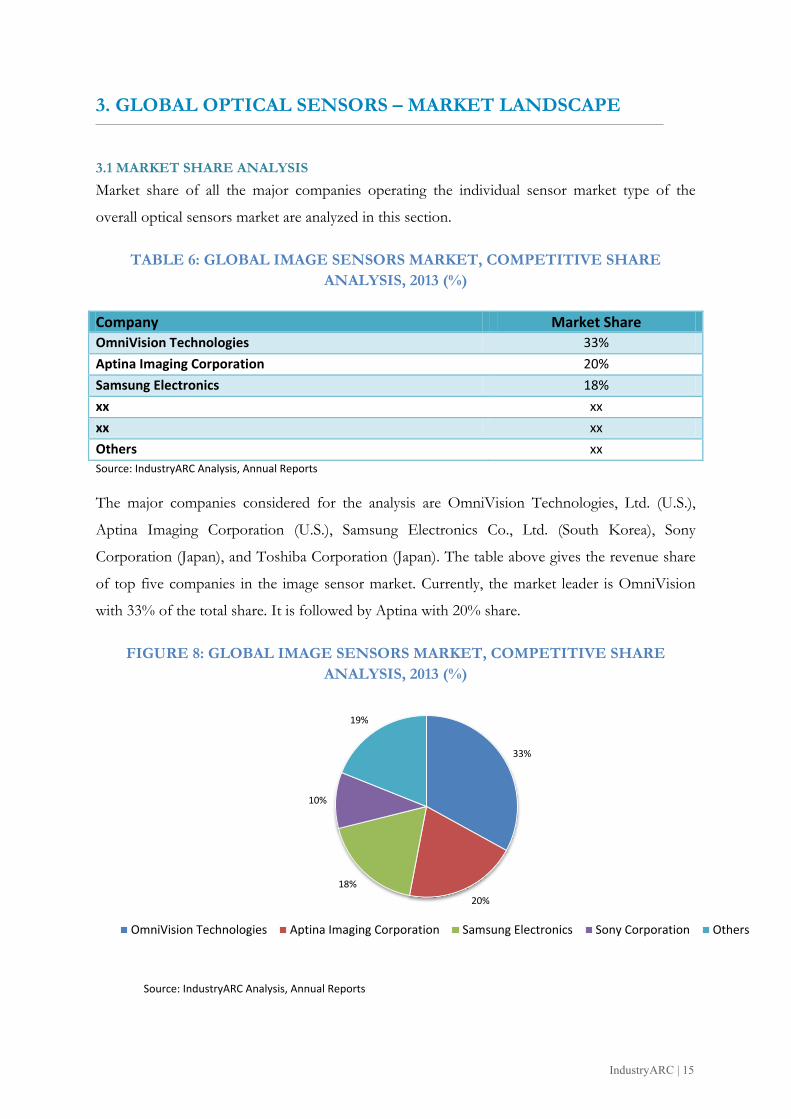
TABLE 6: GLOBAL IMAGE SENSORS MARKET, COMPETITIVE SHARE ANALYSIS, 2013 (%)
Company Market Share OmniVision Technologies 33% Aptina Imaging Corporation 20% Samsung Electronics 18% xx xx xx xx Others xx Source: IndustryARC Analysis, Annual Reports The major companies considered for the analysis are OmniVision Technologies, Ltd. (U.S.),
Aptina Imaging Corporation (U.S.), Samsung Electronics Co., Ltd. (South Korea), Sony
Corporation (Japan), and Toshiba Corporation (Japan). The table above gives the revenue share
of top five companies in the image sensor market. Currently, the market leader is OmniVision
with 33% of the total share. It is followed by Aptina with 20% share.
FIGURE 8: GLOBAL IMAGE SENSORS MARKET, COMPETITIVE SHARE ANALYSIS, 2013 (%)
Source: IndustryARC Analysis, Annual Reports
33%
20% 18%
10%
19%
OmniVision Technologies Aptina Imaging Corporation Samsung Electronics Sony Corporation Others
IndustryARC | 15
The product portfolio affects the market share of the company. Since CMOS holds the major
share, players such as OmniVision and Aptina are the top companies in the market currently.
Other sensor types’ (CCD and contact image sensor) manufacturers have lesser share in the total
market since the addressable market for these types is very less.
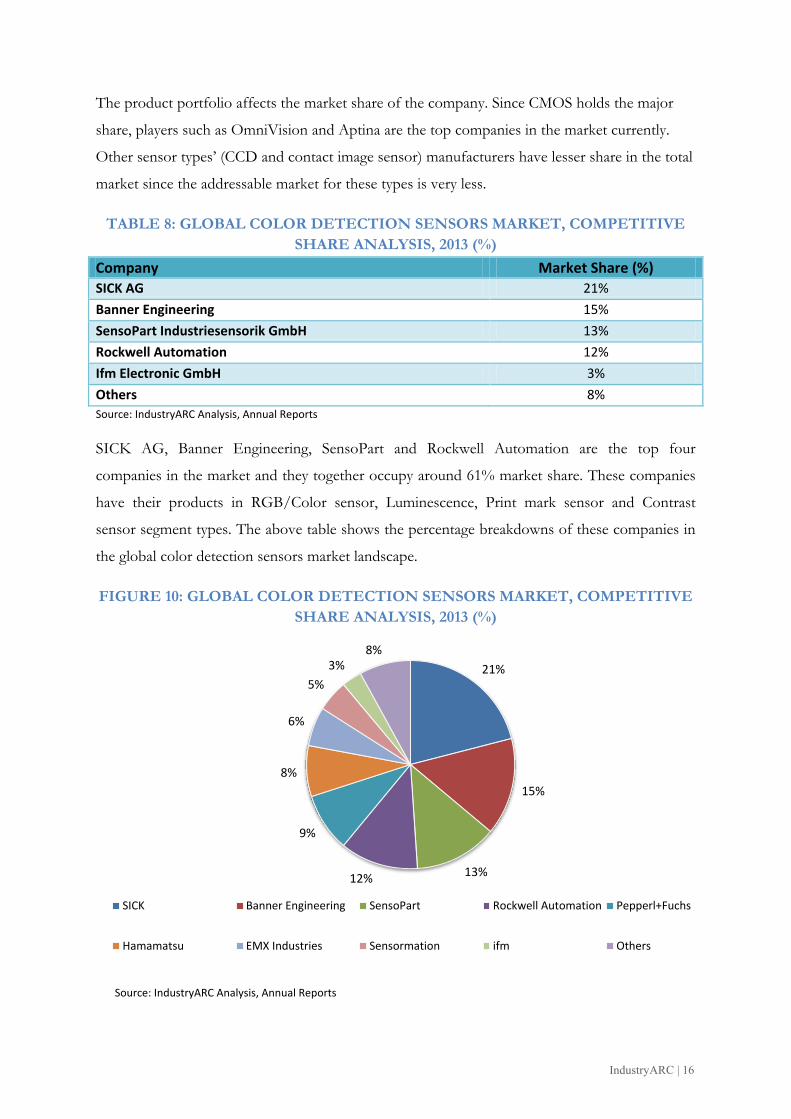
TABLE 8: GLOBAL COLOR DETECTION SENSORS MARKET, COMPETITIVE SHARE ANALYSIS, 2013 (%)
Company Market Share (%) SICK AG 21% Banner Engineering 15% SensoPart Industriesensorik GmbH 13% Rockwell Automation 12% Ifm Electronic GmbH 3% Others 8% Source: IndustryARC Analysis, Annual Reports SICK AG, Banner Engineering, SensoPart and Rockwell Automation are the top four
companies in the market and they together occupy around 61% market share. These companies
have their products in RGB/Color sensor, Luminescence, Print mark sensor and Contrast
sensor segment types. The above table shows the percentage breakdowns of these companies in
the global color detection sensors market landscape.
FIGURE 10: GLOBAL COLOR DETECTION SENSORS MARKET, COMPETITIVE SHARE ANALYSIS, 2013 (%)
Source: IndustryARC Analysis, Annual Reports
21%
15%
13% 12%
9%
8%
6%
5% 3%
8%
SICK Banner Engineering SensoPart Rockwell Automation Pepperl+Fuchs
Hamamatsu EMX Industries Sensormation ifm Others
IndustryARC | 16

Most of the companies produce and distribute RGB type color sensor models but very few are
producing brightness sensors currently. EMX Industries and Sensormation are the key
brightness sensor OEMs in the industry. Pepperl+Fuchs, SICK, Baluff and Banner are key
companies in the Luminescence sensor market. Hamamatsu Photonics, SICK, Pepperl+Fuchs,
SensoPart, Keyence are the major players in the color/RGB Sensor market. SensoPart,
Panasonic, Omron, Rockwell Automation are the top players in the Print mark sensor market
for 2013.
IndustryARC | 17

4. Global Optical Sensors – Market Forces 4.1. MARKET DRIVERS 4.1.1. Demand from Automation Industry Driving Growth of Optical Sensors The global automation industry, particularly the process automation and industry is growing at
around 6.3% and they are the primary growth drivers for the global optical sensors market.
Increasing use of automation in different industry verticals like food and beverage, chemicals,
petrochemicals, paper and pulp, packaging drives the need for installation of products or
hardware which uses optical sensors on a larger scale. Image sensors are used in machine vision
based products for assembly line monitoring and other automation purposes. Color sensors for
example are used in the packaging, food and beverage industry for accuracy purposes. Compared
to image sensors they are cheaper, faster and can be replaced easily.
FIGURE 14: GLOBAL PROCESS AUTOMATION AND INSTRUMENTATION MARKET REVENUE, 2012 - 2018 ($BN)
Source: IndustryARC Analysis, Expert Interviews, Secondary Sources, Trade Bodies and Associations The global process automation market revenue is expected to grow from $87.67 billion in 2013,
to $119.29 billion in 2018, at an estimated CAGR of 6.4% from 2013 to 2018. Also, the process
instrumentation market is expected to grow from $23.67 billion in 2013, to $31.71 billion in
2018, with a CAGR of 6%.The instrumentation market is governed by the major players like
Emerson Electric Co. (U.S.), Yokogawa Electric Corporation, Inc. (Japan) and Endress+Hauser
(Switzerland), among others. The APAC region is expected to rejuvenate the process automation
0
20
40
60
80
100
120
140
2012 2013 2014 2015 2016 2017 2018
Process Automation Process Instrumentation
IndustryARC | 18
market owing to the escalated demands from the oil and gas extraction, wastewater treatment,
and pharmaceutical verticals.
6.8. COLOR SENSORS The Color Detection sensor market is a key to successful industry automation. This market has
been witnessing tremendous growth due to increasing industries and new technological
advancements. Advanced Economies also maintain a stable growth mainly due to
reimbursements offered for specific equipment and health policies of government and private
entities. Portability, customization, ease of use, and automation are the key factors that Color
Detection sensors market players use to differentiate their products and services.
The various types of sensors in the market include color sensors, color mark sensors,
luminescence sensors and contrast sensors. Color sensors monitor color consistency in
applications such as plastics, textiles and other such constant production processes. Color mark
sensors are effective in detecting colors at high speeds. Luminescence sensors are used in paint,
grease and other such adhesives industries. Contrast sensors are used mainly to detect
registration marks and objects in general. These are the various applications of color detection
sensors.
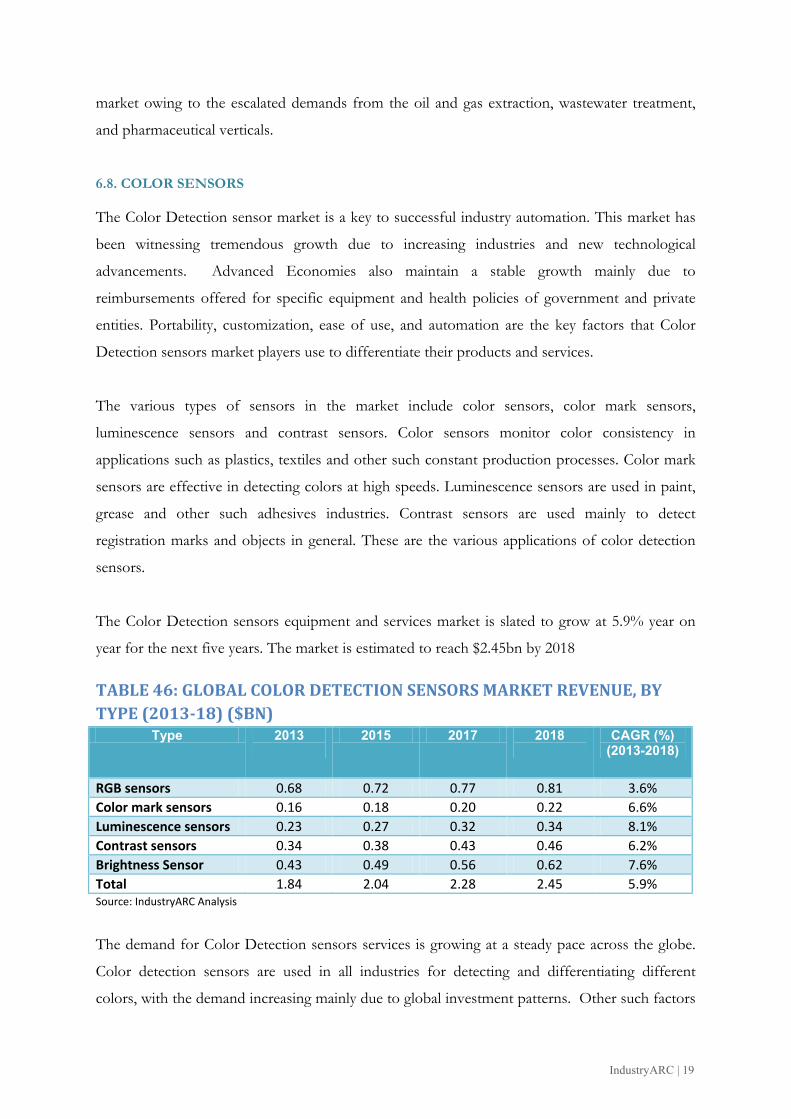
The Color Detection sensors equipment and services market is slated to grow at 5.9% year on
year for the next five years. The market is estimated to reach $2.45bn by 2018
TABLE 46: GLOBAL COLOR DETECTION SENSORS MARKET REVENUE, BY TYPE (2013-18) ($BN)
Type 2013
2015 2017 2018
CAGR (%) (2013-2018)
RGB sensors 0.68 0.72 0.77 0.81 3.6% Color mark sensors 0.16 0.18 0.20 0.22 6.6% Luminescence sensors 0.23 0.27 0.32 0.34 8.1% Contrast sensors 0.34 0.38 0.43 0.46 6.2% Brightness Sensor 0.43 0.49 0.56 0.62 7.6% Total 1.84 2.04 2.28 2.45 5.9% Source: IndustryARC Analysis
The demand for Color Detection sensors services is growing at a steady pace across the globe.
Color detection sensors are used in all industries for detecting and differentiating different
colors, with the demand increasing mainly due to global investment patterns. Other such factors
IndustryARC | 19
include developments in automation market, increasing demand from end users and innovation
in the technology which impact color sensor market.
Color sensors provide some reliable solutions to complex automation challenges. They are used
for various purposes like detecting components, matching color of different components,
verifying steps in manufacturing process, detecting color marks on parts, product packaging, and
monitoring color of adhesive tape and so on. It has a wide range of applications in the industrial
automation segment.
Current lineup of color sensors have significant improvements like higher precision,
detection of more colors and smaller package size. Use of lustrous and metallic paints,
inks in products demands the need for better color sensors, contrast and brightness
sensors for accurate identification purposes.
As the speed of assembly lines have increased tremendously over the years, detection
systems also need to increase their speed, precision as the part has to be identified, error
correction done and communicated to the controlling unit in fractions of a second.
IndustryARC | 20
RESEARCH METHODOLOGY The quantitative and qualitative data collected for the Optical Sensor Market report is from a
combination of secondary and primary sources. Research interviews were conducted with senior
executives and/or managers of leading optical sensor solution providers. These Key Opinion
Leaders (KOLs) were then provided a questionnaire to gather quantitative and qualitative inputs
on their operations, performance, strategies and views on the overall market, including key
developments and technology trends. Data from interviews is consolidated, checked for
consistency and accuracy, and the final market numbers are again validated by experts. The
global market was split by product types and geography based on different factors like primary
and secondary sources, understanding of the number of companies operating in each segment
and also KOL insights.
We have used various secondary sources such as directories, articles, white papers, newsletters,
annual reports and paid databases such as OneSource, Hoovers and Factiva to identify and
collect information for extensive technical and commercial study of the optical sensor market.
The following secondary sources were also used in the production of report and in triangulation
of data points.
Automation Federation
International Society of Automation
Advancing safety in Medical Instrumentation
Shanghai Optoelectronics Trade Association
The Association for Medical Imaging Management
The Optical Society
Association of Medical Imaging Management
MEMS Industry Group
The key players in the market and its value chain were identified through secondary research and
their market opinions were also gathered in a similar way through telephonic interviews and
questionnaires. We have also studied the annual reports of these top market players. Interviews
with key opinion leaders such as directors, managers, marketing personnel were used extensively
in understanding the need and emergence of optical sensor market.
IndustryARC | 21
We also have extensive database of contacts which were used to conduct primary interviews and
also to get their inputs using questionnaires. The following companies were covered during
primary research:
Metso Automation
B-Scada
Siemens
HPCL
Omron
Eaton
Rockwell Automation
Sick AG
Our in-house reports database pertaining to level sensors, distance measurements sensors, image
sensors, proximity sensors and MEMS markets were also used to identify market trends and to
get the historic, base market data for conducting the overall Optical Sensors Market Study.
IndustryARC | 22
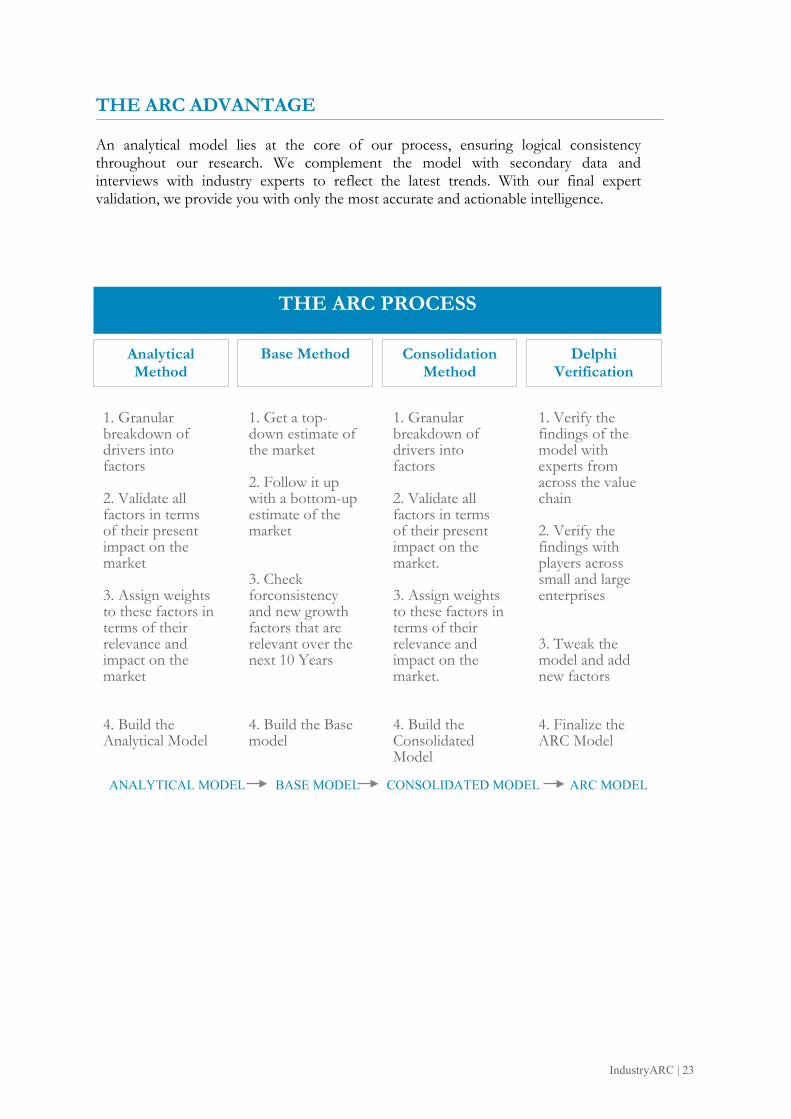
THE ARC ADVANTAGE An analytical model lies at the core of our process, ensuring logical consistency throughout our research. We complement the model with secondary data and interviews with industry experts to reflect the latest trends. With our final expert validation, we provide you with only the most accurate and actionable intelligence.
THE ARC PROCESS
ANALYTICAL MODEL BASE MODEL CONSOLIDATED MODEL ARC MODEL
Analytical Method
Base Method Consolidation Method
Delphi Verification
1. Granular breakdown of drivers into factors 2. Validate all factors in terms of their present impact on the market 3. Assign weights to these factors in terms of their relevance and impact on the market 4. Build the Analytical Model
1. Get a top-down estimate of the market 2. Follow it up with a bottom-up estimate of the market 3. Check forconsistency and new growth factors that are relevant over the next 10 Years 4. Build the Base model
1. Granular breakdown of drivers into factors 2. Validate all factors in terms of their present impact on the market. 3. Assign weights to these factors in terms of their relevance and impact on the market. 4. Build the Consolidated Model
1. Verify the findings of the model with experts from across the value chain 2. Verify the findings with players across small and large enterprises 3. Tweak the model and add new factors 4. Finalize the ARC Model
IndustryARC | 23

ABOUT US
IndustryARC was started by a group of young, passionate professionals along with
extensively experienced industry veterans across various business segments. Our focus and
expertise is mainly in the field of analytics, market research and consulting. Our singular
goal is to provide accurate and affordable research to our clients.
Our research team has expertise in diverse fields like Automotive, Chemicals, Consumer
Product & Services, Electronics, Food & Beverages, Healthcare etc., However diverse the
expertise maybe, everyone in our team shares one common trait - we love data and we love
providing solutions to clients using that data even more! Seeing your business flourish
based on our solutions and strategy is what we love the most!
IndustryARC publishes more than 30 reports on an annual basis in the mentioned
Industries. Our reports are in-depth and high quality reports that can help decision makers
frame better strategies for their business requirements. These reports can be further
customized as per your needs.
Disclaimer:
• The reports sold by IndustryARC are limited publications containing valuable
market information provided to a select group of customers in response to orders.
• Our customers acknowledge and agree that any report bought from IndustryARC is
for their own internal use and not for general publication or disclosure to third
parties.
• Our reports or part of the reports, information contained in the report, cannot be
shared or resold to any other third party.
• Disclosure to third parties, usage of data in a public document, article or blog by the
customer can be done with prior permission taken from IndustryARC.
For information regarding permissions and sales, contact:
[email protected] | [email protected]
IndustryARC | 24

Copyright © 2013 IndustryARC All Rights Reserved. This document contains highly confidential information and is the sole property of IndustryARC. No part of it may be circulated, copied, quoted, or otherwise reproduced without the approval of IndustryARC.
IndustryARC +1 614 - 588 - 8538
IndustryARC | 25