Embed Size (px)
Citation preview
A member of MUFG, a global financial groupMitsubishi UFJ Asset Management (UK) Ltd. (Registered in England No 1842259)
Global Investment Strategy
OCTOBER 2021ANDREW JENNER
HEAD OF INVESTMENT STRATEGY
MUFG ASSET MANAGEMENT

MUFG Asset Management
Investment Summary
2
The initial euphoria of lockdowns ending is over, now we have to find ways to live with Covid. Vaccinations have provided justified optimism, and expectations have discounted a return to “normal” activity. The next 12 months will be more taxing for markets as the bounce in activity and corporate earnings slows.We still expect to see renewed socialising, travel and rising consumer confidence.
Inflationary expectations are uncertain, they have risen, but remain well anchored.Central Banks have loosened their inflation targets, giving themselves room to keep policy loose for longer. Led by the US, but joined by the ECB who can now allow inflation to rise above 2%.The main target for the Authorities is growth, with fiscal policies also providing stimulus.
An end to loose money is being considered, yield curves are reflecting this.Only in Europe is the short end of the interest rate curve negative.However most yield curves do not suggest that growth or inflation will be strong for some while. The consensus view remains: soft productivity growth in the future and lack of bold action in some quarters.
Equity markets are at highs, supported by strong earnings forecasts.Equities already discount a return to normal economic activity, so pressure is on corporate earnings.Is this the time to bite the bullet and buy cyclicals and value? And sell Covid winners like technology?What is clear is that if growth becomes more prevalent, then there are cheaper ways to buy into it.
MUFG Asset Management

MUFG Asset Management
Growth and Inflation
3
20
25
30
35
40
45
50
55
60
65
10/2018 04/2019 10/2019 04/2020 10/2020 04/2021
JPMorgan Global Manufacturing JPMorgan Global Services PMI S
0.0%
0.5%
1.0%
1.5%
2.0%
2.5%
3.0%
3.5%
4.0%
4.5%
10/2011 10/2013 10/2015 10/2017 10/2019
OECD Major 7 CPI Total Index Non-Food & Energy
Source: JP Morgan, Sentix, OECD, Bloomberg,
JP Morgan Global PMIs SENTIX Business Expectations Survey
OECD G7 Inflation Implied Inflation from Index Linked Bonds
‐60
‐50
‐40
‐30
‐20
‐10
0
10
20
30
40
50
07/2018 01/2019 07/2019 01/2020 07/2020 01/2021 07/2021
Sentix Confidence
USA Europe JapanLat Am East Europe Asia ex Jp
‐1
‐0.5
0
0.5
1
1.5
2
2.5
3
3.5
4
4.5
11/2012 11/2013 11/2014 11/2015 11/2016 11/2017 11/2018 11/2019 11/2020
%
US Constant Maturity 10 Yr Bre Germany Breakeven 10 Year UK Breakeven 10 Year
Japan Breakeven 5 Year Japan Breakeven 10 Year
MUFG Asset Management
Commentary
4
What are markets telling us?The Fed continues to roil bond markets, as this month the yield curve steepened sharply.Inflation may now be higher for longer, but Central Banks continue to say this is only temporary.Implied inflation from indexed linked bonds has risen to highs, so markets are aware of the inflation risks.Economic expectations fluctuate, but as vaccination levels rise, so does confidence in the recovery.Equities remain at high levels supported by strong earnings, while valuations are slowly improving.For now markets are behaving as normal in an economic upturn;But it will take time to understand all of the impact from the pandemic.
What are we thinking?US action on monetary and fiscal policy is a game changer, and other jurisdictions are following.Central Banks have little ammunition for the next downturn, but if inflation moves upwards they will embrace it.It is now clear that 2021 was a year of rising growth; vaccinations are providing real hope.For now we journey in hope, but markets will spend much time picking trends from volatile numbers.The problem is that equities already discount a new high in profits, and real interest rates are negative.Climate change and ESG will be an additional driver to investment trends globally.The UK is finding out the true cost of Brexit.
Fixed Income

MUFG Asset Management
Fixed Income Strategy (1)
6
DURATIONWe are short duration
No forward rates show countries having interest rates much above inflation targets in the long run.The US fiscal package is a game changer since it eliminates the output gap.High savings and wealth provide extra spending.Fed have stated they will not hike rates until both inflation is above target and employment is maximized. Here is the best chance for a shift in inflation expectations and higher market rates.What about everywhere else? Australia and Canada should largely follow.UK should too, since it is largely a service economy. Fiscal austerity has been delayed and likely will be again.EU has a fiscal boost, but will be a laggard. That should not stop yields drifting upwards though.Risks: COVID variants slowing spending, China rebalance, fiscal support can’t last for ever.
SPREAD PRODUCTStronger growth is positive, but rich valuations and risks further out prompt caution.
The economic outlook, positive growth and supportive policies, favours spread product.Despite this we have reduced our overweight for reasons given below: Spreads have come in from 330 over to 100, basically back to the historically low Pre-Covid level;Governments are in weaker positions: debt levels are higher, monetary policy limited in efficacy.US fiscal action accelerates the upturn, but raises the risk of volatility later as overheating becomes debated.

MUFG Asset Management
Forward Yield Curves
7
Source: Bloomberg,
‐1.0
‐0.5
0.0
0.5
1.0
1.5
2.0
2.5
3.0
3.5
4.0
1m 3m 6m 1y 2y 3y 5y 7y 10y 30y
DEM yield curve in 1y in 5y in 10y
USA GERMANY JAPAN
AUSTRALIA UK MEXICO
‐2.0
‐1.0
0.0
1.0
2.0
3.0
4.0
1m 3m 6m 1y 2y 3y 5y 7y 10y 30y
USD yield curve in 1y in 5y in 10y
‐2.0
‐1.0
0.0
1.0
2.0
3.0
4.0
3m 6m 1y 2y 3y 5y 7y 10y 30y
JPY yield curve in 1y in 5y in 10y
‐2.0
‐1.0
0.0
1.0
2.0
3.0
4.0
1m 3m 6m 1y 2y 3y 5y 7y 10y 30y
AUD yield curve in 1y in 5y in 10y
‐2.0
‐1.0
0.0
1.0
2.0
3.0
4.0
1m 3m 6m 1y 2y 3y 5y 7y 10y 30y
GBP yield curve in 1y in 5y in 10y
0.0
1.0
2.0
3.0
4.0
5.0
6.0
7.0
8.0
9.0
10.0
1m 3m 6m 1y 2y 3y 5y 10y 20y
MXN yield curve in 1y in 5y in 10y
MUFG Asset Management
Fixed Income Strategy (2)
8
COUNTRY ALLOCATIONWe have a slight preference for US over EU.
US forward curves put US rates in the distant future way higher than EU rates - in the long run that is wrong.Central banks will not anticipate and will keep rates low until targets are reached. Yield curves will be steep and the longer end where the action will be for some time.Changes to inflation targets make nominal yield convergence less obvious, but the differences are stark.
CURRENCYWe have limited currency positions.
USD positives: stronger economy, higher long rates, will hike rates earlier.USD negatives: current account deficit, overvalued, low rates and higher inflation not a good combination. The Euro is cheap on fundamentals, but rates are not rising and risks around the EU persist. If growth gains traction and inflation starts to rise the EU will not be eager to raise rates.

Equity

MUFG Asset Management
Equity Strategy (1)
10
GLOBALGlobal profit expectations provide strong support to equities, but momentum is slowing.
The pace in the rise of earnings expectations has slowed alongside economic optimism.Cyclical growth is the key driver, lifting previous laggards, but perhaps a change is in the air?Profit margins are at high levels, can these be sustained with rising prices and labour costs.It remains that the real damage that COVID has done to the economy or businesses is uncertain.With little room for disappointment we would not be rushing to buy equities.
Valuations have improved as strong earnings are reported.P/Es are related to future earnings growth, confidence in which has improved.The current historic P/E of 23.3x has fallen as share prices are off their highs and earnings flat.Corporates have taken on debt while at the same time boosted cash balances to all time high levels.Dividends need to grow as the cash is put to use.
Profit forecasts are not too excessive at present.The next twelve months are now forecast to see 20% profit growth, which takes us to a new high.Currently forward earnings are at 161 on a P/E of 18.5x, but dividend yields are at lows.It will be important to see how companies use their cash – return to shareholders? Invest? Or pay staff?

MUFG Asset Management
MSCI Equity Indices and Earnings (right hand axis)
11
Source: MSCI, Bloomberg,
0
20
40
60
80
100
120
140
160
180
0
500
1000
1500
2000
2500
3000
3500
4000
4500
5000
2004 2005 2006 2007 2008 2009 2010 2011 2012 2013 2014 2015 2016 2017 2018 2019 2020
MSCI USA 12m Trail EPS Shiller (10yE)PS
0
20
40
60
80
100
120
140
160
180
0
20
40
60
80
100
120
140
160
180
2004 2005 2006 2007 2008 2009 2010 2011 2012 2013 2014 2015 2016 2017 2018 2019 2020
MSCI EUROPE 12m Trail EPS Shiller (10yE)PS
‐100
‐50
0
50
100
150
200
250
300
0
200
400
600
800
1000
1200
1400
2004 2005 2006 2007 2008 2009 2010 2011 2012 2013 2014 2015 2016 2017 2018 2019 2020
MSCI JAPAN 12m Trail EPS Shiller (10yE)PS
0
10
20
30
40
50
60
70
80
90
100
0
200
400
600
800
1000
1200
1400
1600
2004 2005 2006 2007 2008 2009 2010 2011 2012 2013 2014 2015 2016 2017 2018 2019 2020
MSCI EM 12m Trail EPS Shiller (10yE)PS
WORLD
ASIA ex JAPAN GLOBAL EMERGINGJAPAN
USA EUROPE
0
5
10
15
20
25
30
35
40
45
0
100
200
300
400
500
600
700
800
2004 2005 2006 2007 2008 2009 2010 2011 2012 2013 2014 2015 2016 2017 2018 2019 2020
MSCI AC ASIA PACIFIC ex JP 12m Trail EPS Shiller (10yE)PS
0
20
40
60
80
100
120
140
0
500
1000
1500
2000
2500
3000
3500
2004 2005 2006 2007 2008 2009 2010 2011 2012 2013 2014 2015 2016 2017 2018 2019 2020
MSCI WORLD 12m Trail EPS Shiller (10yE)PS

MUFG Asset Management
Equity Strategy (2)
12
SECTORSRising inflation expectations supporting Materials and Energy.
Materials and Energy are outperforming as investors seek inflation hedges.The corollary is that interest rate sensitive Utilities are the worst performing.Earnings continue to rise, while earnings forecasts move higher at a slower pace.Consumer Staples and HealthCare are seeing a turn in relative earnings as cyclical growth slows.This year, interest rate rises have proved to be short-lived, but this time may be different.We would focus on cheap cyclicals, and avoid expensive stocks going into 2022.
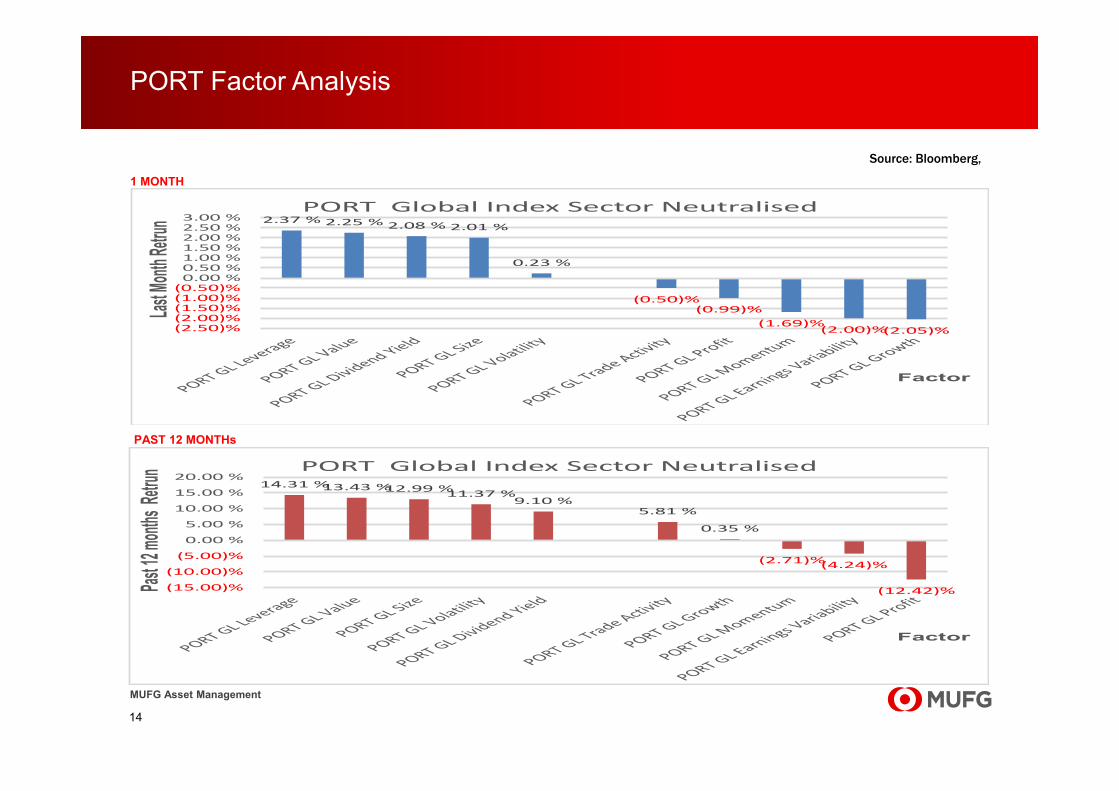
FACTORSUS interest rate expectations rose sharply – hence Value >> Growth
As to be expected rising rates led to Value outperforming along with Dividend Yield and Large Cap.Growth and Small Cap typically associated with economic recovery were weak.It is the change in Fed-speak, a more hawkish stance alongside rising prices, that has driven Value up.Earnings momentum is weakening, but remains an important influence. The rest of the year is likely to be quiet as investors consider 2022’s economic activity.

MUFG Asset Management
MSCI Equity Sectors Relative Performance and [E] Earnings(in USD)
13
Source: MSCI, Bloomberg,
LEADERSHIP OVER?
ON THE TURN?
OUT OF FAVOUR
0.0000
0.0200
0.0400
0.0600
0.0800
0.1000
0.1200
0.1400
0.0
0.1
0.2
0.3
0.4
0.5
0.6
05/200
405/
2005
05/200
605/
2007
05/200
805/
2009
05/201
005/
2011
05/201
205/
2013
05/201
405/
2015
05/201
605/
2017
05/201
805/
2019
05/202
005/
2021
Information Technology
0.0000
0.0200
0.0400
0.0600
0.0800
0.1000
0.1200
0.1400
0.0
0.1
0.2
0.3
0.4
0.5
05/200
4
05/200
5
05/200
6
05/200
7
05/200
8
05/200
9
05/201
0
05/201
1
05/201
2
05/201
3
05/201
4
05/201
5
05/201
6
05/201
7
05/201
8
05/201
9
05/202
0
05/202
1
Consumer Discretionary
0.0000
0.0200
0.0400
0.0600
0.0800
0.1000
0.1200
0.1400
0.1600
0.0
0.1
0.2
0.3
0.4
0.5
0.6
0.7
05/200
405/
2005
05/200
605/
2007
05/200
805/
2009
05/201
005/
2011
05/201
205/
2013
05/201
405/
2015
05/201
605/
2017
05/201
805/
2019
05/202
005/
2021
Utility
0.0000
0.0100
0.0200
0.0300
0.0400
0.0500
0.0600
0.0700
0.0800
0.0
0.1
0.2
0.3
05/200
4
05/200
505/
2006
05/200
705/
2008
05/200
905/
2010
05/201
105/
2012
05/201
305/
2014
05/201
505/
2016
05/201
705/
2018
05/201
905/
2020
05/202
1
Telecoms
0.0000
0.0200
0.0400
0.0600
0.0800
0.1000
0.1200
0.1400
0.1600
0.0
0.1
0.2
0.3
0.4
0.5
0.6
05/200
4
05/200
5
05/200
6
05/200
7
05/200
8
05/200
9
05/201
0
05/201
1
05/201
2
05/201
3
05/201
4
05/201
5
05/201
6
05/201
7
05/201
8
05/201
9
05/202
0
05/202
1
HealthCare
0.0000
0.0200
0.0400
0.0600
0.0800
0.1000
0.1200
0.1400
0.0
0.1
0.2
0.3
0.4
0.5
0.6
05/200
4
05/200
5
05/200
6
05/200
7
05/200
8
05/200
9
05/201
0
05/201
1
05/201
2
05/201
3
05/201
4
05/201
5
05/201
6
05/201
7
05/201
8
05/201
9
05/202
0
05/202
1
Consumer Staples
0.0800
0.0850
0.0900
0.0950
0.1000
0.1050
0.1100
0.1150
0.1200
0.1250
0.4
0.4
0.5
0.5
05/200
4
05/200
5
05/200
6
05/200
7
05/200
8
05/200
9
05/201
0
05/201
1
05/201
2
05/201
3
05/201
4
05/201
5
05/201
6
05/201
7
05/201
8
05/201
9
05/202
0
05/202
1
Industrials
0.0000
0.0200
0.0400
0.0600
0.0800
0.1000
0.1200
0.1400
0.1600
0.0
0.1
0.2
0.3
0.4
0.5
05/200
405/
2005
05/200
6
05/200
705/
2008
05/200
9
05/201
005/
2011
05/201
205/
2013
05/201
405/
2015
05/201
6
05/201
705/
2018
05/201
905/
2020
05/202
1Banks
0.0000
0.0500
0.1000
0.1500
0.2000
0.2500
0.3000
0.0
0.1
0.2
0.3
0.4
0.5
0.6
0.7
0.8
0.9
1.0
05/200
4
05/200
5
05/200
6
05/200
7
05/200
8
05/200
9
05/201
0
05/201
1
05/201
2
05/201
3
05/201
4
05/201
5
05/201
6
05/201
7
05/201
8
05/201
9
05/202
0
05/202
1
Energy
MUFG Asset Management
PORT Factor Analysis
14
Source: Bloomberg,
1 MONTH
LOSERS
2.37 % 2.25 % 2.08 % 2.01 %
0.23 %
(0.50)%(0.99)%
(1.69)%(2.00)%(2.05)%(2.50)%
(2.00)%(1.50)%(1.00)%(0.50)%0.00 %0.50 %1.00 %1.50 %2.00 %2.50 %3.00 %
Last Mo
nth Ret
run
Factor
PORT Global Index Sector Neutralised
14.31 %13.43 %12.99 %11.37 %9.10 %
5.81 %
0.35 %
(2.71)%(4.24)%
(12.42)%(15.00)%
(10.00)%
(5.00)%
0.00 %
5.00 %
10.00 %
15.00 %
20.00 %
Past 12
month
s Retru
n
Factor
PORT Global Index Sector Neutralised
PAST 12 MONTHs

Mitsubishi UFJ Asset Management (UK) Ltd.24 Lombard Street EC3V 9AJ LondonUnited Kingdom
15

MUFG Asset Management
Disclaimer
16
This document is issued by Mitsubishi UFJ Asset Management (UK) Ltd. ("MUFG: AM (UK)") which is authorised and regulated in the UK by theFinancial Conduct Authority (“FCA”) No. 121816. Information within this document may contain material that may be interpreted by the relevantauthorities in your country as a financial promotion or an offer to purchase securities. Accordingly this information is only intended for personswho fall outside the scope of any law that seeks to regulate financial promotions in the country of your residence. The information provided inthis document is not intended for any United States person or any person in the United States, any state thereof, or any of its territories orpossessions. This report is prepared for professional investors and is not intended for retail clients as defined in the FCA rules.
The information contained in this report has been taken from sources which we deem reliable but we do not represent that such information isaccurate or complete in part or in whole. Any opinions expressed here reflect our judgement at this date and are subject to change. Althoughwe have taken all reasonable care that the information contained within this document is accurate at the time of publication, we make norepresentation or warranty (including liability towards third parties) express or implied, as to its accuracy, reliability or completeness. If you relyon this document, you do so at your own risk. We expressly disclaim any duty of care which we might otherwise owe to any person relying onthis material. Any opinions expressed here reflect our judgement at this date and are subject to change.
Any reference to past performance should not be taken as a guide to future performance. The value of investments may go down as well as up.
Companies in the Mitsubishi UFJ Financial Group and connected persons may have positions in, or may perform or seek to perform advisory orbanking services to companies whose securities are mentioned herein. Mitsubishi UFJ Asset Management (UK) Ltd. or related companies mayhave used researched material before publication and may have positions in or may be materially interested in any of the securities mentioned.This brochure does not constitute an offer or a solicitation of an offer to buy a security. Neither MUFG: AM (UK) nor any of its related companiesaccept any liability whatsoever for any direct or indirect or consequential loss arising from any use of information or material contained herein.
MUFG Asset Management is a brand of Mitsubishi UFJ Trust and Banking Corporation, along with its subsidiaries, Mitsubishi UFJ KokusaiAsset Management, MU Investments, and Mitsubishi UFJ Asset Management (UK) Ltd.
Copyright 2021 Mitsubishi UFJ Asset Management (UK) Ltd.