Embed Size (px)
Citation preview
RESEARCH
GLOBAL INVESTMENT2013/2014
GLOBAL TRENDS ISLAMIC INVESTMENT KEY CITY DATA

city performance
CitiGroup Center Sydney
Please note that the values given do not constitute a valuation and do not relate to any of the buildings in the above graphic or indeed any other buildings. The forecasts are indicative only and guidance should be sought for specific investment opportunities.
Note: The figures in the graphic represent a “hypothetical” capital value per sq m for a prime office building in each of the cities above, based on our view of current prime rents and yields. The estimate for the end of 2014 reflects our opinion of how rents and yields are likely to move by the end of the year and assumes a constant exchange rate versus the US Dollar.
LONDONDUBAISYDNEY HONG KONG SINGAPORE FRANKFURT SHANGHAI PARISNEW YORK TOKYO
The cities below offer some of the highest-quality office space in the world. These figures represent our view of the current prime capital values per square metre in each city and performance trends for 2014.
Capital Value per square metre ($USD)
2014
2013
$28,895
$24,412
$25,132
$23,735
$9,417
$8,942
$13,437
$12,648
$22,553
$20,568
$30,788
$31,271
$67,730
$66,078
$13,778
$14,040
$10,629
$9,263
$11,671
$10,696

4
GLOBAL INVESTMENT 2013/2014
Demand for prime commercial property in the world’s major cities will continue to strengthen.
0
200
400
600
800
1,000
2013*201220112010200920082007
USD
bn
HOTELSINDUSTRIAL
RETAILOFFICES
FIGURE 2 Global share of commercial investment transactions by sector
Source: Real Capital AnalyticsData excludes apartments and development sites*2013 year to date as at mid-September
0.0%
1.0%
2.0%
3.0%
4.0%
5.0%
6.0%
7.0%
8.0%
9.0%
Euro
Are
a
Cent
ral &
East
ern
Euro
pe
Unite
d St
ates
Glob
al
Indi
a
Chin
a
20142013
FIGURE 1 GDP growth forecasts
Source: IMF (July 2013)
global trends
The Euro area has finally emerged from recession, although the recovery remains fragile. However, the recovery in the US, which had been gaining momentum, now faces the uncertainty of a partial shutdown of the federal government.
Parts of Asia Pacific have seen prospects weaken in the first half of 2013, most notably in China and India. Concerns over the possible tapering of US Federal Reserve bond purchases has led to significant capital outflows from emerging markets, although the US Federal Reserve’s decision to delay the process has alleviated these to some extent.
From a real estate investor’s perspective, the greater stability being seen in Europe is, arguably, the most important change on a year ago. Indeed, both the EU27 and the Euro area recorded GDP growth of 0.3% in Q2. While a number of countries are still in recession – including Spain, Italy and Greece – the pace of decline has eased.
Despite the improving economic news, the recovery in global occupier markets has so far been patchy. While take-up in key US cities has accelerated in 2013, slower growth and large development pipelines have led to increased caution in parts of Central Europe and Asia Pacific. In Europe, the balance of power remains with occupiers, although the better economic news is gradually feeding
through to increased activity and vacancy rates are generally on a downward trend.
Across the sectors, TMT companies look set to be a major driver of growth for the foreseeable future, most notably in cities such as New York, London, Hong Kong and Singapore. Indeed, the recent green light for Google’s new 900,000 sq ft headquarters in London is representative of this trend.
The improved economic backdrop has nonetheless boosted property investment activity, with data from Real Capital Analytics suggesting that global transaction volumes for commercial property amounted to USD224bn in H1 2013, up 11.7% on H1 2012. Much of the increase has been generated by a faster recovery in the US market.
For Europe meanwhile, volumes reached €74bn in H1 2013 – a year-on-year rise of 7% – delivered in part through improved activity in Spain and Italy. However, investor demand in the periphery is focused keenly on prime assets let to strong covenants. In the first half of this year, Asia Pacific saw a year-on-year rise of 6% in commercial transaction volumes to USD56.9bn, although this figure excludes Chinese land deals which continue to account for the bulk of activity in the region.
In gateway cities and robust economies there is evidence of increasing investor appetite for riskier assets and markets.
Just over a year after the announcement of a third round of Quantitative Easing (QE) in the US and Mario Draghi’s “we’ll do whatever it takes” statement on the Euro, sentiment in both the global economy and the property market has improved.
5
GLOBAL INVESTMENT 2013/2014
0
200
400
600
800
1,000
2013*201220112010200920082007
USD
bn
ASIA PACIFIC
AMERICAS
EMEA
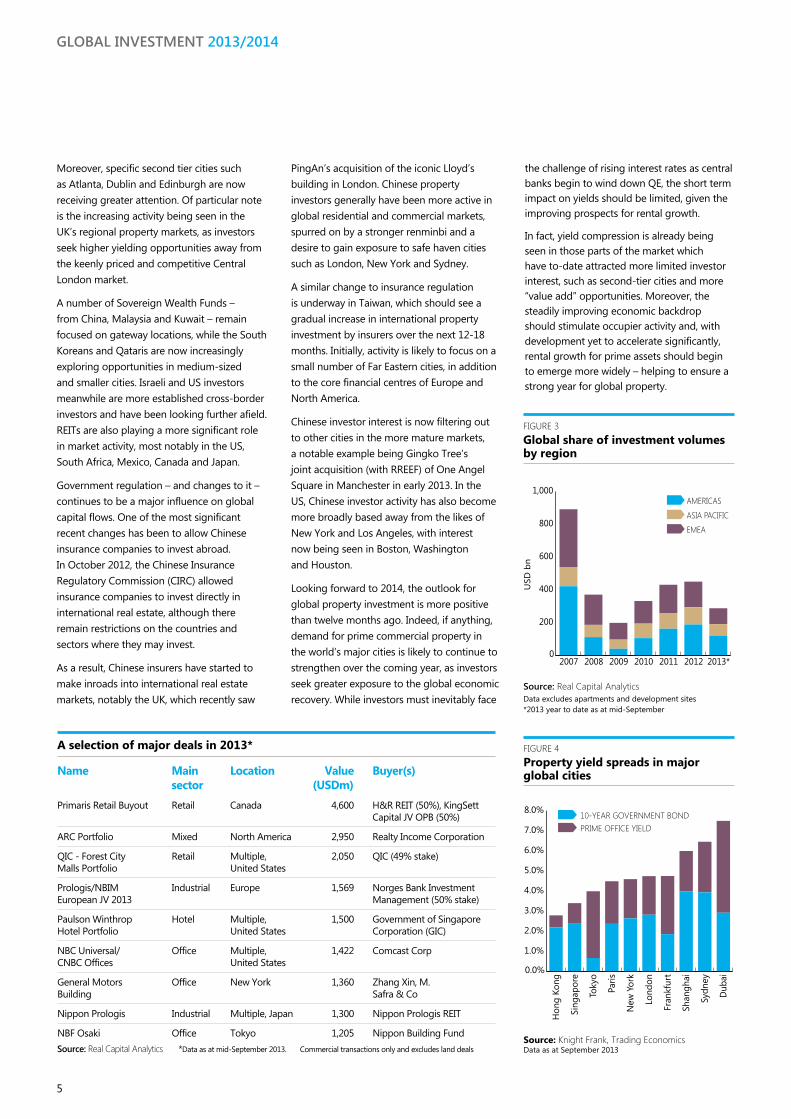
FIGURE 3 Global share of investment volumes by region
Source: Real Capital AnalyticsData excludes apartments and development sites*2013 year to date as at mid-September
0.0%
1.0%
2.0%
3.0%
4.0%
5.0%
6.0%
7.0%
8.0%
Dub
ai
Sydn
ey
Shan
ghai
Fran
kfur
t
Lond
on
New
Yor
k
Paris
Toky
o
Sing
apor
e
Hon
g Ko
ng
PRIME OFFICE YIELD10-YEAR GOVERNMENT BOND
FIGURE 4 Property yield spreads in major global cities
Source: Knight Frank, Trading EconomicsData as at September 2013
Moreover, specific second tier cities such as Atlanta, Dublin and Edinburgh are now receiving greater attention. Of particular note is the increasing activity being seen in the UK’s regional property markets, as investors seek higher yielding opportunities away from the keenly priced and competitive Central London market.
A number of Sovereign Wealth Funds – from China, Malaysia and Kuwait – remain focused on gateway locations, while the South Koreans and Qataris are now increasingly exploring opportunities in medium-sized and smaller cities. Israeli and US investors meanwhile are more established cross-border investors and have been looking further afield. REITs are also playing a more significant role in market activity, most notably in the US, South Africa, Mexico, Canada and Japan.
Government regulation – and changes to it – continues to be a major influence on global capital flows. One of the most significant recent changes has been to allow Chinese insurance companies to invest abroad. In October 2012, the Chinese Insurance Regulatory Commission (CIRC) allowed insurance companies to invest directly in international real estate, although there remain restrictions on the countries and sectors where they may invest.
As a result, Chinese insurers have started to make inroads into international real estate markets, notably the UK, which recently saw
PingAn’s acquisition of the iconic Lloyd’s building in London. Chinese property investors generally have been more active in global residential and commercial markets, spurred on by a stronger renminbi and a desire to gain exposure to safe haven cities such as London, New York and Sydney.
A similar change to insurance regulation is underway in Taiwan, which should see a gradual increase in international property investment by insurers over the next 12-18 months. Initially, activity is likely to focus on a small number of Far Eastern cities, in addition to the core financial centres of Europe and North America.
Chinese investor interest is now filtering out to other cities in the more mature markets, a notable example being Gingko Tree’s joint acquisition (with RREEF) of One Angel Square in Manchester in early 2013. In the US, Chinese investor activity has also become more broadly based away from the likes of New York and Los Angeles, with interest now being seen in Boston, Washington and Houston.
Looking forward to 2014, the outlook for global property investment is more positive than twelve months ago. Indeed, if anything, demand for prime commercial property in the world’s major cities is likely to continue to strengthen over the coming year, as investors seek greater exposure to the global economic recovery. While investors must inevitably face
the challenge of rising interest rates as central banks begin to wind down QE, the short term impact on yields should be limited, given the improving prospects for rental growth.
In fact, yield compression is already being seen in those parts of the market which have to-date attracted more limited investor interest, such as second-tier cities and more “value add” opportunities. Moreover, the steadily improving economic backdrop should stimulate occupier activity and, with development yet to accelerate significantly, rental growth for prime assets should begin to emerge more widely – helping to ensure a strong year for global property.
A selection of major deals in 2013*
Name Main Location Value Buyer(s) sector (USDm)Primaris Retail Buyout Retail Canada 4,600 H&R REIT (50%), KingSett Capital JV OPB (50%)
ARC Portfolio Mixed North America 2,950 Realty Income Corporation
QIC - Forest City Retail Multiple, 2,050 QIC (49% stake) Malls Portfolio United States
Prologis/NBIM Industrial Europe 1,569 Norges Bank Investment European JV 2013 Management (50% stake)
Paulson Winthrop Hotel Multiple, 1,500 Government of Singapore Hotel Portfolio United States Corporation (GIC)
NBC Universal/ Office Multiple, 1,422 Comcast Corp CNBC Offices United States
General Motors Office New York 1,360 Zhang Xin, M. Building Safra & Co
Nippon Prologis Industrial Multiple, Japan 1,300 Nippon Prologis REIT
NBF Osaki Office Tokyo 1,205 Nippon Building FundSource: Real Capital Analytics *Data as at mid-September 2013. Commercial transactions only and excludes land deals
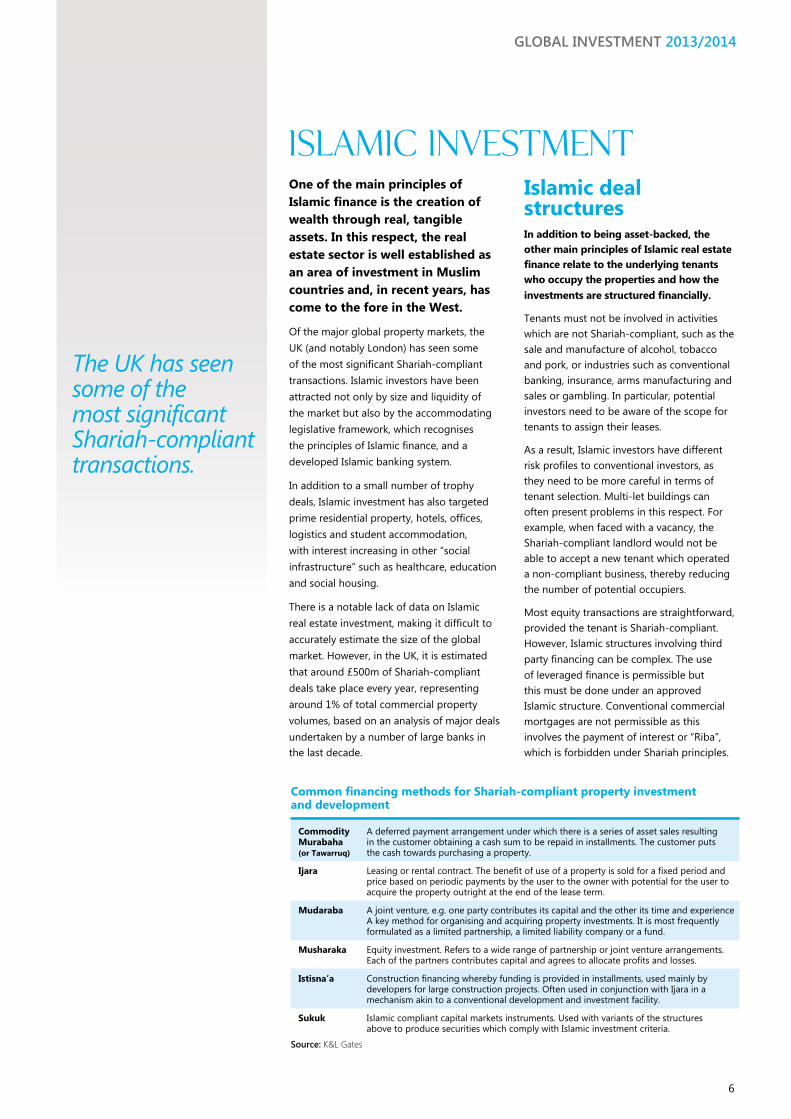
One of the main principles of Islamic finance is the creation of wealth through real, tangible assets. In this respect, the real estate sector is well established as an area of investment in Muslim countries and, in recent years, has come to the fore in the West.
Of the major global property markets, the UK (and notably London) has seen some of the most significant Shariah-compliant transactions. Islamic investors have been attracted not only by size and liquidity of the market but also by the accommodating legislative framework, which recognises the principles of Islamic finance, and a developed Islamic banking system.
In addition to a small number of trophy deals, Islamic investment has also targeted prime residential property, hotels, offices, logistics and student accommodation, with interest increasing in other “social infrastructure” such as healthcare, education and social housing.
There is a notable lack of data on Islamic real estate investment, making it difficult to accurately estimate the size of the global market. However, in the UK, it is estimated that around £500m of Shariah-compliant deals take place every year, representing around 1% of total commercial property volumes, based on an analysis of major deals undertaken by a number of large banks in the last decade.
Islamic deal structuresIn addition to being asset-backed, the other main principles of Islamic real estate finance relate to the underlying tenants who occupy the properties and how the investments are structured financially.
Tenants must not be involved in activities which are not Shariah-compliant, such as the sale and manufacture of alcohol, tobacco and pork, or industries such as conventional banking, insurance, arms manufacturing and sales or gambling. In particular, potential investors need to be aware of the scope for tenants to assign their leases.
As a result, Islamic investors have different risk profiles to conventional investors, as they need to be more careful in terms of tenant selection. Multi-let buildings can often present problems in this respect. For example, when faced with a vacancy, the Shariah-compliant landlord would not be able to accept a new tenant which operated a non-compliant business, thereby reducing the number of potential occupiers.
Most equity transactions are straightforward, provided the tenant is Shariah-compliant. However, Islamic structures involving third party financing can be complex. The use of leveraged finance is permissible but this must be done under an approved Islamic structure. Conventional commercial mortgages are not permissible as this involves the payment of interest or “Riba”, which is forbidden under Shariah principles.
Islamic investment
The UK has seen some of the most significant Shariah-compliant transactions.
GLOBAL INVESTMENT 2013/2014
6
Common financing methods for Shariah-compliant property investment and development
Commodity A deferred payment arrangement under which there is a series of asset sales resulting Murabaha in the customer obtaining a cash sum to be repaid in installments. The customer puts (or Tawarruq) the cash towards purchasing a property.
Ijara Leasing or rental contract. The benefit of use of a property is sold for a fixed period and price based on periodic payments by the user to the owner with potential for the user to acquire the property outright at the end of the lease term.
Mudaraba A joint venture, e.g. one party contributes its capital and the other its time and experience A key method for organising and acquiring property investments. It is most frequently formulated as a limited partnership, a limited liability company or a fund.
Musharaka Equity investment. Refers to a wide range of partnership or joint venture arrangements. Each of the partners contributes capital and agrees to allocate profits and losses.
Istisna’a Construction financing whereby funding is provided in installments, used mainly by developers for large construction projects. Often used in conjunction with Ijara in a mechanism akin to a conventional development and investment facility.
Sukuk Islamic compliant capital markets instruments. Used with variants of the structures above to produce securities which comply with Islamic investment criteria.
Source: K&L Gates
7
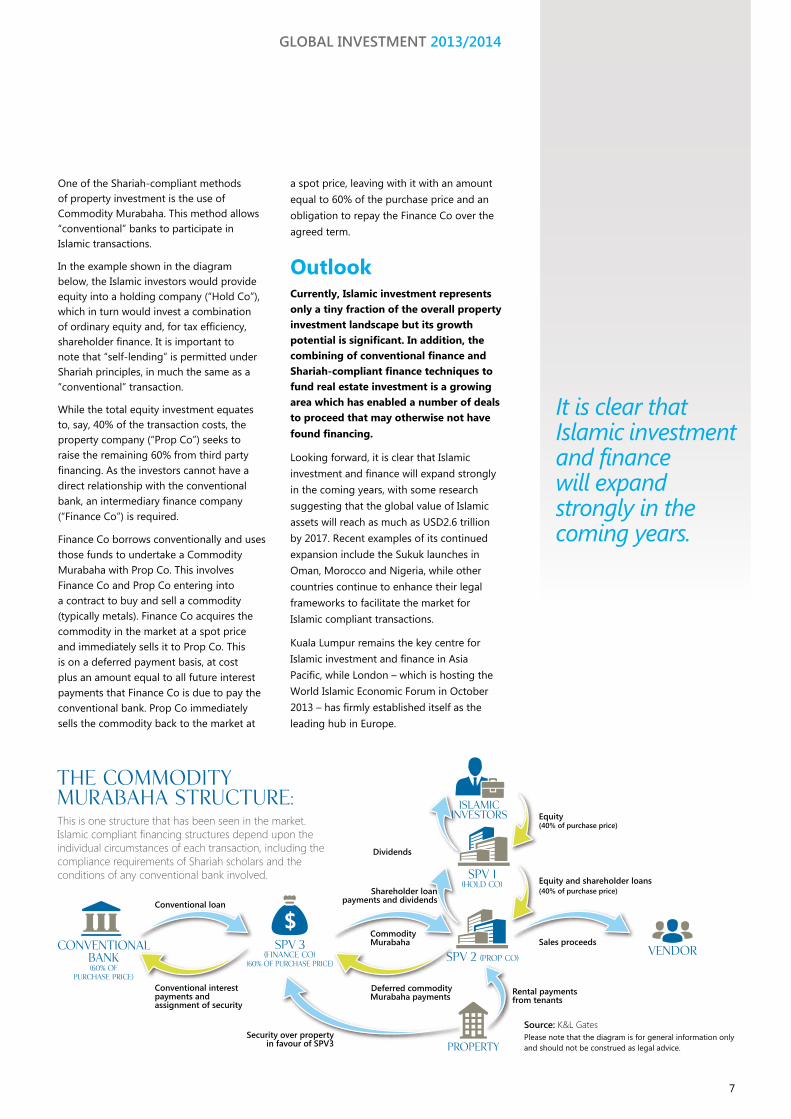
One of the Shariah-compliant methods of property investment is the use of Commodity Murabaha. This method allows “conventional” banks to participate in Islamic transactions.
In the example shown in the diagram below, the Islamic investors would provide equity into a holding company (“Hold Co”), which in turn would invest a combination of ordinary equity and, for tax efficiency, shareholder finance. It is important to note that “self-lending” is permitted under Shariah principles, in much the same as a “conventional” transaction.
While the total equity investment equates to, say, 40% of the transaction costs, the property company (“Prop Co”) seeks to raise the remaining 60% from third party financing. As the investors cannot have a direct relationship with the conventional bank, an intermediary finance company (“Finance Co”) is required.
Finance Co borrows conventionally and uses those funds to undertake a Commodity Murabaha with Prop Co. This involves Finance Co and Prop Co entering into a contract to buy and sell a commodity (typically metals). Finance Co acquires the commodity in the market at a spot price and immediately sells it to Prop Co. This is on a deferred payment basis, at cost plus an amount equal to all future interest payments that Finance Co is due to pay the conventional bank. Prop Co immediately sells the commodity back to the market at
a spot price, leaving with it with an amount equal to 60% of the purchase price and an obligation to repay the Finance Co over the agreed term.
OutlookCurrently, Islamic investment represents only a tiny fraction of the overall property investment landscape but its growth potential is significant. In addition, the combining of conventional finance and Shariah-compliant finance techniques to fund real estate investment is a growing area which has enabled a number of deals to proceed that may otherwise not have found financing.
Looking forward, it is clear that Islamic investment and finance will expand strongly in the coming years, with some research suggesting that the global value of Islamic assets will reach as much as USD2.6 trillion by 2017. Recent examples of its continued expansion include the Sukuk launches in Oman, Morocco and Nigeria, while other countries continue to enhance their legal frameworks to facilitate the market for Islamic compliant transactions.
Kuala Lumpur remains the key centre for Islamic investment and finance in Asia Pacific, while London – which is hosting the World Islamic Economic Forum in October 2013 – has firmly established itself as the leading hub in Europe.
islamicinvestors
SPV 1(Hold Co)
SPV 2 (PROP Co)
property
SPV 3(finance Co)
(60% of Purchase Price)
ConventionalBank(60% of
Purchase Price)
vendor
The CommodityMurabaha Structure:
islamicinvestors
SPV 1(Hold Co)
SPV 2(Hold Co)
property
SPV 3(finance Co)
(60% of PurchasePrice)
ConventionalBank(60% of
Purchase Price)
vendor
The CommodityMurabaha Structure:
islamicinvestors
SPV 1(Hold Co)
SPV 2(Hold Co)
property
SPV 3(finance Co)
(60% of PurchasePrice)
ConventionalBank(60% of
Purchase Price)
vendor
The CommodityMurabaha Structure:
This is one structure that has been seen in the market. Islamic compliant financing structures depend upon theindividual circumstances of each transaction, including thecompliance requirements of Shariah scholars and theconditions of any conventional bank involved.
Conventional interestpayments and assignment of security
Security over propertyin favour of SPV3
Deferred commodityMurabaha payments
CommodityMurabaha
Shareholder loanpayments and dividends
Dividends
Equity (40% of purchase price)
Equity and shareholder loans (40% of purchase price)
Rental paymentsfrom tenants
Sales proceeds
Conventional loan
$
This is one structure that has been seen in the market. Islamic compliant financing structures depend upon theindividual circumstances of each transaction, including thecompliance requirements of Shariah scholars and theconditions of any conventional bank involved.
Conventional interestpayments and assignment of security
Security over property in
favour of SPV3
Deferred commodityMurabaha payments
CommodityMurabaha
Shareholder loanpayments and dividends
DividendsEquity (40% of purchase price)
Equity and shareholder loans (40% of purchase price)
Rental paymentsfrom tenants
Sales proceeds
Conventional loan
Source: K&L GatesPlease note that the diagram is for general information only and should not be construed as legal advice.
It is clear that Islamic investment and finance will expand strongly in the coming years.
GLOBAL INVESTMENT 2013/2014
Knight Frank Research provides strategic advice, consultancy services and forecasting to a wide range of clients worldwide including developers, investors, funding organisations, corporate institutions and the public sector. All our clients recognise the need for expert independent advice customised to their specific needs.
Knight Frank Research Reports are available at www.KnightFrank.com/Research
© Knight Frank LLP 2013This report is published for general information only. Although high standards have been used in the preparation of the information, analysis, views and projections presented in this report, no legal responsibility can be accepted by Knight Frank Research or Knight Frank LLP for any loss or damage resultant from the contents of this document. As a general report, this material does not necessarily represent the view of Knight Frank LLP in relation to particular properties or projects. Reproduction of this report in whole or in part is allowed with proper reference to Knight Frank Research.
Knight Frank LLP is a limited liability partnership registered in England with registered number OC305934. Our registered office is 55 Baker Street, London, W1U 8AN, where you may look at a list of members’ names.
Notes & acknowledgements
The photo on the front cover is 65/67 Avenue des Champs Elysées in Paris, which Knight Frank acquired on behalf of Thor Equities from a private investor in October 2013.
The authors are grateful to Adam Cavanagh of ACRE Global and K&L Gates for their expertise in Islamic investment.
RESEARCH
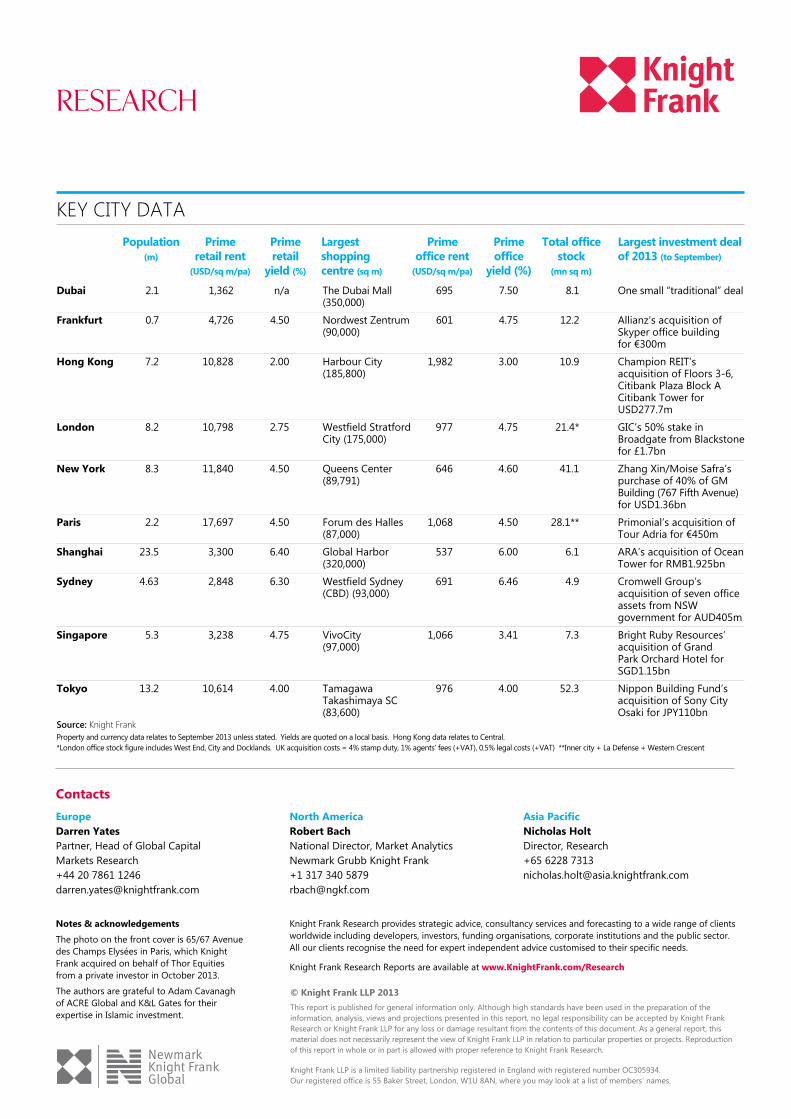
KEY CITY DATA Population Prime Prime Largest Prime Prime Total office Largest investment deal (m) retail rent retail shopping office rent office stock of 2013 (to September) (USD/sq m/pa) yield (%) centre (sq m) (USD/sq m/pa) yield (%) (mn sq m)
Dubai 2.1 1,362 n/a The Dubai Mall 695 7.50 8.1 One small “traditional” deal (350,000)Frankfurt 0.7 4,726 4.50 Nordwest Zentrum 601 4.75 12.2 Allianz’s acquisition of (90,000) Skyper office building for €300mHong Kong 7.2 10,828 2.00 Harbour City 1,982 3.00 10.9 Champion REIT’s (185,800) acquisition of Floors 3-6, Citibank Plaza Block A Citibank Tower for USD277.7mLondon 8.2 10,798 2.75 Westfield Stratford 977 4.75 21.4* GIC’s 50% stake in City (175,000) Broadgate from Blackstone for £1.7bnNew York 8.3 11,840 4.50 Queens Center 646 4.60 41.1 Zhang Xin/Moise Safra’s (89,791) purchase of 40% of GM Building (767 Fifth Avenue) for USD1.36bnParis 2.2 17,697 4.50 Forum des Halles 1,068 4.50 28.1** Primonial’s acquisition of (87,000) Tour Adria for €450mShanghai 23.5 3,300 6.40 Global Harbor 537 6.00 6.1 ARA’s acquisition of Ocean (320,000) Tower for RMB1.925bnSydney 4.63 2,848 6.30 Westfield Sydney 691 6.46 4.9 Cromwell Group’s (CBD) (93,000) acquisition of seven office assets from NSW government for AUD405mSingapore 5.3 3,238 4.75 VivoCity 1,066 3.41 7 3 Bright Ruby Resources’ (97,000) acquisition of Grand Park Orchard Hotel for SGD1.15bnTokyo 13.2 10,614 4.00 Tamagawa 976 4.00 52.3 Nippon Building Fund’s Takashimaya SC acquisition of Sony City (83,600) Osaki for JPY110bnSource: Knight Frank Property and currency data relates to September 2013 unless stated. Yields are quoted on a local basis. Hong Kong data relates to Central.*London office stock figure includes West End, City and Docklands. UK acquisition costs = 4% stamp duty, 1% agents’ fees (+VAT), 0.5% legal costs (+VAT) **Inner city + La Defense + Western Crescent
EuropeDarren Yates Partner, Head of Global Capital Markets Research +44 20 7861 1246 [email protected]
North AmericaRobert Bach National Director, Market Analytics Newmark Grubb Knight Frank +1 317 340 5879 [email protected]
Asia PacificNicholas Holt Director, Research +65 6228 7313 [email protected]
Contacts