Embed Size (px)
Citation preview
Global Forest Watch
Global Forest Watch is an international network that providestimely, accurate, and balanced information and analysis onforests and forest use to promote public understanding,informed decision-making, support for practical managementsolutions, and enhanced accountability. The World ResourcesInstitute launched Global Forest Watch in 1997.
Global Forest Watch Canada
Global Forest Watch Canada is a partner in the Global ForestWatch network, and was formed to provide access to morecomplete information about development activities inCanada’s forests and their environmental impacts. We areconvinced that providing greater information about Canada’sforests will lead to better decision-making on forestmanagement and use, which ultimately will result in forestmanagement regimes that provide a full range of benefits forboth present and future generations.
Edmonton, Alberta Canada2003
Canada’s Large IntactForest Landscapes
A report by Global Forest Watch Canada
By:Peter Lee (Global Forest Watch Canada)
Dmitry Aksenov (Socio-Ecological Union International)Lars Laestadius (World Resources Institute)Ruth Nogueron (World Resources Institute)Wynet Smith (Global Forest Watch Canada)
Canada’s Large Intact Forest LandscapesA report by Global Forest Watch Canada
By:Peter Lee (Global Forest Watch Canada)
Dmitry Aksenov (Socio-Ecological Union International)Lars Laestadius (World Resources Institute)Ruth Nogueron (World Resources Institute)Wynet Smith (Global Forest Watch Canada)
GIS analysis and research:Maxim Dubinin (Biodiversity Conservation Center)
Jeannette Gysbers (Global Forest Watch Canada)Kathleen Hebb (Forest Watch of British Columbia)
Mikhail Karpachevskiy (Biodiversity Conservation Center)Peter Potapov (Greenpeace Russia)
Andrey Purekhovskiy (Biodiversity Conservation Center)Zoran Stanojevic (Global Forest Watch Canada)
Svetlana Turubanova (Greenpeace Russia)Alexey Yegorov (Biodiversity Conservation Center)
Collaborators:Frank Ahern (TerreVista Earth Imaging)
Daniel Kelley (Conservation Research Center, Smithsonian Institution)Peter Leimgruber (Conservation Research Center, Smithsonian Institution)
Susan Minnemeyer (World Resources Institute)Aran O’Carroll (Forest Watch of British Columbia)
Tyson Walker (World Resources Institute)Science and technical advice:
Ralph Ridder (World Resources Institute)Jim Strittholt (Conservation Biology Institute)
Alexey Yaroshenko (Greenpeace Russia)
Cover photos:Mikhail Karpachevskiy and Andrey Porekhovskiy
Map design and general layout:Dmitry Aksenov and Ilya Belov
Edmonton, Alberta Canada2003
ISBN: 1-56973-560-3
© Global Forest Watch Canada, 2003© World Resources Institute, 2003
Citation:Lee, Peter, Dmitry Aksenov, Lars Laestadius, Ruth Nogueron, Wynet Smith. 2003.
Canada’s Large Intact Forest Landscapes. Global Forest Watch Canada, Edmonton, Alberta. 84 pp.

Table of Contents
Text Section
Acknowledgements ......................................................................................................................................... 5
Executive Summary ........................................................................................................................................ 8
Chapter 1. Introduction ............................................................................................................................... 11
Chapter 2. Intact Forest Landscapes: Study Area, Definitions and Criteria ................................................... 18
Chapter 3. Methods ..................................................................................................................................... 27
Chapter 4. Results ........................................................................................................................................ 40
Chapter 5. Conclusions ................................................................................................................................ 48
Glossary ...................................................................................................................................................... 50
Annex — Review Process .............................................................................................................................. 53
Footnotes...................................................................................................................................................... 59
Contact Information/Partners ....................................................................................................................... 68
Map Section
Legend ...................................................................................................................................................... 70
Index for provincial maps1 ............................................................................................................................. 71
Yukon Territory and Northwest Territories2 .................................................................................... 72
British Columbia and Alberta2 ........................................................................................................ 74
Saskatchewan and Manitoba2 ......................................................................................................... 76
Ontario2 ......................................................................................................................................... 78
Québec and Newfoundland & Labrador2 ........................................................................................ 80
Thematic maps
Canada by province1 ....................................................................................................................... 82
Canada by ecozone1 ....................................................................................................................... 83
Canada by Aboriginal historic treaties and modern settled land claims1 ........................................... 84
1. Scale 1:24 million
2. Scale 1:6 million
4 Canada’s Large Intact Forest Landscapes
List of Boxes
Box 1. Importance of the Canadianforest economy ....................................................11
Box 2. The precautionary approach ......................17
List of Tables
Table 1. Overview of forest intactnessand conservation value concepts ..........................14
Table 2. Change in frontier forest cover.................16
Table 3. Specific disturbances discernablewith satellite imagery ............................................34
Table 4. Large intact forest landscapes (LIFL)of Canada ............................................................40
Table 5. LIFL within boreal and temperateregions .................................................................40
Table 6. LIFL distribution within ecozones ..........42
Table 7. LIFL distribution within provincesand territories .......................................................43
Table 8. Distribution of LIFL among provincesand territories in Canada ......................................45
Table 9. LIFL within historic First Nationstreaties and modern land claim settlements ..........45
Table 10. LIFL within protected areas(by forest zone and jurisdiction) ...........................46
Table 11. LIFL within individual national parks ...47
List of Boxes, Tables, and Figures
List of Figures
Figure 1. Study area .............................................18
Figure 2. Terrestrial ecozones of Canadaand northern forest boundary ...............................19
Figure 3. Significant kinds of human-causeddisturbance ..........................................................23
Figure 4. Landsat 7 and ASTER imagery usedin this study..........................................................28
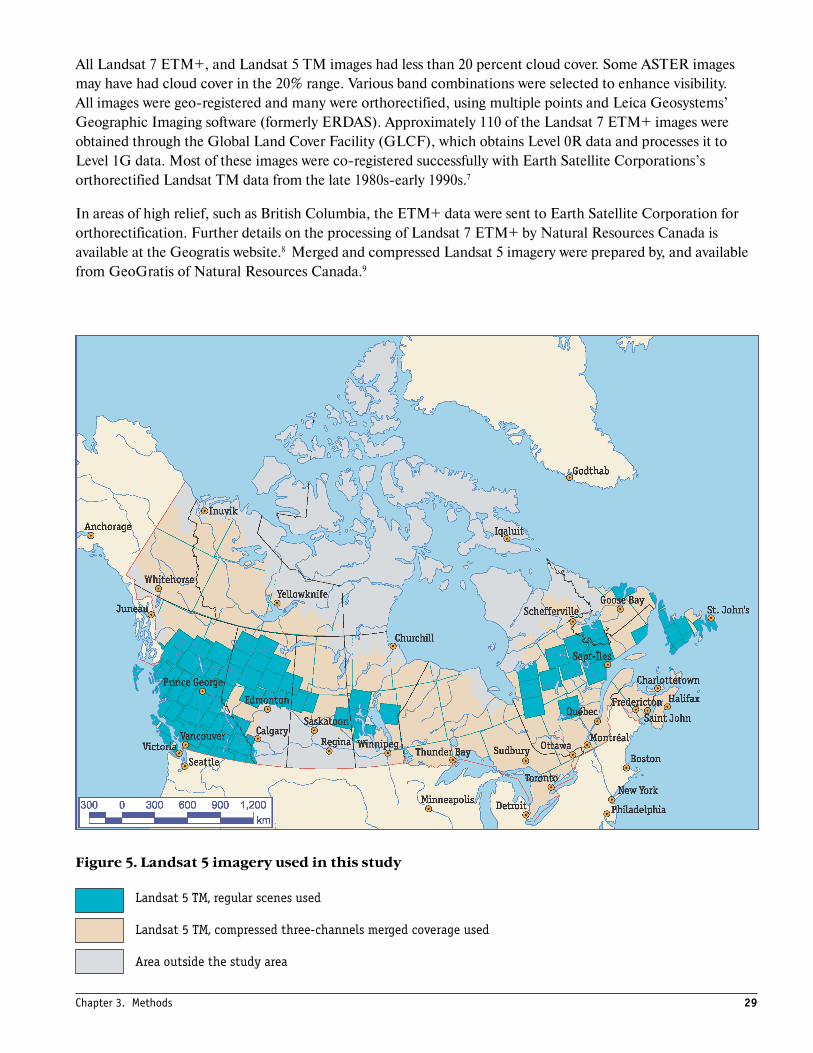
Figure 5. Landsat 5 imagery used in this study ......29
Figure 6. Fire scars (~1950 to ~2000) ...................32
Figure 7. Stepwise approach to mapping...............33
Figure 8. Accuracy and field verifications .............38
Figure 9. Area of forest landscapes by ecozone .....41
Figure 10. Area of forest landscapes in Canadaby jurisdiction ......................................................44
5
Acknowledgements
The work on identification of Canada’s intact forest landscapes was supported by the home furnishingscompany IKEA, the World Resources Institute, the Doris Duke Charitable Foundation, the Canada BorealInitiative, and the Richard and Rhoda Goldman Fund. The work benefited from software donated byEnvironmental Systems Research Institute Inc. (ESRI) and Leica Geosystems’ Geographic Imaging(ERDAS). Their support is gratefully acknowledged.
The authors thank the expert reviewers who contributed to improvements made during the development of thisproject:
Albertans for a Wild Chinchaga• Helene Walsh
Canada Boreal Initiative• Cathy Wilkinson
Canadian Forest Products Ltd.• Paul T. Wooding
Canadian Parks and Wilderness Society• Tim Gray• Corrie Leung• Eva Riccius
Chetwynd Environmental Society• Dr. Wayne Sawchuk
Chrysalis Forestry Ltd.• Evan Stewart
Clayoquot Progressive Ventures• Nicole Rycroft
Consultants• Dr. Steve Cumming• Jim Finnigan
David Suzuki Foundation• Cheri Burda• Panos Grames• Faisal Moola
Domtar Inc.• Brian Nicks
Edmonton Mycological Society• Bill Richards
Forest Action Network• Patrick Venditti
Forest Ethics• Candace Batycki• Jim Ford
Forest Products Association of Canada• Mark Hubert
Forest Watch of British Columbia• Denise Allen• Laurel Brewster• Denise English• Clive Johnson• Craig Pettitt• Heidi Ward
Government of Alberta (Alberta SustainableResource Development)
• Dr. R.J. (Bob) Fessenden
Government of British Columbia• Ken Baker (Ministry of Forests)• Malcolm Gray (Sustainable Resource
Management)
Government of Manitoba (Conservation)• Norman B. Brandson• Greg Carlson
Government of Northwest Territories (Resources,Wildlife and Economic Development)
• Robert McLeod
Government of Ontario (Natural Resources)• Michael Gluck• M.L. Willick
Government of Saskatchewan• Xilin Fang
Grand Council of the Cree• Geoff Quaile
Greenpeace Canada• Gavin Edwards
Acknowledgements
6 Canada’s Large Intact Forest Landscapes
IKEA• Sofie Beckham (IKEA Trading Services
Canada Inc.)• Hans Djurberg (IKEA International)• Pär Stenmark (IKEA International)
J.D. Irving• Blake Brunsdon
Natural Resources Canada• Robert Landry• Don Leckie• Tim Lynham• Jim Wood• Dr. Mike Wulder
Natural Resources Defense Council• Matt Price
Nuxalk Nation• Lewis Mack Mecham
Okanagan Similkameen Parks Society• Don Sloan
Ontario Wildlands League• Chris Henschel
Shuswap Environmental Action Society• Jim Cooperman
Shuswap Nation Tribal Council• Carl Mashon
Sierra Club of Canada• Rachel Plotkin
Taiga Rescue Network• Don Sullivan
TerreVista Earth Imaging• Dr. Frank Ahern
Universite de Moncton• Marc-Andre Villard
University of Alberta• Alastair Franke• BEACONs Group• Dr. David Schindler• Dr. Fiona Schmiegelow• Jason Young (graduate student)• Mark Kachmar (graduate student)• Stephen Hamilton (graduate student)
University of Maryland• Alice Alstatt• Dr. Eric Kasischke
University of Manitoba• Dr. William Pruitt
Valhalla Wilderness Society• Louise Molloy
Weyerhaeuser• Dr. Zhenkui Ma• Stephen M. Smith
World Resources Institute• Lauretta Burke• Dr. Don Doering• Norbert Henninger• Dr. David Jhirad• Marta Miranda
World Wildlife Fund Canada• Tony Iacobelli
The authors thank the following for the data, advice, support, research, coordination and various other keyfunctions:
Consultant• Colin Stewart
Federation of Alberta Naturalists• Vid Bijelic• Marijana Bijelic• Glen Semenchuk• Michael Semenchuk
Federation of Ontario Naturalists• Julee Boan
Global Forest Watch Canada (Board of Directors)• Alan Appleby• Aran O’Carroll• Geoff Quaile• Tim Gray• Will Horter• Wynet Smith
Government of Alberta (Alberta SustainableResource Development)
• Daryl Price
7
Government of British Columbia• David Morel (Ministry of Forests)• Enrique Sanchez (Sustainable Resource
Management)
Government of Manitoba (Conservation)• John Dojack (Conservation)• Roy Dixon (Natural Resources)
Natural Resources Canada• Claude Leger
Ontario Wildlands League• Julien Holentstein
Pushchino State University• Olga Smirnova
University of Maryland• Ben White
Valhalla Wilderness Society• Baden Cross• Colleen McCrory
World Resources Institute• Steve Cox• Isabel Munilla
World Wildlife Fund Canada• Alexis Morgan
The authors thank all suppliers of imagery for their invaluable help. The completion of this work, in its presentview, would have been impossible without these images.
Advanced Spaceborne Thermal Emission and Reflection Radiometer (ASTER) satellite images were donatedby the Earth Resources Observation Systems (EROS) Data Center of the United States Geological Survey(USGS) within the Earth Observation System Program of the United States National Aeronautics and SpaceAgency (NASA). The Landsat satellite images used in this work were obtained from NASA, the Global LandCover Facility at the University of Maryland, Landsat.org of Michigan State University, and from Geogratis ofNatural Resources Canada. The University of Maryland’s Global Land Cover Facility acquired and ortho-rectified much of the Landsat imagery, and conducted initial mapping work that greatly assisted theidentification of disturbances.
GeoGratis of Natural Resources Canada, the University of Maryland's Global Land Cover Facility, andMichigan State University's Landsat.org have provided an increasingly valuable service in provideing free orlow-cost public access to satellite imagery. Their contributions to this project are gratefully acknowledged.
The previous intact forest landscape mapping work for Russia and the enormous contribution to the Canadaproject by Russian Global Forest Watch partners was invaluable.
Maja Laird and Karen Holmes edited the report.
Special thanks to Dirk Bryant (World Resources Institute), for his active engagement and support throughoutthe project; to Alexey Yaroshenko for his leadership in developing the method for mapping of intact forestlandscapes; and to the staff of three Global Forest Watch partner organizations in Russia: BiodiversityConservation Center, Greenpeace Russia, and Socio-Ecological Union International for sharing their expertiseand making this project a truly collaborative, pan-boreal effort.
Acknowledgements
8 Canada’s Large Intact Forest Landscapes
Executive Summary
Canada’s forests provide critically important benefits to the nation — ranging from their economiccontributions via the forest products industry to recreational opportunities to life-sustaining ecosystem services,such as soil erosion control and watershed protection. The vast extent of Canadian forests represents one tenthof the world’s forested area, one quarter of the world’s temperate rainforests, and more than one third of theworld’s boreal (i.e., northern, conifer-dominated) forests.
Despite the importance and diversity of benefits derived from Canada’s forests, until very recently Canadianshad little access to information about forests other than timber production statistics. This is now beginning tochange, with various national and provincial government agencies and other groups documenting and reportingon a wider range of forest values.
This report presents the results of a multiyear project to map Canada’s large, intact forest landscapes andanalyze their distribution and level of protection. Intact forest landscapes contain no visible signs of large-scalehuman activities such as agriculture, logging, mining, roads, pipelines, or powerlines. Mapping theselandscapes is important for several reasons.
Intact forest landscapes are becoming increasingly rare at the global level, due in large part to their vulnerabilityto the effects of large-scale human interventions — effects that are not easily or quickly reversed. The remainingglobal tracts of intact forest landscapes have intrinsic value as part of the Earth’s natural endowment. They arealso growing in importance as benchmarks or reference points for understanding managed forest landscapesand designing management schemes that preserve or restore significant aspects of the natural forest landscape.Indeed, intact forest landscapes are areas of opportunity and responsibility, where all land use options — fromdevelopment to conservation — are still open. They are areas in which the best available knowledge andtechnology can be applied to inform effective and responsible decision-making.
This project to map Canada’s intact forest landscapes aims to increase knowledge about their extent andlocation, and to enable better decision-making by providing data in accessible forms for use by government,industry, and the public. It is the result of a unique collaboration among members of the international GlobalForest Watch network and was carried out by Global Forest Watch Canada, partner organizations of GlobalForest Watch Russia, and the World Resources Institute. The project builds on and extends previous workassessing forest intactness in Canada and is part of a larger effort by the Global Forest Watch network to mapintact forest landscapes in important forest countries around the world. The methodology was initiallydeveloped by Global Forest Watch to map Russia’s intact forest landscapes, and analysts from Global ForestWatch Russia have been key partners in this Canadian study.
For the purposes of this study, we define an intact forest landscape as a contiguous mosaic of naturalecosystems in a forest ecozone, essentially undisturbed by human influence, including both treed and naturallytreeless areas. An intact forest landscape must be large enough to contain and support natural biodiversity andecological processes, and to provide a buffer against human disturbance from surrounding areas. Hence, in thisstudy, we decided to examine forest tracts of 50,000 hectares or larger that are at least 10 kilometres wide, and torefer to them as large, intact forest landscapes. Other forest areas may possess high conservation value, butmapping them was beyond the scope of this study.
9
This collaboration uses a modified version of the Russian methodology, tailored to suit Canadiancircumstances. Compared with previous work on forest intactness in Canada, this study represents the mostdetailed national assessment undertaken, looking at a wider range of human disturbances and using satelliteimages and better ancillary information. The methodology involves identifying intact forest landscapes usinghigh-resolution satellite imagery (Landsat data at a resolution of 30 metres on the ground and ASTER data at aresolution of 15 metres) as well as some medium-resolution Landsat data and ground and aerial photographyverification.
The method presumes all forest landscapes to be intact at the outset of the study, and disturbed areas aresystematically eliminated through successive efforts to detect positive evidence of human influence on thelandscape. Thus, the search is for signs of human disturbance, not for signs of intactness, as the former aremuch easier to detect. This simple methodology and decision model enables mapping of intact forest landscapeareas that is replicable, cost-effective, feasible at the continental level, at a scale of 1:1.5 million, sufficientlydetailed to support practical decision making.
Numerous data contributors, advisors, and collaborators provided input throughout the course of the project,and reviews by stakeholders and experts improved the result. It is important to bear in mind, however, that thismethodology likely overestimates the area of intact forest landscapes, as signs of disturbance are more likely toremain undetected than to be mistakenly identified.
Key findings arising from our mapping of Canada’s large, intact forest landscapes are:
• Canada retains extensive, globally significant areas of large, intact forest landscape. More than half ofCanada’s forest area (and more than one third of the country’s total land area) consists of large intactlandscapes. More than one third of the area of these intact landscapes is naturally treeless, such as bogsand areas above the tree line in high elevation mountainous areas.
• Large, intact forest landscapes are unevenly distributed across the country, with most found in northernCanada and at higher elevations in western Canada. The most biodiversity-rich and productive forests,which are located in southern Canada, have been the most extensively influenced by human activity.
• Northern boreal forest regions remain largely intact, but southern boreal regions have been broadlyaffected by modern land use. More than half of the Boreal Shield, Canada’s largest ecozone, is made upof large, intact forest landscapes. The northernmost boreal ecozones are least affected by humandisturbance, with intact landscapes making up 89 percent or more of the study area in each of fournorthern boreal ecozones (Taiga Cordillera, Boreal Cordillera, Hudson Plains, Taiga Shield) and 61percent in the Taiga Plains. The southernmost boreal regions have been considerably affected byindustrial activity; for instance, the Boreal Plains ecozone retains less than one fifth (17 percent) of itsarea in large, intact forest landscapes.
• Less than one third of temperate forest areas remains as large, intact forest landscapes. Over 90 percent ofthis area is located in British Columbia, with the remainder in Alberta. Of these intact landscapes, morethan half are naturally treeless, including high-elevation alpine tundra, ice, and rock in the westernmountains. No large, intact forest landscapes remain in the Mixedwood Plains and Atlantic Maritimeecozones.
Executive Summary
10 Canada’s Large Intact Forest Landscapes
• Québec and the Northwest Territories together account for more than one third of Canada’s large, intactforest landscapes; combined with Ontario and British Columbia, they account for nearly two thirds of theselandscapes. Three provinces — New Brunswick, Nova Scotia, and Prince Edward Island — have noremaining large, intact forest landscapes.
• Only a small portion of Canada’s large, intact forest landscape occurs in protected areas. Althoughnational parks make up one third of Canada’s protected areas, only 2 percent of large, intact forestlandscapes are located in national parks. Boreal regions account for most of the area in protected, large,intact forest landscapes — about 21 million hectares versus 8 million hectares in temperate zones.However, a greater percentage of large, intact temperate forest landscape is subject to protection — about27 percent, versus less than 10 percent for boreal landscapes. The majority of these protected temperateforest landscapes are naturally treeless.
• First Nation historic treaty areas contain more than half (55 percent) of Canada’s large, intact forestlandscapes. About one quarter of large, intact forest landscapes are contained in modern land claimsettlements.
Global Forest Watch is committed to providing the best possible information for decisions on forest land use.Thus, we plan to work to refine and expand this analysis to include more detailed data, map smaller (between5,000 and 50,000 hectares) undisturbed areas of forest landscape, analyze the location of social, economic, andconservation values in the forest landscape, and conduct studies tracking past and future forest change. Weencourage the Canadian government, industry, and public to join us in these efforts.
11
Chapter 1. Introduction
Human activities have an impact on the world’s forest ecosystems. Much of the original forest cover has beencleared for agriculture or otherwise impacted by various resource extraction activities, such as logging andmining.1 Over the last several decades, the rate of forest change has increased substantially.2 Various studiescontinue to document the ongoing loss of forest ecosystems.3 As a result, undisturbed — or even intact — forestecosystems are becoming increasingly rare and unevenly distributed across the world.4
A few countries, including Canada, still retain globally significant areas of forest ecosystems. Canada, with over400 million hectares of forest,5 contains one tenth of the world’s forests, over one third of the world’s borealforest, one fifth of the world’s temperate rainforest6 and one quarter of the world’s frontier forests.7 Ninety-four percent of Canada’s forests are on public land8 and they are valued by Canadians for both their ecologicaland economic benefits.9 Canada’s forest ecosystems contain a wealth of biodiversity,10 provide numerousopportunities for recreation,11 and fulfill a number of important ecosystem needs including the protection ofsoils, the preservation of watershed functions, the moderation of climate and the sequestration of carbon.12
Box 1 outlines the importance of forests to the Canadian economy.13
In the past, Canadians have had little access to forest information other than on timber production.14 This isbeginning to change. Government agencies and other groups are increasingly documenting and reporting on agreater range of forest ecosystem values. For example, Natural Resources Canada (Canadian Forest Service), incollaboration with Canada’s provinces and territories, is developing a flexible forest monitoring system thataddresses multiple conservation attributes. The British Columbia government has mapped intact watersheds,forest recreation resources and forest conservation themes,15 and the Ontario government has mapped the stateof Ontario’s wilderness.16 The Canadian Forest Service has mapped un-accessed forests using existing datasetsof roads.17 Global Forest Watch Canada and the World Resources Institute have mapped un-accessed forestareas in Canada18 and North America19 at a coarse scale, using existing datasets of roads and other accessroutes, and in some cases, expert advice.
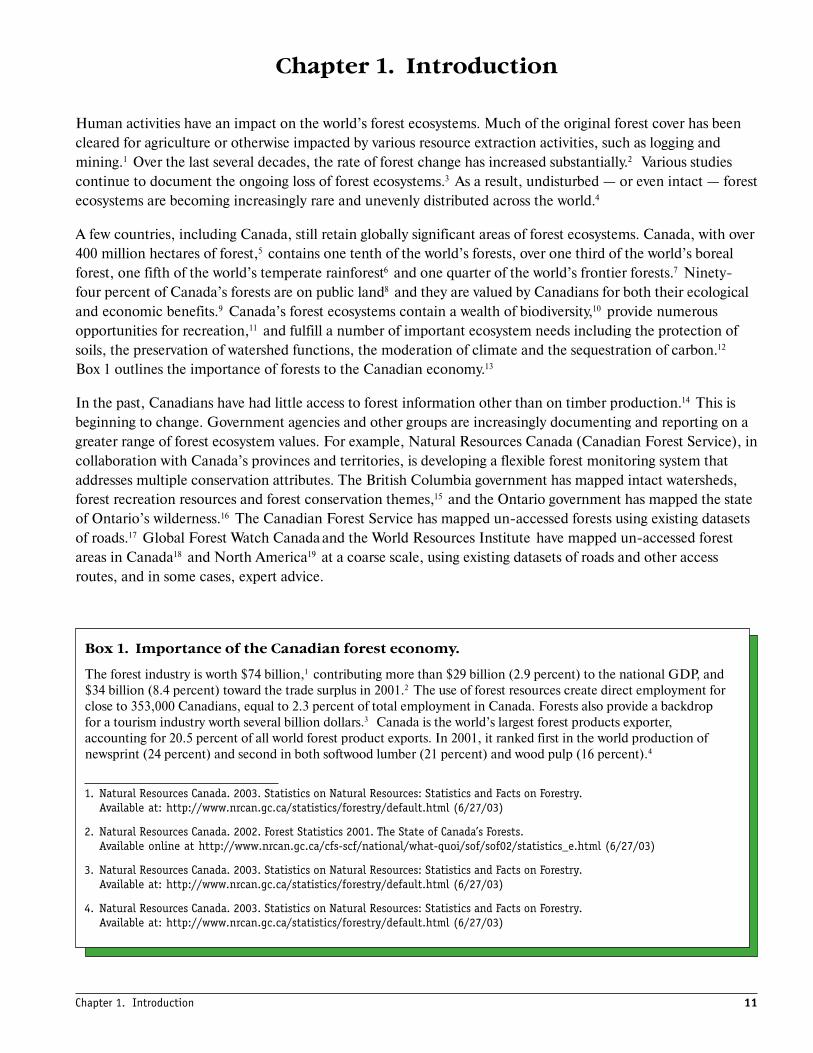
Box 1. Importance of the Canadian forest economy.
The forest industry is worth $74 billion,1 contributing more than $29 billion (2.9 percent) to the national GDP, and$34 billion (8.4 percent) toward the trade surplus in 2001.2 The use of forest resources create direct employment forclose to 353,000 Canadians, equal to 2.3 percent of total employment in Canada. Forests also provide a backdropfor a tourism industry worth several billion dollars.3 Canada is the world’s largest forest products exporter,accounting for 20.5 percent of all world forest product exports. In 2001, it ranked first in the world production ofnewsprint (24 percent) and second in both softwood lumber (21 percent) and wood pulp (16 percent).4
1. Natural Resources Canada. 2003. Statistics on Natural Resources: Statistics and Facts on Forestry.Available at: http://www.nrcan.gc.ca/statistics/forestry/default.html (6/27/03)
2. Natural Resources Canada. 2002. Forest Statistics 2001. The State of Canada’s Forests.Available online at http://www.nrcan.gc.ca/cfs-scf/national/what-quoi/sof/sof02/statistics_e.html (6/27/03)
3. Natural Resources Canada. 2003. Statistics on Natural Resources: Statistics and Facts on Forestry.Available at: http://www.nrcan.gc.ca/statistics/forestry/default.html (6/27/03)
4. Natural Resources Canada. 2003. Statistics on Natural Resources: Statistics and Facts on Forestry.Available at: http://www.nrcan.gc.ca/statistics/forestry/default.html (6/27/03)
Chapter 1. Introduction

12 Canada’s Large Intact Forest Landscapes
This study is an additional contribution to the efforts of further data collection by mapping the extent andlocation of remaining intact forest landscapes in Canada that are at least 50,000 hectares. The objectives of thestudy are twofold:
1. To increase knowledge about the extent and location of intact forest landscapes in Canada.2. To enable better decision making about intact forest landscapes by providing this data in accessible forms
for use by government, industry and the public.
The purpose of this study is not to identify all forest areas in Canada with high conservation value, nor is it toset conservation priorities.20 Rather, the intent is to complement existing studies and stimulate further study, asdiscussed in more detail below. The questions we set out to answer were: How much is left? Where are theylocated? How much is protected?
As noted, this work is part of a larger effort by the Global Forest Watch to map intact forest landscapes inimportant forested countries around the world.21 To this end, and using Russia as a pilot country, Global ForestWatch has established a definition for intact forest landscapes, and developed a mapping methodology that usesa combination of satellite imagery, ancillary data sources and ground verification.22 Combining the results ofthis study with preliminary results from mapping Canada, Alaska and Fennoscandia, Global Forest Watch hasalso produced a draft map of intact forest landscapes for the entire boreal zone of the northern hemisphere.23
Resources permitting, this work will be extended into temperate and tropical areas in the future.
For the purposes of this study, we have mapped intact forest landscapes that are at least 10 kilometres wide and aminimum of 50,000 hectares. Further work on smaller areas of intact forest landscape is a high priority.
The intact forest landscape definition, concepts and criteria are discussed in greater detail in Chapter 2.However, key concepts and definitions are outlined below.
1.1 What Is Intactness?
Ecologists and conservation biologists use the terms natural or naturalness, and ecological integrity far morefrequently than intact, but they essentially refer to the same basic concept. The term intact in relation to forestshas been defined to mean that all the critical ecosystem components are present and structured in such a waythat processes function within normal limits, and that component populations and functions will bemaintained over time.24 A number of major themes emerge in the scientific literature regarding these similarterms, including:
• ecosystems are said to be intact when ecosystem structure and (or) processes stay at a predefinedbaseline level;
• intactness is preserved when a system is permitted to change unaffected by human influence; and• an ecosystem’s ability to stay organized or self-correcting in the face of disturbance ensures the
preservation of intactness.
An intact landscape is one that is able to maintain its biodiversity and ecosystem functionality over time as adynamic property, rather than in any fixed, quantitative sense.25 There is no place on Earth that has not beeninfluenced by humans in some way, but some places have been more directly impacted and to a larger degreethan others.26 We know that intact forest landscapes begin losing components and natural functions as theimpacts from human use grow and continue over time. Some ecosystem changes can be gradual (for example,loss of interior forest habitat over time), while others are rapid (for example, loss of a keystone species).
13
Intactness is not a binary quality but one of degree. One can envision a continuum ranging from least-impacted nature on one end to an urban development on the other. Quantifiable and replicable indices andscales of measurement are needed to help assign ecosystems as being intact on such a continuum. Althoughsome progress is being made,27 this area of applied research is still new.
If one desires to maintain the composition, structure and function of natural forest landscapes, size matters. Itis not clear, however, how large a forest landscape must be to be considered intact. Two important size criteriaare (1) the area needed to sustain a forest’s natural disturbance regime, and (2) the full complement of largehome ranges required by sensitive species. Operationally, the larger of the two should dictate any minimum sizethreshold. Key challenges, however, are that both criteria are difficult to rely on for determining absoluteecological thresholds for mapping intactness, and both vary greatly between forest types. Criteria on size arediscussed further in Chapter 2.
1.2 How Do We Define an Intact Forest Landscape?
For the purposes of this work, an intact forest landscape is defined as a contiguous mosaic of naturallyoccurring ecosystems in a forest ecozone, essentially undisturbed by significant human influence. An intactforest landscape is a mosaic of various natural ecosystems including forest, bog, water, tundra and rockoutcrops.
An intact forest landscape does not necessarily consist of old trees and may not even be entirely forested.In some cases, such as the bog-dominated landscapes of Canada’s taiga ecozones and mountainouslandscapes of western Canada, only 20 to 30 percent of the total area may consist of trees.
An intact forest landscape has the following characteristics:• It is free from substantial anthropogenic fragmentation (settlements, roads, clearcuts, pipelines, power
lines, mines, etc.);• It is free from detectable human influence for periods that are long enough to ensure that it is formed by
naturally occurring ecological processes (including fires, wind and pest species);• It is large enough to be resilient to edge effects and to survive most natural disturbance events;• It contains only naturally seeded indigenous plant species, and supports viable populations of most
native species associated with the ecosystem.
By virtue of their size, intact areas allow all strata of biological diversity to co-exist in natural patterns, includinglarge mammal species that are sensitive to human impact such as caribou, grizzly bear and wolves. The largesize also allows natural disturbance factors, such as fire and wind, to play out in natural regimes. These naturaldisturbances are responsible for much of the structure and, ultimately, biodiversity of forest regions.28 Smallerblocks of undisturbed forest landscape may have outstanding biological diversity value, but they lack the specialfeatures of intact forest landscapes.
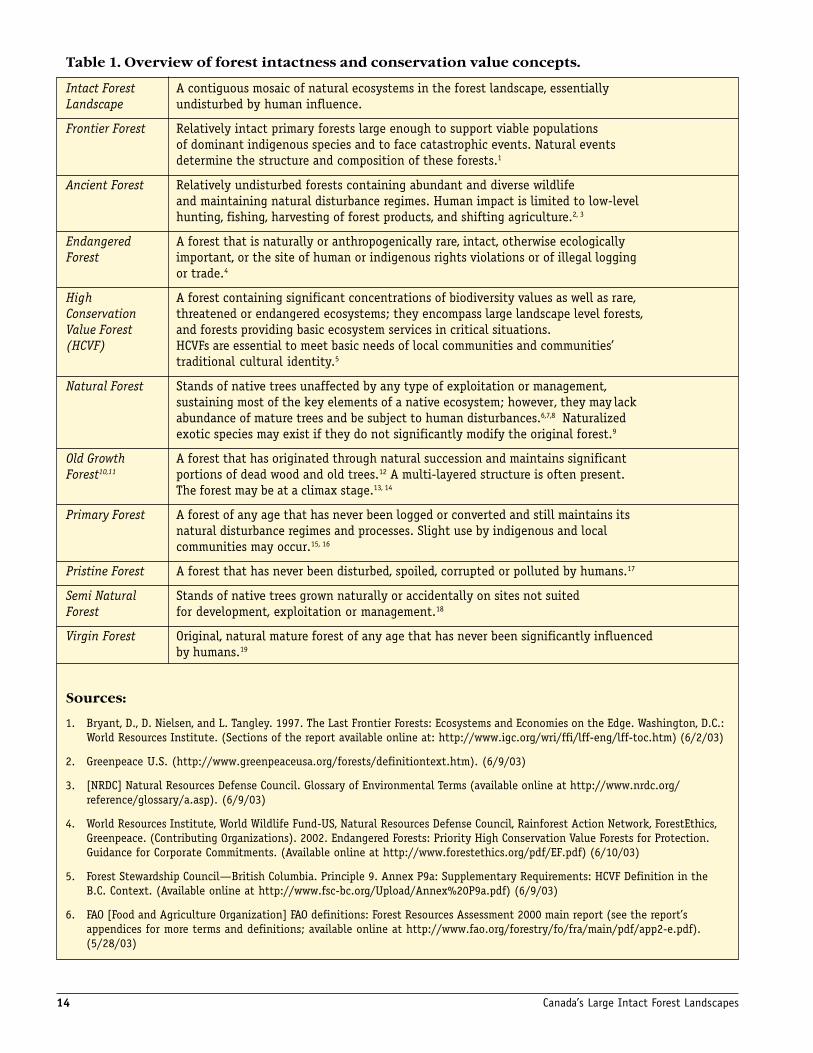
Our definition of intact forest landscapes differs from other definitions and concepts in use (Table 1), as oursbuilds on the definitions of frontier forests.29 It also builds on the un-accessed forests concept, as it is sensitivenot only to access (roads) but also to other forms of human disturbance, such as logging. The use of newterminology reflects an effort to find a neutral term that is meaningful in many languages.
Chapter 1. Introduction
14 Canada’s Large Intact Forest Landscapes
Table 1. Overview of forest intactness and conservation value concepts.
Intact Forest A contiguous mosaic of natural ecosystems in the forest landscape, essentiallyLandscape undisturbed by human influence.
Frontier Forest Relatively intact primary forests large enough to support viable populationsof dominant indigenous species and to face catastrophic events. Natural eventsdetermine the structure and composition of these forests.1
Ancient Forest Relatively undisturbed forests containing abundant and diverse wildlifeand maintaining natural disturbance regimes. Human impact is limited to low-levelhunting, fishing, harvesting of forest products, and shifting agriculture.2, 3
Endangered A forest that is naturally or anthropogenically rare, intact, otherwise ecologicallyForest important, or the site of human or indigenous rights violations or of illegal logging
or trade.4
High A forest containing significant concentrations of biodiversity values as well as rare,Conservation threatened or endangered ecosystems; they encompass large landscape level forests,Value Forest and forests providing basic ecosystem services in critical situations.(HCVF) HCVFs are essential to meet basic needs of local communities and communities’
traditional cultural identity.5
Natural Forest Stands of native trees unaffected by any type of exploitation or management,sustaining most of the key elements of a native ecosystem; however, they may lackabundance of mature trees and be subject to human disturbances.6,7,8 Naturalizedexotic species may exist if they do not significantly modify the original forest.9
Old Growth A forest that has originated through natural succession and maintains significantForest10,11 portions of dead wood and old trees.12 A multi-layered structure is often present.
The forest may be at a climax stage.13, 14
Primary Forest A forest of any age that has never been logged or converted and still maintains itsnatural disturbance regimes and processes. Slight use by indigenous and localcommunities may occur.15, 16
Pristine Forest A forest that has never been disturbed, spoiled, corrupted or polluted by humans.17
Semi Natural Stands of native trees grown naturally or accidentally on sites not suitedForest for development, exploitation or management.18
Virgin Forest Original, natural mature forest of any age that has never been significantly influencedby humans.19
Sources:
1. Bryant, D., D. Nielsen, and L. Tangley. 1997. The Last Frontier Forests: Ecosystems and Economies on the Edge. Washington, D.C.:World Resources Institute. (Sections of the report available online at: http://www.igc.org/wri/ffi/lff-eng/lff-toc.htm) (6/2/03)
2. Greenpeace U.S. (http://www.greenpeaceusa.org/forests/definitiontext.htm). (6/9/03)
3. [NRDC] Natural Resources Defense Council. Glossary of Environmental Terms (available online at http://www.nrdc.org/reference/glossary/a.asp). (6/9/03)
4. World Resources Institute, World Wildlife Fund-US, Natural Resources Defense Council, Rainforest Action Network, ForestEthics,Greenpeace. (Contributing Organizations). 2002. Endangered Forests: Priority High Conservation Value Forests for Protection.Guidance for Corporate Commitments. (Available online at http://www.forestethics.org/pdf/EF.pdf) (6/10/03)
5. Forest Stewardship Council—British Columbia. Principle 9. Annex P9a: Supplementary Requirements: HCVF Definition in theB.C. Context. (Available online at http://www.fsc-bc.org/Upload/Annex%20P9a.pdf) (6/9/03)
6. FAO [Food and Agriculture Organization] FAO definitions: Forest Resources Assessment 2000 main report (see the report’sappendices for more terms and definitions; available online at http://www.fao.org/forestry/fo/fra/main/pdf/app2-e.pdf).(5/28/03)
15
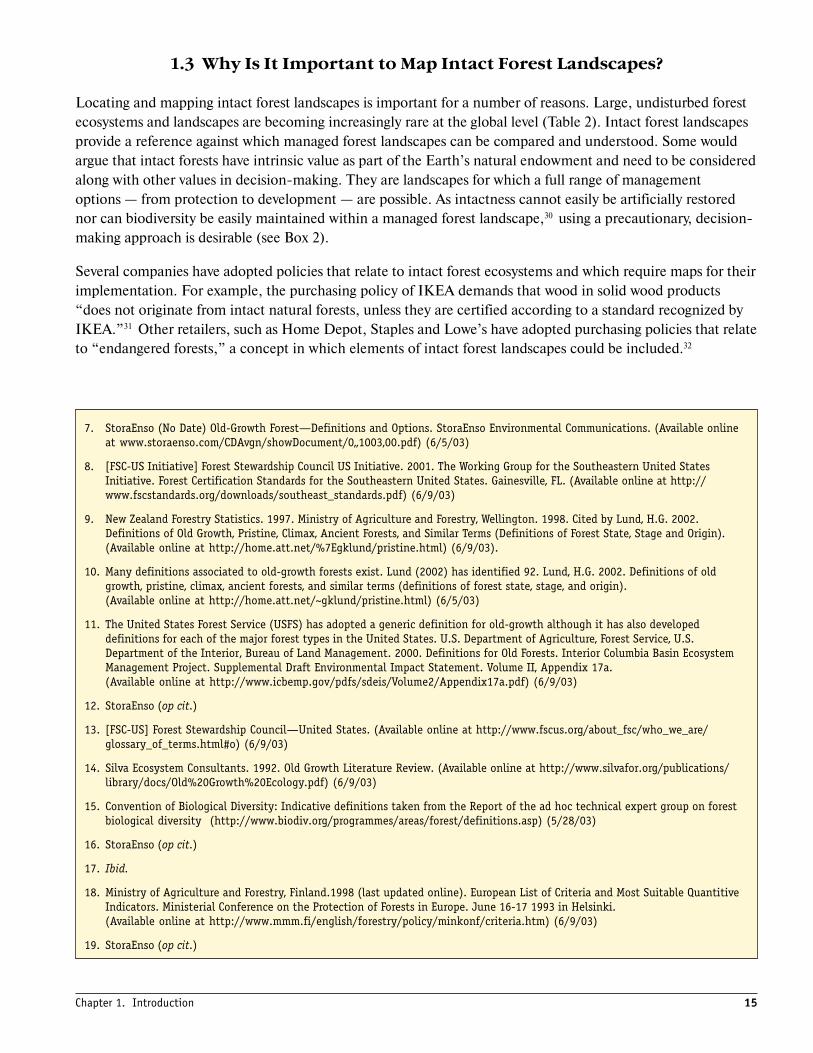
7. StoraEnso (No Date) Old-Growth Forest—Definitions and Options. StoraEnso Environmental Communications. (Available onlineat www.storaenso.com/CDAvgn/showDocument/0,,1003,00.pdf) (6/5/03)
8. [FSC-US Initiative] Forest Stewardship Council US Initiative. 2001. The Working Group for the Southeastern United StatesInitiative. Forest Certification Standards for the Southeastern United States. Gainesville, FL. (Available online at http://www.fscstandards.org/downloads/southeast_standards.pdf) (6/9/03)
9. New Zealand Forestry Statistics. 1997. Ministry of Agriculture and Forestry, Wellington. 1998. Cited by Lund, H.G. 2002.Definitions of Old Growth, Pristine, Climax, Ancient Forests, and Similar Terms (Definitions of Forest State, Stage and Origin).(Available online at http://home.att.net/%7Egklund/pristine.html) (6/9/03).
10. Many definitions associated to old-growth forests exist. Lund (2002) has identified 92. Lund, H.G. 2002. Definitions of oldgrowth, pristine, climax, ancient forests, and similar terms (definitions of forest state, stage, and origin).(Available online at http://home.att.net/~gklund/pristine.html) (6/5/03)
11. The United States Forest Service (USFS) has adopted a generic definition for old-growth although it has also developeddefinitions for each of the major forest types in the United States. U.S. Department of Agriculture, Forest Service, U.S.Department of the Interior, Bureau of Land Management. 2000. Definitions for Old Forests. Interior Columbia Basin EcosystemManagement Project. Supplemental Draft Environmental Impact Statement. Volume II, Appendix 17a.(Available online at http://www.icbemp.gov/pdfs/sdeis/Volume2/Appendix17a.pdf) (6/9/03)
12. StoraEnso (op cit.)
13. [FSC-US] Forest Stewardship Council—United States. (Available online at http://www.fscus.org/about_fsc/who_we_are/glossary_of_terms.html#o) (6/9/03)
14. Silva Ecosystem Consultants. 1992. Old Growth Literature Review. (Available online at http://www.silvafor.org/publications/library/docs/Old%20Growth%20Ecology.pdf) (6/9/03)
15. Convention of Biological Diversity: Indicative definitions taken from the Report of the ad hoc technical expert group on forestbiological diversity (http://www.biodiv.org/programmes/areas/forest/definitions.asp) (5/28/03)
16. StoraEnso (op cit.)
17. Ibid.
18. Ministry of Agriculture and Forestry, Finland.1998 (last updated online). European List of Criteria and Most Suitable QuantitiveIndicators. Ministerial Conference on the Protection of Forests in Europe. June 16-17 1993 in Helsinki.(Available online at http://www.mmm.fi/english/forestry/policy/minkonf/criteria.htm) (6/9/03)
19. StoraEnso (op cit.)
1.3 Why Is It Important to Map Intact Forest Landscapes?
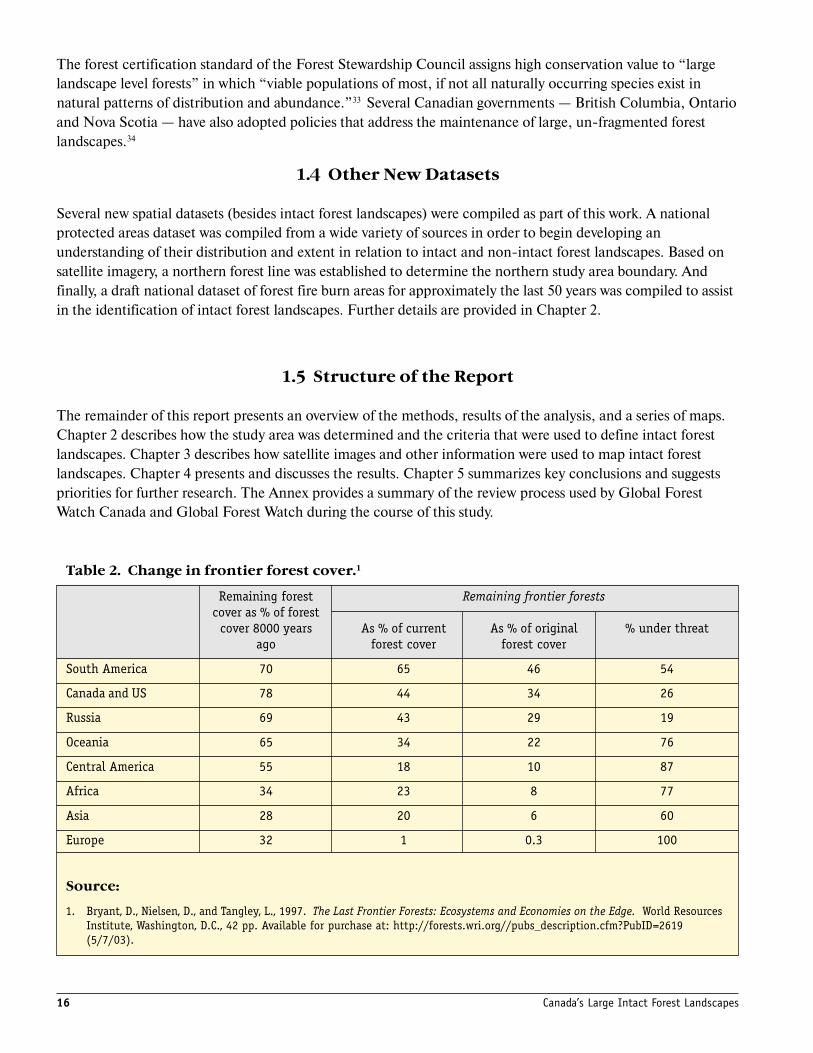
Locating and mapping intact forest landscapes is important for a number of reasons. Large, undisturbed forestecosystems and landscapes are becoming increasingly rare at the global level (Table 2). Intact forest landscapesprovide a reference against which managed forest landscapes can be compared and understood. Some wouldargue that intact forests have intrinsic value as part of the Earth’s natural endowment and need to be consideredalong with other values in decision-making. They are landscapes for which a full range of managementoptions — from protection to development — are possible. As intactness cannot easily be artificially restorednor can biodiversity be easily maintained within a managed forest landscape,30 using a precautionary, decision-making approach is desirable (see Box 2).
Several companies have adopted policies that relate to intact forest ecosystems and which require maps for theirimplementation. For example, the purchasing policy of IKEA demands that wood in solid wood products“does not originate from intact natural forests, unless they are certified according to a standard recognized byIKEA.”31 Other retailers, such as Home Depot, Staples and Lowe’s have adopted purchasing policies that relateto “endangered forests,” a concept in which elements of intact forest landscapes could be included.32
Chapter 1. Introduction
16 Canada’s Large Intact Forest Landscapes
The forest certification standard of the Forest Stewardship Council assigns high conservation value to “largelandscape level forests” in which “viable populations of most, if not all naturally occurring species exist innatural patterns of distribution and abundance.”33 Several Canadian governments — British Columbia, Ontarioand Nova Scotia — have also adopted policies that address the maintenance of large, un-fragmented forestlandscapes.34
1.4 Other New Datasets
Several new spatial datasets (besides intact forest landscapes) were compiled as part of this work. A nationalprotected areas dataset was compiled from a wide variety of sources in order to begin developing anunderstanding of their distribution and extent in relation to intact and non-intact forest landscapes. Based onsatellite imagery, a northern forest line was established to determine the northern study area boundary. Andfinally, a draft national dataset of forest fire burn areas for approximately the last 50 years was compiled to assistin the identification of intact forest landscapes. Further details are provided in Chapter 2.
1.5 Structure of the Report
The remainder of this report presents an overview of the methods, results of the analysis, and a series of maps.Chapter 2 describes how the study area was determined and the criteria that were used to define intact forestlandscapes. Chapter 3 describes how satellite images and other information were used to map intact forestlandscapes. Chapter 4 presents and discusses the results. Chapter 5 summarizes key conclusions and suggestspriorities for further research. The Annex provides a summary of the review process used by Global ForestWatch Canada and Global Forest Watch during the course of this study.
Table 2. Change in frontier forest cover.1
Remaining forest Remaining frontier forestscover as % of forest
cover 8000 years As % of current As % of original % under threatago forest cover forest cover
South America 70 65 46 54
Canada and US 78 44 34 26
Russia 69 43 29 19
Oceania 65 34 22 76
Central America 55 18 10 87
Africa 34 23 8 77
Asia 28 20 6 60
Europe 32 1 0.3 100
Source:
1. Bryant, D., Nielsen, D., and Tangley, L., 1997. The Last Frontier Forests: Ecosystems and Economies on the Edge. World ResourcesInstitute, Washington, D.C., 42 pp. Available for purchase at: http://forests.wri.org//pubs_description.cfm?PubID=2619(5/7/03).
17
Box 2. The precautionary approach.
With the full support of the provinces and territories, Canada was the first industrialized country to ratify the UnitedNations Convention on Biological Diversity, which came into force on December 29, 1993, following the UnitedNations Conference on Environment and Development, Rio de Janeiro, June 3 –14, 1992 (“Earth Summit”).1 Byratifying the Convention on Biological Diversity, Canada entered into specific obligations to the internationalcommunity with respect to conservation of biodiversity, including:
• To manage a protected areas system for conservation of biodiversity (Art. 8 [b]), and to manage areas adjacentto protected areas to conserve biodiversity (Art. 8 [e]);
• To protect terrestrial ecosystems, natural habitats and species throughout their natural ranges (Art. 8 [d]) andto manage biological resources important for the conservation of biological diversity (Art. 8 [c]); and,
• To integrate considerations of the conservation and sustainable use of biological diversity and resources intopolicies and decision-making (Art. 6 [b] and 10 [a]), and to adopt measures relating to the use of biologicalresources to avoid or minimize adverse impacts on biological diversity (Art. 10 [b]).
To meet these obligations, the Convention on Biological Diversity notes the precautionary approach is relevant:“where there is a threat of significant reduction or loss of biodiversity, lack of full scientific certainty should not beused as a reason for postponing measures to avoid or minimize such a threat.”2 Further, the Rio Declaration onEnvironment and Development, the report of the “Earth Summit,” stated that “in order to protect theenvironment, the precautionary approach shall be widely applied by States according to their capabilities.”3 Theprecautionary principle was re-affirmed at the World Summit on Sustainable Development, Johannesburg, August26 – September 4, 2002,4 and has been recognized in Canadian law.5
1. Convention on Biological Diversity. Concluded at Rio de Janeiro, 5 June 1992. Entered into force, 29 December 1993. 31 I.L.M.818(1992), (the “Convention on Biological Diversity”) available on-line at http://www.biodiv.org/convention/articles.asp(July 2, 2003) and Canada, Canadian Biodiversity Strategy – Canada’s Response to the Convention on Biological Diversity(Hull: Supply and Services Canada, 1995) p. 9.
2. Convention on Biological Diversity, preamble, para. 9.
3. United Nations Environment and Development. 1992. Rio Declaration on Environment and Development. Principle 15.Available at: http://www.un.org/documents/ga/conf151/aconf15126-1annex1.htm. (6/19/03).
4. United Nations Division for Sustainable Development. 2002. Johannesburg Plan of Implementation. Section X, Subsection109(f). Available at: http://www.un.org/esa/sustdev/documents/docs.htm. (6/19/03).
5. The Supreme Court of Canada has recently recognized the precautionary principle: “where there are threats of serious orirreversible damage, lack of full scientific certainty should not be used as a reason for postponing measures to preventenvironmental degradation.” 114957 Canada Ltee (Spraytech, Societe d’arrosage) v. Hudson (Town), 2001 SCC 40, para. 31,available on-line at http://www.lexum.umontreal.ca/csc-scc/en/pub/2001/vol2/html/2001scr2_0241.html (May 17, 2003).
Chapter 1. Introduction
18 Canada’s Large Intact Forest Landscapes
Chapter 2. Intact Forest Landscapes:Study Area, Definitions and Criteria
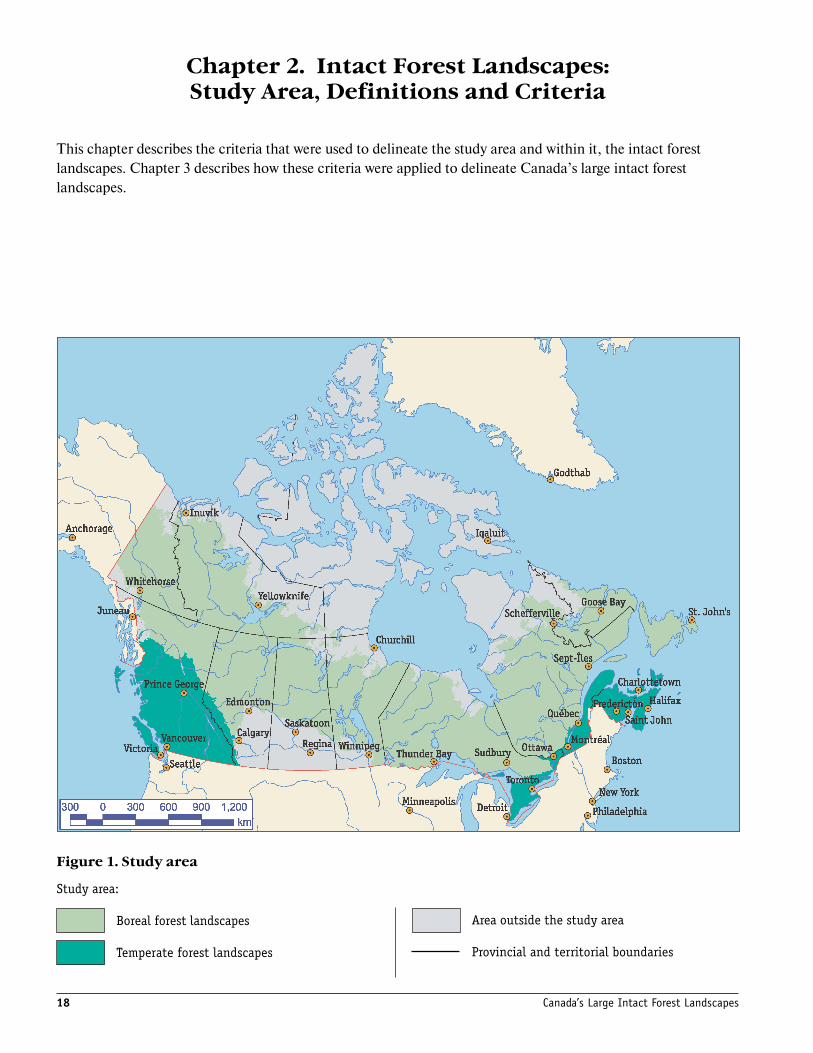
This chapter describes the criteria that were used to delineate the study area and within it, the intact forestlandscapes. Chapter 3 describes how these criteria were applied to delineate Canada’s large intact forestlandscapes.
Study area:
Boreal forest landscapes
Temperate forest landscapes
Area outside the study area
Provincial and territorial boundaries
Figure 1. Study area
19
2.1 Study Area
The study area for this project covers 601 million hectares of Canada’s 998 million hectares of overall land area1
(Figure 1). We defined the study area using a number of criteria, including Canadian ecozones, forestboundaries and national boundaries. The rationale is described below, while more technical notes are given insection 3.1.
2.1.1 Ecozones
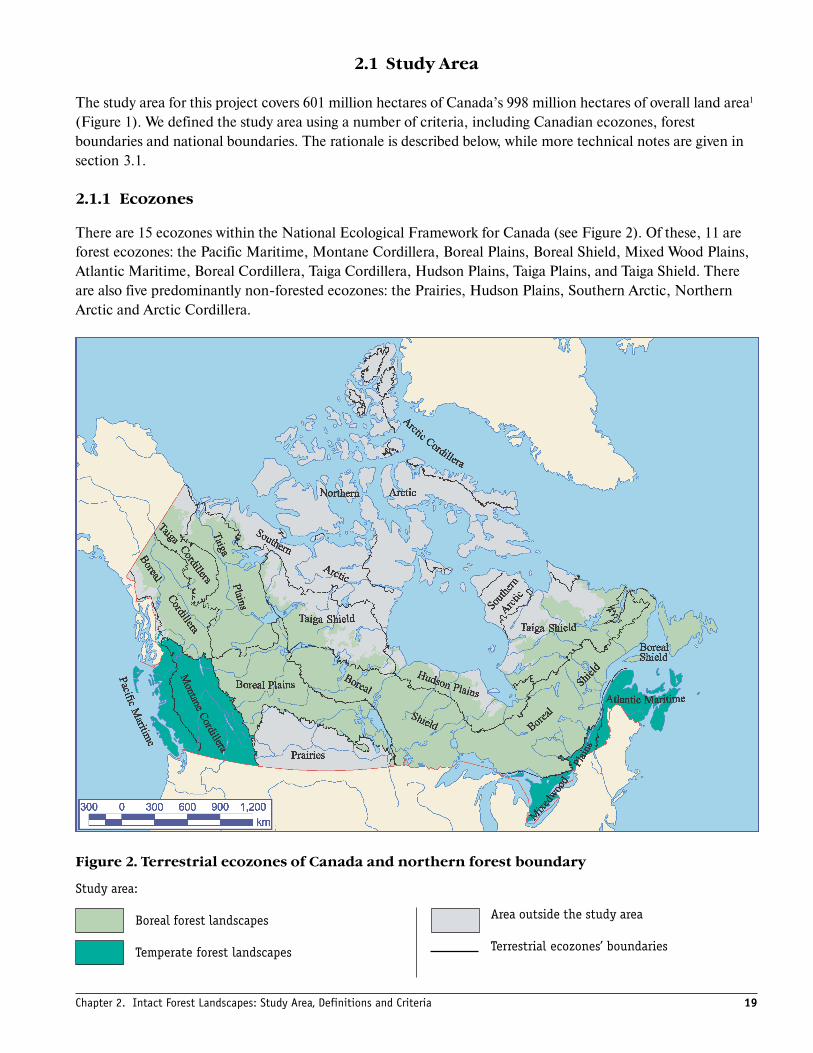
There are 15 ecozones within the National Ecological Framework for Canada (see Figure 2). Of these, 11 areforest ecozones: the Pacific Maritime, Montane Cordillera, Boreal Plains, Boreal Shield, Mixed Wood Plains,Atlantic Maritime, Boreal Cordillera, Taiga Cordillera, Hudson Plains, Taiga Plains, and Taiga Shield. Thereare also five predominantly non-forested ecozones: the Prairies, Hudson Plains, Southern Arctic, NorthernArctic and Arctic Cordillera.
Figure 2. Terrestrial ecozones of Canada and northern forest boundary
Study area:
Boreal forest landscapes
Temperate forest landscapes
Area outside the study area
Terrestrial ecozones’ boundaries
Chapter 2. Intact Forest Landscapes: Study Area, Definitions and Criteria
20 Canada’s Large Intact Forest Landscapes
For the purposes of our study, we eliminated some ecozones at the outset. The Prairies ecozone, which isnaturally predominantly treeless, was excluded. Additionally, we excluded the Arctic Cordillera and NorthernArctic ecozones, as both are far beyond the limits of the treeline. We then defined a northern forest boundary(see Figure 2 and description in section 2.1.2). This step eliminated most of the Southern Arctic ecozone andportions of the Taiga Cordillera, Taiga Shield and Hudson Plains ecozones. Seven ecozones are fully containedwithin the study area (Pacific Maritime, Montane Cordillera, Boreal Plains, Boreal Shield, Boreal Cordillera,Mixed Wood Plains, and Atlantic Maritimes). It is important to note the total areas used in our study do notalways match the exact land area of ecozones given in national statistics.
2.1.2 Northern Boundary
As trees get successively smaller and sparser at northern latitudes and high altitudes, the northern edge of theforest can be diffuse. Since an intact forest landscape often changes gradually into an equally intact tundralandscape, drawing the northern boundary of a forest landscape is a difficult task. The outcome depends on thedefinition used for forest and does not reflect any change in the degree of intactness.
The boundary of forests given on topographical maps and existing digital datasets could not be used to representthe northern boundary of closed forests, or the northern forest boundary. While it corresponds to the previousinternationally agreed definition for closed forest (canopy density more than 20 percent canopy, tree heightmore than 5 to 7 metres), an analysis of Landsat satellite images suggests that the existing maps and digitaldatasets are partly out of date and show areas of southern tundra shrubs and sparse woodlands as being forests.
The northern forest boundary for this study was drawn based on medium resolution images (Landsat previewimages with a resolution of 300 metres). All tree-covered areas exceeding 20 percent canopy density and morethan 2 kilometres in width were classified as forest. Narrow strips of forest occurring along the boundary —such as denser forests typically found along river valleys — were classified as part of the treeless tundra zoneoutside of the study area, as were areas of trees with less than 20 percent canopy density. Natural fragments offorest north of the boundary were not assessed for intactness due to insufficient information. The boundaries ofsuch areas are shown on the maps as a separate category without any division into classes of intactness.
2.1.3 Southern Boundary
The southern boundary of the study area is defined by the Prairie ecozone boundary and by the national borderbetween Canada and the United States. Intact forest landscapes were mapped only within the politicalboundary of Canada and adjacent areas in the United States of America were not considered. Thus, someblocks of trans-boundary intact forest landscapes may have been excluded.
2.2 Criteria for Intactness
Intactness is based on a number of criteria, as discussed briefly in the introduction. This is discussed in greaterdetail in the following sections.
2.2.1. Smallest Viable Area of an Intact Forest Landscape
The size of a natural landscape is of considerable importance to its ecological viability. If a block is too small, itdoes not allow all essential components of the intact landscape to be conserved in their natural state. Forexample, considerable space is required for viable populations of large predatory vertebrates to coexist with the
21
full range of natural ecological functions (including disturbance regimes such as resulting from fires andinsects). Upwards of tens of thousands of hectares, sometimes as much as hundreds of thousands of hectares,are needed to support these populations.2
Forest blocks that are not large enough may also fail to provide sufficient protection against edge effects due toanthropogenic influence,3 or to the influence from disturbed and transformed areas outside the boundary of theintact forest landscape. Disturbances to neighbouring fragmented areas have greater impacts on the perimeterrather than the interiors of intact forest landscapes. Typical examples of edge effects include biologicalcontamination (such as invasion by non-native species), and hydrological changes caused by the draining orwater-logging of fragmented areas. People rarely visit the central parts of large, non-fragmented natural areas,making these central areas less likely to be as affected by human activity.
Different species and processes clearly occur at differing spatial scales, but the size of the space required by thecombination of processes and species is difficult to establish with great certainty. The risk of an area being toosmall decreases as the threshold size increases, but the desire to have a next-to-zero risk for the most area-demanding species (such as wolf-caribou interactions) and processes (such as large natural fires) would requirea very large threshold size of at least several hundred thousand hectares.
Nature reserve design principles help explain the importance of large size for natural landscapes in maintainingecological integrity. Based originally on island biogeography theory,4 size was proposed as an importantconsideration in planning mainland nature reserves5 . There are some problems associated with projectingisland theory onto mainland system reserves; for example, attributes of, and processes in, mainland systems areusually far more directly influenced by the adjacent landscape (sometimes referred to as the matrix) than in trueisland systems.6 However, the importance of large reserves is widely accepted because they:
1. generally contain more species;2. generally support larger populations of certain species with greater genetic variability leading to greater
population viability;3. have a better chance of incorporating natural disturbances than smaller ones; and4. contain a greater area of interior habitats buffered from the negative effects of edges.7
There are two approaches to the question of how large an area would have to be to maintain the naturalcomposition, structure, and function of a natural forest landscape in a forest landscape unit. One approachinvolves multiplying the mean patch size of disturbance by 50 to determine the minimum dynamic area.8 Basedon the available data on fires for one study area in northwest Alberta from 1961 and 1995, the minimumdynamic area using this technique would be approximately 12,500 hectares.9
The second involves a minimum size of about four times the size of the largest and most severe disturbanceevent.10 For Canada’s boreal region, where some individual fires reach 200,000 hectares in size (and have evenbeen recorded at over 1 million hectares)11 , the minimum dynamic area would be at least 800,000 hectares.There is obviously a huge difference between 12,500 and 800,000 hectares, but these figures give a sense of themagnitude of the size required.
In trembling aspen forest stands of western Canada, phase gap dynamics (the loss of individual trees or smallclusters of trees due to aging, wind or ice) are an important natural disturbance regime, which impacts 4 to 17percent of all forest stand areas. The mean gap area is 52.3 square metres.12 In boreal and subalpine coniferforests, studies have documented mean gap areas ranging from 41 to 200 square metres.13
If the minimum dynamic area was calculated from this disturbance agent, a single area could be quite small.However, in this forest ecosystem, the area requirements for some important forest species exceed the
Chapter 2. Intact Forest Landscapes: Study Area, Definitions and Criteria
22 Canada’s Large Intact Forest Landscapes
minimum dynamic area based on the dominant disturbance agent. For example, black bears are mammals withlarge territories. Home ranges differ considerably based on various environmental factors such as foodproductivity, den site availability, and abundance of escape habitat. In one study, home range needs for femaleblack bears without young ranged between 750 and 930 hectares.14 Maintaining bear populations would requiretens of thousands of hectares.
It may not be practical or necessarily ecologically desirable, however, to think in terms of how large a singleforest landscape unit must be to be considered intact. We already know that wild nature needs to occupy largeareas to be sustained — the larger the building blocks the better. In light of continuing human pressures on ourforests, however, it might be wiser to ask how much natural forest area remains, in what configuration(including size and spatial arrangement), and is it protected and to what degree.
The most pragmatic and ecologically meaningful objective is to identify and map the best remaining examplesof relatively intact forest landscapes rather than choosing a single size a priori that likely meets all criteria. Thisshould be done on an ecoregional basis since ecoregions are widely believed to be the most ecologically usefulorganizing unit for conservation purposes.15
Starting with the largest remaining forest landscape units and working down to smaller units, intact forestmapping should be carried out. Science should single out potential starting points for criteria such as landscapeunit size and level of fragmentation, and identify where more detailed mapping has little value at theecoregional scale. For example, forest landscape units smaller than 5,000 hectares in a boreal ecoregion wherethe landscape is largely intact makes little sense. However, in coastal temperate rainforests, such as those inBritish Columbia that are characterized by many forest islands and mountain watersheds, a minimum sizebelow 5,000 hectares may be useful and warranted.
As a first step in mapping intact forest landscapes in Canada, we chose to map only the largest remaining areasdue to resource limitations. The size criteria for these large intact forest landscapes were set at:
• A minimum area of 50,000 hectares;• A minimum internal width of 10 kilometres (i.e., the diameter of the smallest circle that can be placed
inside the contours of an area); and• A minimum 2 kilometres width of protrusions along an intact boundary (i.e., the edges were
“smoothed” to eliminate narrow peninsulas).
Further mapping of smaller-sized areas is desirable and is a priority for future efforts. Work undertakenappropriate to the type of forest ecosystem is especially needed.
This approach of mapping large intact forest landscapes does not imply that smaller areas possess lowerconservation values. The complex issue of conservation values and priorities in smaller blocks of forestlandscape fall outside the scope of this study.16
Wildlife avoidance of developed and fragmented areas occurs over a much larger area than that of the physicallyaltered footprint of development.17 The extents of the zones within which wildlife will become affected byinfrastructure vary according to species, season, type of disturbance, habitat, and other environmental factors,and the effect of human development is species-specific. While some studies have suggested that wildlife andindustrial development are highly compatible, most studies that include both specialist and generalist species,conclude that total species diversity declines with increasing human development.
23
2.2.2. Important Types of Human Influence
Every place on Earth has been exposed to human influence at some time, and has been modified, inhabited ormanaged in some way.18 In this sense, humans are part of forest ecosystems. Human disturbance of the forestlandscape has changed over time, however, and there are degrees to which activities modify these forestlandscape systems.19 In order to be meaningful, any application of the definition of intact forest landscapesmust reflect the fact that intact forest landscapes are not “wild” in a true sense, but are the best well-preservedremaining examples of naturally functioning forest ecosystems.
It is both interesting and useful to delineate the intact portion of the forest landscape. This involvesdistinguishing between areas that are more or less disturbed; that is, between areas shaped by “substantial”human influence and those affected by “non-substantial” or “background” influences. Intact areas shouldshow no signs of having been substantially modified by human activity or subject to industrial land use for thelast six to seven decades (see Figure 3).
Many human disturbances that occurred during the past 60 to 70 years were identified in the satellite imageryused in this study. Types of disturbance that are visible in high-resolution satellite imagery (i.e., 15 and 30 metreresolution) include agricultural clearings, urbanization, logging sites (especially clearcuts), linear features suchas roads, and industrial infrastructure. Further details are given in Chapter 3.
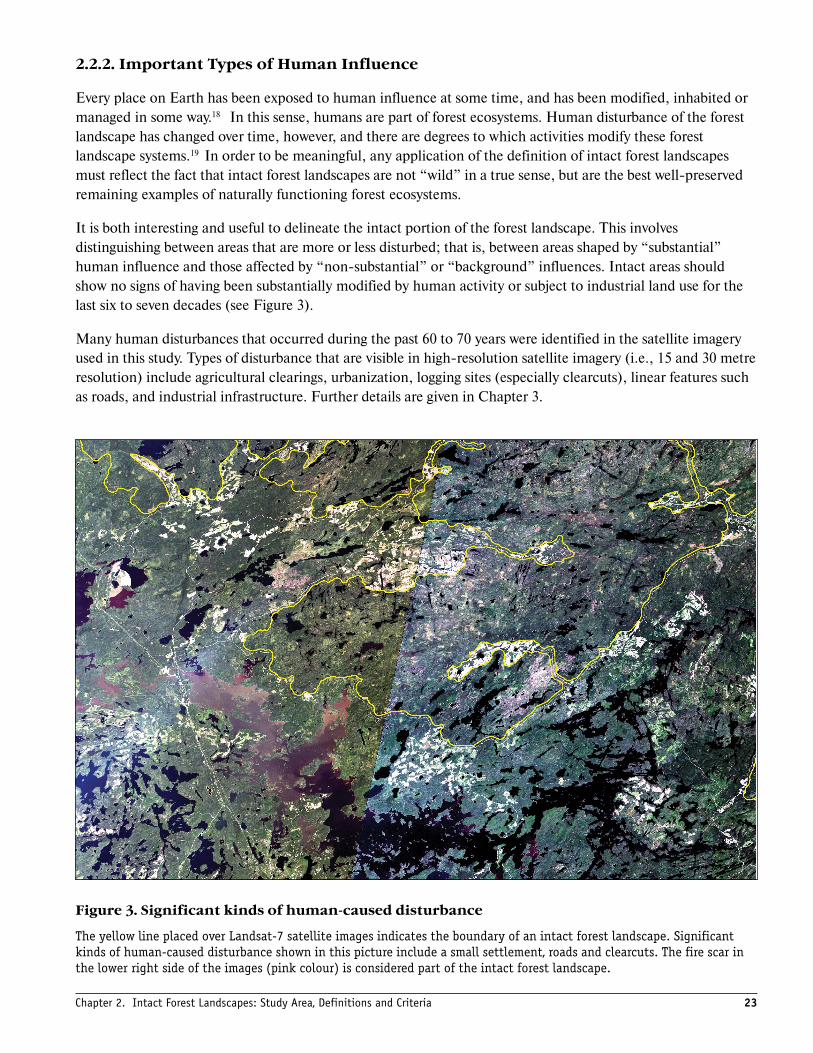
Figure 3. Significant kinds of human-caused disturbance
The yellow line placed over Landsat-7 satellite images indicates the boundary of an intact forest landscape. Significantkinds of human-caused disturbance shown in this picture include a small settlement, roads and clearcuts. The fire scar inthe lower right side of the images (pink colour) is considered part of the intact forest landscape.
Chapter 2. Intact Forest Landscapes: Study Area, Definitions and Criteria
24 Canada’s Large Intact Forest Landscapes
Two groups of human activities were classified as background influences:
1. Non-industrial, historic forms of human activity and more recent analogous activities were either notdetectable using satellite imagery, or were treated as evolutionary factors in today’s forest landscapesrather than disturbances:• hunting, fishing, mushrooms and berry picking (including construction of seasonal cabins);• grazing, excluding cases of overgrazing with grass cover degradation;• swathing, baling and stacking small hayfields remote from the large areas of agricultural lands (for
example, floodplains of small forest rivers),• selective logging for local, small-scale industrial needs, and high-grading for certain species such as
White Pine (Pinus strobus) in eastern Canada and other species throughout southern Canada, unlessthe effect of logging was detectable in satellite images;20
2. Human-induced forest fires (see section 2.3).
Additionally, two groups of activities were very difficult to map using remote satellite imagery. These were:1. Industrial types of human activities that occurred more than 40 to 70 years ago. Influences such as these
cannot be detected or confirmed by remote sensing using Landsat imagery (see section 2.2.3).2. Effects of global or regional-scale human influence. Impacts from these activities, such as air pollution
and climate change, could not properly be assessed at this time although they may have had, or arecurrently having, impacts.
All other types of human influence were, in principle, considered significant. An intact forest landscape, bydefinition, is one that has not been substantially affected by human influences. For the purposes of the study,however, positive evidence of any disturbance was required before an area was classified as non-intact.Consequently, the resulting intact forest landscape areas are likely an over-estimation. Higher resolutionimagery would be needed to increase the accuracy of the intact forest landscape areas.
2.2.3. Minimum Time Since Disturbance
Human activity has shaped Canada’s forests for millennia. Either directly or indirectly, people have been acause of forest fires since European colonization, and even before that in some regions.21 In many cases, it isimpossible to tell to what extent a feature in the forest landscape, such as fire disturbance, is the result of naturalprocesses such as lightning, or of human influence. The landscape has evolved through interaction with thishuman influence. Only the detectable traces of recent human activities are therefore considered as substantialsigns of disturbance (as noted in the previous section).
Much of the disturbance of Canada’s forests by industrial land use is recent, at least on a forest time scale.Several centuries of European colonization have modified the landscape substantially in Newfoundland, and inthe southern areas of other provinces in eastern and western Canada. This modification includes changes indominant tree species, or even a conversion (from forest) to heathlands over large areas. The forestry sectoronly began to cut large amounts of trees, however, at the end of the 19th century.22
In many parts of Canada, including Alberta, the expansion of the petroleum and forest industrial sectorsdid not occur until after the Second World War and the 1980s, respectively.23 Logging in Canada increasedsubstantially in the latter half of the 20th century. The total area logged annually has increased by 51percent in just a 25-year period, from 680,000 hectares in 1975 to over 1 million hectares in 2000.24 Thepetroleum industry has contributed to disturbances since the mid-1900s, with a rapid increase beginningin the early 1970s.25
25
The earliest forest cutting that can still be detected in high-resolution (Landsat) images generally occurred fromthe 1930s to 1940s. In some highly productive sites, such as the western temperate forests, only logging thatoccurred after the 1960s can be detected. All logging before this time was considered to be a non-substantialdisturbance for the purposes of this study, unless it was evident in recent Landsat imagery or supported byreliable, spatially explicit ancillary information. Many of these sites are likely undergoing spontaneousrestoration and will return to a natural forest condition if left undisturbed. Other sites may remain permanentlychanged due to early human disturbances.26
It is conceivable that areas significantly impacted by past human activities have been classified as intact forestlandscapes. Such areas may be different in forest structure and composition and have not yet recovered, yetspecific human disturbance is not evident in recent satellite imagery.
2.3 Natural Disturbances
The forest landscapes of Canada are subject to several types of large- and small-scale natural disturbance, suchas fire, insects, wind, flooding, and mortality and falling of individual trees.
The most important of these disturbances is probably fire. Forest fires occur naturally in most forest landscapesin Canada, and are a significant dynamic factor where it occurs. Areas not significantly affected by fire includeportions of the temperate forest ecozones, some areas in the boreal and taiga ecozones (including large regionsof moist forest), and some portions with specialized characteristics, such as riparian forests. Governmentrecords show that lightning strikes are responsible for most of the area burned by forest fires.27 The area burnedvaries greatly from one year to another. Large fires are generally associated with so-called fire years in whichextreme weather conditions, including extended periods of hot, dry weather, make the forest highly susceptibleto burning.28 The vast majority of all managed and unmanaged fires are less than 5 hectares in size but inextreme fire years, individual fires can cover 100,000 to 200,000 hectares, and have been recorded at 1 millionhectares and 1.4 million hectares.29
Over a long period of time, a natural fire regime will produce a certain structure in the forest landscape.Consequently, modifications in the fire regime will also affect the landscape. The increase in fire frequency dueto modern settlement and land use in some areas will increase the area of forest that is in young successionalstages, decrease the number of fire refuges, and change the water balance along with the soil permafrost horizonand the intensity of erosion. The decrease in fire frequency owing to recent increases in fire suppression effortsin other areas will increase the area of forest in older successional stages, as well as increase the number of firerefuges, and also affect the water balance.
Although the effect of an individual fire does not depend on its origin, the combined effect on the landscape ofall human-caused, human-suppressed, and natural fires is different from that of a strictly natural fire regime. Tocredibly identify and spatially separate human-caused, human-suppressed and natural fires post-facto is verydifficult, and was beyond the means and expertise of this study. Therefore, a simple decision rule had to beadopted. All fires were considered natural, that is, as part of a natural fire regime. As a consequence, burnedareas were consistently treated as a sign of natural disturbance and therefore as a legitimate part of the intactforest landscape.
It could be argued that fire suppression has altered the ecological processes of many forest ecosystems inCanada. It would be difficult, if not impossible, to separate landscapes into intact and non-intact based oneither types of change to the natural fire cycle.
Chapter 2. Intact Forest Landscapes: Study Area, Definitions and Criteria
26 Canada’s Large Intact Forest Landscapes
This approach to fire represents an important modification to the mapping approach used in Russia.30 In thatwork, an attempt was made to separate natural and human-caused fires. A schematic decision rule wasconstructed, according to which fire scars adjacent to infrastructure were treated as human-caused. Thisdecision rule reflects the increased probability that a fire in the vicinity of infrastructure would either have beencaused by humans and/or that human influence would affect the post-fire succession and/or lessorinvestments in fire suppression efforts.
Other natural disturbances have a strong impact on the forest landscape. Tree mortality caused by insects isestimated to be 1.5 times that due to fire, although this is widely variable in space, time and severity of effects.31
Wind and flooding are other significant natural landscape-level disturbance factors. A widespread agent ofsmall-scale disturbance of mature forest canopies is the falling of individual trees. The resulting canopy gapsplay a significant role in the ecological dynamics of coastal rainforests and an important role in many borealand taiga forests.32
In this study, all the above-mentioned disturbances were considered to be entirely natural, that is, not human-caused. Consequently, they did not affect the delineation of intact forest landscapes. The next chapter outlinesthe technical specifications of the methodology used to delineate the intact forest landscapes.
27
Chapter 3. Methods
This study maps large, intact forest landscapes in Canada using a modified version of a methodology developedby Global Forest Watch Russia to map intact forest landscapes in Russia.1 This chapter describes the overallmethod, key differences in analysis from the Russian approach, data used for analysis, and the key technicaldecision-making processes.
3.1 General Mapping Approach
All forest landscapes were presumed intact at the outset of the study. Forest landscapes were then systematicallyeliminated through the mapping methodology, which employed a stratified approach that used increasinglydetailed datasets. Initially we used inexpensive, accessible and previously purchased datasets of roads, pipelinesand populated areas, to eliminate disturbed areas. As the study area was reduced, more detailed data in the formof remote sensing imagery, well site data and pipeline data, were acquired to assist in detecting additionalindustrial activities, including logging, mining, and oil and gas facilities, for which comprehensive publiclyavailable digital datasets do not necessarily exist. The approach is described in more detail in section 3.3
This approach was adopted owing to information constraints associated with both cost and availability of data.A two-step approach made it possible to exclude large areas from further analysis on the basis of readilyavailable and affordable information, which led to substantial savings in work time and data costs.
Analysis was conducted in a Geographic Information System (GIS) environment using ESRI’s ArcView v. 3series and Leica Geosystems’ Geographic Imaging software (formerly ERDAS). Most vector layers used werein decimal degrees projection, and all vector and raster layers were interactively projected in the LambertConformal Conic projection.2 This projection is extensively used in ellipsoidal form for large-scale mapping ofregions of predominantly east–west extent, including many maps in the International Map of the World(1:1,000,000 scale) series, and topographic mapping in many nations.3 The GIS environment allowedinterpreters to identify signs of human disturbance, measure and delineate the area of the territory, and preparethe final maps for publication.
3.2 Data
As noted in section 3.1, a range of data was used to undertake this study. This chapter describes the differenttypes of data, sources, and key technical issues and challenges.
3.2.1 Satellite Imagery
Satellite images were the main source of data for step 2 (section 3.3). A number of different satellite imagerytypes were used (see Figures 4 and 5), as follow:
• Landsat 7 ETM+: approximately 700 images, mostly from the summer season for the period 1998 to2002.4 These images have a resolution of 28.5 metres.
• Terra ASTER: approximately 200 images, mostly from the summer season from the period 1999 to2000.5 These images have a resolution of 15 metres.
Chapter 3. Methods
28 Canada’s Large Intact Forest Landscapes
• Landsat 5 TM: approximately 300 images from the late 1980s to early 1990s.6 These images have 30metres ground resolution.
• Landsat 5 TM Outlooks: approximately 200 images from the late 1980s to early 1990s. These imagesconsist of three channels and are compressed, and thus only have a resolution of 300 metres.
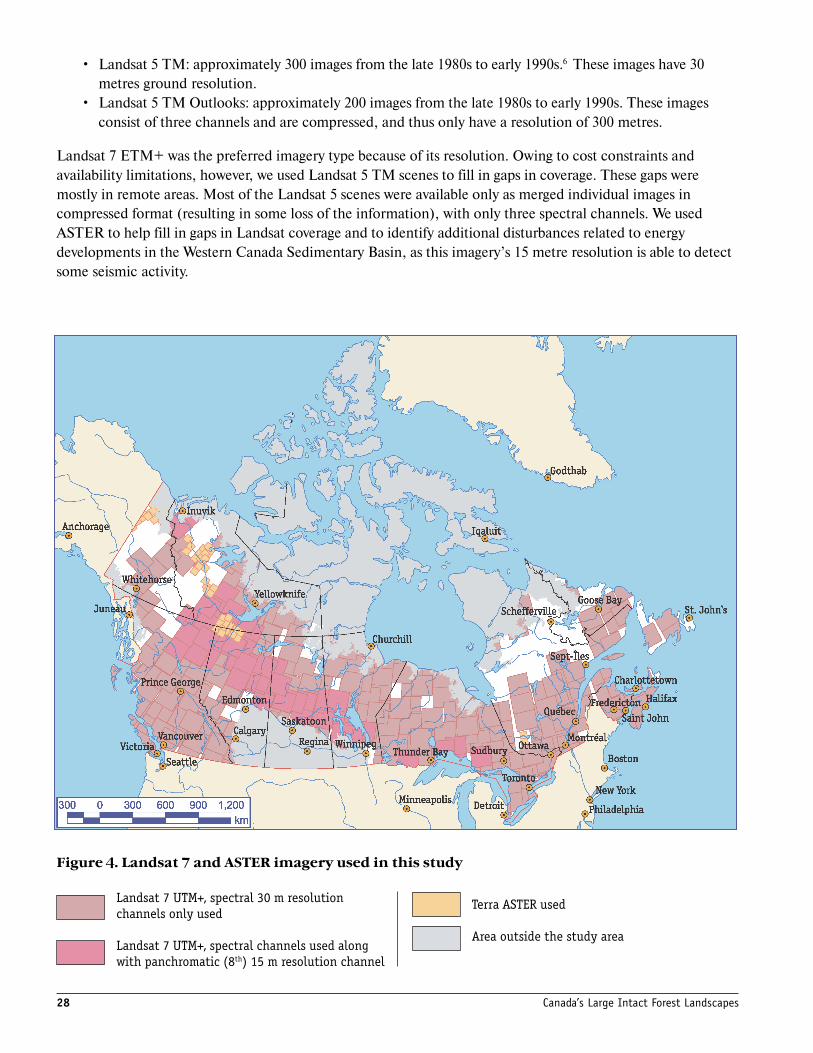
Landsat 7 ETM+ was the preferred imagery type because of its resolution. Owing to cost constraints andavailability limitations, however, we used Landsat 5 TM scenes to fill in gaps in coverage. These gaps weremostly in remote areas. Most of the Landsat 5 scenes were available only as merged individual images incompressed format (resulting in some loss of the information), with only three spectral channels. We usedASTER to help fill in gaps in Landsat coverage and to identify additional disturbances related to energydevelopments in the Western Canada Sedimentary Basin, as this imagery’s 15 metre resolution is able to detectsome seismic activity.
Figure 4. Landsat 7 and ASTER imagery used in this study
Landsat 7 UTM+, spectral 30 m resolutionchannels only used
Landsat 7 UTM+, spectral channels used alongwith panchromatic (8th) 15 m resolution channel
Terra ASTER used
Area outside the study area
29
All Landsat 7 ETM+, and Landsat 5 TM images had less than 20 percent cloud cover. Some ASTER imagesmay have had cloud cover in the 20% range. Various band combinations were selected to enhance visibility.All images were geo-registered and many were orthorectified, using multiple points and Leica Geosystems’Geographic Imaging software (formerly ERDAS). Approximately 110 of the Landsat 7 ETM+ images wereobtained through the Global Land Cover Facility (GLCF), which obtains Level 0R data and processes it toLevel 1G data. Most of these images were co-registered successfully with Earth Satellite Corporations’sorthorectified Landsat TM data from the late 1980s-early 1990s.7
In areas of high relief, such as British Columbia, the ETM+ data were sent to Earth Satellite Corporation fororthorectification. Further details on the processing of Landsat 7 ETM+ by Natural Resources Canada isavailable at the Geogratis website.8 Merged and compressed Landsat 5 imagery were prepared by, and availablefrom GeoGratis of Natural Resources Canada.9
Landsat 5 TM, regular scenes used
Landsat 5 TM, compressed three-channels merged coverage used
Area outside the study area
Chapter 3. Methods
Figure 5. Landsat 5 imagery used in this study
30 Canada’s Large Intact Forest Landscapes
Details on enhancement and analysis of imagery for identifying intact areas is provided in section 3.3.
3.2.2 Infrastructure and Settlements Data
The VMap0 (Vector Map Level 0), developed by the United States National Imagery and Mapping AgencyNatural Resources and subsequently updated and distributed by Canada’s Centre for Topographic Information,was used for mines, populated places, railroads, pipelines and bodies of water. This vector product is theequivalent to the Digital Chart of the World, and presents features at a 1:1,000,000 scale.10
3.2.3 Roads
We used Desktop Mapping Technologies Incorporated (DMTI Spatial) roads dataset of Canada, whichincludes streets, roads, highways, expressways, local roads and railways, as well as water and utility features at ascale of 1:100,000.11 The Terrain Resources Information Management (TRIM)12 roads dataset for portions ofBritish Columbia at a scale of 1:20,000, and the Updated Road Network of Canada (URN)13 that comprisesroad coverage at 1:50,000, were also used. The latter includes data on hydrographic and man-made features.
3.2.4 Land Cover
Land Cover of Canada 1995 Database Version 1.1 by the Canada Centre for Remote Sensing and the CanadianForest Service, Natural Resources Canada14 was used as the land cover base because there is no better nationalforest cover data currently available.15 The dataset is based on the multi-temporal satellite data of 1 kilometreresolution obtained in 1995 by the Advanced Very High Resolution Radiometer (AVHRR) on NOAA-14satellite, operated by the U.S. National Oceanic and Atmospheric Administration. The dataset contains 31land cover classes, including 12 forest (including two burn classes), three shrubland, seven cropland, grasslandand mosaic; and nine non-vegetated classes.
3.2.5 Administrative Units
Administrative units were taken from the 1:1 million scale VMap0 dataset by the United States NationalImagery and Mapping Agency.
3.2.6 Ecozones
We used the terrestrial ecozones, ecoregions, ecodistricts and ecoprovinces of Canada by Agriculture and Agri-Food Canada from February 2003. 16 This dataset displays ecozones at the 1:1 million scale.
3.2.7 Protected Areas
We initially used the Conservation Biology Institute — World Wildlife Fund’s Protected Areas Database from1999 as a base spatial data layer.17 Our dataset builds on available compiled datasets, maps and images andincludes boundaries of all federally, provincially and territorially owned protected areas in Canada that meet theEndangered Spaces criteria of World Wildlife Fund Canada.18 Most of the data are at 1:100,000 and includemany different types of protected areas. As management regimes of protected areas vary among jurisdictions,we make no distinction between the different management systems, except we highlighted national parks in ouranalysis.
31
3.2.8 Historic Treaty Areas, Modern Land Claim Settlements,First Nations Communities
Historic treaty areas and modern land claim settlements were initially compiled by Global Forest Watch andWorld Resources Institute in 2000.19 Treaty outlines and locations were obtained from National Atlas Map4162, Geogratis, Natural Resources Canada. Updates were provided by Legal Services Division, NaturalResources Canada. Data on Aboriginal/First Nations communities were obtained from Statistics Canada andincluded Indian Reserves, Metis Settlements and communities with populations of Aboriginal peoples asdefined by Indian and Northern Affairs Canada (INAC).20
3.2.9 Fire
The fire scars and post-fire successions layer were compiled from three different sources:1. The main source was the official large fire database from provincial and territorial governments
(compiled and obtained from Canadian Forestry Service, Natural Resources Canada, by specialrequest). Most of the data contains references to the year of fire occurrence. We filtered the data by yearselecting only fire areas since the year 1950. When the references to the year were absent (one of two datasets for Manitoba) or unclear (Saskatchewan), we checked those data sets with satellite imagery. If thefire scars from the data set were clearly visible, we assumed they were younger than 1950. For somejurisdictions, only the fire areas of later years were available. Thus, for example, for Northwest Territoriesthe data set includes only fires since 1965. In these cases, we included all available polygons into the finallayer.
2. Land Cover of Canada data set by Canada Center for Remote Sensing of 1995, Version 1.1. Classes 11and 12 (Burns) were filtered from the data set and added to the fire scars layer. All representcomparatively recent fires.
3. Our own data. We applied our own interpretation of the available Landsat 7 ETM+ satellite images fortwo provinces — Newfoundland and Labrador, and British Columbia. The reason for this approach wasbecause the data sets available for those two provinces were incomplete, and provided data only 1980s–1990s. For these two provinces, we digitized additional large fire scars (over 1000 hectares) using satelliteimagery. Only clearly visible and evident fire scars were digitized.
The final data set was produced by combining filtered records from all data sets, as described above, into asingle layer and dissolving the boundaries of overlapping polygons (Figure 6).
3.3 Analysis
As noted earlier, we identified large, intact forest landscapes using a stratified approach. Our analysis includedfour basic steps: (1) setting study area boundaries, (2) eliminating disturbed areas using existing datasets, (3)elimination of further disturbed areas using satellite imagery and more detailed, regional datasets, and (4) averification process using site visits, aerial photography, and a widespread review. These steps are describedbelow (also see Figure 7 and Figure 8).
Chapter 3. Methods
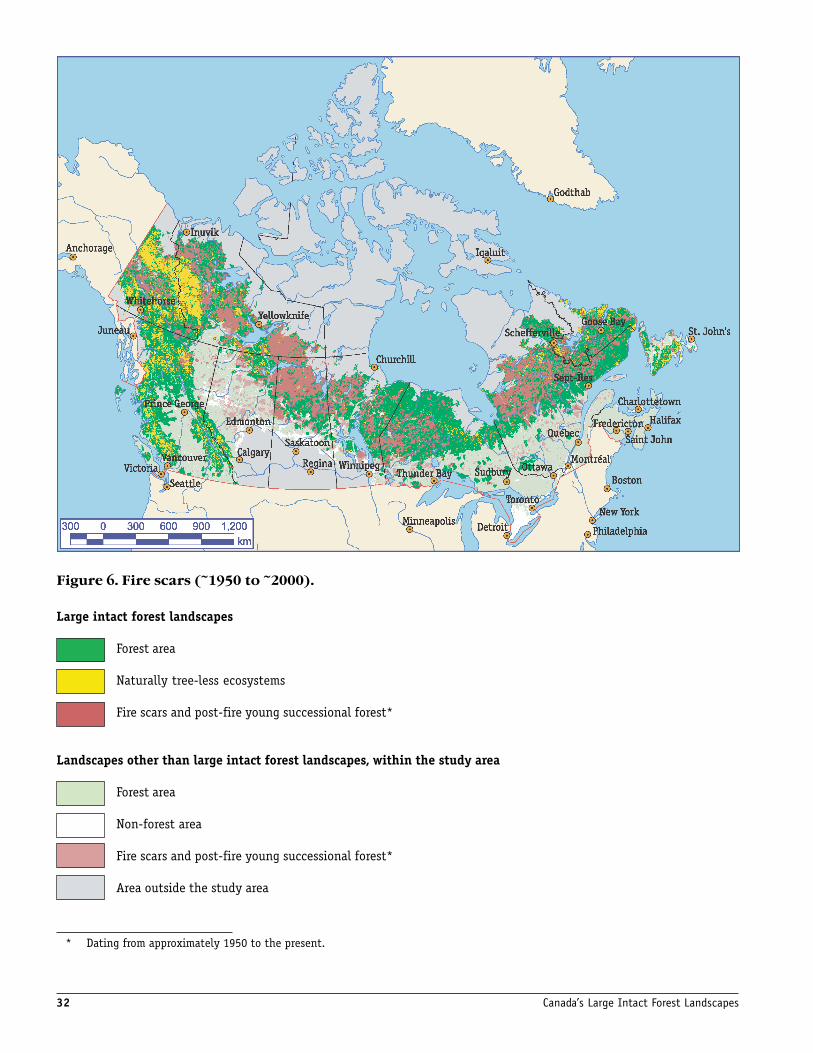
32 Canada’s Large Intact Forest Landscapes
Figure 6. Fire scars (~1950 to ~2000).
Large intact forest landscapes
Forest area
Naturally tree-less ecosystems
Fire scars and post-fire young successional forest*
Landscapes other than large intact forest landscapes, within the study area
Forest area
Non-forest area
Fire scars and post-fire young successional forest*
Area outside the study area
* Dating from approximately 1950 to the present.
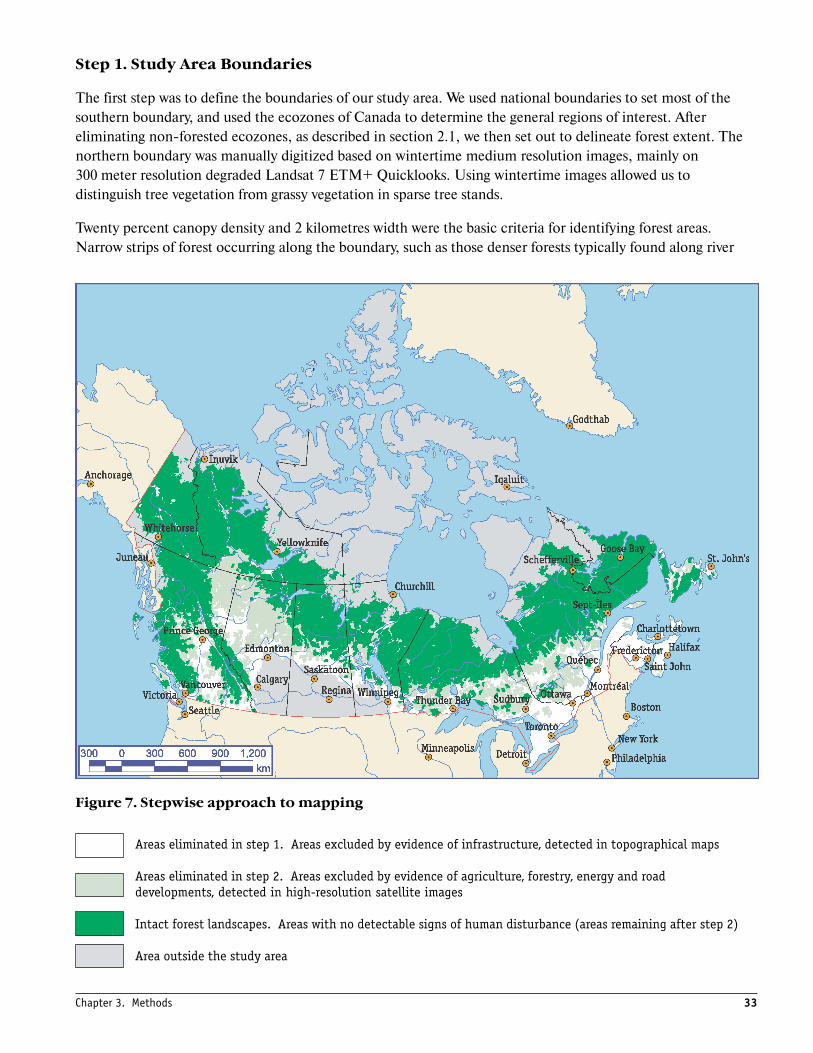
33
Step 1. Study Area Boundaries
The first step was to define the boundaries of our study area. We used national boundaries to set most of thesouthern boundary, and used the ecozones of Canada to determine the general regions of interest. Aftereliminating non-forested ecozones, as described in section 2.1, we then set out to delineate forest extent. Thenorthern boundary was manually digitized based on wintertime medium resolution images, mainly on300 meter resolution degraded Landsat 7 ETM+ Quicklooks. Using wintertime images allowed us todistinguish tree vegetation from grassy vegetation in sparse tree stands.
Twenty percent canopy density and 2 kilometres width were the basic criteria for identifying forest areas.Narrow strips of forest occurring along the boundary, such as those denser forests typically found along river
Figure 7. Stepwise approach to mapping
Areas eliminated in step 1. Areas excluded by evidence of infrastructure, detected in topographical maps
Areas eliminated in step 2. Areas excluded by evidence of agriculture, forestry, energy and roaddevelopments, detected in high-resolution satellite images
Intact forest landscapes. Areas with no detectable signs of human disturbance (areas remaining after step 2)
Area outside the study area
Chapter 3. Methods

34 Canada’s Large Intact Forest Landscapes
valleys because of local climatic condition, were excluded, along with treeless tundra zone. The southernboundary was digitized following the southern edge of the southern ecozones that are primarily forested(Pacific Maritime, Montane Cordillera, Boreal Plains, Boreal Shield, Atlantic Maritime and Mixed WoodPlains).
Step 2. Exclusion of Areas Using Existing Datasets
The second step involved reducing the initial study area by using existing datasets of human activity to identifymajor industrial activities. All linear, point and polygon features, such as roads, railways, pipelines, mines andpopulated places, described in section 3.2 were buffered to account for the disturbances from roads and otherinfrastructure. Table 3 provides a list of infrastructure elements and the width of their assumed maximum zoneof disturbance (buffer zone).
Buffers of 500 or 1000 metres were applied, depending on the type of infrastructure. The width of buffers wasconservative, in that many studies have shown the effects of disturbance greatly exceed 1000 metres for birds,predators and ungulates, in addition to smaller wildlife.21 An Ontario government study on wildlife areas used 5and 10 kilometre buffers.22 Large rivers and lakes were buffered if there was evidence of historic log drives.23
The resulting layers of buffered features were combined to create a “disturbance” layer. These areas were then“removed” or eliminated from the intact forest landscape consideration. Additionally, residual areas smallerthan 50,000 hectares were removed due to the size constraints discussed in Chapter 2. A map of candidateintact landscapes was then generated.
Table 3. Specific disturbances discernable with satellite imagery.
Type of infrastructure: Width of buffer zone aroundor on each side of the object (meters)
Populated placesBuilt-up areas 1000Settlements 1000Native settlements 500Camps 500Industrial and military objectsMilitary bases 1000Airports 1000Mining and drillingMines 1000Oil and gas plants 1000Pipelines, power linesPower lines 500Oil and gas pipelines 500Road networkRailroads 1000Expressways, Trans-Canada Highway, 400 series highways(e.g., Highway 401, Don Valley Parkway); Principal Highways(e.g., Highway 7, Highway 11); Major roads and county roads 1000Local roads – subdivision roads in a city or gravel road in rural area 500
35
Step 3. Exclusion of Areas Using Satellite Imagery
The third step involved acquiring and using satellite imagery to identify disturbances in the candidate intactforest landscapes identified in Step 2. High resolution imagery was useful for identifying a number of humanactivities for which publicly available, detailed datasets were not available. For example, Landsat 7 ETM+ wasable to identify areas affected by agriculture, forestry, and recent road developments. ASTER imagery issufficiently detailed to allow detection of energy (oil and gas) developments and infrastructure such as wellsites. Additional datasets, such as the well sites and fires, were used to support image interpretation. Theoutcome of this step was a reduced area of candidate intact forest landscapes. All imagery analysis was initiallydone by one interpreter, and verified by two other interpreters.
Visual interpreting of disturbances was normally performed at 1:50,000–1:250, 000 scale for Landsat 5 and 7and ASTER imagery, and 1:250,000 scale for degraded Landsat. This resulted in a variable accuracy and anoverall mapping resolution of approximately 1:1,000,000. The range of imagery results means variable accuracyand an overall mapping resolution of approximately 1:1,000,000–1:1,500,000.
The disturbance layer was overlaid with the study area layer to crop candidate areas. The analysis to identify anddigitize additional disturbances on satellite imagery was completed in all blocks of 50,000 hectares or largerwithin the study area. Linear disturbances were buffered according to the nature of the disturbance beforeexcluding them. Residual areas samller than 50,000 hectares were also eliminated. The result was a map(GIS layer) of Intact Forest Landscapes.
A special class of disturbances identified were various types of cutting lines — relatively thin linear disturbancesof straight shape, often forming rectangular grids. The most prevalent of them appeared to be seismic lines,mainly associated with oil and gas development. However, many of them often contained small roads, localpower lines and pipelines. Even with the use of high-resolution satellite imagery, it was often difficult to clarifyif a particular cutting line had a road, pipeline or power line on it. The only way to classify cutting lines was touse ancillary data. The lines, which connected roads marked in the topographic maps with buildings, clearcuts,mining or drilling spots, were considered roads (pipelines/power lines), which were then allocated 500-metrebuffers and excluded from the intact forest landscapes. Other lines (assumed to be simple seismic lines) wereexcluded only when the distance between them was less than 500 metres. Where the latter occurred, the wholearea between lines was excluded.
Although some individual datasets were accurate to 1:20,000 or better, the overall accuracy of the final maps isin the range of between 1:1,000,000–1,500,000. This is due primarily to satellite image rectification issues.It appeared the maximum error on-the-ground was approximately 500 metres, and this error was mostprevalent in regions of high topographic diversity, such as the mountainous regions of British Columbia andYukon Territory.
Various band combinations of the satellite images were selected and enhanced for visibility, and then manuallyinterpreted at a standard scale of 1:50,000–1:250,000.
Areas associated with the following main types of human disturbances were excluded in this step. These areaswere excluded only if positive signs of disturbance could be detected in satellite images. Specific disturbancesidentifiable on the satellite imagery are shown in Table 3.
Chapter 3. Methods
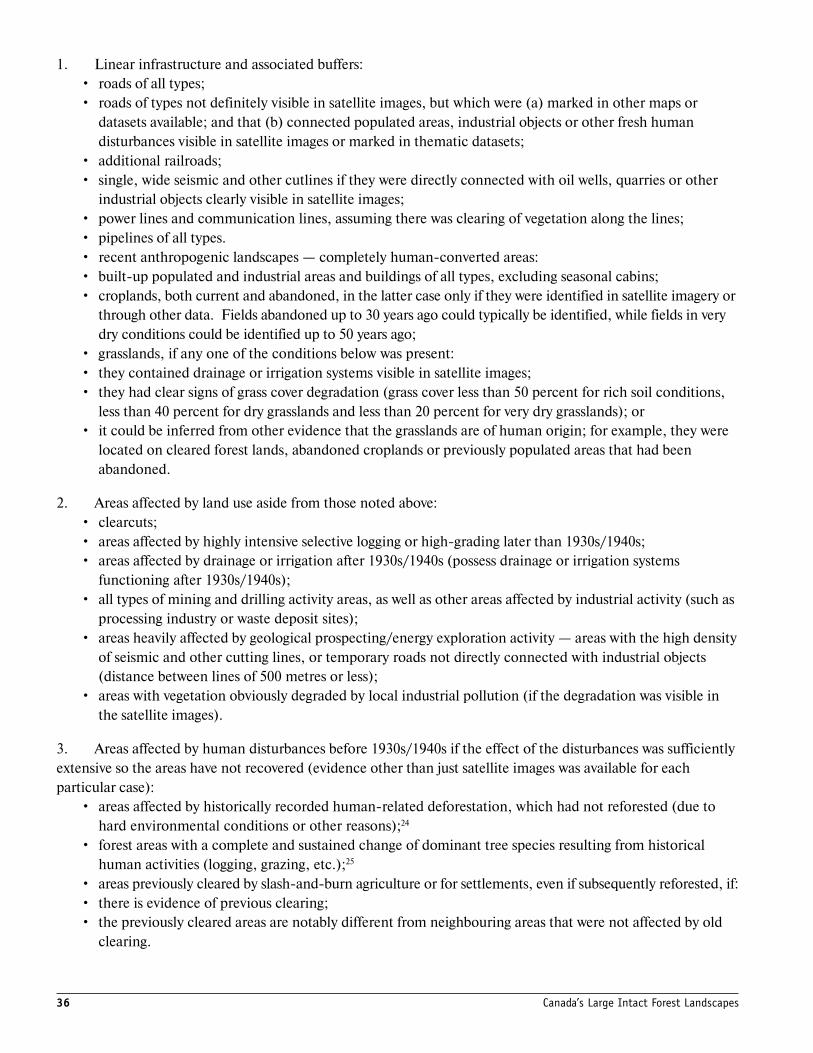
36 Canada’s Large Intact Forest Landscapes
1. Linear infrastructure and associated buffers:• roads of all types;• roads of types not definitely visible in satellite images, but which were (a) marked in other maps or
datasets available; and that (b) connected populated areas, industrial objects or other fresh humandisturbances visible in satellite images or marked in thematic datasets;
• additional railroads;• single, wide seismic and other cutlines if they were directly connected with oil wells, quarries or other
industrial objects clearly visible in satellite images;• power lines and communication lines, assuming there was clearing of vegetation along the lines;• pipelines of all types.• recent anthropogenic landscapes — completely human-converted areas:• built-up populated and industrial areas and buildings of all types, excluding seasonal cabins;• croplands, both current and abandoned, in the latter case only if they were identified in satellite imagery or
through other data. Fields abandoned up to 30 years ago could typically be identified, while fields in verydry conditions could be identified up to 50 years ago;
• grasslands, if any one of the conditions below was present:• they contained drainage or irrigation systems visible in satellite images;• they had clear signs of grass cover degradation (grass cover less than 50 percent for rich soil conditions,
less than 40 percent for dry grasslands and less than 20 percent for very dry grasslands); or• it could be inferred from other evidence that the grasslands are of human origin; for example, they were
located on cleared forest lands, abandoned croplands or previously populated areas that had beenabandoned.
2. Areas affected by land use aside from those noted above:• clearcuts;• areas affected by highly intensive selective logging or high-grading later than 1930s/1940s;• areas affected by drainage or irrigation after 1930s/1940s (possess drainage or irrigation systems
functioning after 1930s/1940s);• all types of mining and drilling activity areas, as well as other areas affected by industrial activity (such as
processing industry or waste deposit sites);• areas heavily affected by geological prospecting/energy exploration activity — areas with the high density
of seismic and other cutting lines, or temporary roads not directly connected with industrial objects(distance between lines of 500 metres or less);
• areas with vegetation obviously degraded by local industrial pollution (if the degradation was visible inthe satellite images).
3. Areas affected by human disturbances before 1930s/1940s if the effect of the disturbances was sufficientlyextensive so the areas have not recovered (evidence other than just satellite images was available for eachparticular case):
• areas affected by historically recorded human-related deforestation, which had not reforested (due tohard environmental conditions or other reasons);24
• forest areas with a complete and sustained change of dominant tree species resulting from historicalhuman activities (logging, grazing, etc.);25
• areas previously cleared by slash-and-burn agriculture or for settlements, even if subsequently reforested, if:• there is evidence of previous clearing;• the previously cleared areas are notably different from neighbouring areas that were not affected by old
clearing.
37
After one interpreter completed the visual interpreting of disturbances, a second interpreter checked theaccuracy of the mapping at the same scale. Questionable areas were highlighted, checked and, if necessary,corrected by a third interpreter using a variety of scales and imagery. Areas of uncertainty were resolved throughdiscussion within the interpretation team.
Step 4. Verification of Results
In step four, a combination of aerial photographs, field checks and expert review was used to verify the draftmap of intact forest landscapes.
A number of field expeditions were conducted in the fall of 2002 in the intact/non-intact fringe to verify theresult of the image interpretation. Field teams were made up of staff from Global Forest Watch Canada, Socio-Ecological Union International, Biodiversity Conservation Centre, Greenpeace Russia, and the PushchinoState University. Image interpreters participated in the field expeditions, all of whom were equipped with GPSreceivers and printouts or accessible laptop computers containing all relevant satellite imagery. Theseexpeditions occurred in Québec, Ontario, Manitoba, Alberta, British Columbia and Northwest Territories(Figure 8).
The field verification was not based on random or systematic sampling. Rather, the strategy was to seek outpoints that were easily accessible by road or truck/trail near the intact/non-intact boundary, but which werewithin the non-intact area and occurred over a broad geographic range. This process also allowed the generalaccuracy of the intact/non-intact boundaries to be verified. Areas of uncertainty or difficulty of interpretation,such as gradients and areas of potential historic logging or other land use, were also verified. In excess of 300field points in the six provinces/territories were checked. Corrections based on the field checkpoints weremade.
Additional verification was made using aerial photographs from government archives. These photographsallowed interpreters to refine the initial analysis of disturbance where the disturbances were visible but could noteasily be categorised. More than 2,000 aerial photos (1985-2002) for southern British Columbia and northernOntario, ranging from 1:5,000 to 1:60,000 and including dozens showing pre-1950 Ontario were examined toclarify areas of uncertainty. These aerial photographs mostly covered draft intact forest landscape polygons inthe south.
The photographs were examined for human disturbances. Where human disturbance was identified, thesedisturbances were checked to see if they could be detected on the satellite images; if so, they were mapped tocorrect the draft intact forest landscape boundaries. Small changes were made as a result of these aerial photochecks. The use of aerial photos dating back to the 1940s served primarily to verify the areas we hadpreliminarily mapped as intact, were indeed intact at least as far back as the date of the aerial photographs.
Review comments resulted in some minor modifications to the intact forest landscape areas, such as innorthwestern British Columbia (see Review Process summary, Annex), and in portions of Alberta.
A final result of the analysis was a selection of un-fragmented landscapes without detectable signs of humandisturbance, larger than 50,000 hectares and 10 kilometres in internal width. The final map was constructedbased on the results of this step-wise approach.
Chapter 3. Methods
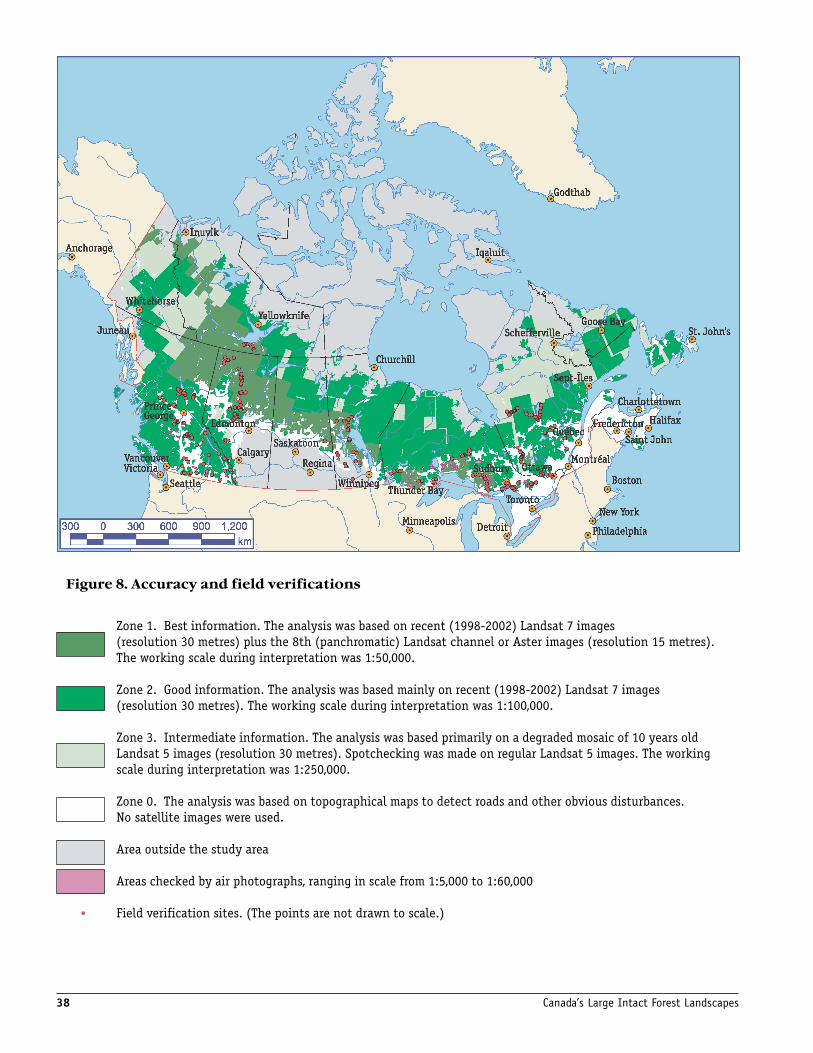
38 Canada’s Large Intact Forest Landscapes
Figure 8. Accuracy and field verifications
Zone 1. Best information. The analysis was based on recent (1998-2002) Landsat 7 images(resolution 30 metres) plus the 8th (panchromatic) Landsat channel or Aster images (resolution 15 metres).The working scale during interpretation was 1:50,000.
Zone 2. Good information. The analysis was based mainly on recent (1998-2002) Landsat 7 images(resolution 30 metres). The working scale during interpretation was 1:100,000.
Zone 3. Intermediate information. The analysis was based primarily on a degraded mosaic of 10 years oldLandsat 5 images (resolution 30 metres). Spotchecking was made on regular Landsat 5 images. The workingscale during interpretation was 1:250,000.
Zone 0. The analysis was based on topographical maps to detect roads and other obvious disturbances.No satellite images were used.
Area outside the study area
Areas checked by air photographs, ranging in scale from 1:5,000 to 1:60,000
Field verification sites. (The points are not drawn to scale.)
39
GIS analysis of intact forest landscapes was conducted to assess the status of these landscapes in terms of theirprotection and their distribution ecozones, provinces and territories, historic treaties and modern land claimsettlements and protected areas. To show forested and non-forested land inside and outside intact forestlandscapes and to calculate area, the final intact forest landscape dataset was overlaid and clipped with thevectorized landcover dataset.
3.4 Accuracy
The accuracy of the map varies across Canada, depending largely on quality and quantity of availableinformation. Although some individual datasets were accurate to 1:20,000 or better, the overall accuracy of thefinal maps is in the range of between 1:1,000,000-1,500,000. Owing primarily to rectification issues, it appearsthe maximum error on-the-ground is approximately 500 metres. This error is most prevalent in regions of hightopographic diversity, such as the mountainous regions of British Columbia and Yukon Territory.
The analysis is more likely to overestimate the area of intact forest landscapes. This is inherent in the basicapproach, which presumes all area to be intact unless the opposite can be proven. Signs of disturbance are morelikely to have been missed than to have been mistakenly found where none exist (although that possibilitycannot be ignored). In particular, areas of historic logging (a sign of disturbance) may have been interpreted asareas of historic fire (not considered a sign of disturbance). The decision rule used for classifying burned areasis also likely to err slightly on the side of intactness, as it is likely that frequent human-caused fires in someregions have dramatically altered the species composition and canopy structure.
Chapter 3. Methods
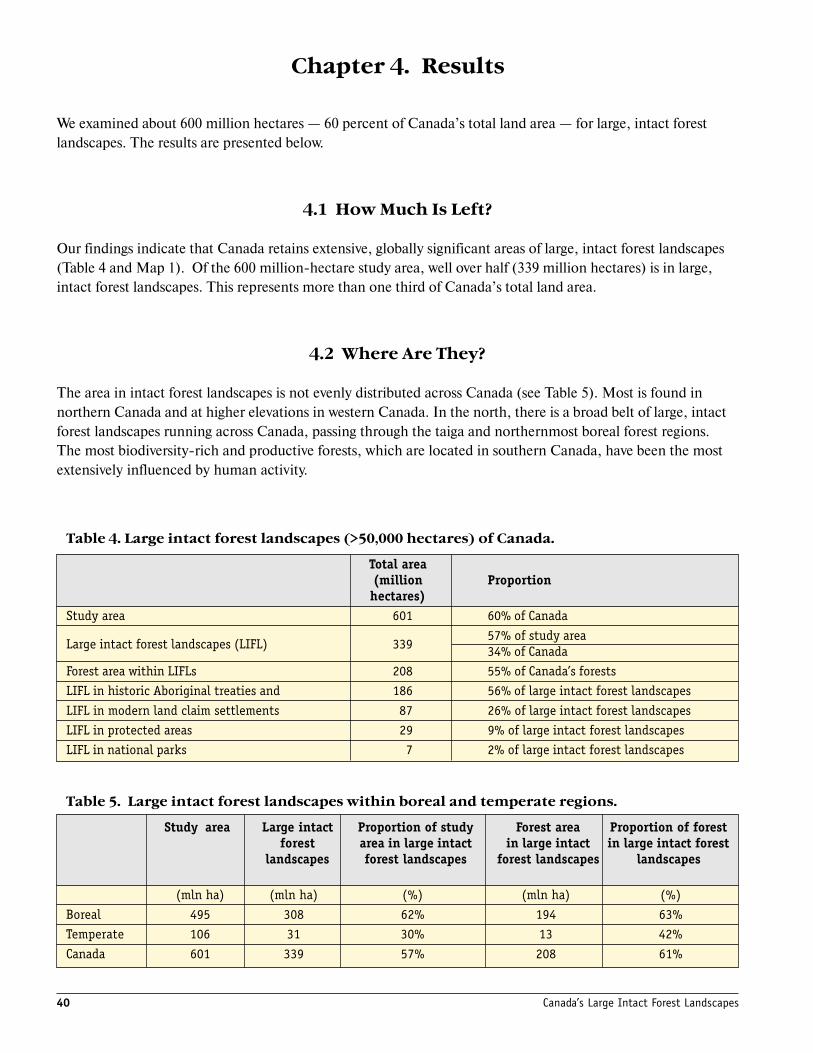
40 Canada’s Large Intact Forest Landscapes
Chapter 4. Results
We examined about 600 million hectares — 60 percent of Canada’s total land area — for large, intact forestlandscapes. The results are presented below.
4.1 How Much Is Left?
Our findings indicate that Canada retains extensive, globally significant areas of large, intact forest landscapes(Table 4 and Map 1). Of the 600 million-hectare study area, well over half (339 million hectares) is in large,intact forest landscapes. This represents more than one third of Canada’s total land area.
4.2 Where Are They?
The area in intact forest landscapes is not evenly distributed across Canada (see Table 5). Most is found innorthern Canada and at higher elevations in western Canada. In the north, there is a broad belt of large, intactforest landscapes running across Canada, passing through the taiga and northernmost boreal forest regions.The most biodiversity-rich and productive forests, which are located in southern Canada, have been the mostextensively influenced by human activity.
Table 5. Large intact forest landscapes within boreal and temperate regions.
Study area Large intact Proportion of study Forest area Proportion of forestforest area in large intact in large intact in large intact forest
landscapes forest landscapes forest landscapes landscapes
(mln ha) (mln ha) (%) (mln ha) (%)Boreal 495 308 62% 194 63%Temperate 106 31 30% 13 42%Canada 601 339 57% 208 61%
Table 4. Large intact forest landscapes (>50,000 hectares) of Canada.
Total area(million Proportion
hectares)Study area 601 60% of Canada
Large intact forest landscapes (LIFL) 33957% of study area34% of Canada
Forest area within LIFLs 208 55% of Canada’s forestsLIFL in historic Aboriginal treaties and 186 56% of large intact forest landscapesLIFL in modern land claim settlements 87 26% of large intact forest landscapesLIFL in protected areas 29 9% of large intact forest landscapesLIFL in national parks 7 2% of large intact forest landscapes
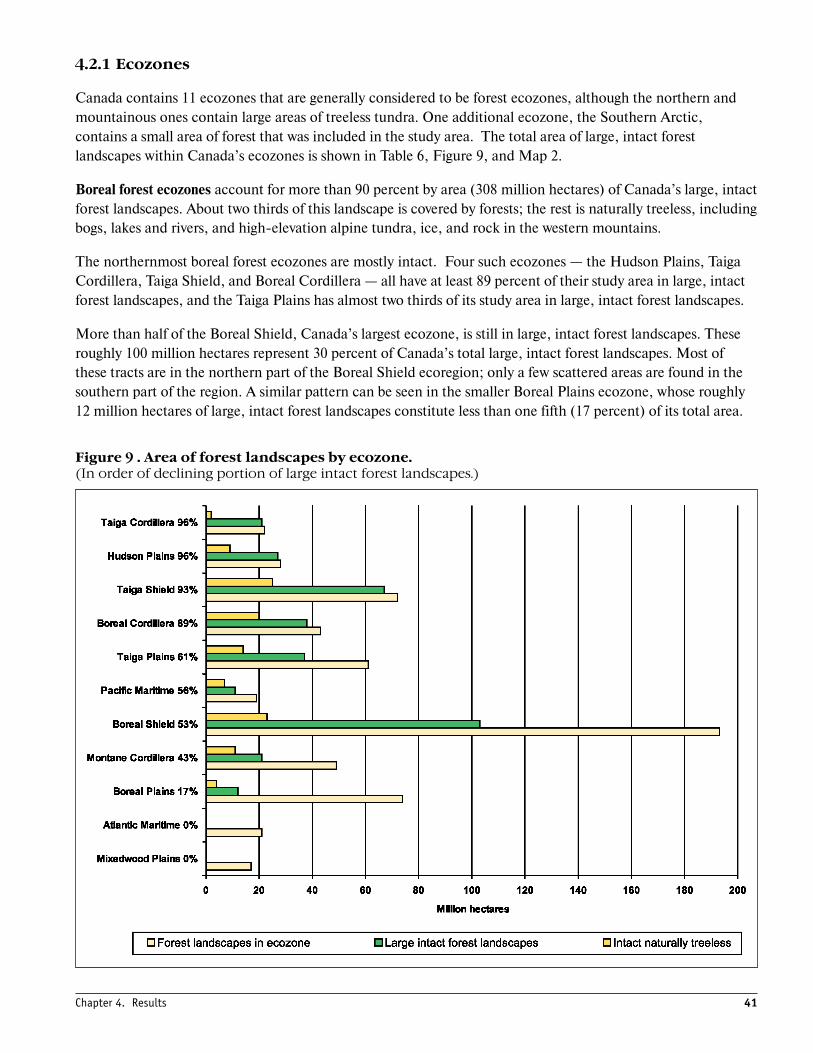
41Chapter 4. Results
Figure 9 . Area of forest landscapes by ecozone.(In order of declining portion of large intact forest landscapes.)
4.2.1 Ecozones
Canada contains 11 ecozones that are generally considered to be forest ecozones, although the northern andmountainous ones contain large areas of treeless tundra. One additional ecozone, the Southern Arctic,contains a small area of forest that was included in the study area. The total area of large, intact forestlandscapes within Canada’s ecozones is shown in Table 6, Figure 9, and Map 2.
Boreal forest ecozones account for more than 90 percent by area (308 million hectares) of Canada’s large, intactforest landscapes. About two thirds of this landscape is covered by forests; the rest is naturally treeless, includingbogs, lakes and rivers, and high-elevation alpine tundra, ice, and rock in the western mountains.
The northernmost boreal forest ecozones are mostly intact. Four such ecozones — the Hudson Plains, TaigaCordillera, Taiga Shield, and Boreal Cordillera — all have at least 89 percent of their study area in large, intactforest landscapes, and the Taiga Plains has almost two thirds of its study area in large, intact forest landscapes.
More than half of the Boreal Shield, Canada’s largest ecozone, is still in large, intact forest landscapes. Theseroughly 100 million hectares represent 30 percent of Canada’s total large, intact forest landscapes. Most ofthese tracts are in the northern part of the Boreal Shield ecoregion; only a few scattered areas are found in thesouthern part of the region. A similar pattern can be seen in the smaller Boreal Plains ecozone, whose roughly12 million hectares of large, intact forest landscapes constitute less than one fifth (17 percent) of its total area.
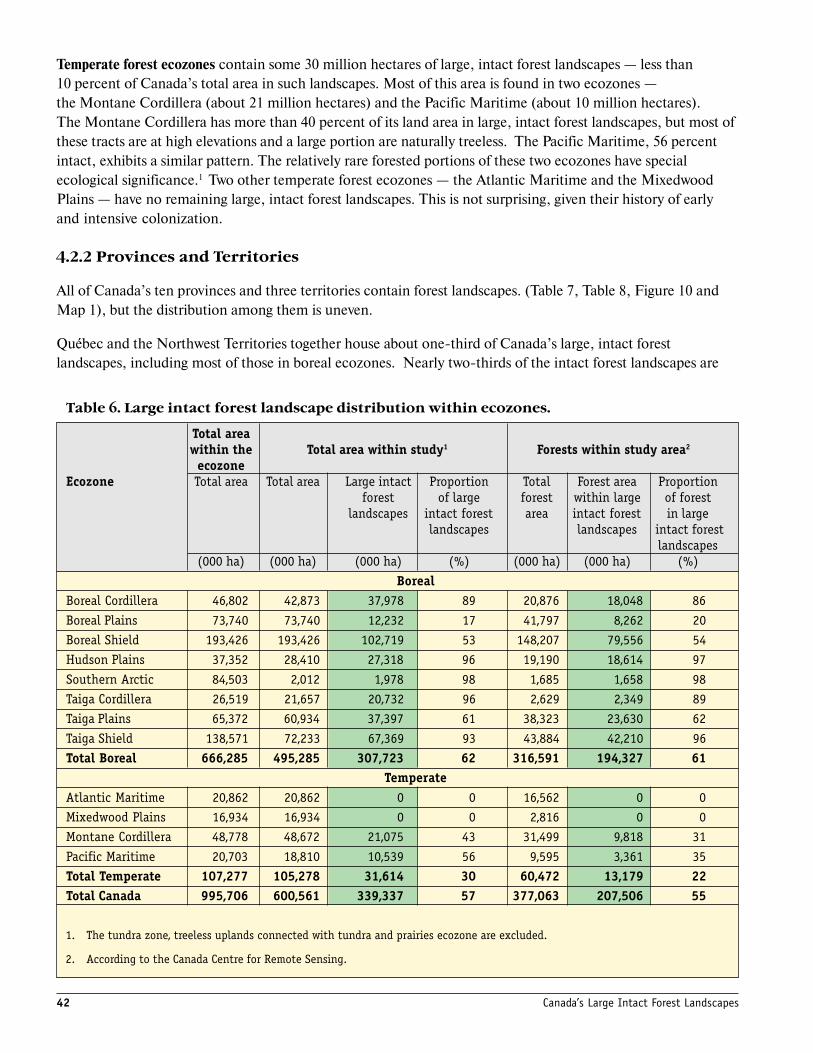
42 Canada’s Large Intact Forest Landscapes
Temperate forest ecozones contain some 30 million hectares of large, intact forest landscapes — less than10 percent of Canada’s total area in such landscapes. Most of this area is found in two ecozones —the Montane Cordillera (about 21 million hectares) and the Pacific Maritime (about 10 million hectares).The Montane Cordillera has more than 40 percent of its land area in large, intact forest landscapes, but most ofthese tracts are at high elevations and a large portion are naturally treeless. The Pacific Maritime, 56 percentintact, exhibits a similar pattern. The relatively rare forested portions of these two ecozones have specialecological significance.1 Two other temperate forest ecozones — the Atlantic Maritime and the MixedwoodPlains — have no remaining large, intact forest landscapes. This is not surprising, given their history of earlyand intensive colonization.
4.2.2 Provinces and Territories
All of Canada’s ten provinces and three territories contain forest landscapes. (Table 7, Table 8, Figure 10 andMap 1), but the distribution among them is uneven.
Québec and the Northwest Territories together house about one-third of Canada’s large, intact forestlandscapes, including most of those in boreal ecozones. Nearly two-thirds of the intact forest landscapes are
Table 6. Large intact forest landscape distribution within ecozones.
Total areawithin the Total area within study1 Forests within study area2
ecozoneEcozone Total area Total area Large intact Proportion Total Forest area Proportion
forest of large forest within large of forestlandscapes intact forest area intact forest in large
landscapes landscapes intact forestlandscapes
(000 ha) (000 ha) (000 ha) (%) (000 ha) (000 ha) (%)Boreal
Boreal Cordillera 46,802 42,873 37,978 89 20,876 18,048 86Boreal Plains 73,740 73,740 12,232 17 41,797 8,262 20Boreal Shield 193,426 193,426 102,719 53 148,207 79,556 54Hudson Plains 37,352 28,410 27,318 96 19,190 18,614 97Southern Arctic 84,503 2,012 1,978 98 1,685 1,658 98Taiga Cordillera 26,519 21,657 20,732 96 2,629 2,349 89Taiga Plains 65,372 60,934 37,397 61 38,323 23,630 62Taiga Shield 138,571 72,233 67,369 93 43,884 42,210 96Total Boreal 666,285 495,285 307,723 62 316,591 194,327 61
TemperateAtlantic Maritime 20,862 20,862 0 0 16,562 0 0Mixedwood Plains 16,934 16,934 0 0 2,816 0 0Montane Cordillera 48,778 48,672 21,075 43 31,499 9,818 31Pacific Maritime 20,703 18,810 10,539 56 9,595 3,361 35Total Temperate 107,277 105,278 31,614 30 60,472 13,179 22Total Canada 995,706 600,561 339,337 57 377,063 207,506 55
1. The tundra zone, treeless uplands connected with tundra and prairies ecozone are excluded.
2. According to the Canada Centre for Remote Sensing.
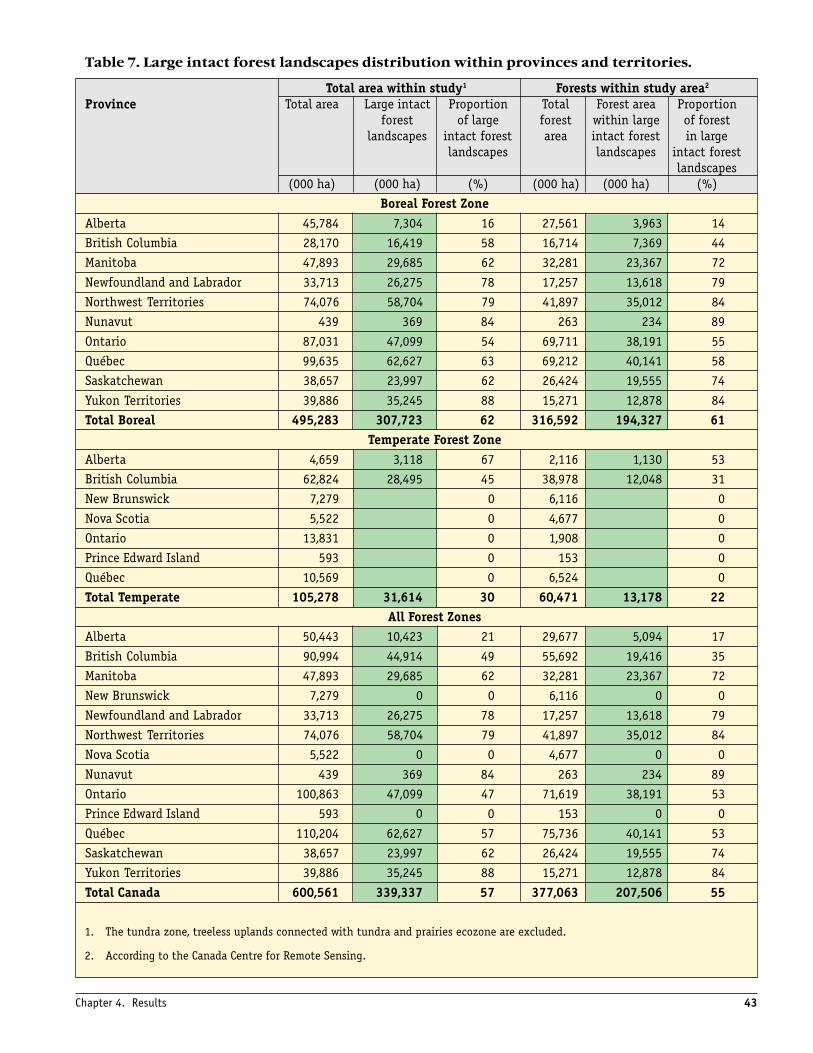
43
Table 7. Large intact forest landscapes distribution within provinces and territories.
Total area within study1 Forests within study area2
Province Total area Large intact Proportion Total Forest area Proportionforest of large forest within large of forest
landscapes intact forest area intact forest in largelandscapes landscapes intact forest
landscapes(000 ha) (000 ha) (%) (000 ha) (000 ha) (%)
Boreal Forest ZoneAlberta 45,784 7,304 16 27,561 3,963 14British Columbia 28,170 16,419 58 16,714 7,369 44Manitoba 47,893 29,685 62 32,281 23,367 72Newfoundland and Labrador 33,713 26,275 78 17,257 13,618 79Northwest Territories 74,076 58,704 79 41,897 35,012 84Nunavut 439 369 84 263 234 89Ontario 87,031 47,099 54 69,711 38,191 55Québec 99,635 62,627 63 69,212 40,141 58Saskatchewan 38,657 23,997 62 26,424 19,555 74Yukon Territories 39,886 35,245 88 15,271 12,878 84Total Boreal 495,283 307,723 62 316,592 194,327 61
Temperate Forest ZoneAlberta 4,659 3,118 67 2,116 1,130 53British Columbia 62,824 28,495 45 38,978 12,048 31New Brunswick 7,279 0 6,116 0Nova Scotia 5,522 0 4,677 0Ontario 13,831 0 1,908 0Prince Edward Island 593 0 153 0Québec 10,569 0 6,524 0Total Temperate 105,278 31,614 30 60,471 13,178 22
All Forest ZonesAlberta 50,443 10,423 21 29,677 5,094 17British Columbia 90,994 44,914 49 55,692 19,416 35Manitoba 47,893 29,685 62 32,281 23,367 72New Brunswick 7,279 0 0 6,116 0 0Newfoundland and Labrador 33,713 26,275 78 17,257 13,618 79Northwest Territories 74,076 58,704 79 41,897 35,012 84Nova Scotia 5,522 0 0 4,677 0 0Nunavut 439 369 84 263 234 89Ontario 100,863 47,099 47 71,619 38,191 53Prince Edward Island 593 0 0 153 0 0Québec 110,204 62,627 57 75,736 40,141 53Saskatchewan 38,657 23,997 62 26,424 19,555 74Yukon Territories 39,886 35,245 88 15,271 12,878 84Total Canada 600,561 339,337 57 377,063 207,506 55
1. The tundra zone, treeless uplands connected with tundra and prairies ecozone are excluded.
2. According to the Canada Centre for Remote Sensing.
Chapter 4. Results
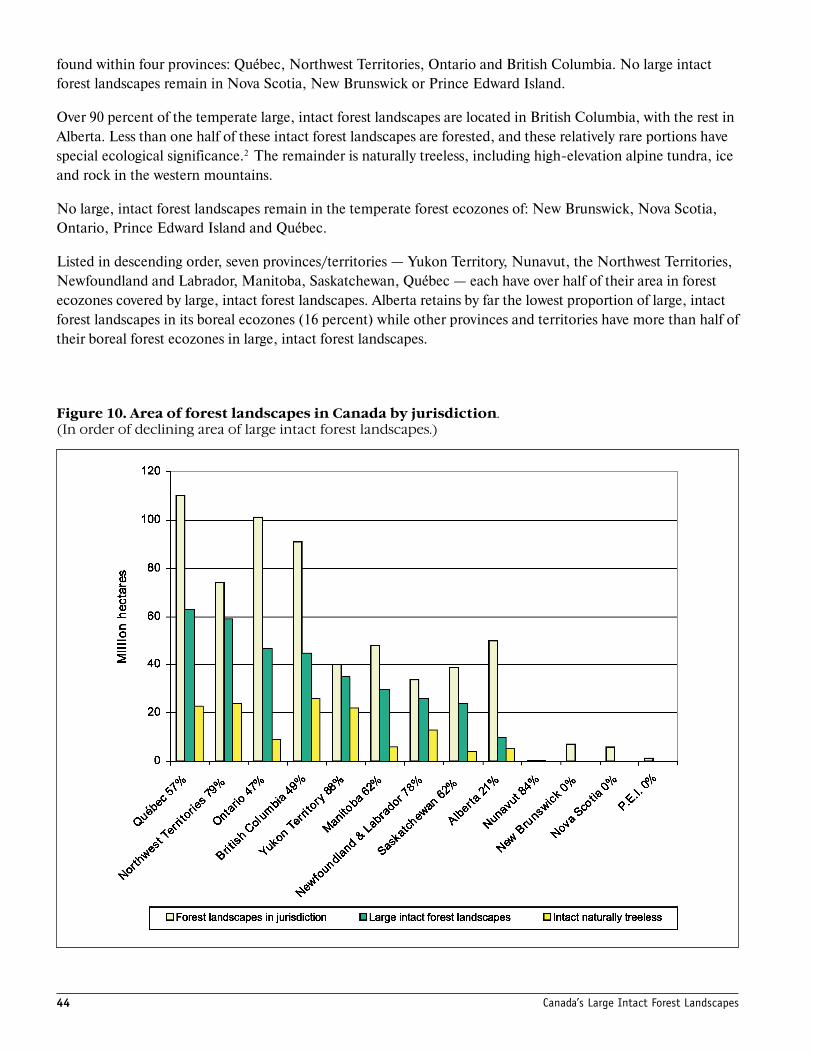
44 Canada’s Large Intact Forest Landscapes
Figure 10. Area of forest landscapes in Canada by jurisdiction.(In order of declining area of large intact forest landscapes.)
found within four provinces: Québec, Northwest Territories, Ontario and British Columbia. No large intactforest landscapes remain in Nova Scotia, New Brunswick or Prince Edward Island.
Over 90 percent of the temperate large, intact forest landscapes are located in British Columbia, with the rest inAlberta. Less than one half of these intact forest landscapes are forested, and these relatively rare portions havespecial ecological significance.2 The remainder is naturally treeless, including high-elevation alpine tundra, iceand rock in the western mountains.
No large, intact forest landscapes remain in the temperate forest ecozones of: New Brunswick, Nova Scotia,Ontario, Prince Edward Island and Québec.
Listed in descending order, seven provinces/territories — Yukon Territory, Nunavut, the Northwest Territories,Newfoundland and Labrador, Manitoba, Saskatchewan, Québec — each have over half of their area in forestecozones covered by large, intact forest landscapes. Alberta retains by far the lowest proportion of large, intactforest landscapes in its boreal ecozones (16 percent) while other provinces and territories have more than half oftheir boreal forest ecozones in large, intact forest landscapes.
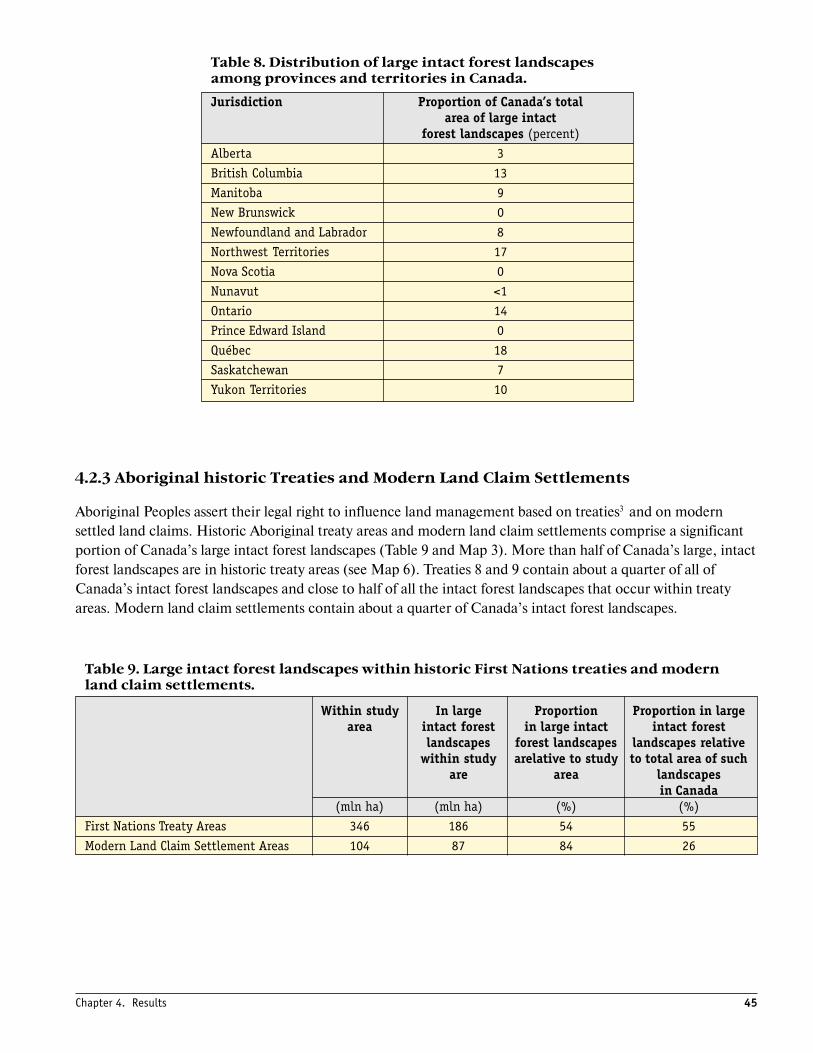
45Chapter 4. Results
Table 9. Large intact forest landscapes within historic First Nations treaties and modernland claim settlements.
Within study In large Proportion Proportion in largearea intact forest in large intact intact forest
landscapes forest landscapes landscapes relativewithin study arelative to study to total area of such
are area landscapesin Canada
(mln ha) (mln ha) (%) (%)First Nations Treaty Areas 346 186 54 55Modern Land Claim Settlement Areas 104 87 84 26
Table 8. Distribution of large intact forest landscapesamong provinces and territories in Canada.
Jurisdiction Proportion of Canada’s totalarea of large intact
forest landscapes (percent)Alberta 3British Columbia 13Manitoba 9New Brunswick 0Newfoundland and Labrador 8Northwest Territories 17Nova Scotia 0Nunavut <1Ontario 14Prince Edward Island 0Québec 18Saskatchewan 7Yukon Territories 10
4.2.3 Aboriginal historic Treaties and Modern Land Claim Settlements
Aboriginal Peoples assert their legal right to influence land management based on treaties3 and on modernsettled land claims. Historic Aboriginal treaty areas and modern land claim settlements comprise a significantportion of Canada’s large intact forest landscapes (Table 9 and Map 3). More than half of Canada’s large, intactforest landscapes are in historic treaty areas (see Map 6). Treaties 8 and 9 contain about a quarter of all ofCanada’s intact forest landscapes and close to half of all the intact forest landscapes that occur within treatyareas. Modern land claim settlements contain about a quarter of Canada’s intact forest landscapes.
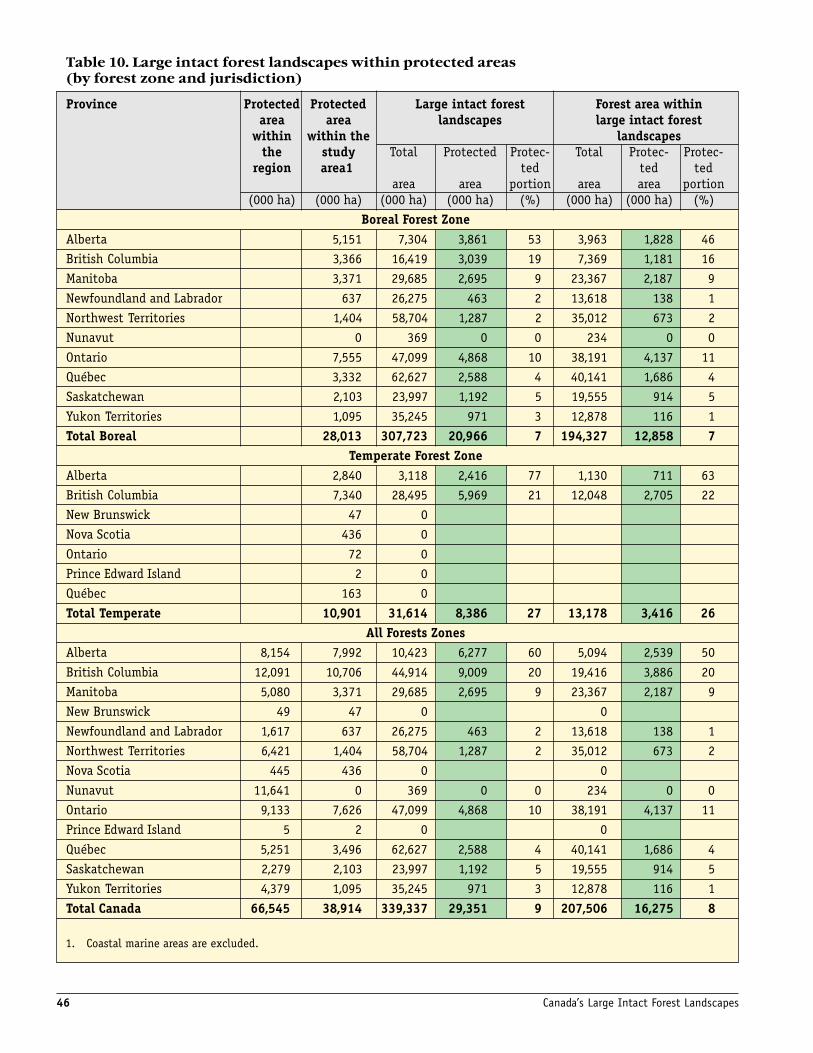
46 Canada’s Large Intact Forest Landscapes
Table 10. Large intact forest landscapes within protected areas(by forest zone and jurisdiction)
Province Protected Protected Large intact forest Forest area withinarea area landscapes large intact forest
within within the landscapesthe study Total Protected Protec- Total Protec- Protec-
region area1 ted ted tedarea area portion area area portion
(000 ha) (000 ha) (000 ha) (000 ha) (%) (000 ha) (000 ha) (%)Boreal Forest Zone
Alberta 5,151 7,304 3,861 53 3,963 1,828 46British Columbia 3,366 16,419 3,039 19 7,369 1,181 16Manitoba 3,371 29,685 2,695 9 23,367 2,187 9Newfoundland and Labrador 637 26,275 463 2 13,618 138 1Northwest Territories 1,404 58,704 1,287 2 35,012 673 2Nunavut 0 369 0 0 234 0 0Ontario 7,555 47,099 4,868 10 38,191 4,137 11Québec 3,332 62,627 2,588 4 40,141 1,686 4Saskatchewan 2,103 23,997 1,192 5 19,555 914 5Yukon Territories 1,095 35,245 971 3 12,878 116 1Total Boreal 28,013 307,723 20,966 7 194,327 12,858 7
Temperate Forest ZoneAlberta 2,840 3,118 2,416 77 1,130 711 63British Columbia 7,340 28,495 5,969 21 12,048 2,705 22New Brunswick 47 0 Nova Scotia 436 0 Ontario 72 0 Prince Edward Island 2 0 Québec 163 0 Total Temperate 10,901 31,614 8,386 27 13,178 3,416 26
All Forests ZonesAlberta 8,154 7,992 10,423 6,277 60 5,094 2,539 50British Columbia 12,091 10,706 44,914 9,009 20 19,416 3,886 20Manitoba 5,080 3,371 29,685 2,695 9 23,367 2,187 9New Brunswick 49 47 0 0 Newfoundland and Labrador 1,617 637 26,275 463 2 13,618 138 1Northwest Territories 6,421 1,404 58,704 1,287 2 35,012 673 2Nova Scotia 445 436 0 0 Nunavut 11,641 0 369 0 0 234 0 0Ontario 9,133 7,626 47,099 4,868 10 38,191 4,137 11Prince Edward Island 5 2 0 0 Québec 5,251 3,496 62,627 2,588 4 40,141 1,686 4Saskatchewan 2,279 2,103 23,997 1,192 5 19,555 914 5Yukon Territories 4,379 1,095 35,245 971 3 12,878 116 1Total Canada 66,545 38,914 339,337 29,351 9 207,506 16,275 8
1. Coastal marine areas are excluded.
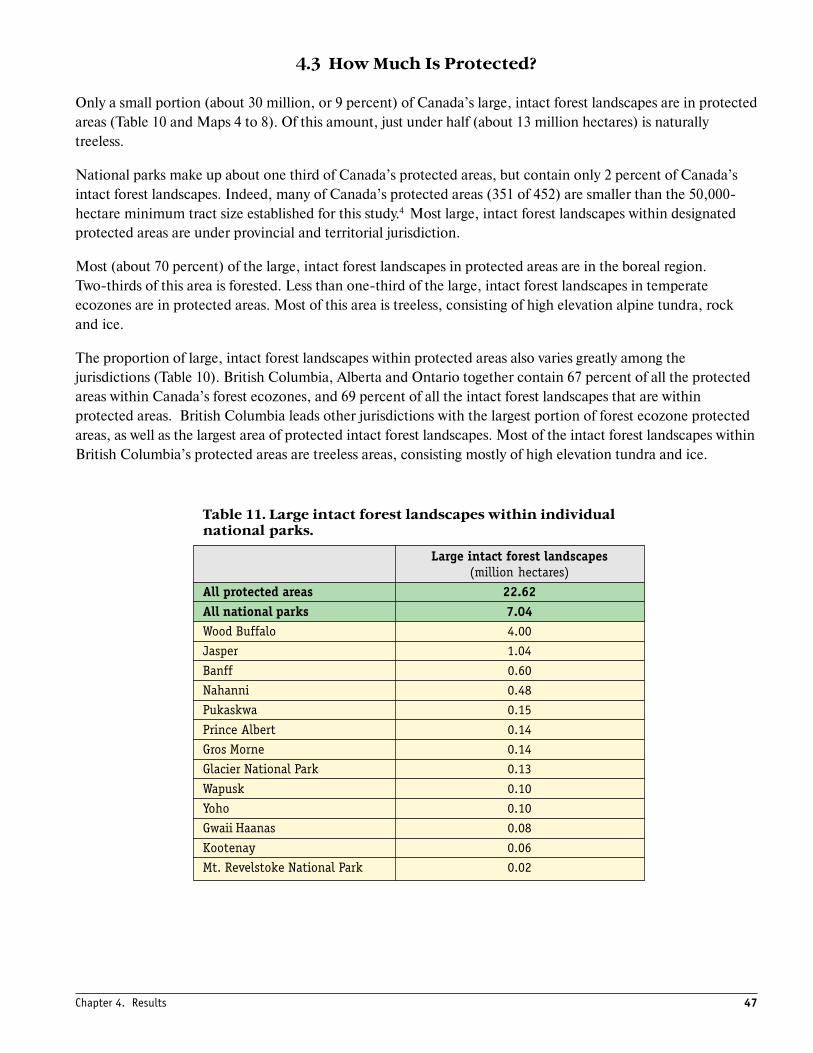
47
4.3 How Much Is Protected?
Only a small portion (about 30 million, or 9 percent) of Canada’s large, intact forest landscapes are in protectedareas (Table 10 and Maps 4 to 8). Of this amount, just under half (about 13 million hectares) is naturallytreeless.
National parks make up about one third of Canada’s protected areas, but contain only 2 percent of Canada’sintact forest landscapes. Indeed, many of Canada’s protected areas (351 of 452) are smaller than the 50,000-hectare minimum tract size established for this study.4 Most large, intact forest landscapes within designatedprotected areas are under provincial and territorial jurisdiction.
Most (about 70 percent) of the large, intact forest landscapes in protected areas are in the boreal region.Two-thirds of this area is forested. Less than one-third of the large, intact forest landscapes in temperateecozones are in protected areas. Most of this area is treeless, consisting of high elevation alpine tundra, rockand ice.
The proportion of large, intact forest landscapes within protected areas also varies greatly among thejurisdictions (Table 10). British Columbia, Alberta and Ontario together contain 67 percent of all the protectedareas within Canada’s forest ecozones, and 69 percent of all the intact forest landscapes that are withinprotected areas. British Columbia leads other jurisdictions with the largest portion of forest ecozone protectedareas, as well as the largest area of protected intact forest landscapes. Most of the intact forest landscapes withinBritish Columbia’s protected areas are treeless areas, consisting mostly of high elevation tundra and ice.
Table 11. Large intact forest landscapes within individualnational parks.
Large intact forest landscapes(million hectares)
All protected areas 22.62All national parks 7.04Wood Buffalo 4.00Jasper 1.04Banff 0.60Nahanni 0.48Pukaskwa 0.15Prince Albert 0.14Gros Morne 0.14Glacier National Park 0.13Wapusk 0.10Yoho 0.10Gwaii Haanas 0.08Kootenay 0.06Mt. Revelstoke National Park 0.02
Chapter 4. Results
48 Canada’s Large Intact Forest Landscapes
Chapter 5. Conclusions
This study mapped Canada’s large, intact forest landscapes and is the first to give detailed answers to thequestions:
• How much is left?• Where are they located?• How much is protected?
The answers are based on a systematic examination of detailed, recent satellite images covering all forestlandscapes of Canada, and are supported by ancillary data, field verification, and contributions from numerousadvisors, data collaborators, and expert reviewers.
Although large tracts of intact (i.e., undisturbed) forest ecosystems are becoming increasingly rare across theworld, Canada possesses roughly 340 million hectares of such landscapes. This is an extraordinarily large areathat rivals virtually any other nation.
These remaining large (50,000 hectares or larger), intact forest landscapes occur mainly in the northernportions of Canada and in high-elevation areas. The vast majority of these landscapes — about 308 millionhectares, or more than 90 percent — is within Canada’s boreal forest ecozones. The remainder is within thetemperate forest ecozones.
In contrast to the large area of intact landscapes in northern Canada, the forest landscapes of southern Canada,in both boreal and temperate forest ecozones, are substantially affected by modern land use. Much of theremaining intact forest landscapes in southern Canada is naturally treeless, consisting of bogs, lakes, rivers,mountain grasslands, alpine tundra, and rock. The most biodiversity-rich and productive forestlands are alsothe most influenced by human activity.
Almost two thirds of Canada’s intact forest landscapes are within Québec, the Northwest Territories, Ontario,and British Columbia. In contrast, Nova Scotia, New Brunswick, and Prince Edward Island have no remaininglarge, intact forest landscapes, while Alberta has one fifth of its forest ecozones remaining as large, intact forestlandscapes. In Canada’s temperate forest ecozones, only British Columbia and Alberta retain large, intactforest landscapes; the five eastern Canadian provinces that have temperate forest ecozones no longer possessany large tracts of undisturbed forest.
A significant proportion of Canada’s large, intact forest landscapes are located within historic First NationsTreaty areas and within modern land claim settlements.
Only a small portion of Canada’s large, intact forest landscapes occurs in designated protected areas.
Future Research
This study represents the first detailed attempt to map the extent and boundaries of large, intact forestlandscapes across Canada using high-resolution satellite imagery and ancillary data. The goal was to producemaps that are accurate and detailed enough to guide broad, landscape-level decision-making processesconcerning land conservation and management. In the future, it would be desirable to both refine and expandthis work.

49
An obvious approach to refinement would be to incorporate existing provincial and forest management unit-level information — presently unavailable, or not easily available, to the public — on roads, logged areas, andareas affected by energy exploration and developments. This would increase the accuracy of future analysis andenhance its usefulness.
Mapping the location of economic, social and conservation values across the forest landscape — intact as wellas non-intact — is an essential expansion of this work. Such information is necessary for a well-consideredapproach to land-use planning, including setting conservation priorities.
In the large intact forest landscapes, an analysis of operable and potentially commercial forest areas is needed.This would involve examining variations in hauling distance, stocking, site productivity, cost, and probability ofregeneration success. Global Forest Watch Canada encourages relevant government agencies with the requiredforest cover data to undertake this type of analysis.
Outside of large intact forest landscapes, candidate areas for conservation management need to be identified.Smaller, remaining areas of low human disturbance should be mapped in this context, building on the workalready done for this study. A crucial part of this effort will be to designate the appropriate threshold tract size.
Monitoring the effect of management strategies outside of large, intact forest landscapes is another importantextension of this work. Remote sensing offers the best potential for this. Aside from the need to monitor futurechanges, mapping past changes would also be useful. This can be done using archived satellite images, andtherefore could be undertaken without delay, providing those images are placed in public domain. More study isalso needed of the impacts of logging and how to mitigate them. Existing indicators of forest sustainabilityshould be used to study forest condition, and such studies should involve industry as well as independentanalysts such as Global Forest Watch Canada. These should be done at relatively fine scales of resolution toensure usefulness in guiding practical land management.
Beyond Canada, mapping the remaining intact forest landscapes in other parts of the world is a high priority,with a critical need to map the best-preserved specimens of nature. This would allow global approaches toimproved forest management to be based on reliable, consistent information. The next step, therefore, shouldbe to identify and map the largest remaining blocks of forest landscapes for each forest ecosystem around theworld.
Chapter 5. Conclusions

50 Canada’s Large Intact Forest Landscapes
Glossary
Aboriginal Treaty Area: an area that comprises constitutionally binding agreements between First Nations andthe Canadian Crown signed between 1850 and 1930 (historic treaties). The two main provisions of mostof these treaties were monetary payment and the setting aside of reserve lands.1
Commercial Forest Tenures or Logging Concessions: statutorily based agreements whereby the Crown has therights to timber and other natural resources and these rights have been transferred to the provincesthrough the Transfer of Natural Resources Act in 1930,2 then the provinces have transferred the rights toharvest timber or manage forest lands to private parties, primarily forest companies, while retaining titleto the land.3 Federal land, such as parks, Indian reserves, military installations, generally do not allowcommercial timber harvesting, although some has occurred, for examples, in Wood Buffalo NationalPark and Primrose Air Weapons Range. The logging rights of a tenure/concession agreement may relateeither to a specified area or to a specified volume of cut within an administrative unit (variously termedforest management unit, forest district, or aire commune). The operational implementation of a tenureagreement or concession usually occurs at the forest administrative unit level. Most of Canada’s largestforest companies log timber from public and private lands with logging on public land generally faroutweighing logging on private land.4
Disturbance: any moderately isolated event in time that disrupts the structure of a population, community orecosystem, and which modifies the availability of the resources in the substrate or in the physicalenvironment.5 In many types of naturally functioning intact forest landscapes, disturbances such asfires, pests and diseases are spontaneous events that shape the landscape.6 Human disturbances, such asthe fragmentation of landscapes and ecosystems by roads and land use, tend to shape the landscapemuch less naturally.
Ecoregion (1): a subdivision of an ecozone, according to the National Ecological Framework for Canadawhich is used throughout Canada. An ecoregion contains large order landforms or assemblages ofregional landforms, small order macro- or mesoclimates, and regional ecological patterns such asvegetation, soils and water, as well as regional human activity patterns and land uses.7 Ecoregions, asdefined in this way, usually occur at a sub-national scale and are different from the ecoregions defined bythe World Wildlife Fund (see below).
Ecoregion (2): an assemblage of natural communities in a geographically distinctive area that not only share alarge majority of their species, dynamics and environmental conditions, but also function effectivelytogether at global and continental scales, according to the World Wildlife Fund.8
Ecozone: the most generalized level in the National Ecological Framework for Canada.9 Ecozones are areas ofthe earth’s surface representative of large and generalized units defined by the interaction of macroscaleclimate, human activity, vegetation, soils, geological and physiographic features.10 There are 15 ecozonesin Canada. Eleven of these are considered to be forest ecozones, as they are presently, or werehistorically, predominantly forested.
51
Endangered Forests: defined within biological, ecological, social and legal categories. The concept wasintroduced by the Wye River Group and has been used by some corporations to make commitments toadopt and implement ecologically responsible forest procurement policies.
Biological and ecological categories include:
• Naturally rare forests — forests that are rare due to natural conditions such as temperate rainforestsand cloud forests;
• Anthropogenically rare forests — forests so heavily affected on a global or ecoregional scale by humansthat they have become rare;
• Intact forests — large, unfragmented blocks of natural forests;• Other ecologically important forests — “the best of the rest”; the remaining old growth patches left in
otherwise degraded and converted forest areas that are not anthropogenically rare at the ecoregionallevel.
Social and legal categories include:
• Forests where there are ongoing human rights violations including violations of the rights ofIndigenous people;
• Forests where illegal forestry and illegal trade occurs.11
Forest Intactness: authentic forest naturalness over a long time and large space.
Forest Landscape: a contiguous mosaic of naturally occurring ecosystems within Canada’s forested Ecozones.A forest landscape may also contain naturally treeless areas (see Intact Forest Landscape).
Fragmentation: the breaking up of a habitat, ecosystem or landscape into smaller, disconnected pieces.12
Although natural disturbances fragment the landscape, human activities are also agents of fragmentation.Agents of fragmentation include roads, cleared lands, changes in land use, urbanization and otherhuman developments.13
Frontier Forests: large, relatively intact forest ecosystems. A frontier forest must meet the following criteria:
• It is primarily forested;• It is large enough to support viable populations of all species associated with that forest type even in
the face of natural disasters of a magnitude to occur once in a century;• Its structure and composition are determined mainly by natural events, and it remains relatively
unmanaged by humans, although limited human disturbance by traditional activities is acceptable;• In forests where patches of trees of different ages occur naturally, the landscape shows this type of
heterogeneity;• It is dominated by indigenous tree species;• It is home to most, if not all, other plants and animals that typically live in this forest.14
Glossary
52 Canada’s Large Intact Forest Landscapes
High Conservation Value Forest (HCVF): a concept introduced by the Forest Stewardship Council (FSC) in1999 as part of Principle 9 of the FSC certification standard; any management of these forests musteither conserve or enhance these values.15 High Conservation Value Forests possess the followingcharacteristics:
• Contain globally, regionally or nationally substantial concentrations of biodiversity values (such asendemism, endangered species, refugia); and/or large landscape level forests, where viablepopulations of most — if not all — naturally occurring species exist in natural patterns of distributionand abundance;
• Exist in, or contain, rare, threatened or endangered ecosystems;• Provide basic ecosystem services in critical situations;• Are either fundamental to meeting basic needs of local communities or critical to local communities’
traditional cultural identity (for example, areas of cultural, ecological, economic or religioussignificance identified in cooperation with such local communities).16
Intact Forest Landscape: a contiguous mosaic of naturally occurring ecosystems in a forest ecozone, essentiallyundisturbed by significant human influence. An intact forest landscape does not necessarily consist ofold-growth trees and may not even be entirely forested. Intact forest landscapes consist of a mosaic ofnatural ecosystems including forest, bog, water, tundra, and rock outcrops. In some cases, such as thebog-dominated landscapes of Canada’s taiga ecozones and mountainous landscapes of western Canada,only 20 to 30 percent of the total area may consist of trees.
An intact forest landscape has the following characteristics:
• Is free from substantial anthropogenic fragmentation (settlements, roads, clearcuts, pipelines, powerlines, mines, etc.);
• Is free from substantial human influence for periods that ensure that it is formed by naturallyoccurring ecological processes (including fires, wind, and pests);
• Contains only naturally seeded indigenous plant species and supports viable populations of mostnative species associated with the ecosystem;
• Is large enough to be resilient to edge effects and to survive most natural disturbance events.
Modern Land Claim Settlements: agreements that have been reached between Aboriginal communities and thegovernment on comprehensive or specific claims since Canada’s Land Claims Policy of 1973. Somelevel of self-government may be part of the agreement, and these modern settlements/treaties usuallyhave stipulations regarding land base ownership, harvesting rights, financial compensation, participationin management decisions, and resource revenue-sharing.17
Protected Areas: a term used in this report to denote any area identified as (a) protected area that meets theWorld Wildlife Fund Canada’s Endangered Spaces criteria (no logging, mining or hydro-electricdevelopment), and which is designated by either the federal, provincial or territorial governments ofCanada. This definition makes no distinction among management regimes in protected areas. Most ofthe protected areas in Canada are established and administered at the provincial/territorial level, and thelegal framework of protected areas varies among jurisdictions.18 Some of these protected areas may besubject to industrial resources extraction, intensive recreation and other forms of anthropogenic uses.19

53
Annex — Review Process
In accordance with Global Forest Watch policy, the methods and results of this project have been reviewed by abroad set of experts and stakeholders, including Canadian and international reviewers with expertise incartography, remote sensing and GIS, forest ecology, forest management, forest industry and wildlifemanagement. The reviewers were drawn from a wide spectrum of organizations, including governments,industry, conservation organizations and Global Forest Watch partners. The project went through two majorreviews: an initial review of the methods over two workshops in 2001 and 2002, and a final review of draftresults in 2003 by invitation.
Initial Review of Methods by Means of Workshops
The two initial workshops were complemented by an initial methodology review and a subsequent onlinereview. The first workshop was held in Vancouver, British Columbia, in May 2001. Its purpose was to defineobjectives, criteria, definitions and general mapping methods. The second workshop was held in Edmonton,Alberta, in October 2001, to assess progress and examine preliminary results from pilot areas. A web-basedreview of the methods took place just before the Edmonton workshop to early 2002.
The major comments received from these earlier workshops are summarized below:
• Road density analysis should be part of the work.
Road (or linear disturbance) density analysis for the non-intact forest landscape area is an importantcomplement to intact forest landscape mapping; however, because of resources constraints, this analysiscould not be completed in this phase.
• Accuracy of ancillary roads and other data may be questionable.
Please see the section on accuracy in the main text of this report.
• Excluding buffered lakes may result in inaccuracies and be an inappropriate methodology.
The main reason for buffering lakes greater than a certain size was the assumed high probability that long-term, historic land use around these navigable lakes would have transformed the forest structure, and insome cases, the species composition. These probable changes were difficult to identify clearly on thesatellite images that were used. Many navigable rivers were buffered in a similar fashion.
• Definition of intact forest landscapes should include degree of intactness or integrity, and allow for differentthreshold sizes.
For reasons of practicality and simplicity, a decision was made to use a consistent 50,000 hectare thresholdfor minimum size for all forest biomes and ecological regions. Further mapping of smaller blocks is apriority for future work.
• Remote sensing interpretation and modelling approaches cannot be effectively validated when they rely oninterpreter expertise.
This is a concern common to all such approaches using remote sensing. In this study, validation includedhundreds of spot field checks in five provinces and one territory, and thousands of aerial photographschecks (at scales ranging from 1:5,000 to 1:60,000). The approach to mapping, which focussed onexcluding clearly visible disturbances, minimized the probability of interpreter error.
Annex — Review Process
54 Canada’s Large Intact Forest Landscapes
• Regrowth may be misclassified as either intact or not intact.
Areas of regrowth were not identified and classified as such, but were classified as either intact or not intactby the known or presumed origin of the succession (fire implied intact, logging implied non-intact). Someinaccuracies are likely to have occurred. Generally, the tendency was to assume fire as the source ofdisturbance unless there were clear indications of logging; this tendency has resulted in a probable bias infavour of intactness.
• Methods need to account for recovery of forests over time.
The method does allow for the recovery of intactness over time, as only disturbed areas that were includedin the initial ancillary datasets, and those that could be identified on satellite images, were excluded as beingintact. It is likely that some areas of old disturbance were included as intact areas since they could not beidentified using existing data, records and satellite imagery.
• It is not possible to accurately identify fire disturbance patterns as a factor in identifying intact areas.
This is correct, although methods used previously in Russian studies make assumptions about anddistinctions between anthropogenic or human-related versus natural cause fires.1 Our analysis for Canadatreated all fires as naturally caused.
• Methodology needs to ensure international consistency that allows consistent communication.
Although international consistency is important, local conditions related to historic land uses and dataquality issues necessitate modifications to the methods. For example, although buffers along lakes andrivers were patterned after the Russia work, they were modified to reflect Canada’s more recent intensiveland uses. A different decision rule concerning fires was also used (see above).
Final Review of Draft Results by Invitation
Following the earlier workshop review of the methods, the draft mapping was completed in 2003 and sent forfinal review in early July. Reviewers were selected to represent scientific expertise as well as the broad spectrumof sectors that have interests in Canada’s forests, including governments, forest companies, First Nations,environmental groups and consultants. Requests to become a reviewer were accommodated. Ninety-six invitedreviewers were sent the review package and were asked to respond within three weeks (an extension of thereview period was granted at the request of several forest companies, and the review period concluded in midAugust). The 96 invited reviewers were selected in order to include all provincial, territorial and federalgovernment forestry agencies and individuals (17), 13 academics, 32 non-government individuals andorganizations, 26 forest companies, organizations and retailers, 3 funding foundations and 5 consultants.Twenty-two specific responses were received, representing 33 of the invited reviewers (government = 9;academics = 3; non-government = 8; forest companies/organizations/retailers = 11; consultants = 2).
The major comments were related to editorial changes, background information, overall structure, clarity andflow of the report. Another set of comments dealt with technical details and presentation of the maps. Below isa summary of the major comments on substance and how they were addressed.
55
Role of Industry
• Role of industry in using tools to guide corporate policies and purchasing decisions is not clear.
Although it is beyond the mandate of Global Forest Watch Canada to recommend, dictate, or predictindustries’ policies regarding intactness, we believe that maps of large intact forest landscapes will help thosecompanies that desire to take intactness into account when making important conservation policy decisions.
Rationale for Project
• Rationale for the project should not be to recommend policy, and should not imply that intactness is the onlyvalue to consider for sustainable forest management.
We removed much of the policy-related language and focused on the original purpose of the project, whichwas to map intactness. This refined focus also provides a more substantive, data-oriented approach that iscompatible with Global Forest Watch’s mandate and mission. The report also clarifies that non intact forestedareas may have high conservation values, but were beyond the scope of this study to identify and map.
Geographic Scope of Project
• Results should include mapping intactness across national boundaries.
This can only be done for Canada once mapping in the USA is completed. A comparative study may bepossible afterwards; however, methodological differences may preclude the ability to make internationalcomparisons.
• Some key areas were missing within the study area (e.g., northwestern British Columbia and southwestern Yukon).
We checked the definitions and data for this area and made minor changes that are consistent with thenorthern forest boundary.
Significance of Intactness and the findings
• Why intactness is important needs to be clearer – reviewers found the concept and definition new and diffuse,and the scientific explanation weak. Some reviewers were concerned that our work implies that the benefitswithin and values of intact areas cannot be found within non-intact areas. (Other reviewers stated that ourdefinition and application of the term “intact” will increase knowledge and awareness of forest intactness.)
A discussion of how the scientific literature defines intactness and an additional explanation of our owndefinition is now included. The value of large, un-fragmented areas is now referenced. Additional statisticsregarding forest and non-forest areas within the intact forest landscapes were added.
• Why are the results significant? We have known for a long time that Canada has a large area of undisturbed forest.
This study is an additional contribution to the efforts of many to map the extent and location ofremaining un-fragmented and intact forest landscapes in Canada. For the first time, satellite imagery isextensively used to provide more detailed maps on forest landscape intactness than have ever before beenproduced for Canada.
Definitions
• More clarity is required about the difference between intact forest landscapes and intact forests. Also, reviewersnoted that perhaps intact forest landscapes were not the most appropriate term in some jurisdictions/regions
Annex — Review Process
56 Canada’s Large Intact Forest Landscapes
owing to the large amount of non-forested areas (e.g., British Columbia), and indicated that we should use theamount of actual forest within intact forest landscapes versus total forest intact forest landscape area as the keystatistic.
We modified our results and the highlighted key findings. We also highlighted and discussed the findings inkey regions, such as coastal and interior B.C. (Pacific Maritime and Montane Cordillera).
Threshold Size
• The selection of one threshold size (of 50,000 hectares) has a weak scientific basis. A series of patch sizes wouldbe more helpful for policy-setting.
The text was changed to reflect the possibility of lower thresholds for the size of intact forest landscapes.Scientific references were added to address the threshold issue.
Technical Issues
• Reviewers wanted more details and clarity on technical procedures.
More detail was added.
• Consistency of methodology between countries is needed so cross-country comparisons can be made. Inparticular, comparisons with Russia are important, as Russia and Canada share boreal/taiga ecosystems.
The two major methodological differences between the Canadian and Russian studies are “fire” and“satellite image resolution.” For Russia, Global Forest Watch applied a decision rule that excludedanthropogenic fires from intact forest landscapes. For Canada, during the earlier methodology reviews,reviewers indicated fires should not be used to remove intact forest landscapes. In general, higher resolutionimages, such as ASTER, were used more extensively in Canada than in Russia. Therefore, methodologicaldifferences considered the availability of satellite images, different perceptions of the role of fire, anddifferent land use histories and land management regimes. Comparative statistics between countries willrequire additional work.
• The amount of forest was perhaps overestimated.
We used a clearly specified dataset in order to be as consistent as possible. We welcome more accurate forestcover data from the relevant jurisdictions as it becomes freely available.
• The value of the verification methods are questionable, especially the use of older aerial photos with the fact thatverification was not statistically based. Field verification needed more than 300 points and more aerialphotography checking would improve the verification. Some reviewers indicate it brings into question accuracyof entire project.
Aerial photographs and field check sites were not used to statistically verify the draft mapping results, butsimply to check and improve the general accuracy of the satellite-based digitizing. Older (some from the1940s) and recent aerial photographs assisted in verifying features within intact and non-intact areas. Thefield checks and aerial photographs in the verification procedures were limited by time and resources. Morewould have improved the accuracy of the results.
• Why are some activities not included (e.g., selective logging)?
We only identified and subsequently removed from the intact category areas with detectable evidence ofdisturbance. (This was clarified in the method description.)
57
• Due to limitations on the methods and data, forest landscape intactness may have been overestimated. Manynoted this raises issues about the value of the project and the results.
It is true the amount of intact forest landscapes is likely over-estimated; we clarified the parameters of ourmapping and the restrictions that influenced it (e.g., resolution of imagery).
• Some datasets, like protected areas and forest cover, are outdated.
Following the final review, we compiled a new national protected areas dataset from the most up-to-datedatasets available for each provincial and territorial jurisdiction. For other datasets, such as forest cover,further analysis can be undertaken once provincial datasets are freely available. Global Forest WatchCanada will be happy to undertake further analysis once these datasets are in hand.
• Over what period must an area have been free from significant human activity before it is considered intact?
This is difficult to estimate because of differences in the degree of disturbance and the restorative capacityof the disturbed site. For example, in boreal regions, aerial photographs from the 1940s confirmed that wecould detect disturbances such as clearcutting from about that period (and likely slightly earlier) usingLandsat imagery. The period for regeneration of highly productive forests, such as those found in coastaland interior British Columbia would be much shorter.
• Clarity is needed on why various buffering was used for different infrastructures; more subjective than objective.
References have been added to support the use of (variable) buffering.
• The decision rules regarding mapping of seismic and other energy developments is weak, especially the use ofLandsats which, at 28.5 metre resolution, is inadequate to detect most recent seismic activity due to recentreductions in width of most seismic lines. This is important to rectify, as seismic and other energy developmentshave significant ecological impacts, especially on sensitive species like woodland caribou.
The Western Canada Sedimentary Basin was re-mapped using higher resolution ASTER imagery plus the8th (panchromatic) Landsat channel and using, as a guide to image interpretation, ancillary data such asthe National Topographic Series maps.
• New areas have been disturbed by clearcutting since the date of the imagery used in this study.
The mapping was re-done where evidence of such disturbance was supplied by reviewers, or newer imagerycould be rapidly obtained for areas that were brought to our attention during the review process. Theboundaries of some intact forest landscapes are undergoing rapid changes in some regions; consequently,our work is only a snapshot in time.
• The report does not recognize changes in forest management, instead all anthropogenic disturbances are treatedequally.
This is correct. This study is the first detailed attempt to map intact forest landscapes in Canada usingsatellite imagery. Further work is needed to discriminate and map areas of anthropogenic impact and areasof conservation priority in the non-intact forest landscape.
• Some areas that are mapped as intact have numerous seismic lines.
The Western Canada Sedimentary Basin was re-mapped using higher resolution ASTER imagery plus the8th (panchromatic) Landsat channel and using, as a guide to image interpretation, ancillary data such asthe National Topographic Series maps. Despite using this higher resolution imagery, some seismic lineswere not detected as they frequently had too narrow a width (frequently one metre wide) to be detected byASTER imagery.
Annex — Review Process
58 Canada’s Large Intact Forest Landscapes
Protected Areas
• There was some confusion about the use of the term “special protection areas”; “officially-recognized protectedareas” should be used, or alternatively, included under this category should be all the policy-restricted areassuch as stream-side buffers, steep slopes, etc. A reviewer suggested we categorize all protected areas according tothe IUCN classification for Protected Management Categories.
A new dataset was compiled since the final review. The protected areas dataset was updated by obtaining alist of protected areas that met WWF Canada’s Endangered Spaces standards; a nation-wide spatial datasetof these sites was then compiled. In a few cases (e.g., New Brunswick, Manitoba), consultations with localexperts resulted in corrections and improvements). Categorizing all protected areas in Canada according tothe international IUCN system would be a useful exercise but was beyond the scope of this study. Instead,we used the Canada-recognized national Endangered Spaces standards developed by World Wildlife FundCanada.
Future Research/Work
• The impacts of logging and how to mitigate them should be studied. As part of the suggestion to explore/mapconservation values, understanding more about forest condition is a critical part of resource planning and settingconservation priorities. Species composition, seral stage distribution, site productivity, and habitat suitability forregionally significant species are important elements to understanding the conservation importance of un-fragmented forest landscapes. Global Forest Watch Canada should use already-established indicators of forestsustainability and work with industry in measuring these.
These suggestions were added to the section on Future Research.
Language
• The report is not neutral enough; too much descriptive and biased language and too speculative (e.g., aboutlogging within tenures).
We significantly reduced the non-essential, descriptive components of the report. The result is a muchthinner report that focuses on the original intent of the project—to map intact forest landscapes.
• The distinction of Aboriginal settlements in the buffered layers could appear racist.
Aboriginal populated places are distinguished in the buffered dataset because this is a separate data set, withattached attribute files containing population levels, obtained from Statistics Canada. As many otherpopulated places did not have attached population levels, and as Aboriginal populated places tend to havesmall populations, we decided to distinguish using the more accurate Aboriginal dataset.
Review
• There was a lack of forest industry involvement.
The opportunities for forest industry involvement are now included at the beginning of this Annex.
• The choice of stakeholder reviewers and how they were/are approached needs to be clarified.
Details on the choosing of stakeholders are now included in the beginning of this Annex.
59
Footnotes
Chapter 1. Introduction
1 Bryant, D., D. Nielsen, and L. Tangley. 1997. The Last Frontier Forests: Ecosystems and Economies on the Edge.World Resources Institute, Washington, D.C. 42 pp. Available for purchase at:http://forests.wri.org//pubs_description.cfm?PubID=2619 (04/08/03).
2 Ball, J.B. 2001. Global Forest Resources; History and Dynamics. The Forests Handbook. Oxford, Blackwell Science.Vol. 1: ISBN 0-632-04821-2; Vol. 2: ISBN 0-632-04823-9.
3 Food and Agriculture Organization. 2001. Global Forest Resources Assessment 2000. FAO Forestry Paper 140.479 pp. Available at: http://www.fao.org/forestry/fo/fra/main/index.jsp (11/08/03); UNEP. 2001. An Assessment ofthe Status of the World’s Remaining Closed Forests. UNEP/DEWA/TR 01-2. 57 pp.Available at: http://grid2.cr.usgs.gov/publications/closedforest.pdf (12/08/03).
4 Bryant, D., D. Nielsen, and L. Tangley. 1997. The Last Frontier Forests: Ecosystems and Economies on the Edge.World Resources Institute, Washington, D.C. 42 pp. Available for purchase at:http://forests.wri.org//pubs_description.cfm?PubID=2619 (04/08/03).
5 Natural Resources Canada. 2003. Canada National Forest Inventory. Quick Facts. Available at:http://www.pfc.forestry.ca/monitoring/inventory/facts/facts_e.html (12/08/03).
6 Environment Canada. 1997. Sustaining Canada’s Forests: Forest Biodiversity (SOE Bulletin 97-1). EnvironmentCanada, Ottawa. Available at:http://www.ec.gc.ca/soer-ree/English/Indicators/Issues/For_Bio/Bulletin/fb_iss_e.cfm (12/08/03).
7 Bryant, D., D. Nielsen, and L. Tangley. 1997. The Last Frontier Forests: Ecosystems and Economies on the Edge.World Resources Institute, Washington, D.C. 42 pp.Available for purchase at: http://forests.wri.org//pubs_description.cfm?PubID=2619 (04/08/03).
8 Natural Resources Canada. 2002. The State of Canada’s Forests, 2001-2002 (Overview).Available at: http://www.nrcan-rncan.gc.ca/cfs-scf/national/what-quoi/sof/sof02/overview_e.html (11/08/03).
9 Corporate Research Associates Inc. 1997. Tracking Survey of Canadian Attitudes Toward Natural Resources Issues.Canada: Natural Resources Canada. 91 pp. Available at: http://www.nrcan.gc.ca/inter/pdf/survey_e.pdf (12/08/03).
10 Natural Resources Canada. 2002. The State of Canada’s Forests, 2001-2002 (Overview). Available at:http://www.nrcan-rncan.gc.ca/cfs-scf/national/what-quoi/sof/sof02/overview_e.html (11/08/03); Stelfox, J.B. 1995.Relationships between Stand Age, Stand Structure, and Biodiversity in Aspen Mixedwood Forests in Alberta. AlbertaEnvironmental Centre, Vegreville, Alberta. 326 pp. Available at: http://www.borealcentre.ca/reports/stelfox/aspen_pdf.html (12/08/03); Hanski, I., and P. Hammond. 1995. Biodiversity in boreal forests. Trends in Ecology andEvolution 10(1): 5-6; Godfrey, W.E. 1986. The Birds of Canada (rev. ed.). National Museum of Natural Sciences /National Museum of Canada, Ottawa. 595 pp.; Finnamore, A.T. 1994. Hymenoptera of the Wagner Natural Area, aboreal spring fen in central Alberta. Memoirs of the Entomological Society of Canada 169: 181-200; EnvironmentCanada. 1997. Sustaining Canada’s Forests: Forest Biodiversity (SOE Bulletin 97-1). Environment Canada, Ottawa.Available at: http://www.ec.gc.ca/soer-ree/English/Indicators/Issues/For_Bio/Bulletin/fb_iss_e.cfm (12/08/03).
11 Canada Forest Network. 2003. The Importance of Canada’s Forests—Social. Available at:http://www.forest.ca/details.php3 (12/08/03); Gray, P.A., E. DuWors, M. Villeneuve, S. Boyd, and D. Legg. 2003.The Socioeconomic Significance of Nature-Based Recreation in Canada. Environmental Monitoring and Assessment86: 129-147.
12 Daily, G.C. (ed.). 1997. Nature’s Services. Societal Dependence on Natural Ecosystems. Island Press, Washington,D.C. 392 pp.; Bonan, G.B., F.S. Chapin III, and S.L. Thompson. 1995. Boreal forest and tundra ecosystems ascomponents of the climate system. Climatic Change 29: 145-167.
13 Natural Resources Canada. 2000. The State of Canada’s Forests, 1999-2000 (Overview).Available at: http://www.nrcan-rncan.gc.ca/cfs-scf/national/what-quoi/sof/sof00/overview_e.html (12/08/03).
Foototes
60 Canada’s Large Intact Forest Landscapes
14 Smith, Wynet and Peter Lee, eds. Canada’s Forests at a Crossroads: An Assessment in the Year 2000. World ResourcesInstitute and Global Forest Watch Canada. 114 pp. Available at: http://www.globalforestwatch.org/common/canada/report.pdf (12/08/03); National Forest Strategy Coalition. 2003. National Forest Strategy (2003-2008) — SustainableForests: A Canadian Commitment. Natural Resources Canada. Available at: http://nfsc.forest.ca/newstrategy.html(5/7/03).
15 Baker, Ken (Chief Forester, Ministry of Forests, British Columbia Government). 2003. Letter of communication toGlobal Forest Watch Canada, July 28, 2003. For examples: Ministry of Forests. 1994. 1994 Forest, Range andRecreation Resource Analysis. Crown Publications Inc., Victoria. Available at: http://www.for.gov.bc.ca/hfd/library/frra/1994/ (12/08/03); Ministry of Forests. 2003. Biogeoclimatic Zoners of British Columbia (map). Available at:ftp://ftp.for.gov.bc.ca/hre/external/!publish/becmaps/ (12/08/03); Nuszdorfer, Fred. . 2000. Old and Large Douglas-fir and Western Red Cedar in the Squamish Forest District. British Columbia Ministry of Forests, Canada. Availableat: http://www.for.gov.bc.ca/rco/research/elaho/OldFdCwfinal.pdf (12/08/03).
16 Davidson, R.J., P.A. Gray, S. Boyd, and G.S. Cordiner. 2000. State-of-the-Wilderness Reporting in Ontario:Models, Tools, and Techniques. USDA Forest Service Proceedings RMRS-P-15-Vol-2: 111-119.Available at: http://www.wilderness.net/pubs/science1999/Volume2/Davidson_2-14.pdf (12/08/03).
17 Canadian Forest Service, 1991. Access – Map of Canada. Canada’s National Forest Inventory.Available at: http://www.pfc.cfs.nrcan.gc.ca/monitoring/inventory/maps/map9_e.html (12/08/03).
18 Smith, Wynet and Peter Lee, eds. Canada’s Forests at a Crossroads: An Assessment in the Year 2000. World ResourcesInstitute and Global Forest Watch Canada. 114 pp. Available at:http://www.globalforestwatch.org/common/canada/report.pdf (12/08/03).
19 Nogueron, Ruth. 2002. Low-access forests and their level of protection in North America. World Resources Institute,Washington D.C. Available at: http://www.globalforestwatch.org/english/us/na_low_acess_forests.pdf (12/08/03);Bryant, D., D. Nielsen, and L. Tangley. 1997. The Last Frontier Forests: Ecosystems and Economies on the Edge.World Resources Institute, Washington, D.C. 42 pp. Available for purchase at:http://forests.wri.org//pubs_description.cfm?PubID=2619 (04/08/03).
20 Global Forest Watch recognizes the forest landscape contains many features of potential conservation priority.One certification system (the Forest Stewardship Council, Principle 9, on high conservation value forests)lists them as follows:(a) forest areas containing globally, regionally or nationally significant concentrations of biodiversity values (e.g.,
endemism, endangered species, refugia), and/or large landscape level forests contained within, or containing themanagement unit, where viable populations of most if not all naturally occurring species exist in natural patternsof distribution and abundance;
(b) forest areas that are in or contain rare, threatened or endangered ecosystems;(c) forest areas that provide basic services of nature in critical situations (e.g., watershed protection, erosion control);(d) forest areas fundamental to meeting basic needs of local communities (e.g., subsistence, health) and/or critical to
local communities’ traditional cultural identity (areas of cultural, ecological, economic or religious significanceidentified in cooperation with such local communities).
Ideally, all areas of potential conservation priority should be mapped in such detail that they can be taken into accountin the planning, conduct and monitoring of forest management. To do this would be a huge undertaking, madedifficult not only by the difficulty of mobilizing the necessary resources but also by the lack of a generally agreed andoperational set of definitions (although World Wildlife Fund and ProForest are in the process of developing HighConservation Value toolkits internationally and Forest Stewardship Council Canada is developing a national HighConservation Value Forest toolkit that will likely be finalized with the national boreal standard). Global Forest Watchhas therefore chosen to initially focus on forest intactness, defined (by Global Forest Watch) as intact forestlandscapes, as an aspect of forest condition of high relevance to forest management.
21 A number of reports, in addition to those listed below, are available at: http://www.globalforestwatch.org/english/about/publications.htm (12/08/03). Examples include: Neira, E., H. Verscheure and C. Revenga. 2002. Chile’sFrontier Forests: Conserving a Global Treasure. Global Forest Watch Chile and World Resources Institute. 57 pp.;Minnemeyer, S. 2002. An Analysis of Access to Central Africa’s Rainforests. World Resources Institute, Washington,D.C. 26 pp.
22 Yaroshenko, A., P. Potapov, S. Turubanova. 2001. Last Intact Forest Landscapes of Northern European Russia.Global Forest Watch. Available at: http://www.globalforestwatch.org/english/russia/maps.htm (12/08/03); Aksenov,D.E., D. Dobrynin, M. Dubinin, A. Egorov, A. Isaev, M. Karpachevskiy, L. Laestadius, P. Potapov, A. Purekhovskiy,S. Turubanova, and A. Yaroshenko. 2002. Atlas of Russia’s Intact Forest Landscapes. Global Forest Watch. Availableat: http://www.globalforestwatch.org/english/russia/maps.htm (12/08/03).
61
23 Global Forest Watch. 2002. New Mapping Initiative Launched at World Summit (news release, map). Draft version ofthe map is available online at: http://www.globalforestwatch.org/english/pan-boreal.htm (08/12/03).
24 Anderson, J. E. 1991. A conceptual framework for evaluating and quantifying naturalness. Conservation Biology 5(3):347-352.
25 O’Neill, R.V., D.L. DeAngelis, J.B. Waide, and T.F.H. Allen. 1986. A Hierarchical Concept of Ecosystems. PrincetonUniversity Press, Princeton, N.J. 254 pp.; Holling, C.S. 1992. Cross-scale morphology, geometry, and dynamics ofecosystems. Ecological Monographs 62: 447-502.
26 Gomez-Pompa, A., and Andrea Kaus. 1992. Taming the wilderness myth. BioScience April 1992: 271-279.
27 For example, see Anderson, J. E. 1991. A conceptual framework for evaluating and quantifying naturalness.Conservation Biology 5(3): 347-352; Angermeier, P.L. 2000. The natural imperative for biological conservation.Conservation Biology 14(2): 373-381.
28 Noss, Reed F., Rodger Schlickeisen, Allen Y. Cooperrider. 1994. Saving Nature’s Legacy: Protecting and RestoringBiodiversity. Island Press, Washington D.C. 380 pp.
29 Bryant, D., D. Nielsen, and L. Tangley. 1997. The Last Frontier Forests: Ecosystems and Economies on the Edge.World Resources Institute, Washington, D.C. 42 pp. Available for purchase at:http://forests.wri.org//pubs_description.cfm?PubID=2619 (04/08/03).
30 “… although widely believed to be possible, an effective approach for maintaining biological diversity within amanaged forest has never been demonstrated.” Scientific Panel for Sustainable Forest Practices in Clayoquot Sound.1995. Sustainable Ecosystem Management in Clayoquot Sound, at p. 201.
31 IKEA. 2003. Social and Environmental Responsibility. Available at:http://www.ikea.ca/ms/en_CA/about_ikea/social_environmental/environment.html (12/08/03).
32 Sierra Club, Rainforest Action Group of Edmonton. Retailer Commitments.Available at: http://www.sierraclub.ca/prairie/PastCampaigns/Rage/retailer.htm (11/08/03); National ForestProtection Alliance. 2002. Office Supply Superstore Staples Inc. Agrees to Historic Endangered Forest and RecyclingPolicy (news release). Available at: http://www.forestadvocate.org/news/staples_11_14_02.html (12/08/03).
33 Forest Stewardship Council. 2000. FSC Principles and Criteria. Document 1.2: High Conservation Value Forests.Available at: http://www.fscoax.org/html/1-2.html . (12/08/03).
34 ArborVitae Environmental Services Ltd. March 18, 2003. World Wildlife Fund Nature Audit — Forestry Footprint;Overview of Assessment Results. World Wildlife Fund. 87 pp.
Chapter 2. Intact Forest Landscapes: Study Area, Definitions and Criteria
1 Statistics Canada/Natural Resources Canada. 2003. Canadian Statistics: Land and Freshwater Area. Available at:http://www.statcan.ca/english/Pgdb/phys01.htm (12/08/03); Analysis and calculations in other sections of this reportrely on somewhat different figures for total area of Canada (see Chapter 4).
2 Bunnell, Fred L. 1995. Forest-Dwelling Vertebrate Faunas and Natural Fire Regimes in British Columbia:Patterns and Implications for Conservation. Conservation Biology 9(3): 636-644; Ricketts, T.H., E. Dinerstein,D.M. Olson, C.J. Loucks, W. Eichbaum, D. DellaSala, K. Kavanagh, P. Hedao, P.T. Hurley, K.M. Carney,R. Abell, and S. Walters. 1999. Terrestrial Ecoregions of North America: A Conservation Assessment. Island Press,Washington, D.C. 485 pp.
3 Evidence shows more detrimental impact of edges between forest and non-forest areas resulting from agriculturaldisturbance than forest and natural non-forest areas. (Bayne, E.M. and K.A. Hobson. 1997. Comparing the effects oflandscape fragmentation by forestry and agriculture on predation of artificial nests. Conservation Biology 11[6]:1418-1419.)
4 MacArthur, R.H. and E.O. Wilson. 1963. An equilibrium theory of insular zoogeography. Evolution. 17: 373-387;MacArthur, R.H. and E.O. Wilson. 1967. The Theory of Island Biogeography. Princeton University Press, Princeton,NJ. 203 pp.
Foototes
62 Canada’s Large Intact Forest Landscapes
5 Diamond, J.M. 1975. The island dilemma: Lessons of modern biogeographic studies for the design of naturalpreserves. Biological Conservation 7: 129-146; Wilson, E.O. and E.O. Willis. 1975. Applied biogeography. pp. 522-534in: Cody, M.L. and J.M. Diamond. Ecology and Evolution of Communities. Belknap Press of Harvard UniversityPress, Cambridge, MA; Diamond, J.M. and R.M. May. 1976. Island biogeography and the design of nature reserves.pp. 163-186 in: R.M. May, ed. Theoretical Ecology: Principles and Applications. W.B. Saunders, Philadelphia.
6 Gascon, C., T. Lovejoy, R.O. Bierregaard, J.R. Malcolm, P.C. Stouffer, H.L. Vasconcelos, W.F. Laurance,B. Zimmerman, M. Tocher, and S. Borges. 1999. Matrix habitats and species richness in tropical forest remnants.Biological Conservation 91: 223-229.
7 Lindenmayer, D.B. and J. F. Franklin. 2002. Conserving Forest Diversity: A Comprehensive Multiscaled Approach.Island Press, Washington, DC. 352 pp.
8 Shugart, H.H. and D.C. West, D.C. 1981. Long term dynamics of forest ecosystems. American Scientist 69: 647-652.
9 Calculated by dividing Total Area Burned (hectares) of 1,656,729 by Total Fire Count of 6,676 = 248.2 hectares/fireand multiplying the result by 50 (Minimum Dynamic Area). (Study area and compilation of fire data is from: Stelfox,J. Brad (Forem Consulting), and Bob Weynes (Diashawa-Mirubeni International Ltd.). 1999. A Physical, Biological,and Land-Use Synopsis of the Boreal Forest’s Natural Regions of Northwest Alberta. Peace River, Alberta.).
10 Anderson, M.G. 1999. Viability and spatial assessment of ecological communities in the Northern AppalachianEcoregion. Ph.D. Dissertation, University of New Hampshire, Durham.
11 Shugart, H.H., R. Leemans, and G.B. Bonan, eds. 1992. A Systems Analysis of the Global Boreal And Forest-TundraRegions. Cambridge University Press, Cambridge, U.K. 565 pp.; Kasischke, E.S. 2000. Boreal Ecosystems in theGlobal Carbon Cycle. pp. 19-30 in:Kasischke, E.S. and B.J. Stocks, eds. Fire, Climate Change, and Carbon Cyclingin the Boreal Forest. Springer, New York. 461 pp.; Alexander, M.E., B. Janz, and D. Quintillio. 1983. Analysis ofExtreme Wildfire Behavior in East-Central Alberta: A Case Study. pp. 38-46 in: Proc. Seventh Conference on Fireand Forest Meteorology, April 25-29, 1983, Ft. Collins, Colorado. American Meteorological Society, Boston,Massachusetts. 173 pp.; Murphy, P.J., and C. Tymstra. 1986. The 1950 Chinchaga River Fire in the Peace RiverRegion of British Columbia/Alberta: Preliminary Results of Simulating Forward Speed and Distances. pp. 20-30 in:M.E. Alexander, ed. Proc. Third Western Region Fire Weather Committee Scientific and Technical Seminar, Feb. 4,1986, Edmonton, Alberta. Northern Forestry Center, Edmonton, Alberta.
12 Cumming, S., F. Schmiegelow, and P. Burton. 2000. Gap Dynamics in Boreal Aspen Stands: Is the Forest Older ThanWe Think? Ecol. Applic. 10: 744-759.
13 McCarthy, John. 2001. Gap dynamics of forest trees: A review with particular attention to boreal forests. Environ.Rev. 9: 1-59.
14 Fuller, T., and L. Keith. 1980. Summer ranges, cover-type use, and denning of black bears near Fort McMurray,Alberta. Can. Field Nat. 94:80-83.
15 Olson, D.M., E. Dinerstein, E.D. Wikramanayake, N.D. Burgeess, G.V.N. Powell, E.C. Underwood, J.A. D’Amico,I. Itoua, H.E. Strand, J.C. Morrison, C.J. Loucks, T.F. Allnutt, T.H. Ricketts, Y. Kura, J.F. Lamoreux, W.W.Wettengel, P. Hedao, K.R. Kassem. 2001. Terrestrial ecoregions of the world: A new map of life on Earth. BioScience51(11): 933-938.
16 For a discussion of this issue, see: Bascompte, J. and R.V. Sole. 1996. Habitat Fragmentation and ExtinctionThresholds in Spatially Explicit Models. J. of Animal Ecol. 65: 465-473; Franklin, J.F. and R.T.T. Forman. 1987.Creating Landscape Patterns by Forest Cutting: Ecological Consequences and Principles. Landscape Ecol. 1(1): 5-18;Andren, H. 1994. Effects of Habitat Fragmentation on Birds and Mammals in Landscapes with Different Proportionsof Suitable Habitat: a Review. Oikos 71: 355-366; Fahrig, L. 1997. Relative Effects of Habitat Loss and Fragmentationon Population Extinction. J. of Wildlife Mgmt. 61(3): 603-610; Fahrig, L. 2001. How Much Habitat Is Enough?Biological Conservation 100: 65-74.
17 Reijnen, R. and R. Foppen. 1994. The effects of car traffic on breeding bird populations in woodland. I. Evidence ofreduced habitat quality for willow warblers (Phylloscopus trochilus) breeding close to a highway. J. of Applied Ecology31: 85-94; Forman, R.T.T. 2000. Estimate of the area affected ecologically by the road system in the United States.Conservation Biology 14: 31-35; Forman, R.T.T. and L.E. Alexander. 1998. Roads and their major ecological effects.Annual Review of Ecology and Systematics 29: 207-231; Forman, R.T.T., and R.D. Deblinger. 2000. The ecologicalroad-effect zone of a Massachusetts (USA) suburban highway. Conservation Biology 14: 36-46; Forman, R.T.T. andA.M. Hersperger. 1996. Road ecology and road density in different landscapes, with international planning andmitigation measures. pp. 1-2 in: Evink, G.L., P. Garrett, D. Zeigler, and J. Berry, eds. Trends in Addressing
63
Transportation Related Wildlife Mortality. Florida Department of Transportation Report FL-ER-58-96. Tallahassee,Florida, USA; Kruess, A., and T. Tscharntke. 1994. Habitat fragmentation, species loss, and biological control.Science 264: 1581-1584; Trombulak, S.C., and C.A. Frissell. 2000. Review of ecological effects of roads on terrestrialand aquatic communities. Conservation Biology 14: 18-30.
18 Gomez-Pompa, A., and Andrea Kaus. 1992. Taming the Wilderness Myth. BioScience April 1992: 271-279.
19 Sanderson E.W., M. Jaiteh, M.A. Levy, K.H. Redford, A.V. Wannebo, and G. Woolmer. 2002. The Human Footprintand the Last of the Wild. BioScience 52(10): 891-904. Available at:http://wcs.org/media/general/human_footprint2.pdf (13/08/03).
20 Waters, Thomas F. 1987. The Superior North Shore: A Natural History of Lake Superior’s Northern Lands andWaters (Chapter 6). University of Minnesota Press, Minneapolis. 361 pp.
21 Lewis, Henry T. 1977. Maskuta: The Ecology of Indian Fires in Northern Alberta. The Western Canadian J. ofAnthropology. 7(1): 15-52; Lewis, Henry T. 1982. A Time for Burning. Publication No. 17. Boreal Institute forNorthern Studies. The University of Alberta, Edmonton. 23 pp.
22 Munro, John A. 2001. Pitprops and Pulpwood: A History of Export Wood Operations in Newfoundland and Labrador1898-1992. Governments of Newfoundland and Labrador, Department of Forest Resources and Agrifoods. 77 pp.;Waters, Thomas F. 1987. The Superior North Shore: A Natural History of Lake Superior’s Northern Lands andWaters (Chapter 7). University of Minnesota Press, Minneapolis. 361 pp.; Boultbee, Jean. 1981. Pic, Pulp and People.Rev. ed. by Jesse Embree. Marathon, Ontario: Township of Marathon. (Original edition published 1967 by theMarathon Area Centennial Committee.)
23 Schneider, R. 2002. Alternative Futures: Alberta’s Boreal Forest at the Crossroads. Alberta Centre for BorealResearch, Edmonton. 152 pp.
24 Canadian Council of Forest Ministers. 2003. National Forestry Database Program. Table 6.1 — Silvicultural Statisticsby Province/Territory 1975-2001. Available at: http://nfdp.ccfm.org/frames2_e.htm (08/13/03).
25 CAPP (Canadian Association of Petroleum Producers). 2000. Statistical Handbook for Canada’s UpstreamPetroleum Industry. Canadian Association of Petroleum Producers, Calgary, Alberta.
26 Meades, W.J. 1983. The Origins and Successional Status of Anthropogenic Dwarf Shrub Heath in Newfoundland.Advances in Space Research 2(8): 97-101.
27 One study, using Government of Alberta (Alberta Forest Service) fire records, calculated that lightning accounted for57% of the number of fires and 95% of the total area burned in a 134,707 square kilometre area in northwesternAlberta, between 1961 and 1995. (Stelfox, J. Brad (Forem Consulting), and Bob Weynes (Diashawa-MirubeniInternational Ltd.). 1999. A Physical, Biological, and Land-Use Synopsis of the Boreal Forest’s Natural Regions ofNorthwest Alberta. Peace River, Alberta.); Also see Alberta Government. 2003 Human and lightning-caused wildfires.Available at: http://envweb.env.gov.ab.ca/env/forests/fpd/tya.html; And British Columbia Government. 2003.Available at: http://www.for.gov.bc.ca/pScripts/Protect/WildfireNews/index.asp?Page=Statistics (09/02/03).
28 Bessie, W.C., and E.A. Johnson. 1995. The Relative Importance of Fuels and Weather on Fire Behavior in SubalpineForests. Ecology 76: 747-762; Van Wagner, C.E. 1988. The Historical Pattern of Annual Burned Area in Canada.The Forestry Chronicle 64: 182-185.
29 Shugart, H.H., R. Leemans, and G.B. Bonan, eds. 1992. A Systems Analysis of the Global Boreal And Forest-TundraRegions. Cambridge University Press, Cambridge, U.K. 565 pp.; Kasischke, E.S. 2000. Boreal Ecosystems in theGlobal Carbon Cycle. pp. 19-30 in: Fire, Climate Change, and Carbon Cycling in the Boreal Forest. E.S. Kasischke,and B.J. Stocks, eds. Springer, New York. 461 pp.; Alexander, M.E., B. Janz, and D. Quintillio. 1983. Analysis ofExtreme Wildfire Behavior in East-Central Alberta: A Case Study. pp. 38-46 in: Proc. Seventh Conference on Fireand Forest Meteorology, April 25-29, 1983, Ft. Collins, Colorado. American Meteorological Society, Boston,Massachusetts. 173 pp.; Murphy, P.J., and C. Tymstra. 1986. The 1950 Chinchaga River Fire in the Peace RiverRegion of British Columbia/Alberta: Preliminary Results of Simulating Forward Speed and Distances. pp. 20-30 in:M.E. Alexander, ed. Proc. Third Western Region Fire Weather Committee Scientific and Technical Seminar, Feb. 4,1986, Edmonton, Alberta. Northern Forestry Center, Edmonton, Alberta.
30 Yaroshenko, A., P. Potapov, S. Turubanova. 2001. Last Intact Forest Landscapes of Northern Europeon Russia.Global Forest Watch. Available at: http://www.globalforestwatch.org/english/russia/maps.htm (12/08/03); Aksenov,D.E., D. Dobrynin, M. Dubinin, A. Egorov, A. Isaev, M. Karpachevskiy, L. Laestadius, P. Potapov, A. Purekhovskiy,S. Turubanova, and A. Yaroshenko. 2002. Atlas of Russia’s Intact Forest Landscapes. Global Forest Watch. Availableat: http://www.globalforestwatch.org/english/russia/maps.htm (12/08/03).
Foototes

64 Canada’s Large Intact Forest Landscapes
31 Hall, J.P., and B.H. Moody. 1994. Forest Depletion Caused by Insects and Diseases in Canada. 1982-1987.Information Report ST-X-8. Canadian Wildlife Service, Ottawa. 14 pp.; Wein, R.W., and D.A. MacLean, eds. 1983.The Role of Fire in Northern Circumpolar Ecosystems. Wiley, New York. 322 pp.
32 McCarthy. 2001. Gap Dynamics of Forest Trees: A Review with Particular Attention to Boreal Forests. Environ.Rev. 9: 1-59; Cumming, S., F. Schmiegelow, and P. Burton. 2000. Gap Dynamics in Boreal Aspen Stands: Is theForest Older Than We Think? Ecol. Applic. 10: 744-759; Bergeron, Y., R. Bradshaw, O. Engelmark, G. Frisque,B. Harvey, H. Morin, and L. Sirois. 1996. Forward in: Bergeron, Y. and G. Frisque, eds. Second InternationalWorkshop on Disturbance Dynamics in Boreal Forest. Royun-Noranda, Québec, Canada, 26-30 August 1996.Universite du Québec, Québec.
Chapter 3. Methods
1 Yaroshenko, A., P. Potapov, S. Turubanova. 2001. Last Intact Forest Landscapes of Northern Europeon Russia.Global Forest Watch. Available at: http://www.globalforestwatch.org/english/russia/maps.htm (12/08/03);Aksenov, D.E., D. Dobrynin, M. Dubinin, A. Egorov, A. Isaev, M. Karpachevskiy, L. Laestadius, P. Potapov,A. Purekhovskiy, S. Turubanova, and A. Yaroshenko. 2002. Atlas of Russia’s Intact Forest Landscapes.Global Forest Watch. Available at: http://www.globalforestwatch.org/english/russia/maps.htm (12/08/03).
2 Projection parameters used in this study are: Projection: Lambert Conformal Conic; Spheroid: Clark 1866; CentralMeridian: -95; Reference Latitude: 49; Standard Parallel 1: 77; Standard Parallel 2: 49; False Easting: 0;False Northing: 0.
3 Manifold Systems Release 5.50. 2003. Available online at: http://exchange.manifold.net/manifold/manuals/5_userman/mfd50Lambert_Conformal_Conic.htm (6/27/03)
4 Images were obtained through the United States National Aeronautics and Space Administration, the Global LandCover Facility at the University of Maryland, and Natural Resources Canada. Landsat 7 ETM+ data from the GlobalLand Cover Facility was acquired from the USGS EROS Data Center.
5 Donated by the EROS Data Center of the United States Geological Survey (USGS) within the Earth ObservationSystem Program of the United States National Aeronautics and Space Agency. Available at:http://asterweb.jpl.nasa.gov/ (6/24/03).
6 Obtained through the United States National Aeronautics and Space Administration, the Global Land Cover Facilityat the University of Maryland and Natural Resources Canada.
7 These images were obtained under the NASA Commercial Data Buy program.
8 Geogratis. 2003. Natural Resources Canada. Available at: http://geogratis.cgdi.gc.ca/clf/en (13/08/03)
9 Geogratis. 2003. Natural Resources Canada. Available at: http://geogratis.cgdi.gc.ca/clf/en (13/08/03)
10 Natural Resources Canada, Centre for Topographic Information. compiled 1972-1992. VMap.Available at: http://www.cits.rncan.gc.ca/cit/servlet/CIT/site_id=01&page_id=1-005-002.html#vmap (6/25/03)
11 DMTI. 2000. The dataset is available for purchase at http://www.dmtispatial.com/ (5/7/03)
12 Province of British Columbia. 2002. Terrain Resources Information Management.(Available for purchase at http://www.landdata.gov.bc.ca/) (5/7/03)
13 Geomatics Canada, URN for Canada (available for purchase athttp://www.cits.rncan.gc.ca/cit/servlet/CIT/site_id=01&page_id=1-005-002-008.html) (6/24/03)
14 Cihlar, J., J. Beaubien, R. Latifovic, and G. Simard. 1999. Land cover of Canada Version 1.1. Special Publication,NBIOME Project. Produced by the Canada Centre for Remote Sensing and the Canadian Forest Service, NaturalResources Canada. Available on CD ROM from the Canada Centre for Remote Sensing, Ottawa, Ontario. Theassociated data sets are from the 1:7.5 million scale National Atlas digital base map data for Canada. The data wereproduced by the GeoAccess Division, Canada Centre for Remote Sensing, Natural Resources Canada.
15 Natural Resources Canada is currently working on a new forest cover map using Landsat 7 ETM+ imagery.
16 Agriculture and Agri-Food Canada. 2003. Available at: http://sis.agr.gc.ca/cansis/nsdb/ecostrat/gis_data.html (6/25/03)
65
17 DellaSalla, D.A., N.L. Staus, J.R.Strittholt, A. Hackman, and A. Iacobelli. 2001. An Updated Protected AreasDatabase for the United States and Canada. Natural Areas Journal 21. 124-35.Available at: http://www.consbio.org/cbi/pubs/cdroms.htm)(5/7/03)
18 A list of protected areas that meets the Endangered Spaces criteria established by World Wildlife Fund Canada wasobtained from World Wildlife Fund Canada (A. Morgan and T. Iocabelli, pers. comm.).
19 Smith, Wynet and Peter Lee, eds. Canada’s Forests at a Crossroads: An Assessment in the Year 2000. World ResourcesInstitute and Global Forest Watch Canada. 114 pp. Available at: http://www.globalforestwatch.org/common/canada/report.pdf (5/7/03). A version of the dataset is available for download at http://www.globalforestwatch.org/english/datawarehouse/index.asp#Canada (6/25/03)
20 Statistics Canada. 1999. Dimension Series: Portrait of Aboriginal Population (Census 96). Cat.No. 94F0011XCB1996000. Statistics Canada.
21 For a review of general fragmentation literature, see: UNEP. 2001. C. Nellemann, L. Kullerud, I. Vistnes,B.C. Forbes, E. Husby, G.P. Kofinas, B.P. Kaltenborn, J. Rouaud, M. Magomedova, R. Bobiwash, C. Lambrechts,P. J. Schei, S. Tveitdal, O. Gron and T. S. Larsen. GLOBIO: Global methodology for mapping human impacts on thebiosphere. NEP/DEWA/TR.01-3; Andrews, A. 1990. Fragmentation of habitat by roads and utility corridors:A review. Australian Zoologist 26: 130-141; Forman, R. T.T. and L.E. Alexander. 1998. Roads and their majorecological effects. Annual Review of Ecology and Systematics 29: 207-231; Trombulak, S.C., and C.A. Frissell. 2000.Review of ecological effects of roads on terrestrial and aquatic communities. Conservation Biology 14: 18-30.
22 Davidson, R.J., P.A. Gray, S. Boyd, and G.S. Cordiner. 2000. State-of-the-wilderness reporting in Ontario: Models,tools, and techniques. USDA Forest Service Proceedings RMRS-P-15-Vol-2: 111-119.
23 Forested banks of big rivers and their tributaries, as well as shores of big lakes remained the easiest accessible and moreattractive source of timber for lumbering until the mid 20th century. In Eastern Canada (Ottawa Valley, St. LawrenceRiver, Georgian Bay), logging dates back to the early 19th century. In Newfoundland, logging started much earlier. Inmid 19th century the Great Lakes Region became the major exporter to the United States. Big rivers and lakes in thisregion were intensively used for timber drives since 19th to mid-20 century. Logging on the West Coast and in CentralCanada, including northwestern Ontario, started in the late 18th century. In the early 20th century, sawmills wereestablished on all major rivers and lakes used for timber drives. Only in the 1950s did mechanization of loggingoperations decrease the use of rivers. However, some of them are still used today for timber drives. A special case is theGold Rush, which started in the late 19th century and transformed many areas in the Yukon. For purposes ofbuffering, we treated the water bodies that were used historically for log drives in the same ways as roads. Beingcontinuously used for human occupation, log drives and transportation, forests in close vicinity to these water systemswere often transformed. Buffers were applied along lakes and rivers that met the following requirements: (a) appearedto be major transportation routes since the fur trade; and (b) basic rivers and lakes used for timber drives, starting from18th century until recently (village or town at the river, the presence of sawmills). Eccles W.J. The Canadian Frontier,1534-1760. New York: Holt, Rinehart and Winston, 1969. 234 pp.; Leach, D.E. The Northern Colonial Frontier,1607-1763; Paul, R.W. Mining Frontiers of the Far West, 1848-1880; Winther, O.O. The Transportation Frontier:Trans-Mississippi West, 1865-1890; Fite, G.C. The Farmers’ Frontier, 1865-1900; Huck, B. Exploring the Fur TradeRoutes of North America. Winnipeg: Heartland, 2000; Chittenden H.M. The American Fur Trade of the Far West.Bison Book Edition, University of Nebraska Press: Lincoln and London, 1992; Newman, P.C. Empire of the Bay:The Company of Adventurers that Seized a Continent. Penguin Books: 1998; Albert, M., C. Lamorie, R. Makela,N. Morsch and R. Neufeld. Trade History. North Shore of Lake Huron. Rae’s North Country Printing Services Inc.,Iron Bridge, 1996. 186 pp; Drushka K. Working in the Woods: A History of Logging on the West Coast. Madeira Park:Harbour Publishing, 1992. 304 pp; Dunfield J., 200 Years of Lumbering in the Ottawa Valley. Limited Edition, 183pp; A Pictorial History of Algonquin Park.
24 Although it is suspected that historic forest clearing of some primary forests resulted in conversion of previouslyforested stands to non-forested heathlands, this is not detectable by the current methodology. This phenomenon maybe at work in the Kalmia barrens of the island of Newfoundland following cutting of black spruce, in the Vaccium,Kalmia and Ledum heaths in Nova Scotia following the cutting of jack pine or black spruce on low productivity soils,and in the Galtheria-dominated cutovers of coastal British Columbia following the clearcutting of old growth westernred cedar forests. (1) de Montigny, L.E. and G.F. Weetman. 1989. The Effects of Ericaceous Plants on ForestProductivity in: Titus, B.D., M.B. Lavigne, P.F. Newton, eds. 1990. The Silvics and Ecology of Boreal Spruces.IUFRO Working Party S1.05-12 Symp. Proc., Newfoundland, 12-17 Aug. 1989, For. Can. Inf. Rep. NX271,pp. 83-90. (2) B. Mallik, A.U. 1995. Conversion of Temperate Forests into Heaths: Role of Ecosystem Disturbanceand Ericaceous Plants. Environmental Management 19(5): 675-684.] These areas were not excluded from intactforest landscapes as their extent could not be mapped.
Foototes
66 Canada’s Large Intact Forest Landscapes
25 Intensive logging in parts of eastern Canada in the 1800s and early 1900s caused a change in the forest mosaic, usuallyresulting in a shift toward deciduous species and smaller conifers.; (Waters, Thomas F. 1987. The Superior NorthShore: A Natural History of Lake Superior’s Northern Lands and Waters [Chapter 7]. University of Minnesota Press.Minneapolis. 361 pp.)
Chapter 4. Results
1 Over 70 percent of Canada’s mammalian species are found in B.C. and 24 of those species are endemic or exclusive tothe province (B.C. is home to over 1,086 species of vertebrate animals and 2,073 species of vascular plants:The Ministry of Water, Land and Air Protection. http://wlapwww.gov.bc.ca/wld/bio.htm [Aug 16, 2002]). Sixty(60) percent of these mammals are forest dependent. Forty-four (44) percent of forest dependent mammals withknown range trends have contracting ranges. Eighty-eight (88) percent of forest-dwelling vertebrates use lowelevation, valley bottom riparian habitat for basic needs such as food, shelter and reproduction. Ninety (90) percent ofriparian vertebrate species are threatened by logging in these low elevation forests, many of which are within intactforest landscapes (Ministry of Environment, Lands and Parks, Environmental Trends in British Columbia [2000][Victoria: Ministry of Environment, Lands and Parks, 2001], pp. 46-47.).
2 ibid.
3 The text of most of the historic treaties between Canada and its Indigenous peoples, which were found by this study tocontain remaining intact forest landscapes (Treaties 3–11 and the Robinson–Superior and Robinson–HuronTreaties), contain articles promising these people the right to hunt and fish as they had done previously. These treatyrights are constitutionally guaranteed. The texts of Canada’s historic treaties are available on-line athttp://atlas.gc.ca/maptexts/map_texts/english/trytxt_e.html#NU (July 14, 2003). The text of a typical article fromTreaty 5 provides a good example: “Her Majesty further agrees with Her said Indians, that they, the said Indians, shallhave right to pursue their avocations of hunting and fishing throughout the tract surrendered… saving and exceptingsuch tracts as may from time to time be required or taken up for settlement, mining, lumbering or other purposes.”(Available on-line at http://www.ainc-inac.gc.ca/pr/trts/trty5_e.html [July 14, 2003]). The Supreme Court ofCanada has instructed that these treaties be interpreted liberally, “in the sense in which they would be naturallyunderstood by the Indians.» Constitution Act, 1982, being Schedule B to the Canada Act 1982 (U.K.), 1982, c. 11,s. 35, available on-line at http://laws.justice.gc.ca/en/const/ (July 14, 2003). Only intact forests are capable ofmaintaining the full suite of populations of fauna necessary for Canada to honourably fulfill its constitutional promiseto those First Nations peoples with which it has settled treaties.
4 There are many different protection regimes and significant differences exist among Canada’s jurisdictions. Some ofthe areas may still be subject to industrial logging, energy developments and other types of human activity. However,the protected areas of this study meet higher-protection criteria established by the Endangered Spaces criteria ofWorld Wildlife Fund Canada
Glossary
1 University of Alberta. Aboriginal Claims in Canada. Available at:http://www.ualberta.ca/~esimpson/claims/introduction.htm (6/23/03).
2 For Alberta, see http://www3.gov.ab.ca/srd/forests/fmd/pubs/Forest-Resource-Ftsht.pdf. Most provinces holdresource rights in this way, as shown in this fact sheet from British.Columbia:http://www.growingtogether.ca/facts/sustainable.pdf (9/5/03).
3 Jessica Clogg. 1977. Tenure Reform for Ecologically and Socially Responsible Forest Use in British Columbia(Faculty of Environmental Studies, York University, unpublished). Available on-line at: http://www.wcel.org/forestry/11655/11655.html: Peter Pearse, for example, suggests that property rights can be characterized by examiningcomprehensiveness, exclusivity, duration, security, transferability, and the right to economic benefits. (Peter Pearse.1988. “Property Rights and the Development of Natural Resources Policies in Canada,” Canadian Public Policy 14,306; Peter Pearse. 1990. Introduction to Resource Economics (Vancouver: U.B.C. Press), 177-180. Scott andJohnson, and Schwindt use similar taxonomies to classify the nature of forest tenures. (Anthony Scott and JamesJohnson. 1983. Property Rights: Developing the Characteristics of Interests in Natural Resources, Resource PaperNo. 88 (Vancouver: U.B.C. Department of Economics), 7-11; Richard Schwindt. 1992. Report of the Commission ofInquiry into Compensation for the Taking of Resource Interests (Vancouver: Commission of Inquiry), 67.
67
4 Natural Resources Canada. 1999. The State of Canada’s Forests. Available online at:http://www.nrcan.gc.ca/cfs-scf/national/what-quoi/sof/sof99/feat1_e.html (6/23/03).
5 White, P.S., and S.T.A. Pickett. 1985. Natural disturbance and patch dynamics: an introduction. In S.T.A. Pickett andP.S. White, eds. The Ecology of Natural Disturbance and Patch Dynamics. Academic Press, New York, New York.
6 Turner, M.G., R.H. Gardner and R.V. O’Neill. 2001. Landscape Ecology in Theory and Practice. Pattern andProcess. Springer-Verlag, New York, New York.
7 Environment Canada. 2003. A National Ecological Framework for Canada. Available at: http://www.ec.gc.ca/soer-ree/English/Framework/NarDesc/1-2.cfm (6/23/03).
8 Dinerstein, E., D. M. Olson, D.J. Graham, A.L. Webster, S.A. Primm, M.P. Bookbinder, and G. Ledec. 1995.A Conservation Assessment of the Terrestrial Ecoregions of Latin America and the Caribbean. Washington, DC:World Bank. As cited by Rickets, T.H., E. Dinerstein, D.M. Olson, Colby J. Loucks et al. 1999. Terrestrial Ecoregionsof North America. A Conservation Assessment. Island Press. Washington DC.
9 Marshall, I.B., Schut, P.and M. Ballard (compilers). 1999. A National Ecological Framework for Canada: AttributeData. Environmental Quality Branch, Ecosystems Science Directorate, Environment Canada and Research Branch,Agriculture and Agri-Food Canada, Ottawa/Hull. Available online at:http://sis.agr.gc.ca/cansis/nsdb/ecostrat/data_files.html#summary_table. (6/23/03).
10 Environment Canada. 2003. A National Ecological Framework for Canada. Available at:http://www.ec.gc.ca/soer-ree/English/Framework/NarDesc/1-2.cfm (6/23/03).
11 World Resources Institute, World Wildlife Fund-US, Natural Resources Defense Council, Rainforest ActionNetwork, ForestEthics, Greenpeace. (Contributing Organizations). 2002. Endangered Forests: Priority HighConservation Value Forests for Protection. Guidance for Corporate Commitments.(Available online at http://www.forestethics.org/pdf/EF.pdf) (6/10/03).
12 Turner, M.G., R.H. Gardner and R.V. O’Neill. 2001. Landscape Ecology in Theory and Practice. Pattern andProcess. Springer-Verlag, New York, New York.
13 Cornell Laboratory of Ornithology. Forest Fragmentation. Available online at (6/25/03).
14 Bryant, D., D. Nielsen, and L. Tangley. 1997. The Last Frontier Forests: Ecosystems and Economies on the Edge.World Resources Institute, Washington, D.C., 42 pp. Available for purchase at:http://forests.wri.org//pubs_description.cfm?PubID=2619 (5/7/03).
15 Jennings, S., R. Nussbaum, T. Synnott. 2002. A Toolkit for Identifying and Managing High Conservation ValueForests. Review Draft 1. Proforest, Oxford UK.
16 Forest Stewardship Council – British Columbia. Principle 9. Annex P9a: Supplementary Requirements: HCVFDefinition in the BC Context. (Available online at http://www.fsc-bc.org/Upload/Annex%20P9a.pdf) (6/9/03).
17 Smith, Wynet and Peter Lee, eds. Canada’s Forests at a Crossroads: An Assessment in the Year 2000. World ResourcesInstitute and Global Forest Watch Canada. 114 p. Available at:http://www.globalforestwatch.org/common/canada/report.pdf (5/7/03).
18 Nogueron, R. 2002. Low-Access Forests and Their Level of Protection in North America. Global Forest Watch,World Resources Institute. Washington DC.
19 Provincial government of Manitoba, Manitoba Conservation. 1995. State of the Environment Report. Available online athttp://www.gov.mb.ca/conservation/annual-report/soe-reports/soe95/natural.html (6/25/03); Fluker, S. andD. Poulton. 2002. A Short Guide to Protected Areas Designations in Alberta. A Chart for the Perplexed. Canadian Parksand Wilderness Society. Available online at http://www.cpawscalgary.org/legislation/pa-designations.pdf (6/25/03)
Annex
1 Yaroshenko, Alexey, et al. 2001. Last Intact Forest Landscapes of Eastern Europeon Russia. Global Forest Watch.Available at: http://www.globalforestwatch.org/english/russia/maps.htm (5/7/03); Aksenov, Dmitry, D. Dobrynin,Alexander Isaev, Lars Laestadius, et. al. 2002. Atlas of Russia’s Intact Forest Landscapes. Global Forest Watch.Available at: http://www.globalforestwatch.org/english/russia/maps.htm (5/7/03).
Foototes
68 Canada’s Large Intact Forest Landscapes
Global Forest Watch10 G Street NEWashington, DC 20002, USATelephone: +1-202-729-7600Facsimile: +1-202-729-7610Email: [email protected]: http://www.globalforestwatch.org
Global Forest Watch Canada10337 146 StreetEdmonton, AlbertaT5N 3A3Telephone: 780-451-9260Facsimile: 780-454-5521Email: [email protected]
Biodiversity Conservation CenterVavlova Str. 41, App. 2, Moscow 117312 RussiaTelephone: +7-095-124-7178; -1245022; -1245011Facsimile: +7-095-1247178Email: [email protected]: http://www.biodiversity.ru/eng/
Forest Watch of British Columbia214 - 131 Water StreetVancouver, B.C. V6B 4M3Telephone: 604-328-1633Fascimile: 604-685-7813Email: [email protected]: http://www.forestwatchbc.org/main.html
Greenpeace Russia6 Novaya Bashilovka St.Moscow 101428, GSP-4, RussiaTelephone: +7 (095) 257-41-16, -18, -22Facsimile: +7 (095) 257-4110E-mail: [email protected]: www.greenpeace.org/russia_en
Socio-Ecological Union InternationalVavilova Str. 41, App. 1,Moscow 117312 RussiaTelephone/Facsimile: +7-095-1247934Email: [email protected]: http://www.seu.ru/index.en.htmWeb: http://www.forest.ru
World Resources Institute10 G Street NESuite 800Washington, DC 20002, USATelephone: +1-202-729-7600Facsimile: +1-202-729-7610Web: http://www.wri.org
Contact Information/Partners