Embed Size (px)
Citation preview

1 Global Climate Change JOEL S. LEVINE
Global Atmospheric Change
Some 4.5 billion years ago, soon after the Earth and its atmosphere formed, atmospheric gases energized by solar ultraviolet radiation and atmospheric lightning formed the key molecules needed for the synthesis of amino acids, the building blocks of all living systems. The process of forming complex organic molecules from simple atmospheric gases is termed "chemical evolution." In the early oceans of our planet, which offered protection from the biologically lethal ultraviolet radiation emitted by the Sun, the amino acids and other complex organic molecules combined chemically to form the first living systems. Protected by the early oceans, the first living systems developed, evolved, and increased in numbers. One group of early organisms developed the ability to synthesize carbohydrates used for food through the biochemical process of photosynthesis. During this process, a gaseous byproduct was given off-oxygen. Prior to this important evolutionary development, the early atmosphere contained little or no oxygen. Beginning about 3.5 billion years ago, photosynthetic oxygen began to accumulate in the atmosphere. About 600 million years ago, atmospheric oxygen evolved to about one-tenth of its present atmospheric level, which is about 21% by volume. This was a very significant milestone in the history of life. At this level of oxygen, natural atmospheric chemical reactions produced enough ozone (03) from the oxygen (02) to shield the surface of our planet from biologically lethal solar ultraviolet radiation. This atmospheric shield of ozone permitted life to leave the protection of the oceans and go ashore for the first time. Land, a major niche for life, was opened. Once on land, life evolved and flourished in numbers, diversity, and complexity. Several million years ago, through biological evolution, the human species first appeared and soon became the dominant life form on the planet.
Now humans are preparing to visit and colonize the planets, an evolutionary step of comparable magnitude to that which primeval organisms took 600 million years ago when they first left the oceans and moved onto
1 P. Firth et al. (eds.), Global Climate Change and Freshwater Ecosystems© Springer-Verlag New York Inc. 1992

2 Joel S. Levine
land. However, on the way to the planets, the human species has inadvertently altered the very atmosphere that gave birth to our earliest ancestors and protected our more modern cousins from ultraviolet radiation. Ironically, the activities and actions of modern humans have led to the chemical destruction of atmospheric ozone, the gas that provides protection from lethal levels of solar ultraviolet radiation. We have also altered the climate of our planet, potentially harming all living systems, including humans.
It has become apparent that human activities are responsible for the buildup of many so called "greenhouse" gases. These gases, including carbon dioxide, methane, nitrous oxide, and CFCs, will lead to relatively rapid global warming and climate change. Global warming will cause the thermal expansion of seawater and the melting of glacial and polar ice and snow. Thermal expansion and melting will result in a significant increase in both the mass of the world's oceans and the height of sea level, causing widespread flooding of low-lying land areas. In addition to the threat of global flooding, scientists are concerned about the impact of the rapid increase in global temperature (up to 6°C before the end of the next century) on plant and animal life, including humans.
The two most important atmospheric greenhouse gases are water vapor and carbon dioxide. Other greenhouse gases include methane, nitrous oxide, and the CFCs. All of the greenhouse gases with the exception of water vapor are produced directly or indirectly by human activities: the burning of fossil fuels, the burning of forests and grasslands for land clearing and conversion, and the use of CFCs in refrigerants, industrial processes and aerosol spray cans are several examples. Water vapor is a natural constituent of the atmosphere whose concentration is controlled by the hydrological cycle, i.e., the balance between the rate of evaporation of water vapor from the land and oceans and the rate of formation and precipitation of liquid water. While it is true that the rate of evaporation of water vapor and the capacity of the atmosphere to hold water vapor will increase with increased temperature, water vapor is not produced by human activities, as are carbon dioxide and the other greenhouse gases. The present atmospheric concentration of carbon dioxide is about 350 parts per million by volume (ppmv) or 0.035% by volume, but atmospheric carbon dioxide has increased significantly over the last 100 years. The other greenhouse gases are all increasing at comparable or faster rates.
Global Temperature
The very comfortable and hospitable climate of Earth was a major factor in the origin, evolution, and maintenance of an active biosphere on our planet (Figure 1.1). The average surface temperature of our planet today is a hospitable 15°C. Paleontological data indicate that over its history, the temperature of our planet did not experience significant departures from

1. Global Climate Change 3
FIGURE 1.1. The Earth photographed by the Apollo 17 astronauts in December 1972 during the final manned mission to the moon. The Antarctic icecap is brightly illuminated. Africa and Southwestern Asia appear in the northwest quadrant of photograph. Two of the key elements that control the climate appear in the photograph: clouds and the oceans. (NASA photograph.)
its present value. By contrast, the surface temperatures of our two closest planetary neighbors are very inhospitable: Venus (Figure 1.2) has a surface temperature of about 427°C and Mars (Figure 1.3) has a surface temperature of about - 53°C. The temperatures of Venus and Mars are too harsh to permit the existence of liquid water on the surfaces of these planets. It is generally believed that the presence of liquid water was a key ingredient in the origin and evolution of life on our planet more than 3.8 billion years ago.
The global climate is a complex system controlled and regulated by several parameters and processes. These include the amount of solar radiation incident on the top of the atmosphere, the reflectivity of the Earth! atmosphere system (which is controlled to a large extent by the distribution of clouds), and the opacity of the atmosphere to outgoing infrared or heat radiation emitted by the Earth's surface (which is controlled by both clouds and the greenhouse gases) (Figure 1.4). The global climate is also controlled and regulated by the world's oceans (which absorb and store vast amounts of energy) and the general circulation of the atmosphere and oceans (which transports and distributes this energy over our planet) . The reflectivity of the Earth's surface is affected by surface ice and

4 Joel S. Levine
FIGURE 1.2. Venus, a planet with a very strong greenhouse effect, photographed by the Pioneer Venus Orbiter on February 19,1979 at a distance of 40,600 miles. The strong Venus greenhouse results from an atmosphere composed mostly of carbon dioxide (95% by volume) with a surface pressure of 90 atm, which raises the surface temperature of Venus from about 244 to about 700 K. (NASA photograph.)
snow, desertification, and deforestation. The reflectivity of the atmosphere is also affected by clouds and volcanic and anthropogenic aerosols.
There are many couplings and feedbacks within the global climate system. For example, in the water vapor-greenhouse feedback, increased temperature will increase the rate of evaporation of water vapor into the atmosphere as well as increase the capacity of the atmosphere to hold water vapor. Increased atmospheric water vapor will increase the capacity of the atmosphere to trap outgoing infrared or heat radiation resulting in a further global warming: a positive feedback. However, increased atmospheric water vapor may also lead to a negative feedback: greater cloud cover would cause more incoming solar radiation to be reflected back to space, resulting in a reduction of the global warming.
One of the major challenges in science today is to gain a better under-

1. Global Climate Change 5
FIGURE 1.3. Mars, a planet with a very weak greenhouse effect, photographed by the Viking 2 Orbiter on August 5, 1976 at a distance of 260,355 miles. The weak Mars greenhouse results from an atmosphere composed mostly of carbon dioxide (96% by volume) with a surface pressure of only 7 mbar (1 atm = 1 bar = 1013 mbar), which raises the surface temperature of Mars from about 216 to about 220 K. (NASA photograph.)
standing of global climate and the parameters and processes that regulate and control it. The relevance of Earth system science finds no more important example than in global climate and global climate change, a discipline that involves the atmosphere, the oceans, the land, and the biosphere, the key elements of the Earth system (Ramanathan et al., 1985; World Meteorological Organization, 1985; Bolin et al., 1986; Dickinson and Cicerone, 1986; Schlesinger and Mitchell, 1987; Ramanathan, 1988; Ramanathan et al., 1989; and Mitchell, 1989; International GeosphereBiosphere Programme, 1990).
Over the past million years, our planet has experienced 10 major and more than three dozen minor periods of glaciation. It appears that the timing of these periods of glaciation was controlled by the Earth's orbital

6 Joel S. Levine
FIGURE 1.4. Couplings between the physical climate system and the global biogeochemical cycles are illustrated in this figure. The global biogeochemical cycles are discussed under the section on "Sources and Sinks of Greenhouse Gases." (Earth System Sciences Committee, NASA, 1988.)
elements that vary with time-the obliquity, the eccentricity, and the precession of the axis. An increase in the Earth's obliquity or tilt exposes the poles to more sunlight; an increase in the eccentricity increases the difference between the hemispheres in the intensity of the seasons; the precession of the axis determines at which season of the year the planet is at perihelion (closest distance to the Sun). The Earth's obliquity, which is presently 23S, oscillates from 22° to 24S to 22° with a period of 41 ,000 years; the precessional period is about half of the obliquity period. The eccentricity of the Earth's orbit around the Sun varies from being almost circular to being more elliptical with a period of 100,000 years.
The climate variations associated with changes in the Earth's obliquity, eccentricity, and precession are named Milankovitch climate cycles after the mathematician who first described them in 1920 (Figure 1.5). The Earth is now in the cooling phase of its natural Milankovitch cycle, and temperatures would be expected to decline over several thousand years. However, analyses of the temperature record indicate that the mean global temperature of our planet has increased over the last 100 years (Jones et aI., 1986; Hansen and Lebedeff, 1987).
Surface air temperature is the most frequently used index of climate change. The surface air temperature record goes back to the year 1860. Time series analyses of the annual surface temperature have been made by several groups, including NASA's Goddard Institute for Space Studies (GISS), the Climatic Research Unit at Norwich University in East Anglia

1. Global Climate Change 7
o 100 200 300 400 500 600 700 800 900 Time thousands of years before present
FIGURE 1.5. Variations in the eccentricity of the Earth's orbit around the Sun, in the obliquity of the Earth, and in the precession of the axis over the last 900,000 years. The Milankovitch climate cycle is controlled by changes in the amount of incoming solar radiation due to changes in the Earth's eccentricity and obliquity. (Earth Systems Sciences Committee, NASA, 1988.)
England, and the British Meteorological Office in Bracknell, England. These studies concluded that the mean global temperatures increased about OSC over the past century. They also found that the 1980s was the warmest 10 years on record. A NOAA study found that mean global surface temperatures have risen 0.08°C per decade since 1958. This result is consistent with other studies. Scientists at the Climatic Research Unit reported that 1988 was the world's hottest year since reliable temperature records have been kept. They further reported that the six hottest years of the century all occurred in the decade of the 1980s. In descending temperature order, they were 1988, 1987, 1983, 1981, 1980, and 1986.
The Effective Temperature
To a first approximation, the temperature of the Earth or any other planet is determined by the amount of incoming solar radiation that reaches and heats its surface. The amount of radiation that reaches a planetary surface depends on the planet'S distance from the Sun and the percentage of radiation that is reflected back to space, before it can heat the surface of the

8 Joel S. Levine
planet. The percentage of incoming radiation that is reflected back to space by the planetary surface and the atmosphere is called the planetary albedo, A. The albedo or reflectivity of the Earth is 33%. At the Earth's distance from the Sun (150 X 106 km), the top of the atmosphere receives about 1.4 x 10⁶ erg cm-2 sec i (or about 1367 W m-2) of incoming solar radiation. This quantity is called the "solar constant," S. About 99% of the incoming radiation falls in the spectral interval from 0.30 to 5.0 J-Lm (1 J-Lm = 0.0001 cm). The top of the Earth's atmosphere intercepts an amount of incoming solar radiation equal to S times the projected area of our planet, 7TR2, where R is the radius of the Earth, or 7TR2S. However, the amount of incoming solar radiation received at the planet'S surface is given by 7TR2S (1- A), where A is the albedo of the Earth. This amount of solar radiation reaches the surface of our planet and heats it to a temperature, called the "effective temperature," Te. The surface emits heat or infrared radiation as a radiator at a temperature of Te. Each cm2 of the Earth's surface radiates heat or infrared radiation according to the StefanBoltzmann Law, which states that the emission of heat or infrared radiation is equal to uT:, where u is the Stefan-Boltzmann constant (Mitchell, 1989). About 99% of the outgoing infrared radiation falls in the spectral interval from 4 to 80 J-Lm, with most of the outgoing radiation between about 8 and 30 J-Lm. To determine the total infrared radiation emitted by the Earth's surface, we must multiply the emission per each cm2 of the surface by the Earth's total surface area, 47TR2, where R is the radius of the Earth. Hence, the total amount of infrared radiation emitted by the surface is equal to 47TR2ur:. Since the effective temperature of the Earth's surface is determined by the balance of the incoming solar radiation reaching the surface [7TR2S( 1 - A)] and the outgoing infrared radiation emitted at the surface (47TR2u T:), we may equate these terms and solve for the effective temperature of a planet. This balance is valid since the total outward infrared or heat energy emitted by the Earth's surface is equal to the total downward solar energy incident on the surface. When we equate these two terms, and solve for Te we find that Te = \lS(l - A)/4 u. Solving for Te for the Earth by using the appropriate values for the constants S(1.4 x 10⁶ erg cm2 sec-I), A(0.33), and u(5.67 X 10⁻⁵ erg cm-2 deg-4 sec-I), we find that for the Earth, Te = 253 K or -200 e (the calculation of Te for the other planets, with the appropriate constants shown, is given in Table 1.1).
The Greenhouse Effect
At a temperature of -200 e, the Earth would be a very inhospitable, frozen world. Our experience indicates that this is not the case! Actual measurements indicate that the mean temperature of our planet averaged over the year and over all latitudes is about 15°e, rather than -20°C! Hence, the actual temperature of our planet is about 35°e warmer than the calculated

1. Global Climate Change 9
TABLE 1.1. The effective temperature (Te) of the planets (Goody and Walker, 1972).
Distance Flux of incoming from sun solar radiation Te
Planet (1()6 km) (1()6 erg cm-2 sec-I) Albedo (K)a
Mercury 58 9.2 0.058 442 Venus 108 2.6 0.71 244 Earth 150 1.4 0.33 253 Mars 228 0.6 0.17 216 Jupiter 778 0.049 0.73 87 Saturn 1430 0.015 0.76 63 Uranus 2870 0.0037 0.93 33 Neptune 4500 0.0015 0.84 32 Pluto 5900 0.00089 0.14 43
aK= [OC + 273). Source: Goody and Walker, 1972. From Atmospheres, p. 47, reprinted by permission of Prentice-Hall.
effective temperature due to the greenhouse effect. The greenhouse effect is the process whereby certain gases in the atmosphere, called "greenhouse" gases, absorb and then quickly reemit the infrared or heat radiation emitted by the surface as it passes outward through the atmosphere (Figure 1.6). Half of the infrared radiation reemitted by the greenhouse gases continues its journey in the outward direction and half is directed downward, resulting in additional heating of the surface.
The effective temperature of Venus is about 244 K and that of Mars is about 216 K (Table 1.1). The actual measured temperature of the surface of Venus is about 700 K and that for the surface of Mars is about 220 K. The very strong greenhouse temperature enhancement on Venus, of more than 450 K, is due to the large amount of carbon dioxide, an important greenhouse gas, in the atmosphere of Venus. Carbon dioxide comprises about 96% by volume of the atmosphere of Venus, which has a total surface pressure of about 90 atm (1 atm = 1013 mbar). While carbon dioxide comprises about 95% by volume of the atmosphere of Mars, the total surface pressure of the atmosphere of Mars is only about 7 mbar. Hence, the greenhouse effect on Mars raises the surface temperature by only about 4 K.
The concept of the carbon dioxide greenhouse effect and its heating of the Earth's surface is not a new idea. The carbon dioxide greenhouse effect was first described in papers by J.B. Fourier in 1827, J. Tyndall in 1863, S. Arrhenius in 1896, and T.C. Chamberlin in 1899.
At the present time, the world's scientists are concerned about a future warming caused by the rapid rate of increase of greenhouse gases in the atmosphere, a buildup resulting from human activities and additional natu-

10 Joel S. Levine
FIGURE 1.6. The greenhouse effect results from the fact that the atmosphere is transparent to incoming solar radiation, but is opaque to infrared radiation emitted at the surface. Atmospheric greenhouse gases include water vapor (H20), carbon dioxide (C02), nitrous oxide (N20), and methane (CH4). (Earth Systems Sciences Committee, NASA, 1988.)
ral processes. The most important greenhouse gases are water vapor (H20), carbon dioxide (C02), methane (CH4), nitrous oxide (N20), tropospheric ozone (03), CFC-ll (CFCh), and CFC-12 (CF2CI2).
Even though these gases control the climate of our planet and are increasing in concentration very rapidly, their atmospheric concentrations are very low. Water vapor is a highly variable constituent of the atmosphere with a concentration that ranges from a small fraction of a percent to 1-3% by volume. Carbon dioxide is at a concentration of about 350 ppmv, methane is at 1.8 ppmv, nitrous oxide is at 0.30 ppmv, CFC-ll is at about 0.2 parts per billion by volume (ppbv), and CFC-12 is at 0.4 ppbv.
Analyses of air trapped in bubbles in polar ice cores may be collected and analyzed for the chemical composition of the atmosphere at the time that the air was trapped in the ice, hundreds to thousands of years ago. These analyses indicate that in 1850, the atmospheric concentration of carbon dioxide was about 270 ppmv [in 1958 when actual measurements of
1. Global Climate Change 11
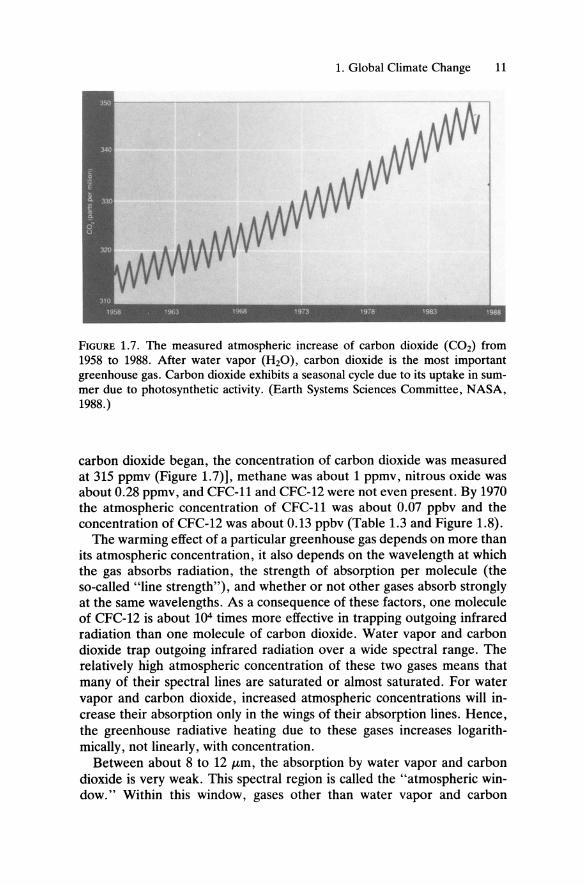
FIGURE 1.7. The measured atmospheric increase of carbon dioxide (C02) from 1958 to 1988. After water vapor (H20), carbon dioxide is the most important greenhouse gas. Carbon dioxide exhibits a seasonal cycle due to its uptake in summer due to photosynthetic activity. (Earth Systems Sciences Committee, NASA, 1988.)
carbon dioxide began, the concentration of carbon dioxide was measured at 315 ppmv (Figure l.7)], methane was about 1 ppmv, nitrous oxide was about 0.28 ppmv, and CFC-ll and CFC-12 were not even present. By 1970 the atmospheric concentration of CFC-ll was about 0.07 ppbv and the concentration of CFC-12 was about 0.13 ppbv (Table l.3 and Figure l.8).
The warming effect of a p articular greenhouse gas depends on more than its atmospheric concentration, it also depends on the wavelength at which the gas absorbs radiation, the strength of absorption per molecule (the so-called "line strength"), and whether or not other gases absorb strongly at the same wavelengths. As a consequence of these factors, one molecule of CFC-12 is about 104 times more effective in trapping outgoing infrared radiation than one molecule of carbon dioxide. Water vapor and carbon dioxide trap outgoing infrared radiation over a wide spectral range. The relatively high atmospheric concentration of these two gases means that many of their spectral lines are saturated or almost saturated. For water vapor and carbon dioxide, increased atmospheric concentrations will increase their absorption only in the wings of their absorption lines. Hence, the greenhouse radiative heating due to these gases increases logarithmically, not linearly, with concentration.
Between about 8 to 12 ILm, the absorption by water vapor and carbon dioxide is very weak. This spectral region is called the "atmospheric window." Within this window, gases other than water vapor and carbon

12 Joel S. Levine
350
ppmv
300
Carbon dioxide (C02)
250~--------------------------
1.8f~ 1 5 Methane (C: ppmv._
1.0 1...===--____________________ __
300 ppbv Nitrous oxide (N20)
290
280L---------------------------
0.4 ppbv
0.2
Chlorofluorocarbons -11 and -12 (CFC ·11 and CFC -12)
0.0 L......JL....-L....-L....-L-L-L-L-.L..-.L..-J......-<!j«:......I...-.L..J..
1850 1900 1950 1985 Years
FIGURE 1.8. The increase in atmospheric concentrations of greenhouse gases car· bon dioxide (C02) , methane (CH4), nitrous oxide (N20), CFC·l1 (CCI3F), and CFC·12 (CCI2F2) from 1850 to 1985. (World Meteorological Organization, 1985.)
dioxide have significant absorption lines. Ozone, methane, and nitrous oxide all have absorption bands in or near this spectral region and contribute to the absorption of infrared radiation, despite their relatively low concentrations. The absorption lines of these gases partially overlap those of other gases, and their absorption of infrared radiation is relatively strong and close to saturation. The greenhouse trapping of these gases increases as the square root of their concentrations. Other trace gases, such as CFC-ll and CFC-12, also have strong absorption lines in the atmospheric window, but have little overlap with other gases. Their low concentrations mean that their absorption in the center of their spectral lines is not saturated, so that their absorption of infrared radiation increases linearly with concentration. The absorption characteristics and greenhouse heating effect of these gases are summarized in Table 1.2. The combined heating effects of the seven greenhouse gases listed in Table 1.2 is more than 150 W m-2• Hence, the greenhouse gases play a significant role in regulating and controlling the climate of our planet.
Today, greenhouse gases are building up at alarming rates. The increase in atmospheric concentrations of these gases from 1850 to 1985 and projected concentrations for the period of 2000 to 2100 are summarized in Table 1.3, and in Figures 1.8 and 1.9.

1. Global Climate Change 13
TABLE 1.2. Greenhouse gases: absorption and heating (Mitchell, 1989).
Principal absorption bands
Spectral Concentration position
Gas (ppmv)b (cm- I )
Water vapor -3000 Carbon dioxide 350 667 Methane 1.8 1306 Nitrous oxide 0.3 1285 Ozone 10-100 x 10-3 1041 CFC-11 0.2 x 10⁻³ 846
1085 CFC-12 0.4 x 10⁻³ 915
1095 1152
aThe "solar constant" is about 1367 W m- I .
b ppmv = parts per million by volume.
Absorption strength (cm- I atm- I cm- I STP)
185 235 376
1965 736
1568 1239 836
Greenhouse heating effecta (Wm-Z)
-100 -50
1.7 1.3 1.3 0.06
0.12
Source: Mitchell, 1989. From Review of Geophysics, vol. 27, p. 119, copyright by the American Geophysical Union.
TABLE 1.3. Trend in concentrations of carbon dioxide, methane, nitrous oxide, CFC-ll and CFC-12 from 1850 to 2100.
Date COz(ppm) CH4(ppm) NzO(ppb) CCI3F(ppb) CClzFz(ppb)
1850 270 1.00 282 0 0 1900 290 1.17 284 0 0 1958 315 1.40 293 .01 .03 1970 325 1.51 297 .07 .13 1985 346 1.79 305 .24 .40
Aa Bb A B A B A B A B 2000 372 371 2.24 2.12 319 318 0.42 0.41 0.72 0.71 2015 404 400 2.80 2.28 343 335 0.71 0.61 1.22 1.07 2030 445 428 3.50 2.46 383 353 1.15 0.78 1.99 1.41 2050 515 466 4.71 2.72 483 377 2.13 0.96 3.72 1.80 2100 818 562 9.91 3.49 1432 439 9.68 1.24 17.00 2.60
aScenario A is an extrapolation of current growth rates for gases: COz, 1.5%/yr; CH4, 1.5%1 yr; NzO, 0.2%/yr in 1980; O.4%/yr in 2000; and 0.9%/yr in 2030; CCl3F and CClzFz, 3%/yr growth in emissions. bScenario B is an extrapolation with reduced growth rates for gases: COz, 1.5%/yr to 1990; 1.0%/yr from 1990 to 2000; 0.5%/yr from 2000 to 2100; and O%/yr after 2010; CH4 , 1.5%/yr to 1990; 1.0%/yr from 1990 to 2000; and 0.5%/yr after 2000; NzO: growth in emissions-2.5%/yr from 1990 to 2000; 1.5%/yr from 2000 to 2010; and 0.5%/yr after 2010 yields 0.2%/yr growth in abundance in 1980; 0.33%/yr in 2000; and 0.34%/yr in 2030; CCl3F and CClzFz: growth in emission-3%/yr to 1990; 2%/yr from 1990 to 2000; 1 %/yr from 2000 to 2010; and O%/yr after 2010. Source: World Meteorological Organization, Report No. 16: Atmospheric Ozone 1985.

14 Joel S. Levine
700 Carbon dioxide (C02)
ppmv
500
300~------------------------
10~ Methane (CH4) ppmv
5
1~----------------------~
1100
ppbv Nitrous oxide (N20)
700
300&-~~~~~------------
20
10
Chlorofluorocarbons -11 and -12.·· CFC -12 (CFC -11 and CFC -12) ./. ppbv
CFC -11
19852000 2020 2040 2060 2080 2100 Years
FIGURE 1.9. Projected increase in atmospheric concentrations of greenhouse gases carbon dioxide (C02) , methane (CH4), nitrous oxide (N20), CFC-ll (CCI3F), and CFC-12 (CCI2F2) from 1985 to 2100. (World Meteorological Organization, 1985.)
CFC-ll and CFC-12 are two greenhouse gases that are not natural constituents of the atmosphere. Increasing atmospheric levels of carbon dioxide, methane, nitrous oxide, and ozone are also directly related to human activities. Atmospheric concentrations of water vapor are not directly controlled by human activities, but there is an important indirect effect that is human related. The amount of water vapor in the atmosphere is controlled by the temperature of the troposphere, the lowest region of the atmosphere that extends from the surface to between 10 and 15 km altitude depending on the latitude (Figure 1.10). As greenhouse gases build up in the atmosphere, the temperature of the Earth will increase. The increased surface and tropospheric temperature will permit the troposphere to hold more water vapor, as well as increase the rate of evaporation of water vapor from the land and ocean. Hence, the buildup of anthropogenic greenhouse gases will also accelerate the buildup and greenhouse warming effect of water vapor, which is not directly controlled by human activities.
Climate modelers use the term "greenhouse forcing" to describe the

1. Global Climate Change 15
FIGURE 1.10. The structure of the Earth's atmosphere illustrating the various regions of the atmosphere: troposphere, stratosphere, mesosphere, thermosphere, and exosphere. Each atmospheric region is defined by its temperature gradient. (Earth Systems Sciences Committee, NASA, 1988.)
temperature enhancement resulting from the buildup of a particular greenhouse gas in the atmosphere. Greenhouse forcing is the temperature enhancement solely due to the radiative effect of the increase in the concentration of a particular greenhouse gas and does not include the accompanying temperature enhancement feedback due to enhanced concentrations of water vapor, or any other feedbacks. The water vapor concentration of the troposphere increases with increasing surface temperature according to the Clausius-Clapeyron relation, i.e., a 1 K increase in atmospheric temperature will be associated with a 6% increase in atmospheric water vapor. Since water vapor is the most important greenhouse gas, the water vaporsurface temperature feedback increases the computed greenhouse forcing temperature enhancement by roughly 50-100%, depending on the particular climate model. Theoretical climate models predict a greenhouse temperature enhancement with water vapor feedback that ranges from 1.5 to 4SC for an atmospheric doubling of carbon dioxide; if additional feedbacks are included, the estimated greenhouse temperature enhancement is 1.8 to 5.2°C.

16 Joel S. Levine
A recent study of global climate change by the World Meteorological Organization had the following conclusions:
1. Greenhouse gases other than carbon dioxide are now adding to the greenhouse effect by an amount at least comparable to the effect of carbon dioxide; this is a fundamental change from the situation during the period 1850-1960.
2. The rate of increase of the total greenhouse forcing is now 3-10 times greater than the mean rate for the period 1850-1960, due to both increases in the growth rate of carbon dioxide and the recent growth of other trace gases.
3. The cumulative value for surface temperature change without climate feedback for the period 1850-1980 is 0.56°C; carbon dioxide increase contributed O.4°C and the other trace gases contributed the balance of 0.16°C. The radiative forcing of 0.56°C would yield an equilibrium surface air temperature change of about 0.9°C (0.56°C x 1.5) for a climate model whose equilibrium sensitivity is 2°C for a doubling of carbon dioxide. The 1850 to 1980 equilibrium surface air temperature change ranges from 0.7 to 2°C depending on the particular climate model.
4. The predicted equilibrium surface warming for the period 1980 to 2030 ranges from 0.8 to 4.1°C.
5. Thus, for the 180 year period from 1850 to 2030, the trace gas induced cumulative equilibrium surface warming is in the range of 1.5 to 6. 1°C.
Other Climate Feedbacks
In addition to the direct radiative forcing or direct warming effect of a particular greenhouse gas and the water vapor-greenhouse feedback already discussed, there are several other feedbacks in the climate system: the ice-albedo feedback, the cloud feedback, and the climate-ocean feedback. As already described, the water vapor-greenhouse feedback results from an enhanced rate of evaporation of water vapor from the land and ocean and an enhanced capacity for the atmosphere to hold water vapor with increasing temperature. The enhanced water vapor traps more infrared radiation and the water vapor-greenhouse feedback amplifies the warming by a factor of at least 1.5. Increased greenhouse warming will melt ice and snow. The surface underlying the melted ice and snow, whether land or water, is much darker, and thus has a much lower albedo. Hence, the underlying surface will absorb much more incoming solar radiation and will amplify the initial warming. The melting of sea ice can increase the absorption of incoming solar radiation by the ocean by as much as 50 to 100 W m-2 (the direct radiative heating due to CO2 is only about 4 W m-2). While the ice-albedo feedback increases the global warming by only 10-20%, the local warming can be larger than that by factors ranging from 2 to 4.

1. Global Climate Change 17
Increased atmospheric levels of water vapor on a warmer Earth may alter the distribution and optical properties of clouds. The cloud feedback is one of the largest sources of uncertainty in global climate change. The reflectivity of clouds increases the Earth's albedo from about 10% (the clear sky albedo) to the measured value of about 30%. Calculations indicate that a planetary albedo increase of only 0.5% is sufficient to halve the greenhouse effect of CO2, In addition, clouds are also extremely efficient in trapping infrared radiation. Tropical cirrus clouds may trap as much as 100 to 200 W m-2 •
The world's oceans influence the climate in two important ways. As the Earth heats up, the rate of evaporation of water vapor from the ocean surface will increase. This enhanced evaporation is the source of the increased water vapor that the atmosphere can hold due to increased atmospheric temperature. In addition, the oceans can store large amounts of heat energy due to their enormous heat capacity and total mass. Storage of heat in the deeper ocean layers can significantly delay a global warming. The circulation patterns of the world's oceans may change as a result of global warming. Since the oceans play an important role in determining regional climate by the redistribution of heat energy from the equator to the poles, changes in the circulation patterns of the oceans could have a significant impact on climate.
Sources and Sinks of Greenhouse Gases
Greenhouse gases have very diverse sources, sinks, and cycles through the atmosphere, oceans, and biosphere (Levine, 1985, 1988). Sources of these gases include the combustion of fossil fuel, the burning of global biomass (trees, vegetation, and grasslands), biogenic production by microbial metabolic activity (respiration, nitrification, denitrification, and methanogenesis) and industrial technological activities (Figure 1.11). Sinks of these gases include incorporation into the biosphere and sediments, physical absorption in the oceans, and chemical transformation within the atmosphere. Tracking carbon, nitrogen, hydrogen, and oxygen atoms through their biogeochemical cycles provides testimony for the strong chemical coupling between the atmosphere, the oceans, and the biosphere (Figure 1.11).
Carbon Dioxide (C02)
The world's oceans contain about 1 X 10⁸ petagrams (Pg) of C, in the form of carbonate sediments [1 Pg = 1015 g]. Global fossil fuel reserves are estimated at between 5000 and 10,000 Pg C. The world's biosphere contains about 2060 Pg C divided between vegetation, trees, and grasslands (560 Pg C) and soils (1500 Pg C). The atmosphere with about 735 Pg C in

Phot
olys
is o
f O
2 Pr
oduc
tion
of
03
I O
zone
con
cent
rati
ons
l Sl
ow t
rans
port
of
03
Phot
odis
soci
atio
n of
CFC
s -
Cl.
CIO
Dis
soci
atio
n of
!::'
20.
NO
. N
02
CA
TA
LY
TIC
DE
STR
UC
TIO
N
(A
bsor
ptio
n of
UV
rad
iati
On
) 24
Onm
-29O
nm
29O
nm-3
20nm
(pa
rtia
l)
03
STR
AT
OPA
USE
(50
km
)
STR
AT
OSP
HE
RE
Str
atos
pher
ic
cool
ing
25
km
_
__
__
__
__
__
__
__
__
__
__
__
__
__
__
__
__
__
__
__
__
__
__
__
_
0
I sl
ow t
rans
port
t sl
ow t
rans
port
C
FCs.
N20
. C
O2.
and
oth
ers.
t
CI.
CIO
. N
O.
etc.
T
RO
POPA
USE
(10
-15
km)
Tro
posp
heri
c .-:
-:::::
{ C
FC
CFC
w
arm
ing
due
to
.::::::::?
::::::
emis
sion
s T
RO
PO
SP
HE
RE
i~~e g
ases
~~:
;t~::;
ffect/
~ee\tm
m C
O2
CFC
lo
ng-w
ave
radi
atio
n :::
::::::
::::::
.:.:.:
~ N
O.
CO
2 C
H4
met
hane
,
am
iS
Sio
ns
:i:;;i~i~~
i;iNf¥=~i~
"':::,~~;:
',,,,l,,,,
3tit,,,;,,
,';"";"""
"!""""",
;,,,XJN@
F
IGU
RE
1.1
1. S
chem
atic
ill
ustr
atin
g so
me
sour
ces
and
sink
s of
gre
enho
use
gase
s an
d th
e ch
emic
al t
rans
form
atio
ns o
f th
ese
gase
s in
the
tro
posp
here
and
str
atos
pher
e. (
Inte
rnat
iona
l G
eosp
here
-Bio
sphe
re P
rogr
amm
e, 1
990.
)
......
00
.... o !l- en ~ S·
o

1. Global Climate Change 19
the form of CO2 (corresponding to about 350 ppmv) is the smallest of the three active or rapidly cycling carbon reservoirs in the Earth system (atmosphere + oceans + biosphere). Since CO2 is chemically inert it is not destroyed by photochemical or chemical processes in the atmosphere if it is not lost by transfer into the oceans or biosphere, it will build up in the atmosphere (Houghton and Woodwell, 1989).
The global CO2 budget is very complex and involves the transfer of CO2
between the atmosphere, the oceans, and the biosphere. The magnitudes of the CO2 transfer fluxes and reservoirs are somewhat uncertain. During the photosynthetic process, the land removes about 100 Pg of carbon (C) in the form of atmospheric CO2 per year. However, about the same quantity of carbon in the form of CO2 is added to the atmosphere each year by vegetation and soil respiration and decay. Physical and chemical processes in the world's oceans release about 100 Pg C in the form of CO2 into the atmosphere each year. The oceans in turn absorb about 104 Pg C each year for a net increase of about 4 Pg C in the form of CO2 . (These numbers are somewhat uncertain, but there is a general consensus that the world's oceans presently absorb slightly more CO2 from the atmosphere than they release to the atmosphere.) Most of the ocean carbon is in the form of sedimentary carbonates. The burning of fossil fuels adds about 5 Pg C and biomass burning/deforestation adds about another 2 Pg C to the atmosphere in the form of CO2 annually (Levine, 1990, 1991). By adding all of the fluxes of CO2 into and out of the atmosphere, we find that about 3 Pg C in the form of CO2 is building up in the atmosphere each year (5 Pg C from fossil fuel burning + 2 Pg C from biomass burning/deforestation - 4 Pg C going into the oceans = 3 Pg C building up in the atmosphere).
Methane is produced in two ways: In anaerobic environments by the action of methanogenic bacteria, and by biomass burning. The major anaerobic environments that produce CH4 include wetlands (estimated to produce 150 ± 50 Tg CH4/yr), rice paddies (100 ± 50 Tg CH4/yr), and enteric fermentation in the digestive system of cattle, sheep, etc (100-150 Tg CH4/yr). Biomass burning may supply between 10 and 100 Tg CH4/yr. Other sources of CH4 include termites, the tundra, and the oceans. Recent measurements indicate the emissions of CH4 from wetlands following burning are significantly enhanced (Levine 1985, 1988).
Unlike CO2, which is chemically inert, methane is readily destroyed in the atmosphere via reaction with the hydroxyl radical (OH) (Figure 1.10):
CH4 + OH ~ CH3 + H20
The OH radical destroys about 500 teragrams (Tg) of CH4 each year [1 Tg = 1012 g]. (To obtain the value in terms of Tg C per year multiply by 0.75.) The mean atmospheric residence time of CH4 before destruction via
20 Joel S. Levine
reaction with the OH radical is about 8 years. About 10% of the CH4
in the troposphere diffuses up into the stratosphere, where it is oxidized.
Nitrous Oxide (N20) Nitrous oxide is produced by the metabolic processes of nitrification and denitrification carried out by nitrifying and de nitrifying bacteria in soil. In general, denitrification occurs in anaerobic environments, while nitrification occurs under aerobic conditions. Nitrate (NO]) is the substrate needed in denitrification, and ammonium (NH!) is the substrate in nitrification. Both NO] and NH! are commOn soil constituents (Levine, 1985, 1988).
EstImates for global sources of N20 include biogenic emissions via nitrification and denitrification in tropical and subtropical soils: 7.4 ± 4 Tg N/yr; biogenic emissions (nitrification and denitrification) in fertilized agricultural soils: 0.8 ± 0.4 Tg N/yr; and production in the oceans via biogenic process: 2 ± 1 Tg N/yr. Clearly, the destruction and buildup rates of N20 are not balanced by the estimated known global sources of N20. This imbalance came about with the discovery of the N20 artifact, which seriously questions earlier N20 measurements associated with fossil fuel and biomass burning. For many years, it was believed that fossil fuel combustion was a significant source of N20. It now appears that these measurements were affected by a sampling artifact, the chemical buildup of N20 in the collecting bottle prior to chemical analysis. There is evidence that this sampling artifact also occurs in N20 samples from biomass burning.
Like CO2, nitrous oxide is chemically inert in the troposphere (Figure l.1O). However, N20 is destroyed in the stratosphere via photolysis by solar radiation, which is responsible for about 90% of its destruction, and by reaction with excited atomic oxygen [O(1D)], which is responsible for about 10% of its destruction (Figure l.11). The destruction of N20 by photolysis and reaction with 0(1 D) are represented by the following reactions:
N20 + hv ~ N2 + O(1D), A < 341 nm N20 + O(1D) ~ N2 + O2 N20 + O(1D) ~ 2NO
These photochemical and chemical processes destroy about 10.5 ± 3 Tg N/yr. The mean lifetime of N20 in the atmosphere is about 175 years.
The destruction of N20 by reaction with O(1D) resulting in the production of nitric oxide (NO) is a key step in the chemical destruction of stratospheric OZOne (03).
Nitrous oxide is building up in the atmosphere at a rate of about 3 ± 0.5 Tg N/yr. Adding this value to the global destruction rate of N20 of about 10 ± 3 Tg N/yr, we find that the global sources of N20 should add up to about 13.5 ± 3.5 Tg N/yr. At the present time, there is a problem in identifying the sources of N20 of this total magnitude.
1. Global Climate Change 21
CFC-ll and CFC-12 CFC-11 (CChF) and CFC-12 (CClzF2) are man-made molecules used in a variety of applications. It has been estimated that the total industrial production of CFC-11 and CFC-12 is about 0.33 and 0.44 Tglyr. (All of the estimates for CFC-11 and CFC-12 data are for 1986.) The uses of CFC-11 are estimated as-closed-cell foams, 36%; aerosol propellents, 31%; open-cell foams, 19%; refrigeration and air conditioning, 8%; other uses, 6%. The uses of CFC-12 are estimated as-refrigeration and air conditioning, 49%; aerosol propellents, 32%; closed-cell foams, 8%; open-cell foams, 5%; other uses, 6%.
Like nitrous oxide, CFC-11 and CFC-12 are chemically inert in the troposphere and diffusive up to the stratosphere (Figure 1.10). Like N20, both CFC-11 and CFC-12 are destroyed in the stratosphere by photolysis by solar radiation and by reaction with excited atomic oxygen (Figure 1.11). The destruction of CFC-11 and CFC-12 in the stratosphere initiates chemical reactions that lead to the destruction of ozone in the stratosphere. Hence, not only are CFC-11 and CFC-12 greenhouse gases that lead to global warming, but the photolysis and oxidation products of both bases lead to the chemical destruction of ozone in the stratosphere. CFC-11 and CFC-12 are destroyed via the following processes (Figure 1.11):
CCl3F + hv ~ CCl2F + CI, ,\ < 265 nm CClzF2 + hv ~ CCIF2 + CI, ,\ < 200 nm
CCl3F + 0(10) ~ CClzF + CIO CClzF2 + 0(10) ~ CCIF + CIO
The atomic chlorine (CI) and chlorine monoxide (CIO) formed in these reactions play key roles in the chemical destruction of ozone in the stratosphere.
The chlorine chemistry is the most efficient destroyer of 0 3 in the stratosphere and is much more efficient on a molecule per molecule basis that either NO or OH, both of which also lead to the chemical destruction of 0 3 •
In September 1987, 46 countries met in Montreal, Canada and drafted a worldwide protocol for reduction of the use of CFCs and Halons due to their involvement in the chemical destruction of ozone in the stratosphere. The Montreal Protocol participants recently reconvened and agreed to a more rapid and complete phaseout of CFCs and Halons than the original protocol required.
The Intergovernmental Panel on Climate Change (IPCC)
In 1988, the World Meteorological Organization and the United Nations Environmental Program created the Intergovernmental Panel on Climate Change (lPCC). Dr. Bert Bolin, Chairman of the Department of

22 Joel S. Levine
Meteorology, University of Stockholm, was selected as the Chairman of the IPCC. The panel was given the task of assessing the likelihood of a future climate change due to human activities, particularly the emissions of greenhouse gases into the atmosphere, analyzing the possible impacts of such a change, including socioeconomic impacts, and exploring ways to slow down or stop activities that lead to such changes. IPCC Working Group 1, chaired by John Houghton of the United Kingdom, was charged with preparing the scientific assessment of climate change. The report of IPCC Working Group 1 was prepared by 30 lead authors with 150 additional experts in relevant fields participating in the writing process. The Executive Summary of the report was completed in the Spring of 1990 and is outlined below. It is an excellent and comprehensive statement of our current understanding of global climate change.
We are certain of the following:
• There is a natural greenhouse effect that already keeps the Earth warmer than it would otherwise be.
• Emissions resulting from human activities are substantially increasing the atmospheric concentrations of the greenhouse gases: carbon dioxide, methane, chlorofluorocarbons (CFCs), and nitrous oxide. These increases will enhance the greenhouse effect, resulting on average in an additional warming of the Earth's surface. The main greenhouse gas, water vapor, will increase in response to global warming and further enhance it.
We calculate with confidence that
• Some gases are potentially more effective than others at changing climate, and their relative effectiveness can be estimated. Carbon dioxide has been responsible for over half the enhanced greenhouse effect in the past and is likely to remain so in the future.
• Atmospheric concentrations of the long-lived gases (carbon dioxide, nitrous oxide, and the CFCs) adjust only slowly to changes in emissions. Continued emissions of these gases at present rates would commit us to increased concentrations for centuries ahead. The longer emissions continue to increase at present-day rates, the greater reductions would have to be for concentrations to stabilize at a given level.
• The long-lived gases would require immediate reductions in emissions for human activities of over 60% to stabilize their concentrations at today's levels; methane would require a 15-20% reduction.
Based on current models, we predict
• Under the IPCC business-as-usual (Scenario A) emissions of greenhouse gases, a rate of increase of global mean temperature during the next century of about 0.3°C per decade (with an uncertainty range of 0.2 to 0.5°C per decade); this is greater than that seen over the past 10,000
1. Global Climate Change 23
years. This will result in a likely increase in global mean temperature of about 1°C above the present value by 2025 and 3°C before the end of the next century. The rise will not be steady because of the influence of other factors.
• Under the other IPCC emission scenarios, which assume progressively increasing levels of controls, rates of increase in global mean temperature of about 0.2°C per decade (Scenario B), just above O.l°C per decade (Scenario C), and about O.l°C per decade (Scenario D).
• That land surfaces warm more rapidly than the ocean, and high northern latitudes warm more than the global mean in winter.
• Regional climate changes different from the global mean, although our confidence in the prediction of the detail of regional changes is low. For example, temperature increases in southern Europe and central North America are predicted to be higher than the global mean, accompanied on average by reduced summer precipitation and soil moisture. There are less consistent predictions for the tropics and the Southern Hemisphere.
• Under the IPCC business-as-usual emissions scenario, an average rate of global mean sea level rise of about 6 cm per decade over the next century (with an uncertainty range of 3-10 cm per decade), mainly due to thermal expansion of the oceans and the melting of some land ice. The predicted rise is about 20 cm in global mean sea level by 2030, and 65 cm by the end of the next century. There will be significant regional variations.
There are many uncertainties in our predictions, particularly with regard to the timing, magnitude, and regional patterns of climate change, due to our incomplete understanding of
• sources and sinks of greenhouse gases, which affect predictions of future concentrations;
• clouds, which strongly influence the magnitude of climate change; • oceans, which influence the timing and patterns of climate change; and • polar ice sheets, which affect predictions of sea level rise.
These processes are already partially understood, and we are confident that the uncertainties can be reduced by further research. However, the complexity of the system means that we cannot rule out surprises.
Our judgment is that
• Global mean surface air temperature has increased by 0.3 to 0.6°C over the last 100 years, with the five global-average warmest years being in the 1980s. Over the same period, global sea level has increased by 10-20 cm. These increases have not been smooth with time nor uniform over the globe.
• The size of this warming is broadly consistent with predictions of climate

24 Joel S. Levine
models, but it is also of the same magnitude as natural climate variability. Thus the observed increase could be largely due to this natural variability; alternately this variability and other human factors could have offset a still larger human-induced greenhouse warming. The unequivocal detection of the enhanced greenhouse effect from observations is not likely for a decade or more.
• There is no firm evidence that climate has become more variable over the last few decades. However, with an increase in the mean temperature, episodes of high temperatures will most likely become more frequent in the future and cold episodes less frequent.
• Ecosystems affect climate and will be affected by a changing climate and by increasing carbon dioxide concentrations. Rapid changes in climate will change the composition of ecosystems; some species will benefit while others will be unable to migrate or adapt fast enough and may become extinct. Enhanced levels of carbon dioxide may increase productivity and efficiency of water use of vegetation. The effect of warming on biological processes, although poorly understood, may increase the atmospheric concentrations of natural greenhouse gases.
To improve our predictive capability, we need to
• understand better the various climate-related processes, particularly those associated with clouds, oceans, and the carbon cycle;
• improve the systematic observations of climate-related variables on a global basis and further investigate changes which took place in the past;
• develop improved models of the Earth's climate system; • increase support for national and international climate research activi
ties, especially in developing countries; and • facilitate international exchange of climate data.
The enhanced greenhouse effect will result in significant changes in local, regional, and global temperatures and atmospheric circulation patterns. Models and calculations predict significant increases in the global mean temperature ranging from 0.8 to 4.1°C from 1980 to 2030. At or near the poles, glacial and surface ice and snow may begin to melt, raising the mean height of the world's oceans by as much as 20 cm by 2030 and 65 cm by the end of the next century. This will lead to the flooding of many low-lying areas of the world presently occupied by hundreds of millions of people. Scientists are also concerned about the response of living systems, including humans, to temperature increases of up to 4°C over a period of only several decades. There are many questions and uncertainties in our understanding of the impact of a global warming on our planet and its varied forms of life.
It must be emphasized that climate predictions are based on theoretical computer models. These models attempt to simulate the atmosphere, a very complex system that involves radiative, thermodynamic, chemical,

1. Global Climate Change 25
and dynamic processes. The atmosphere is also strongly coupled to the Sun, the oceans, the land, and the biosphere. There are many uncertainties in our present understanding of these processes and couplings.
References Bolin B, Doos BR, Jaeger J, Warrick RA, eds. (1986) The Greenhouse Effect,
Climatic Change, and Ecosystems. Scope Report 29. Dickinson RE, Cicerone RJ (1986) Future global warming from atmospheric trace
gases. Nature (London) 319:109. Earth System Sciences Committee, NASA (1988) Earth System Science: A Pro
gramfor Global Change. Prepared by the NASA Advisory Council, Washington, DC. 20546.
Hansen J, Lebedeff S (1987) Global trends of measured surface air temperature. J Geophy Res 92(13):345.
Goody RM, Walker JCG (1972) Atmospheres. Prentice-Hall, Englewood Cliffs, NJ.
Houghton RA, Woodwell GM (1989) Global climate change. Sci Am April:36. International Geosphere-Biosphere Programme (1990) The Initial Core Projects.
IGBP Global Change Report No. 12. Jones PD, Wigley TML, Wright PB (1986) Global temperature variations, 1861-
1984. Nature (London) 322:430. Levine JS, ed (1985) The Photochemistry of Atmospheres: Earth, the Other Planets,
and Comets. Academic Press, Orlando, FL. Levine JS (1988) Photochemistry of biogenic gases. In MB Rambler, L Margulis,
R Fester, eds, Global Ecology, p. 51. Academic Press, Orlando, FL. Levine JS (1990) Global biomass burning: Atmospheric, climatic and biospheric
implications, EOS, Transact Am Geophy Union 71:1075. Levine JS, ed. (1991) Global Biomass Burning: Atmospheric, Climatic and Bio
spheric Implications. MIT Press, Cambridge, MA. Mitchell JFB (1989) The greenhouse effect and climate change. Rev Geophys
27:115. Ramanathan V (1988) The greenhouse theory of climate change: A test by an
inadvertent global experiment. Science 240:293. Ramanathan V, Cicerone RJ, Singh HB, Kiehl JT (1985) Trace gas trends and their
potential role in climate change. J Geophys Res 90:5547. Ramanathan V, Barkstrom BR, Harrison EF (1989) Climate and the earth's radia
tion budget. Phys Today May:22. Schlesinger ME, Mitchell JFB (1987) Climate model simulations of the equilibrium
climatic response to increased carbon dioxide. Rev Geophys 25:760. World Meteorological Organization (1985) Trace gas effects on climate. Atmo
spheric Ozone 1985, Global Ozone Research and Monitoring Project, Report No. 16, Volume III, Chapter 15, p. 821.