Embed Size (px)
Citation preview
A survey of:
The world’s most senior corporate and financial decision makers
Providing print, TV, web and mobile data for:
• CFO’sandTreasurersintheworld’s2,000largest organisations
• Topmanagementofbanks and financial institutionsactiveinthecapitalmarkets
…in 37 countries worldwide
global capital markets
GlobalCapitalMarkets2011
Sponsors Purchasers

THE SURVEY IN BRIEF
Survey UniverseThesurveycovers10,619seniorindividualsinthe37countrieslistedbelowintwogroups:
• theHeadsofFinanceandTreasurersin2,071LargeOrganisations(atotalof3,864individuals)
• seniorindividualsinBanksandFinancialInstitutionswhichprovidecorporatefinancialservicessuch
asloans,treasury,M&Aorstrategicadvice(6,755individuals).
TheLargeOrganisationsinclude:
• 1,520withsalesinexcessofUS$9.6billion
• 720whohadraisedmorethanUS$1,000millionusingbondsorloansin2010
• thetop100Banksintermsoftier1capital
• anadditional71largeorganisationsinemergingmarkets.
Thesegroupswerede-duplicatedtogeneratethelargest2,071organisationsintheworld.Inthelargest550organisationstheDeputy
HeadofFinancewasalsoincluded.
Thetablebelowshowstheuniversesizeandprofilebyregion,togetherwiththeirrelativesizeintermsofGDP.The37countriesarelisted
inthemethodologyandrepresent89%ofglobalGDP.Additionaldataonthesizeofeachcountryisavailableatwww.gcmsurvey.com.
AMERICAS EMEA ASIA/PACIFIC
GCM Universe 2804(26%) 4956(47%) 2859(27%)
Large Organisations 1250(32%) 1534(40%) 1080(28%)
Financial Institutions 1554(23%) 3422(51%) 1779(26%)
GDP 35% 34% 31%
Thechartsonthefollowingpageshowthejobtitleprofileforthetwogroupstogetherwiththeirareasofresponsibility.Additional
informationisavailableonthescaleofcapitalraising,internationalsalesandotherareas.Thisisfollowedbyheadlinemediadataandthe
methodology.Furtheranalysiscanbeobtainedfromthesurveysponsorsorpurchasers.
global capital markets
GlobalCapitalMarkets2011
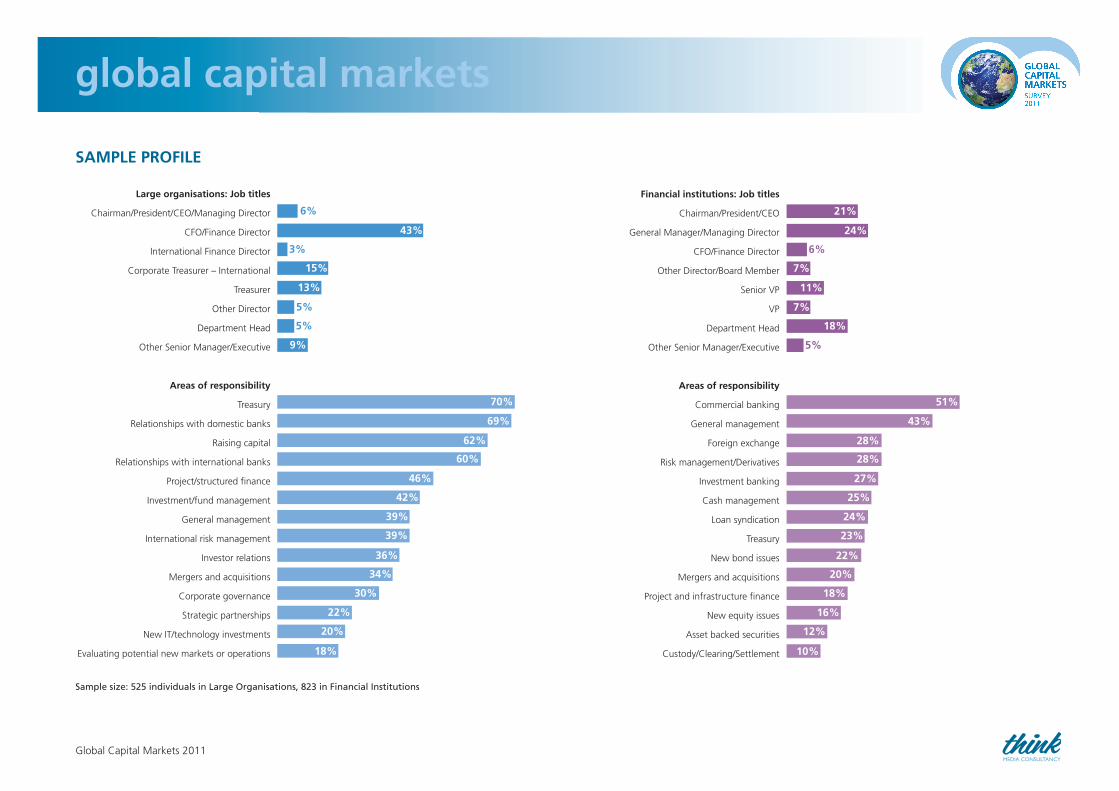
Large organisations: Job titles
Chairman/President/CEO/ManagingDirector
CFO/FinanceDirector
InternationalFinanceDirector
CorporateTreasurer–International
Treasurer
OtherDirector
DepartmentHead
OtherSeniorManager/Executive
Areas of responsibility
Treasury
Relationshipswithdomesticbanks
Raisingcapital
Relationshipswithinternationalbanks
Project/structured finance
Investment/fundmanagement
General management
Internationalriskmanagement
Investorrelations
Mergersandacquisitions
Corporategovernance
Strategicpartnerships
NewIT/technologyinvestments
Evaluatingpotentialnewmarketsoroperations
13%
43%
3%
15%
5%
5%
69%
70%
62%
60%
46%
42%
39%
39%
36%
9%
6%
34%
30%
20%
22%
18%
Financial institutions: Job titles
Chairman/President/CEO
GeneralManager/ManagingDirector
CFO/FinanceDirector
OtherDirector/BoardMember
SeniorVP
VP
DepartmentHead
OtherSeniorManager/Executive
Areas of responsibility
Commercialbanking
General management
Foreignexchange
Riskmanagement/Derivatives
Investmentbanking
Cashmanagement
Loansyndication
Treasury
Newbondissues
Mergersandacquisitions
Projectandinfrastructure finance
Newequityissues
Assetbackedsecurities
Custody/Clearing/Settlement
11%
24%
6%
7%
7%
18%
43%
51%
28%
28%
27%
25%
23%
24%
22%
5%
21%
20%
18%
12%
16%
10%
SAMPLE PROFILE
global capital markets
GlobalCapitalMarkets2011
Sample size: 525 individuals in Large Organisations, 823 in Financial Institutions
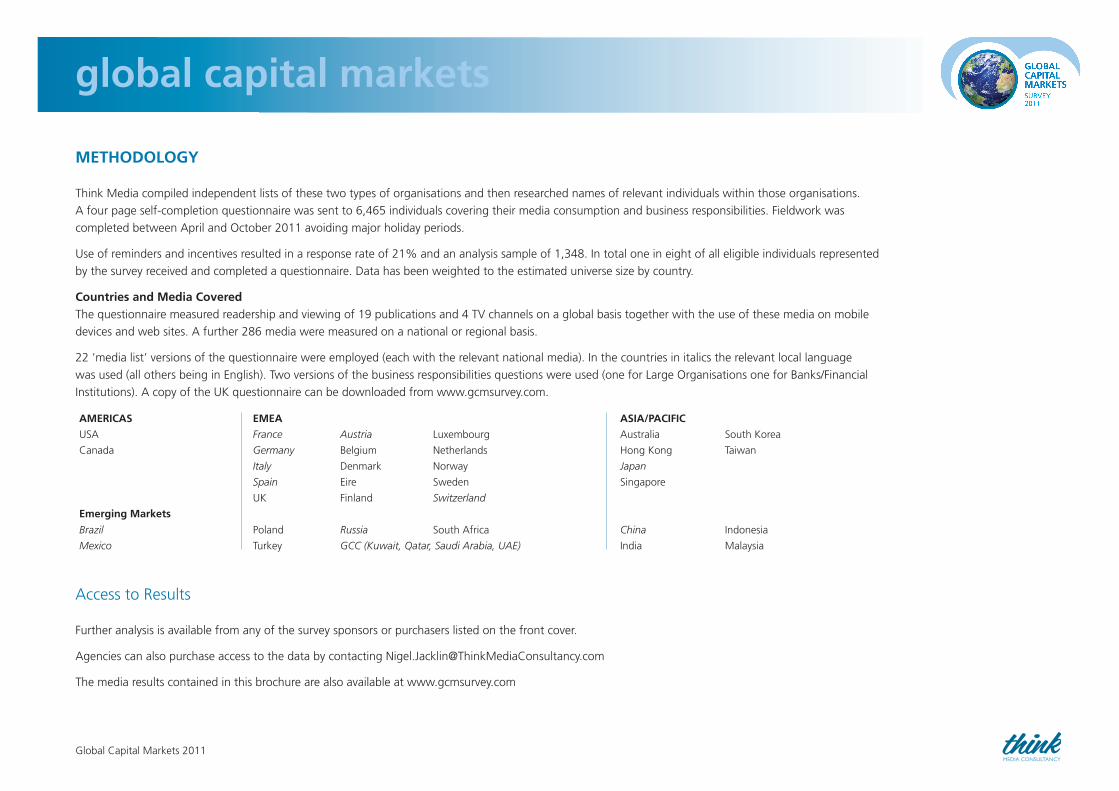
METHODOLOGY
ThinkMediacompiledindependentlistsofthesetwotypesoforganisationsandthenresearchednamesofrelevantindividualswithinthoseorganisations.
Afourpageself-completionquestionnairewassentto6,465individualscoveringtheirmediaconsumptionandbusinessresponsibilities.Fieldworkwas
completedbetweenAprilandOctober2011avoidingmajorholidayperiods.
Useofremindersandincentivesresultedinaresponserateof21%andananalysissampleof1,348.Intotaloneineightofalleligibleindividualsrepresented
bythesurveyreceivedandcompletedaquestionnaire.Datahasbeenweightedtotheestimateduniversesizebycountry.
Countries and Media CoveredThequestionnairemeasuredreadershipandviewingof19publicationsand4TVchannelsonaglobalbasistogetherwiththeuseofthesemediaonmobile
devicesandwebsites.Afurther286mediaweremeasuredonanationalorregionalbasis.
22’medialist’versionsofthequestionnairewereemployed(eachwiththerelevantnationalmedia).Inthecountriesinitalicstherelevantlocallanguage
wasused(allothersbeinginEnglish).Twoversionsofthebusinessresponsibilitiesquestionswereused(oneforLargeOrganisationsoneforBanks/Financial
Institutions).AcopyoftheUKquestionnairecanbedownloadedfromwww.gcmsurvey.com.
AMERICAS EMEA ASIA/PACIFIC
USA France Austria Luxembourg Australia SouthKorea
Canada Germany Belgium Netherlands HongKong Taiwan
Italy Denmark Norway Japan
Spain Eire Sweden Singapore
UK Finland Switzerland
Emerging Markets
Brazil Poland Russia SouthAfrica China Indonesia
Mexico Turkey GCC (Kuwait, Qatar, Saudi Arabia, UAE) India Malaysia
AccesstoResults
Furtheranalysisisavailablefromanyofthesurveysponsorsorpurchaserslistedonthefrontcover.
AgenciescanalsopurchaseaccesstothedatabycontactingNigel.Jacklin@ThinkMediaConsultancy.com
Themediaresultscontainedinthisbrochurearealsoavailableatwww.gcmsurvey.com
global capital markets
GlobalCapitalMarkets2011
global capital markets
GlobalCapitalMarkets2011
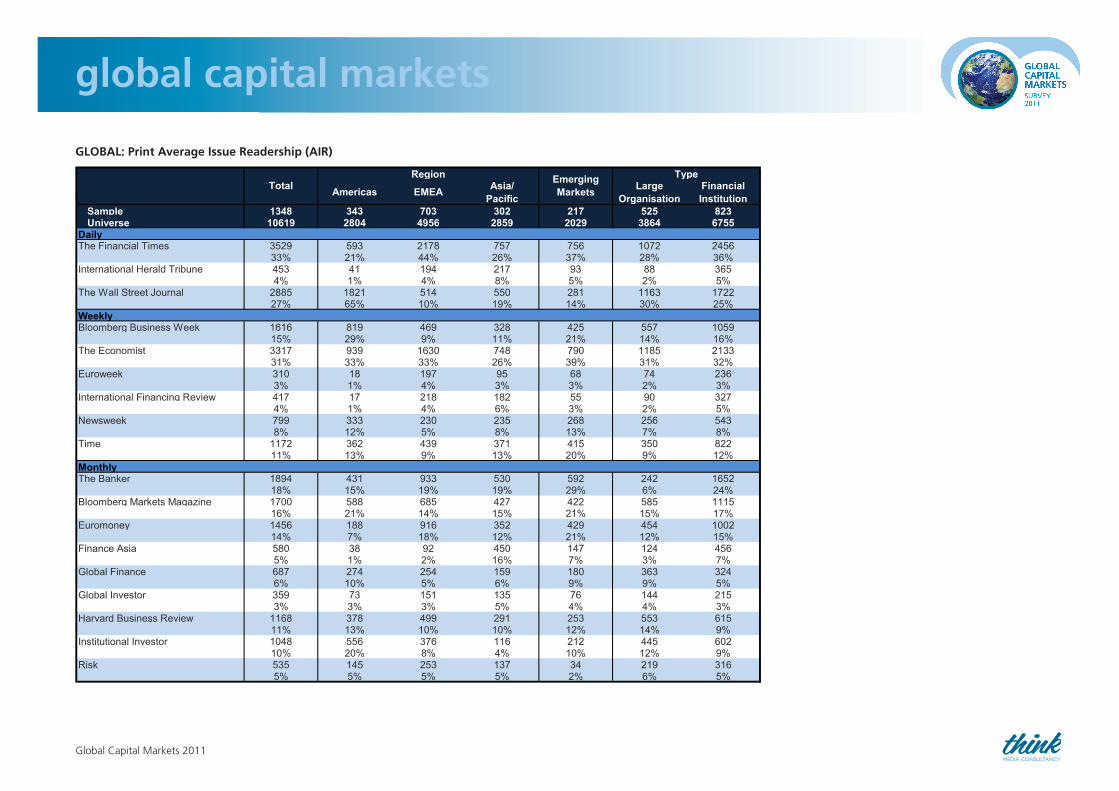
GLOBAL: Print Average Issue Readership (AIR)
Americas EMEA Asia/Pacific
Large Organisation
Financial Institution
Sample 1348 343 703 302 217 525 823Universe 10619 2804 4956 2859 2029 3864 6755
The Financial Times 3529 593 2178 757 756 1072 245633% 21% 44% 26% 37% 28% 36%
International Herald Tribune 453 41 194 217 93 88 3654% 1% 4% 8% 5% 2% 5%
The Wall Street Journal 2885 1821 514 550 281 1163 172227% 65% 10% 19% 14% 30% 25%
Bloomberg Business Week 1616 819 469 328 425 557 105915% 29% 9% 11% 21% 14% 16%
The Economist 3317 939 1630 748 790 1185 213331% 33% 33% 26% 39% 31% 32%
Euroweek 310 18 197 95 68 74 2363% 1% 4% 3% 3% 2% 3%
International Financing Review 417 17 218 182 55 90 3274% 1% 4% 6% 3% 2% 5%
Newsweek 799 333 230 235 268 256 5438% 12% 5% 8% 13% 7% 8%
Time 1172 362 439 371 415 350 82211% 13% 9% 13% 20% 9% 12%
The Banker 1894 431 933 530 592 242 165218% 15% 19% 19% 29% 6% 24%
Bloomberg Markets Magazine 1700 588 685 427 422 585 111516% 21% 14% 15% 21% 15% 17%
Euromoney 1456 188 916 352 429 454 100214% 7% 18% 12% 21% 12% 15%
Finance Asia 580 38 92 450 147 124 4565% 1% 2% 16% 7% 3% 7%
Global Finance 687 274 254 159 180 363 3246% 10% 5% 6% 9% 9% 5%
Global Investor 359 73 151 135 76 144 2153% 3% 3% 5% 4% 4% 3%
Harvard Business Review 1168 378 499 291 253 553 61511% 13% 10% 10% 12% 14% 9%
Institutional Investor 1048 556 376 116 212 445 60210% 20% 8% 4% 10% 12% 9%
Risk 535 145 253 137 34 219 3165% 5% 5% 5% 2% 6% 5%
Monthly
TotalRegion Emerging
Markets
Type
Daily
Weekly
GLOBAL: Print Average Issue Readership (AIR)
global capital markets
GlobalCapitalMarkets2011
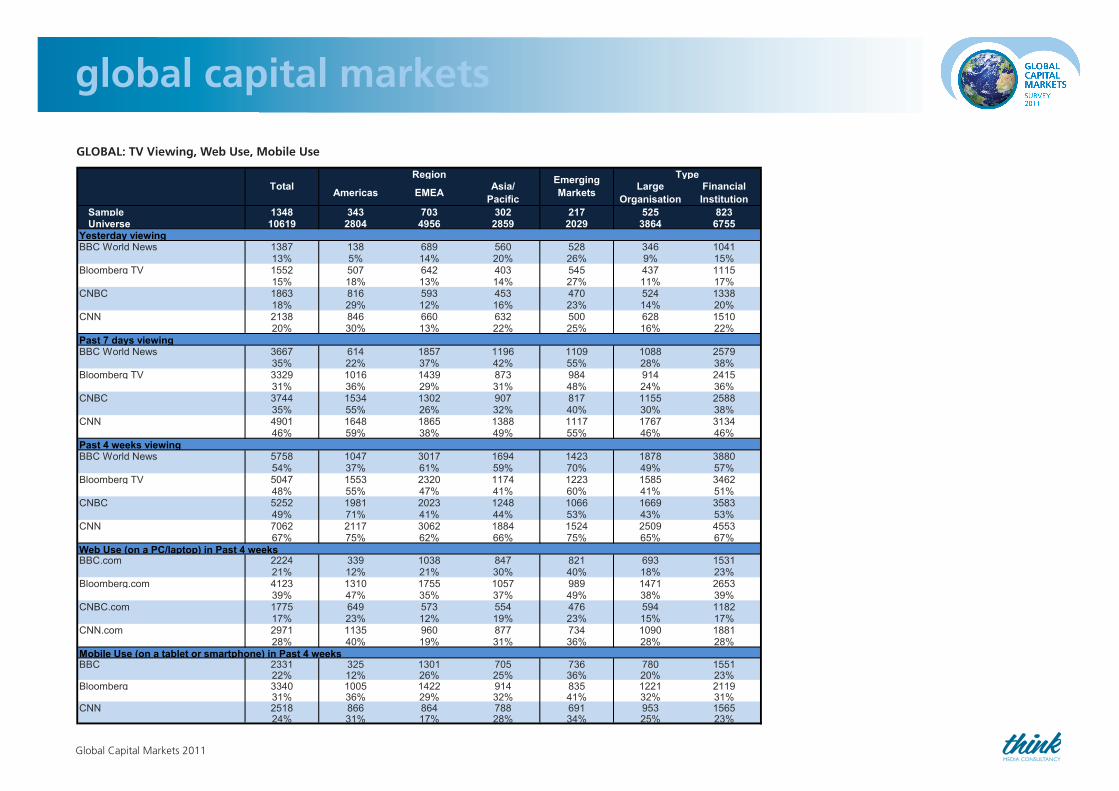
GLOBAL: TV Viewing, Web Use, Mobile Use
Americas EMEA Asia/Pacific
Large Organisation
Financial Institution
Sample 1348 343 703 302 217 525 823Universe 10619 2804 4956 2859 2029 3864 6755
BBC World News 1387 138 689 560 528 346 104113% 5% 14% 20% 26% 9% 15%
Bloomberg TV 1552 507 642 403 545 437 111515% 18% 13% 14% 27% 11% 17%
CNBC 1863 816 593 453 470 524 133818% 29% 12% 16% 23% 14% 20%
CNN 2138 846 660 632 500 628 151020% 30% 13% 22% 25% 16% 22%
BBC World News 3667 614 1857 1196 1109 1088 257935% 22% 37% 42% 55% 28% 38%
Bloomberg TV 3329 1016 1439 873 984 914 241531% 36% 29% 31% 48% 24% 36%
CNBC 3744 1534 1302 907 817 1155 258835% 55% 26% 32% 40% 30% 38%
CNN 4901 1648 1865 1388 1117 1767 313446% 59% 38% 49% 55% 46% 46%
BBC World News 5758 1047 3017 1694 1423 1878 388054% 37% 61% 59% 70% 49% 57%
Bloomberg TV 5047 1553 2320 1174 1223 1585 346248% 55% 47% 41% 60% 41% 51%
CNBC 5252 1981 2023 1248 1066 1669 358349% 71% 41% 44% 53% 43% 53%
CNN 7062 2117 3062 1884 1524 2509 455367% 75% 62% 66% 75% 65% 67%
BBC.com 2224 339 1038 847 821 693 153121% 12% 21% 30% 40% 18% 23%
Bloomberg.com 4123 1310 1755 1057 989 1471 265339% 47% 35% 37% 49% 38% 39%
CNBC.com 1775 649 573 554 476 594 118217% 23% 12% 19% 23% 15% 17%
CNN.com 2971 1135 960 877 734 1090 188128% 40% 19% 31% 36% 28% 28%
BBC 2331 325 1301 705 736 780 155122% 12% 26% 25% 36% 20% 23%
Bloomberg 3340 1005 1422 914 835 1221 211931% 36% 29% 32% 41% 32% 31%
CNN 2518 866 864 788 691 953 156524% 31% 17% 28% 34% 25% 23%
Total
Past 7 days viewing
Past 4 weeks viewing
Mobile Use (on a tablet or smartphone) in Past 4 weeks
Web Use (on a PC/laptop) in Past 4 weeks
Region Emerging Markets
Type
Yesterday viewing
GLOBAL: TV Viewing, Web Use, Mobile Use
global capital markets
GlobalCapitalMarkets2011
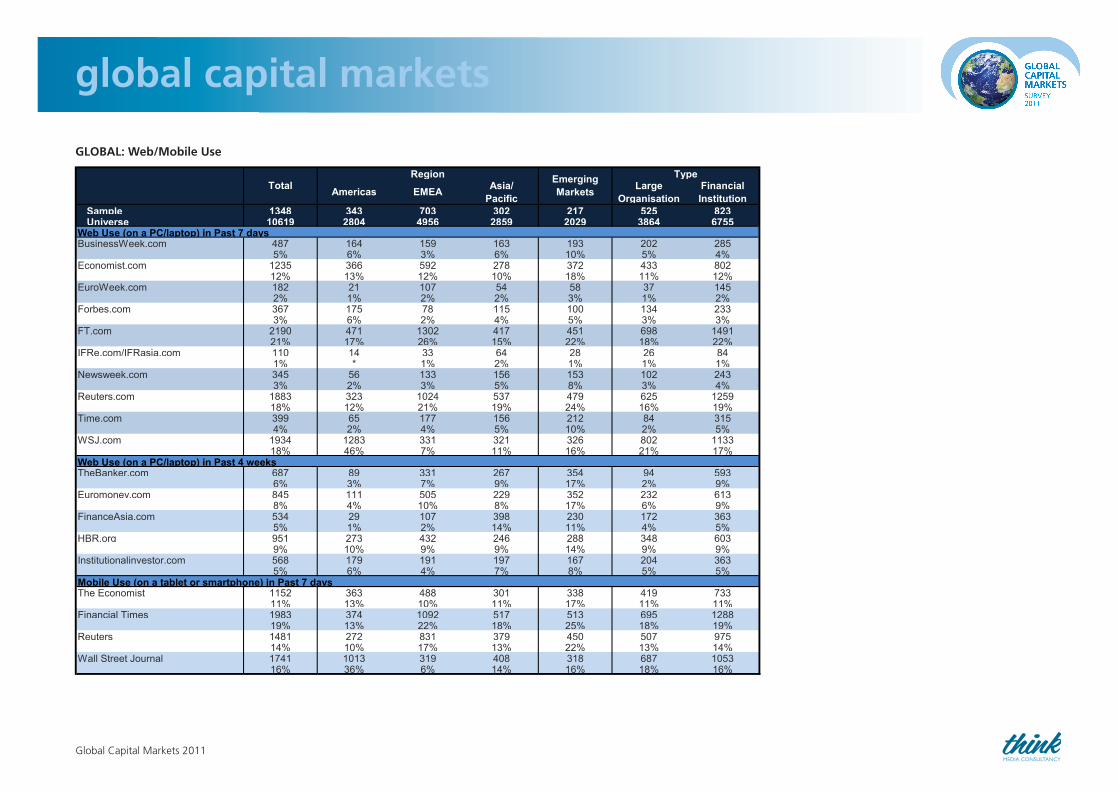
GLOBAL: Web/Mobile Use
Americas EMEA Asia/Pacific
Large Organisation
Financial Institution
Sample 1348 343 703 302 217 525 823Universe 10619 2804 4956 2859 2029 3864 6755
BusinessWeek.com 487 164 159 163 193 202 2855% 6% 3% 6% 10% 5% 4%
Economist.com 1235 366 592 278 372 433 80212% 13% 12% 10% 18% 11% 12%
EuroWeek.com 182 21 107 54 58 37 1452% 1% 2% 2% 3% 1% 2%
Forbes.com 367 175 78 115 100 134 2333% 6% 2% 4% 5% 3% 3%
FT.com 2190 471 1302 417 451 698 149121% 17% 26% 15% 22% 18% 22%
IFRe.com/IFRasia.com 110 14 33 64 28 26 841% * 1% 2% 1% 1% 1%
Newsweek.com 345 56 133 156 153 102 2433% 2% 3% 5% 8% 3% 4%
Reuters.com 1883 323 1024 537 479 625 125918% 12% 21% 19% 24% 16% 19%
Time.com 399 65 177 156 212 84 3154% 2% 4% 5% 10% 2% 5%
WSJ.com 1934 1283 331 321 326 802 113318% 46% 7% 11% 16% 21% 17%
TheBanker.com 687 89 331 267 354 94 5936% 3% 7% 9% 17% 2% 9%
Euromoney.com 845 111 505 229 352 232 6138% 4% 10% 8% 17% 6% 9%
FinanceAsia.com 534 29 107 398 230 172 3635% 1% 2% 14% 11% 4% 5%
HBR.org 951 273 432 246 288 348 6039% 10% 9% 9% 14% 9% 9%
Institutionalinvestor.com 568 179 191 197 167 204 3635% 6% 4% 7% 8% 5% 5%
The Economist 1152 363 488 301 338 419 73311% 13% 10% 11% 17% 11% 11%
Financial Times 1983 374 1092 517 513 695 128819% 13% 22% 18% 25% 18% 19%
Reuters 1481 272 831 379 450 507 97514% 10% 17% 13% 22% 13% 14%
Wall Street Journal 1741 1013 319 408 318 687 105316% 36% 6% 14% 16% 18% 16%
Mobile Use (on a tablet or smartphone) in Past 7 days
Web Use (on a PC/laptop) in Past 7 days
Web Use (on a PC/laptop) in Past 4 weeks
TotalRegion Emerging
Markets
Type
GLOBAL: Web/Mobile Use