Embed Size (px)
Citation preview

2011;71:19-28. Published online January 2, 2011.Cancer Res Emmanuelle di Tomaso, Matija Snuderl, Walid S. Kamoun, et al. EscapePatients: Lack of ''Rebound'' Revascularization as Mode of Glioblastoma Recurrence after Cediranib Therapy in
Updated Version 10.1158/0008-5472.CAN-10-2602doi:
Access the most recent version of this article at:
MaterialSupplementary
http://cancerres.aacrjournals.org/content/suppl/2010/12/27/71.1.19.DC1.htmlAccess the most recent supplemental material at:
Cited Articles http://cancerres.aacrjournals.org/content/71/1/19.full.html#ref-list-1
This article cites 29 articles, 11 of which you can access for free at:
E-mail alerts related to this article or journal.Sign up to receive free email-alerts
SubscriptionsReprints and
[email protected] Department atTo order reprints of this article or to subscribe to the journal, contact the AACR
To request permission to re-use all or part of this article, contact the AACR Publications
American Association for Cancer Research Copyright © 2011 on January 27, 2011cancerres.aacrjournals.orgDownloaded from
DOI:10.1158/0008-5472.CAN-10-2602

Clinical Studies
Glioblastoma Recurrence after Cediranib Therapy inPatients: Lack of "Rebound" Revascularizationas Mode of Escape
Emmanuelle di Tomaso1,6, Matija Snuderl2, Walid S. Kamoun1, Dan G. Duda1, Pavan K. Auluck2, Ladan Fazlollahi2,Ovidiu C. Andronesi3, Matthew P. Frosch2, Patrick Y. Wen4, Scott R. Plotkin5, E. Tessa Hedley-Whyte2,A. Gregory Sorensen3, Tracy T. Batchelor5, and Rakesh K. Jain1
AbstractRecurrent glioblastomas (rGBM) invariably relapse after initial response to anti-VEGF therapy. There are 2
prevailing hypotheses on how these tumors escape antiangiogenic therapy: switch to VEGF-independentangiogenic pathways and vessel co-option. However, direct evidence in rGBM patients is lacking. Thus, wecompared molecular, cellular, and vascular parameters in autopsy tissues from 5 rGBM patients who had beentreated with the pan-VEGF receptor tyrosine kinase inhibitor cediranib versus 7 patients who received notherapy or chemoradiation but no antiangiogenic agents. After cediranib treatment, endothelial proliferationand glomeruloid vessels were decreased, and vessel diameters and perimeters were reduced to levels comparableto the unaffected contralateral brain hemisphere. In addition, tumor endothelial cells expressed molecularmarkers specific to the blood–brain barrier, indicative of a lack of revascularization despite the discontinuationof therapy. Surprisingly, in cediranib-treated GBM, cellular density in the central area of the tumor was lowerthan in control cases and gradually decreased toward the infiltrating edge, indicative of a change in growthpattern of rGBMs after cediranib treatment, unlike that after chemoradiation. Finally, cediranib-treated GBMsshowed high levels of PDGF-C (platelet-derived growth factor C) and c-Met expression and infiltration bymyeloid cells, which may potentially contribute to resistance to anti-VEGF therapy. In summary, we show thatrGBMs switch their growth pattern after anti-VEGF therapy—characterized by lower tumor cellularity in thecentral area, decreased pseudopalisading necrosis, and blood vessels with normal molecular expression andmorphology—without a second wave of angiogenesis. Cancer Res; 71(1); 19–28. �2011 AACR.
Introduction
Abundant angiogenesis with microvascular proliferationand tumor necrosis caused by severe hypoxia are diagnosticcriteria for glioblastoma (GBM; refs. 1–4). GBM vessels areglomeruloid, dilated, and tortuous, with abnormalities inpericyte coverage and basement membrane, which leads toabnormal vascular function (e.g., increased permeability; refs.
2, 5–7). GBM angiogenesis is driven mainly by VEGF-A(referred to as VEGF here onward) signaling via its tyrosinekinase receptor VEGFR2/KDR (8–10). Blockade of VEGF withbevacizumab (a VEGF-specific antibody; Genentech) or ofVEGF receptors with the pan-VEGFR tyrosine kinase inhibitorcediranib (AstraZeneca) was associated with rates of objectiveradiographic responses in phase II trials in patients withrecurrent GBM (rGBM; refs. 11, 12).
In both preclinical and clinical settings, the benefits ofcediranib monotherapy for gliomas are typically transientand followed by an apparent increase in tumor burden (11,13). In addition, imaging studies suggest that GBM progres-sion may not be visible on contrast-enhanced MRI (14, 15).Moreover, preclinical studies suggest a "wave" of tumorrevascularization after discontinuation of anti-VEGF therapy,which might accelerate tumor relapse (16, 17).
To gain insight into the changes that occur in rGBMs afteranti-VEGF therapy, we analyzed brain tissues obtained atautopsy.We studied the central area versus the infiltrating edgeof rGBM tissues from patients treated with cediranib at recur-rence after surgery, chemotherapy, and radiation. As a control,we studied in a similarmanner the autopsy tissues fromagroupof rGBM patients who received either no treatment or surgeryand/or chemo- and radiotherapy. In addition, we explored the
Authors' Affiliations: Departments of 1Radiation Oncology and 2Pathol-ogy (Neuropathology), and 3Martinos Center for Biomedical Imaging,Massachusetts General Hospital & Massachusetts Institute of Technol-ogy, 4Department of Adult Oncology, Dana-Farber Cancer Institute, and5Stephen E. & Catherine Pappas Center for Neuro-Oncology, Departmentof Neurology, Massachusetts General Hospital, Harvard Medical School,Boston, Massachusetts, 6Current affiliation: Novartis Institutes for BioMe-dical Research, Cambridge, MA.
Note: Supplementary data for this article are available at Cancer ResearchOnline (http://cancerres.aacrjournals.org/).
E. di Tomaso, M. Snuderl, and W.S. Kamoun contributed equally to thisstudy.
Corresponding Author: Rakesh K. Jain, Steele Laboratory, COX-734,Massachusetts General Hospital, 100 Blossom Street, Boston, MA 02114.Phone: 617-726-4083; Fax: 617-724-1819.E-mail: [email protected]
doi: 10.1158/0008-5472.CAN-10-2602
�2011 American Association for Cancer Research.
CancerResearch
www.aacrjournals.org 19
American Association for Cancer Research Copyright © 2011 on January 27, 2011cancerres.aacrjournals.orgDownloaded from
DOI:10.1158/0008-5472.CAN-10-2602

changes inmolecular, cellular,morphologicprofiles, andmicro-environmental factors that might be responsible for diffuseinfiltrating behavior and resistance to cediranib therapy.
Materials and Methods
Tissue specimensFormalin-fixed, paraffin-embedded (FFPE) samples from 5
patients with rGBM—enrolled in a phase II clinical trial ofcediranib (11, 13)—underwent postmortem examination.These samples were compared with (i) the initial diagnosticparaffin blocks (available from 4/5 rGBM patients) prior tocediranib therapy and (ii) 7 autopsy samples from GBMpatients who had received either no treatment (n ¼ 1) orchemo- and radiation therapy (n ¼ 6). All samples wereobtained from the Neuropathology Laboratory at Massachu-setts General Hospital after obtaining informed consent andInstitutional Review Board (IRB) approval.
Histologic analysisFor all analyses, tissues were selected to contain macro-
scopically identifiable rGBM and its infiltrative edge in thesame block. These FFPE samples were stained with hematox-ylin and eosin (H&E). In this study, the end of the block(section) that contains tumor with no recognizable normalintervening brain structure is referred to as the "central area"and the "infiltrative area" is the opposite end of the block andincludes identifiable brain structures and infiltrating glioma.Each autopsy (average 20 blocks per case) was reviewed by 2neuropathologists (M.S., P.K.A.) to ensure that blocks selectedfor the study are morphologically representative of the entiretumor. Samples were stained with standard H&E. The entireH&E slide was scanned using a Scanscope scanner (AperioTechnologies). Regions of interest were selected at the inter-face of tumor center and infiltrative edge. Cellular density wasestimated as the fraction of surface area occupied by tumornuclei (highlighted by hematoxylin) in the central and theinfiltrative regions using an in-house threshold-based segmen-tation of the nuclei in H&E images using Matlab software (TheMathWorks). Foci of pseudopalisading necrosis, that is, denseaccumulation of tumor nuclei surrounding foci of necrosisand used as diagnostic criteria of glioblastoma by WHOclassification (18) were counted in 30 high-power fields(400� magnification) in the central area of the tumor.
Immunohistochemical, immunofluorescence, and FISHanalyses
Five micrometer thick FFPE sections were immunostainedfollowing manufacturers’ recommendations and standardprotocols with antibodies against the following antigens:CD31, Ki67 (both prediluted), collagen IV (1:300), and trans-ferrin receptor (CD71, 1:100; all Dako); aSMA (1:100; Sigma);VEGFR2 (1:250), platelet-derived growth factor receptor(PDGFR) a (1:100), and PDGFRb (1:100; all Cell Signaling);CD68 (1:100; Thermo Fischer Scientific); nestin (Abcam;1:500), SDF1a (1:40; Biovision); CXCR4 (1:200) and PDGF-C(1:100; R&D Systems); and MDR1 (1:40; Abcam). For detectionof apoptosis, we used the ApopTag kit (Millipore) following
manufacturer's instructions. Double immunofluorescence (IF)staining was performed for nestin with CD34 (Abcam; EP373Y;dilution 1:100) and for PDGFRb (Cell Signaling; 3169; dilution1:100) with CD34 (Becton Dickinson; clone MY10; dilution1:50). Following secondary antibodies were used: Cy5-conju-gated goat anti-mouse [Invitrogen; Alexa Fluor 647 (AF-647);dilution 1:50] for nestin, fluorescein isothiocyanate (FITC)-conjugated goat anti-rabbit (Vector FI-1000; dilution 1:50) forCD34, FITC-conjugated goat anti-rabbit (Vector FI-1000; dilu-tion 1:50) for PDGFRb and Cy5-conjugated goat anti-mouse(AF-647; dilution 1:50) for CD34. Slides were hybridized withEGFR probe according to a standard FISH protocol.
Semiquantitative analysis of all immunohistochemicalstains was performed by 2 investigators (E.d.T. and M.S.)who independently scored the intensity of staining of allproteins in tumor cells and endothelial cells using a scalefrom 0 (no staining) to 3 (strong staining). Microvessel density,diameter, perimeter, and the surface covered by the vascularspace was estimated in at least 5 random fields of central orinfiltrative area or normal tissue on CD31-stained sectionsusing a customized analysis software tool compatible withImageJ (http://rsb.info.nih.gov/ij/; 100 vessels at 200� mag-nification per section). PDGFRb expression in endothelial cellswas evaluated to detect the "ectopic" expression of this markerin endothelial cells of GBM or other cancers (13, 19). CollagenIV labeling was used to quantify the basement membranethickness (which is abnormally thick in GBMs; ref. 6) using asegmentation algorithm (Matlab). The profile around thevessels was fit to an exponential decay function (1):
F ¼ A½e� ðx=LÞ� þ C ðAÞwhere F is the fraction of collagen IV positive area at x distance(1–10 mm) from the vessels; L is the characteristic length thatcorrelates with basement membrane thickness. A total of1,000 cells counted in the areas of the highest Ki-67 expressionor apoptosis; and indices were calculated as a percentage ofpositive cells.
Statistical analysisData are expressed asmean� SEM. The principal statistical
test was the t test (2-tailed with unequal variance). Weconsidered a value of P < 0.05 to be statistically significant.
Results
Patient characteristics and response to cediranibtreatment
All 5 rGBM patients studied received cediranib (startingdose of 45 mg/kg/d) for at least 2 cycles (range: 56–232 days).Cediranib showed some radiographic activity in all of thesepatients: 4 showed partial response (P1, P2, P4, and P5) and 1 astable disease (P3) based onMRI performed at 28 days (Table 1and Supplementary Fig. S1). At the "end-of-study" MRI scanwhen compared with day 28 MRI, 2 patients showed stabledisease by imaging but were progressing clinically (P1 and P4),2 patients (P2 and P5) showed increased tumor volume by T1post–contrast MRI, and 3 patients (P1, P2, and P4) showedsignificantly increased FLAIR (fluid-attenuated inversion
di Tomaso et al.
Cancer Res; 71(1) January 1, 2011 Cancer Research20
American Association for Cancer Research Copyright © 2011 on January 27, 2011cancerres.aacrjournals.orgDownloaded from
DOI:10.1158/0008-5472.CAN-10-2602
recovery) signal suggestive of infiltrating disease (Table 1 andSupplementary Fig. S1). Four of the 5 patients received noother treatment after cediranib discontinuation. One patient(P2) received further anti-VEGF treatment with bevacizumab(3 cycles) and CPT-11 (irinotecan; 1 cycle). Examination of thespecimen from this patient showed a similar pattern to theother 4, thus data from all 5 patients are presented. The 5rGBM patients had a total survival of 161, 259, 175, 186, and226 days, respectively, measured from the time of the firstcediranib dose. Of interest, the median overall survival (OS) forthe 31 patients enrolled in the phase 2 study was 227 days(177–293 days; ref. 11). Clinicopathologic data of control casesare summarized in Table 2.
Cediranib-treated rGBMs contain structurally normalbrain vesselsThe analysis of rGBM autopsy specimens offered several
lines of evidence that rGBM vessels in cediranib-treatedpatients resembled the normal brain vessels. First, micro-vascular proliferation and glomeruloid vessels, which are
diagnostic features of GBM, were virtually undetectable inautopsy tissues from the patients treated with cediranib(Figs. 1 and 2). As expected, these features were abundantlypresent in all initial biopsies prior to cediranib therapy instudy subjects as well as in control autopsies. Second,the diameter and perimeter of the rGBM vessels in centralareas of the tumors were significantly lower in cediranib-treated autopsy specimens compared with control speci-mens (P < 0.05; Fig. 1) as well as those from the patient'sinitial diagnostic GBM biopsy sample (data not shown). Thediameter and perimeter of the vessels in the infiltrative edgeof GBMs were comparable between the 2 groups and close tothose of vessels of the normal uninvolved brain (Fig. 1).Third, the thickness of basement membrane components—as defined by collagen IV immunostaining—was also sig-nificantly reduced in the central areas of the cediranibtreated compared with control patients (P < 0.05; Fig. 1).Overall, central areas of control cases show broad variabilityof vascular parameters. In contrast, tumor vascular para-meters in cediranib-treated patients are relatively uniform.
Table 1. Patient characteristics: cediranib-treated patients
Patientno.
Daysonstudy
Time betweenlast cediranibdose and death, d
Responseat 28 d
Responseat end ofstudyb
Reason forinterruption
Othertreatment
Age,y
P1 232 27 PR SD Clinical progression No 72P2 226 110a PR PD Suspected progression
by MRICPT-11þ bevacizumab
56
P3 170 16 SD PR Infection No 53P4 133 42 PR SD Clinical progression No 42P5 56 105 PR PD Toxicity No 46
Abbreviations: PR, partial response (drop in >50% of the initial tumor volume); SD, stable disease; PD, progressing disease (increaseby 25%).aAlthough the last dose of cediranib was 110 days prior to death, this patient continued to receive antiangiogenic therapy(bevacizumab) until he died.bRelative response compared with day 28 MRI.
Table 2. Patient characteristics: patients with no antiangiogenic therapy (controls, after review of originalcharts and autopsy reports)
Patient no. Final pathologic diagnosis Treatment Age, y
C1 GBM Radiation (60 Gy), gross total resection 72C2 GBM with prominent
oligodendroglial componentRadiation (dose unknown) and resectiona 59
C3 GBM BCNU 2 cycles, gross total resection 61C4 GBM–NF1 related Gross total resection, chemotherapy
(etoposide, platinum, ARA-c), radiation (50 Gy)18
C5 GBM Resection post–left carotid artery chemotherapy injectiona 16C6 GBM Multiple resections, radiation (55 Gy), chemotherapy
(cisplatin, BCNU)21
C7 GBM No biopsies, no treatment; diagnosis confirmed by autopsy 68
aOriginal charts for patients C2 and C5 could not be obtained. Limited clinical data regarding their treatment were available from theirautopsy reports.
Glioblastoma Growth after VEGF Blockade with Cediranib
www.aacrjournals.org Cancer Res; 71(1) January 1, 2011 21
American Association for Cancer Research Copyright © 2011 on January 27, 2011cancerres.aacrjournals.orgDownloaded from
DOI:10.1158/0008-5472.CAN-10-2602

The presence of structurally normal vessels in the centralarea of cediranib-treated rGBMs might represent anincreased infiltration by the tumors of brain tissue and/orincreased co-option of normal vessels.
Collectively, these morphometric analyses indicate thatvessels within cediranib-treated tumors lack characteristicsof abnormal GBM vasculature despite cessation of the anti-angiogenic treatment.
250
A
B
C
D
30 100
80
60
40
20
0
25
20
15
10
5
0
200
150
100
50
0Central
Control
Vessel perimeter (μm) Vessel diameter (μm)Microvascular density(# vessels per field)
CediranibControlCediranib
ControlCediranib
Infiltrated
Control - central Cediranib - central
Control - central CD31 CD31
CollV
CollV
PDGFRβ PDGFRβ
Control - central
Cediranib - central
Cediranib - central
Normal
5
4
3
2
1
0Central
Control
Basement membrane thichness (μm)
Cediranib
Infiltrated Normal
Central Infiltrated Normal Central Infiltrated Normal
Figure 1. Vascular changes aftercediranib treatment. A,quantification of vessel perimetersand diameters in central andinfiltrative areas of tumor as wellas normal brain tissue in controlpatients or after cediranib byCD31 immunohistochemistryshows broad variability in centralareas of control cases and anarrower spectrum after cediranibtreatment. Cediranib-treatedtumor vessels have a significantlysmaller average perimeter anddiameter in the central area (P ¼0.02), very close to that of normalbrain capillaries. Quantification ofmicrovascular density shows thatcediranib-treated tumors have asimilar microvascular density inthe central and infiltrating areasand that these are similar to themicrovascular density ofuninvolved brain. Microvasculardensity of control cases has abroader variation in the central andinfiltrated areas. B, microvascularproliferation typical of GBMvessels was abundant in allcontrol cases (black arrow);however it was decreased incediranib-treated patients (arrowpoints at the most abnormalvessel lining). Periodic and Schiffstaining and CD31immunohistochemistry highlightabnormal vascular morphology. C,cediranib-treated tumor vessels inthe central areas have a thinnerbasement membrane (P ¼ 0.03),similar to normal vessels[collagen IV (Coll IV)immunohistochemistry].Immunohistochemistry forcollagen IV shows markedthickening of the basementmembranes in the central are ofthe control tumors and thinnerbasement membranes of thevessels in the cediranib-treatedtumors. D, immunohistochemistryhighlights expression of PDGFRbby the endothelial cells indiagnostic biopsy tissue from 1 ofthe patients (i; arrow). Autopsytissue from the same patient aftercediranib therapy (ii) displayedmostly PDGFRb-negative vessels(endothelium unstained, redarrow) whereas the perivascularcells are positive for PDGFRb asexpected for normal brain vessels(black arrow). Scale bar, 50 mm.
di Tomaso et al.
Cancer Res; 71(1) January 1, 2011 Cancer Research22
American Association for Cancer Research Copyright © 2011 on January 27, 2011cancerres.aacrjournals.orgDownloaded from
DOI:10.1158/0008-5472.CAN-10-2602

Figure 2. Cell density in rGBMsafter cediranib treatment. A,GBMs without previousantiangiogenic treatment (control)have a broad spectrum of celldensity within the center of thetumor with a sharp drop in nucleardensity in the infiltrating edge,where nuclear density is lessvariable. Cediranib-treatedpatients show overall decreasedcell density in the central area ofthe tumor compared with thepatients not treated withantiangiogenic agent, with a moregradual and less steep drop of celldensity in the infiltrating edge. B,low-power and high-power(inserts) H&E examination andnuclear density heat map revealthat central areas of the controlcases have strikingly high nucleardensity, abundant vascularproliferation (top left insert) andpseudopalisading necrosis(arrowheads). In cediranib-treatedtumors, infiltrating and centralareas have a similar nucleardensity (scale bar, 100 mm). C, Ki-67 index and apoptotic index inthe central areas did not showdifference proliferation rate or celldeath between control cases andcediranib-treated cases.Cediranib-treated rGBMs showedsignificantly lower number of fociwith pseudopalisading necrosis inthe central area of the tumor(P < 0.001).
10
A
B
C
8
6
4
Cel
l den
sity
(10
3 ce
lls/m
m2 )
Cell density (103 cells/mm2)
Apoptosis indexProliferation index
70 8 90 P < 0.001
80
70
60
50
(# p
er 3
0 hi
gh-p
ower
fiel
ds)
30
20
10
0
40
7
6
5
4
3
2
1
0
60
50
40
% T
umor
cel
ls
% T
umor
cel
ls
30
20
10
0
Pseudopalisading necrosis
2
0−2 −1 0
Distance from tumor edge (mm)
Control
0 1 2 3 4 5 6 7 8 9 10
Cediranib
Control
C1C2C3
P1
P2P3
P4P5
C4C5C6C7
Cediranib
Control Cediranib Control Cediranib Control Cediranib
Distance from tumor edge (mm)1 2 −2 −1 0 1 2
Glioblastoma Growth after VEGF Blockade with Cediranib
www.aacrjournals.org Cancer Res; 71(1) January 1, 2011 23
American Association for Cancer Research Copyright © 2011 on January 27, 2011cancerres.aacrjournals.orgDownloaded from
DOI:10.1158/0008-5472.CAN-10-2602

Cediranib treatment decreases cellular density of rGBMThe rGBMs of patients who had not undergone antiangio-
genic therapy showed marked variability in nuclear densitywithin the central area ranging between 2 and 12� 103 nuclei/mm2. The cellular density in the central area of GBMs incediranib-treated patients was lower and ranged between 2and 5 � 103 cells/mm2; however, this did not reach statisticalsignificance. In the control cases, the density decreased sharplywith transition into the infiltrative area that showed narrowerrange of cell density. In contrast, the cediranib-treated patientsshowed cellular densities in the infiltrative edge that wererelatively similar to those in the central area (Fig. 2). Within1mmaround the tumor edge (�0.5mm),mean nuclear densityin control cases rapidly dropped from 5,301 � 979 to 2,838 �404 nuclei/mm2 whereas mean nuclear density of cediranib-treated cases was 3,202 � 302 nuclei/mm2 in the central areacompared with 2,326� 271 nuclei/mm2 in the infiltrating edge(Fig. 2). Interestingly, one patient with the longest intervalbetween the last dose of cediranib and death (P5; 105 days) hasthe cellular density curve pattern similar to the control caseswhereas patients with shorter interval between the last dose ofcediranib and death (P1, P3, and P4; 27, 16, and 42 days,respectively) and the patient who received bevacizumab untilhis death (P2) showed relatively flat curves.
There was no difference in proliferation or apoptosis bothin the central area and infiltrating edge between cediranib-treated and control GBMs (Fig. 2). Control cases showedsignificantly higher number of foci with classical pseudopa-lisading necrosis than cediranib-treated cases (P < 0.001;Fig. 2). Therefore, anti-VEGF therapy seems to decreasecellular density in the central area but not the infiltrativeedge. Because the proliferation and apoptosis rates andnecrosis are not increased after cediranib therapy, this indi-cates either increased infiltration into the normal brain or thatcediranib had direct antitumor effect leading to decrease ofcellular density, which was not restored after discontinuationof the treatment.
Molecular changes in endothelial cells in cediranib-treated rGBM
In 4 of 5 cediranib-treated autopsy specimens, PDGFRa andPDGFRb became undetectable in endothelial cells and in 1case, PDGFRb expression was detectable only in a fraction ofendothelial cells in the central area (Fig. 1D). Specificity ofPDGFRb expression by endothelial cells was confirmed bydouble immunohistochemical staining and double immuno-fluorescent staining using the endothelial markers CD31 andCD34, respectively, and FISH for EGFR in GBM cells (Supple-mentary Fig. S2). In addition, VEGFR2 immunoreactivitydecreased from a staining intensity of the 3þ (scored in theoriginal biopsies) to an intensity of 1þ (data not shown). Allcontrol specimens displayed a strong expression of all 3 recep-tors. Of particular interest, these changes in endothelial phe-notype were accompanied by CD71 expression [transferrinreceptor, a marker of a functional blood–brain barrier (BBB)]supporting the decreased permeability detected by functionalMRI. As expected in the control specimens, CD71 was greatlyreduced in the central area of the tumor. Vessel maturation
markers—angiopoietin 2 and Tie2—were quantified and foundto be generally expressed by the endothelial cells in vessels incentral and infiltrative areas and to a lesser extent in thenormalbrain tissue in both cediranib-treated and control specimen.Expression of MDR, a marker of multidrug resistance, was notchanged after cediranib therapy (Supplementary Table S1).
Cediranib-treated GBMs show high levels of PDGF-C,c-Met, and tumor-infiltrating myeloid cells
Although the number of CD68þ tumor-infiltrating myeloidcells in the infiltrating edge was comparable between controland cediraninb-treated rGBMs, 2 of 5 cediranib-treatedpatients showed high numbers of CD68þ cells in the centralarea of the tumor (P1 and P3; Fig. 3A and B). The rGBMs ofthese 2 patients progressed rapidly and led to rapid death.Cediranib-treated and control tumor cells showed no differ-ence in expression of SDF1a or CXCR4 in the central orinfiltrating areas (Fig. 3C). However, in cediranib-treatedtumors, CXCR4 strongly positive myeloid cells were distrib-uted in the similar pattern as CD68þ cells (Fig. 3D).
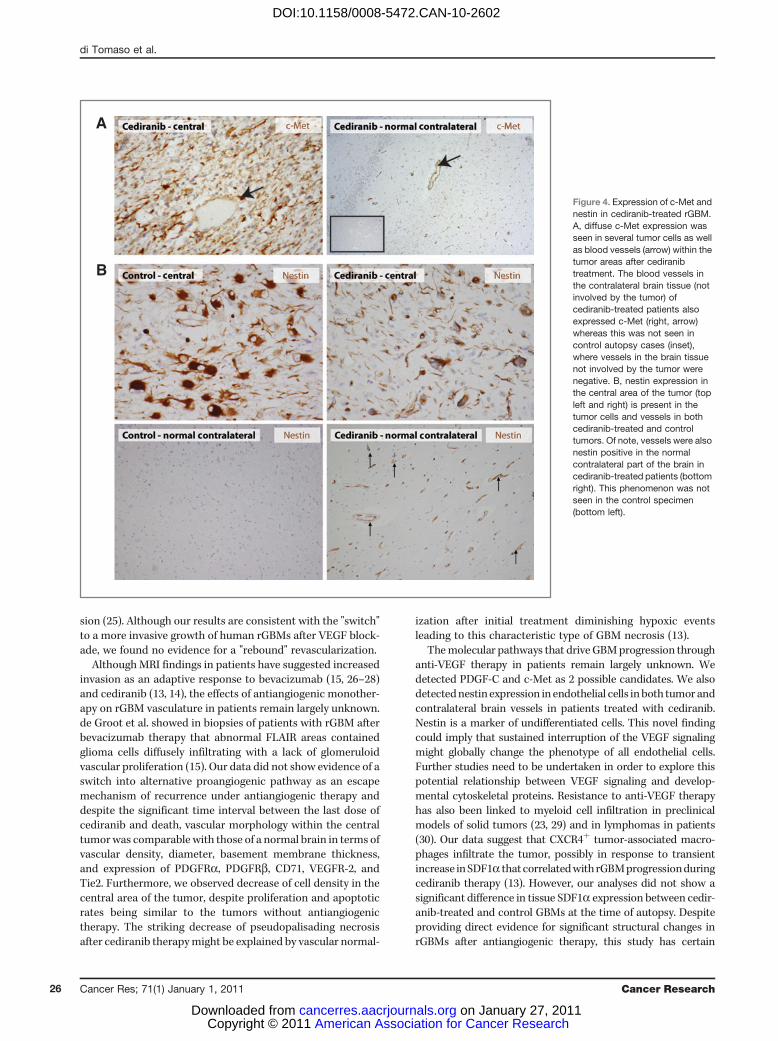
In addition, in the rGBMs from cediranib-treated patients,PDGF-C was expressed at variable levels in all cases examined,both in initial biopsy and autopsy samples. PDGF-C wasfocally expressed also in control cases without cediranibtherapy. Finally, c-Met expression was detectable in all therGBM specimens examined. Both tumor cells in the centralarea of cediranib-treated patients as well as infiltrating cellsshowed expression of c-Met (Fig. 4A). A trend toward higherlevel of expression of c-Met and higher number of positivecells was observed for the cediranib-treated specimens whencompared with the control specimens, consistent with thepotential role of the HGF/c-Met pathway in glioma progres-sion (20). Finally, we measured the expression of the devel-opmental intermediate filament, nestin. Tumor cells andendothelial cells in the central areas were similarly positivefor nestin in cediranib-treated and untreated tumors. Inter-estingly, endothelial cells in the contralateral, uninvolved partof the brain were strongly positive for nestin in cediranib-treated patients but not in control brain tissues (Fig. 4B).Expression of nestin by endothelial cells was confirmed bydouble immunohistochemical staining and double immuno-fluorescent staining with the endothelial markers CD31 andCD34, respectively (Supplementary Fig. S2).
Discussion
Proinfiltrating consequences of antiangiogenic therapy havebeen suggested in a number of preclinical studies of GBM (21,22). Rubenstein et al. showed in animal models that blockingVEGF signaling by an antibody increases co-option and growthof satellite tumors (21) and Du et al. showed that ablation ofhypoxia-inducible factor 1 alpha (HIF1a) signaling leads to co-option and deep invasion of gliomas in mice (23). Casanovaset al. have shown revascularization and increased invasivenessafter anti-VEGFR2 antibody therapy (24). Recently, Paez-Ribeset al. have demonstrated that orthotopically implanted GBMcells under a VEGFR-selective kinase inhibitor treatment aswell as VEGF�/� GBM cells show significantly increased inva-
di Tomaso et al.
Cancer Res; 71(1) January 1, 2011 Cancer Research24
American Association for Cancer Research Copyright © 2011 on January 27, 2011cancerres.aacrjournals.orgDownloaded from
DOI:10.1158/0008-5472.CAN-10-2602

Figure 3. Tumor-infiltratingmyeloid cells, SDF1a and CXCR4in cediranib-treated rGBM. A andB, quantification of CD68þ cellsshow similar numbers ofmacrophages in the central andinfiltrating areas of control cases.Tumors from cediranib-treatedpatients showed a trend towardhigher numbers of macrophagesin the central area, whereas thenumbers of macrophages in theinfiltrating areas are similar tocontrol cases.Immunohistochemistry for CD68also reveals close associationbetween macrophages and bloodvessels (B; inserts). Scale bar,50 mm. C, although we did notobserve difference in expressionof SDF1a (C) or CXCR4 (D) intumor cells, control cases showedfew CXCR4 tumor-associatedmacrophages (D, left; arrow)whereas cediranib-treated tumorcontained many perivascularCXCR4þ cells in the central area ofthe tumor (D, right; arrows).
2.5
2
1.5
1
0.5
0−2 −1 0 1 2 −2 −1 0 1 2
A
B
C
D
CD
68 d
ensi
ty (
103
cells
/mm
2 )
CD68 density (103 cells/mm2)
Distance from tumor edge (mm)
0 0.5 1 1.5 2 2.5 3 3.5 4 4.5 5
Control
C2C3
P1P2P3P4P5
C4
C5C6C7
Cediranib
Distance from tumor edge (mm)
Glioblastoma Growth after VEGF Blockade with Cediranib
www.aacrjournals.org Cancer Res; 71(1) January 1, 2011 25
American Association for Cancer Research Copyright © 2011 on January 27, 2011cancerres.aacrjournals.orgDownloaded from
DOI:10.1158/0008-5472.CAN-10-2602
sion (25). Although our results are consistent with the "switch"to a more invasive growth of human rGBMs after VEGF block-ade, we found no evidence for a "rebound" revascularization.
AlthoughMRI findings in patients have suggested increasedinvasion as an adaptive response to bevacizumab (15, 26–28)and cediranib (13, 14), the effects of antiangiogenic monother-apy on rGBM vasculature in patients remain largely unknown.de Groot et al. showed in biopsies of patients with rGBM afterbevacizumab therapy that abnormal FLAIR areas containedglioma cells diffusely infiltrating with a lack of glomeruloidvascular proliferation (15). Our data did not show evidence of aswitch into alternative proangiogenic pathway as an escapemechanism of recurrence under antiangiogenic therapy anddespite the significant time interval between the last dose ofcediranib and death, vascular morphology within the centraltumorwas comparable with those of a normal brain in terms ofvascular density, diameter, basement membrane thickness,and expression of PDGFRa, PDGFRb, CD71, VEGFR-2, andTie2. Furthermore, we observed decrease of cell density in thecentral area of the tumor, despite proliferation and apoptoticrates being similar to the tumors without antiangiogenictherapy. The striking decrease of pseudopalisading necrosisafter cediranib therapymight be explained by vascular normal-
ization after initial treatment diminishing hypoxic eventsleading to this characteristic type of GBM necrosis (13).
Themolecular pathways that driveGBMprogression throughanti-VEGF therapy in patients remain largely unknown. Wedetected PDGF-C and c-Met as 2 possible candidates. We alsodetectednestin expression in endothelial cells inboth tumor andcontralateral brain vessels in patients treated with cediranib.Nestin is a marker of undifferentiated cells. This novel findingcould imply that sustained interruption of the VEGF signalingmight globally change the phenotype of all endothelial cells.Further studies need to be undertaken in order to explore thispotential relationship between VEGF signaling and develop-mental cytoskeletal proteins. Resistance to anti-VEGF therapyhas also been linked to myeloid cell infiltration in preclinicalmodels of solid tumors (23, 29) and in lymphomas in patients(30). Our data suggest that CXCR4þ tumor-associated macro-phages infiltrate the tumor, possibly in response to transientincrease inSDF1a that correlatedwithrGBMprogressionduringcediranib therapy (13). However, our analyses did not show asignificant difference in tissue SDF1a expression between cedir-anib-treated and control GBMs at the time of autopsy. Despiteproviding direct evidence for significant structural changes inrGBMs after antiangiogenic therapy, this study has certain
A
B
Figure 4. Expression of c-Met andnestin in cediranib-treated rGBM.A, diffuse c-Met expression wasseen in several tumor cells as wellas blood vessels (arrow) within thetumor areas after cediranibtreatment. The blood vessels inthe contralateral brain tissue (notinvolved by the tumor) ofcediranib-treated patients alsoexpressed c-Met (right, arrow)whereas this was not seen incontrol autopsy cases (inset),where vessels in the brain tissuenot involved by the tumor werenegative. B, nestin expression inthe central area of the tumor (topleft and right) is present in thetumor cells and vessels in bothcediranib-treated and controltumors. Of note, vessels were alsonestin positive in the normalcontralateral part of the brain incediranib-treated patients (bottomright). This phenomenon was notseen in the control specimen(bottom left).
di Tomaso et al.
Cancer Res; 71(1) January 1, 2011 Cancer Research26
American Association for Cancer Research Copyright © 2011 on January 27, 2011cancerres.aacrjournals.orgDownloaded from
DOI:10.1158/0008-5472.CAN-10-2602

limitations. The small number of autopsy samples and thenatural heterogeneity of the disease warrants further studiesto confirm these findings. Our study also emphasizes the impor-tance of autopsy evaluation and brain banking as the ultimateclinicopathologic correlation of a drug effect as well as a crucialstep in connecting the clinical and preclinical studies.In summary, our study provides first in-human morpholo-
gic evidence that anti-VEGF treatment changes the growthpattern of rGBMs in patients with decreased microvascularproliferation, loss of pseudopalisading necrosis and diffusespread into the adjacent normal brain (Fig. 5). Our resultsshow that instead of switching to alternative angiogenesispathways, rGBMs exhibit a more infiltrative phenotype afterantiangiogenic therapy.
Addendum
While this article was being processed for publication, two reportsdemonstrated that glioblastoma stem cells undergo endothelial differentia-
tion and form a substantial proportion of the new vessels in gliomas (seeRicci-Vitiani et al., Nature 468, 824–8 2010; and Wang et al., Nature 468,829–33, 2010). These findings describe a new mechanism for tumor vascu-logenesis, which is not blocked by VEGF inhibitors or VEGFR2 silencing.These stem cells are nestin-positive, consistent with our evidence for nestinexpression in glioblastoma- and normal brain-associated endothelial cells inglioblastoma patients previously treated with anti-VEGF agents. In addition,another report of a clinical trial of bevacizumab with chemoradiation showedno apparent improvement in overall survival compared to chemoradiationalone (Lai et al., J Clin Oncol, published online on Dec 6, 2010; doi: 10.1200/JCO.2010.30.2729), which is consistent with the restoration of a blood-brainbarrier phenotype in glioblastoma vessels after anti-VEGF therapy describedin our report.
Disclosure of Potential Conflicts of Interest
E. di Tomaso: Current employment, Novartis. P.Y. Wen: commercialresearch grant, AstraZeneca. A.G. Sorensen: employment, American Collegeof Radiology Image Metrix; commercial research grant, Siemens, MedicalSolutions, General Electric Health Care, Glaxo Smith Kline, Novartis, Exelixis,Schering Plough, AstraZeneca, Takeda/Millennium; consultant/advisoryboard, Epix, Genentech, Regeneron, Millennium, AstraZeneca, Mitsubishi,Merrimack, Olea Medical, Siemens Medical Solutions, Lantheus, and Biogen-Idec. T.T. Batchelor: commercial research grant, Millennium, AstraZeneca,
Tumor cellAbnormal/angiogenic vessel
Normal/co-opted vessel
NeuronThick basement membraneHyperpermeable wall
Hyperproliferated endothelium
Dilated vessel
Viable rim
Pseudopalisadingnecrosis
Necrosisresection cavityFLAIR
Viable rim
Necrosisresection cavity
Thin basamentmembrane
Intact BBB
Con
tral
ater
al b
rain
Normal endothelium
Normal diameter vessel
Infiltrated peritumoralarea
Standard of care(surgery/radiation/
chemotherapy)
Standard of care(surgery/radiation/
chemotherapy)
+Anti-VEGF
therapy
Macrophage
Astrocyte
Endothelial cell
Figure 5.Model of changes in infiltrating behavior of recurrent GBM induced by cediranib: the central area of a viable rGBMhas high cell density with numerousabnormal leaky vessels, numerous foci of pseudopalisading necrosis and tumor cells that infiltrate surrounding normal brain (top). Anti-VEGF therapy (bottom)leads to decreased number of abnormal leaky vessels and lack of pseudopalisading necrosis. Cellular density in the central area is decreased whereas numberof tumor cells in the infiltrating edge is similar to control cases.
Glioblastoma Growth after VEGF Blockade with Cediranib
www.aacrjournals.org Cancer Res; 71(1) January 1, 2011 27
American Association for Cancer Research Copyright © 2011 on January 27, 2011cancerres.aacrjournals.orgDownloaded from
DOI:10.1158/0008-5472.CAN-10-2602

Schering-Plough; speaker honorarium, Roche, Schering-Plough; consultant/advisory board, Acceleron, Exelixis, Imclone, EMD - Serono, Schering-Plough.R.K. Jain: commercial research grant, AstraZeneca, Dyax, MedImmune;speaker honorarium, Genzyme and Alnylam; consultant/advisory board,AstraZeneca, Dyax, Millennium, Regeneron, Genzyme, Morphosys, and Syn-DevRx; ownership interest, SynDevRx. The other authors disclosed no poten-tial conflicts of interest.
Acknowledgments
We thank Dr. M Ancukiewicz for statistical support and Dr. T Padera and SConley for their help during the manuscript preparation. We also thank theMontesi Family for their generous support of this research project.
Grant Support
This study was partially supported by grants from NIH (P01-CA80124,R01-CA115767, R21-CA117079, K24-CA125440, R01-CA129371, P41-RR014075, M01-RR-01066, and Federal Share/NCI Proton Beam ProgramIncome) and from Harvard Clinical and Translational Science CenterGCRC, National Foundation for Cancer Research, and the Montesi FamilyResearch Fund.
The costs of publication of this article were defrayed in part by the paymentof page charges. This article must therefore be hereby marked advertisement inaccordance with 18 U.S.C. Section 1734 solely to indicate this fact.
Received July 19, 2010; revised November 1, 2010; accepted November 4, 2010;published online January 3, 2011.
References1. Jain RK, di Tomaso E, Duda DG, Loeffler JS, Sorensen AG, Batchelor
TT. Angiogenesis in brain tumours. Nature reviews 2007;8:610–22.2. Plate KH, Mennel HD. Vascular morphology and angiogenesis in glial
tumors. Exp Toxicol Pathol 1995;47:89–94.3. Rampling R, Cruickshank G, Lewis A, Fitzsimmon S, Workman P.
Direct measurement of PO2 distribution and bioreductive enzymes inhuman malignant brain tumors. Int J Radiat Oncol Biol Phys1994;29:427–31.
4. Valk PE, Mathis CA, Prados MD, Gilbert JC, Budinger TF. Hypoxia inhuman gliomas: demonstration by PET with fluorine-18-fluoromiso-nidazole. J Nucl Med 1992;33:2133–7.
5. Guo P, Hu B, Gu W, Xu L, Wang D, Huang HJ, et al. Platelet-derivedgrowth factor-B enhances glioma angiogenesis by stimulatingvascular endothelial growth factor expression in tumor endotheliaand by promoting pericyte recruitment. Am J Pathol 2003;162:1083–93.
6. Winkler F, Kozin SV, Tong R, Chae S, Booth MF, Garkavtsev I, et al.Kinetics of vascular normalization by VEGFR2 blockade governs braintumor response to radiation: role of oxygenation, angiopoietin-1 andmatrix metalloproteinases. Cancer Cell 2004;6:553–63.
7. Zagzag D, Hooper A, Friedlander DR, Chan W, Holash J, Wiegand SJ,et al. In situ expression of angiopoietins in astrocytomas identifiesangiopoietin-2 as an early marker of tumor angiogenesis. Exp Neurol1999;159:391–400.
8. Carmeliet P, Jain RK. Angiogenesis in cancer and other diseases.Nature 2000;407:249–57.
9. Holash J, Maisonpierre PC, Compton D, Boland P, Alexander CR,Zagzag D, et al. Vessel cooption, regression, and growth in tumorsmediated by angiopoietins and VEGF. Science 1999;284:1994–8.
10. Shweiki D, Itin A, Soffer D, Keshet E. Vascular endothelial growthfactor induced by hypoxia may mediate hypoxia-initiated angiogen-esis. Nature 1992;359:843–5.
11. Batchelor TT, Duda DG, di Tomaso E, Ancukiewicz M, Plotkin SR,Gerstner E, et al. Phase II study of cediranib, an oral pan-vascularendothelial growth factor receptor tyrosine kinase inhibitor, in patientswith recurrent glioblastoma. J Clin Oncol 2010;28:2817–23.
12. Friedman HS, Prados MD, Wen PY, Mikkelsen T, Schiff D, Abrey LE,et al. Bevacizumab alone and in combination with irinotecan inrecurrent glioblastoma. J Clin Oncol 2009;27:4733–40.
13. Batchelor TT, Sorensen AG, di Tomaso E, Zhang WT, Duda DG,Cohen KS, et al. AZD2171, a pan-VEGF receptor tyrosine kinaseinhibitor, normalizes tumor vasculature and alleviates edema in glio-blastoma patients. Cancer Cell 2007;11:83–95.
14. Gerstner ER, Chen PJ, Wen PY, Jain RK, Batchelor TT, Sorensen G.Infiltrative patterns of glioblastoma spread detected via diffusion MRIafter treatment with cediranib. Neuro Oncol 2010;12:466–72.
15. de Groot JF, Fuller G, Kumar AJ, Piao Y, Eterovic K, Ji Y, et al. Tumorinvasion after treatment of glioblastoma with bevacizumab: radio-graphic and pathologic correlation in humans and mice. Neuro Oncol2010;12:233–42.
16. Mancuso MR, Davis R, Norberg SM, O'Brien S, Sennino B, NakaharaT, et al. Rapid vascular regrowth in tumors after reversal of VEGFinhibition. J Clin Invest 2006;116:2610–21.
17. Ebos JM, Lee CR, Cruz-Munoz W, Bjarnason GA, Christensen JG,Kerbel RS. Accelerated metastasis after short-term treatment with apotent inhibitor of tumor angiogenesis. Cancer Cell 2009;15:232–9.
18. Louis DN, Ohgaki H, Wiestler OD, Cavenee WK. World Health Orga-nization classification of tumors of the Central Nervous System. Lyon,France: IARC Press; 2007.
19. Zhu AX, Sahani DV, Duda DG, di Tomaso E, Ancukiewicz M, CatalanoOA, et al. Efficacy, safety, and potential biomarkers of sunitinibmonotherapy in advanced hepatocellular carcinoma: a phase II study.J Clin Oncol 2009;27:3027–35.
20. Pennacchietti S, Michieli P, Galluzzo M, Mazzone M, Giordano S,Comoglio PM. Hypoxia promotes invasive growth by transcriptionalactivation of the met protooncogene. Cancer Cell 2003;3:347–61.
21. Rubenstein JL, Kim J, Ozawa T, ZhangM,Westphal M, Deen DF, et al.Anti-VEGF antibody treatment of glioblastoma prolongs survival butresults in increased vascular cooption. Neoplasia 2000;2:306–14.
22. Kunkel P, Ulbricht U, Bohlen P, Brockmann MA, Fillbrandt R, StavrouD, et al. Inhibition of glioma angiogenesis and growth in vivo bysystemic treatment with a monoclonal antibody against vascularendothelial growth factor receptor-2. Cancer Res 2001;61:6624–8.
23. Du R, Lu KV, Petritsch C, Liu P, Ganss R, Passegue E, et al. HIF1alphainduces the recruitment of bone marrow-derived vascular modulatorycells to regulate tumor angiogenesis and invasion. Cancer Cell2008;13:206–20.
24. Casanovas O, Hicklin DJ, Bergers G, Hanahan D. Drug resistance byevasion of antiangiogenic targeting of VEGF signaling in late-stagepancreatic islet tumors. Cancer Cell 2005;8:299–309.
25. Paez-Ribes M, Allen E, Hudock J, Takeda T, Okuyama H, Vinals F,et al. Antiangiogenic therapy elicits malignant progression of tumorsto increased local invasion and distant metastasis. Cancer Cell2009;15:220–31.
26. Narayana A, Golfinos JG, Fischer I, Raza S, Kelly P, Parker E, et al.Feasibility of using bevacizumab with radiation therapy and temozo-lomide in newly diagnosed high-grade glioma. Int J Radiat Oncol BiolPhys 2008;72:383–9.
27. Norden AD, YoungGS, Setayesh K, Muzikansky A, Klufas R, Ross GL,et al. Bevacizumab for recurrent malignant gliomas: efficacy, toxicity,and patterns of recurrence. Neurology 2008;70:779–87.
28. Fischer I, Cunliffe CH, Bollo RJ, Raza S, Monoky D, Chiriboga L, et al.High-grade glioma before and after treatment with radiation andAvastin: initial observations. Neuro Oncol 2008;10:700–8.
29. Shojaei F, Wu X, Malik AK, Zhong C, Baldwin ME, Schanz S, et al.Tumor refractoriness to anti-VEGF treatment is mediated byCD11bþGr1þ myeloid cells. Nat Biotechnol 2007;25:911–20.
30. Steidl C, Lee T, Shah SP, Farinha P, Han G, Nayar T, et al. Tumor-associated macrophages and survival in classic Hodgkin's lym-phoma. N Engl J Med 2010;362:875–85.
di Tomaso et al.
Cancer Res; 71(1) January 1, 2011 Cancer Research28
American Association for Cancer Research Copyright © 2011 on January 27, 2011cancerres.aacrjournals.orgDownloaded from
DOI:10.1158/0008-5472.CAN-10-2602