Embed Size (px)
Citation preview
Glaciers
Liss M. Andreassen
Section for glaciers, snow and iceNorwegian Water Resources and Energy Directorate
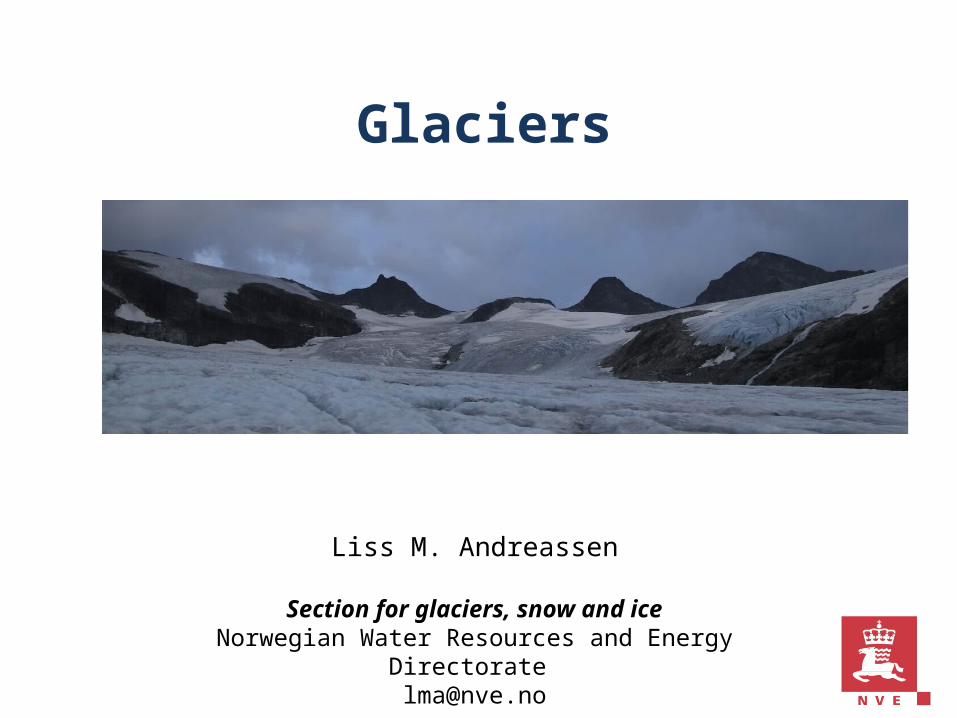
Glaciers in Norway are changing too
~1900: Library of congress 2011: Hallgeir ElvehøyEngabreen
About NVE■ NVE is a directorate under the Ministry of
Petroleum and Energy with responsibility for the management of the nation’s water and energy resources
■ NVE central in flood and accident control planning and responsible for maintaining the national power supply
■ National flood warning services
Research & Development■ Ensure that NVE is a major R&D force in
the energy and water resource sector■ Hydrology Department carries out research within field of expertise
■ Section for glaciers, snow and ice responsible for snow avalanche forecasting, snow, ice & glacier monitoring +++
Rundvassbreen. Photo: M. Jackson
Figure: NVE
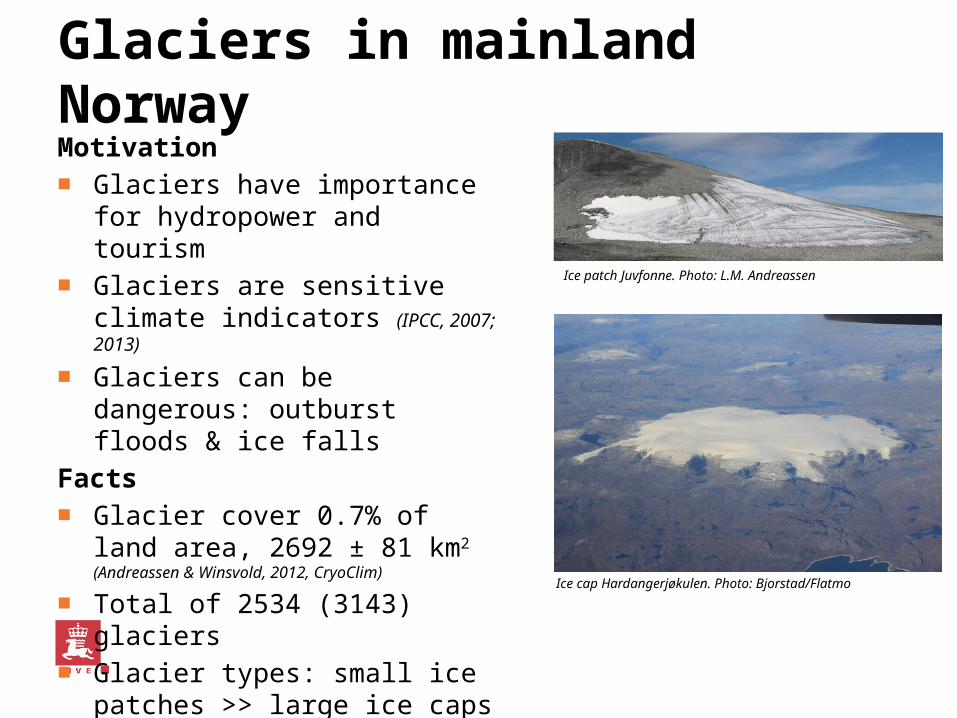
Glaciers in mainland NorwayMotivation■ Glaciers have importance for
hydropower and tourism■ Glaciers are sensitive climate
indicators (IPCC, 2007; 2013)
■ Glaciers can be dangerous: outburst floods & ice falls
Facts■ Glacier cover 0.7% of land area,
2692 ± 81 km2 (Andreassen & Winsvold, 2012, CryoClim)
■ Total of 2534 (3143) glaciers■ Glacier types: small ice patches
>> large ice caps Ice cap Hardangerjøkulen. Photo: Bjorstad/Flatmo
Ice patch Juvfonne. Photo: L.M. Andreassen
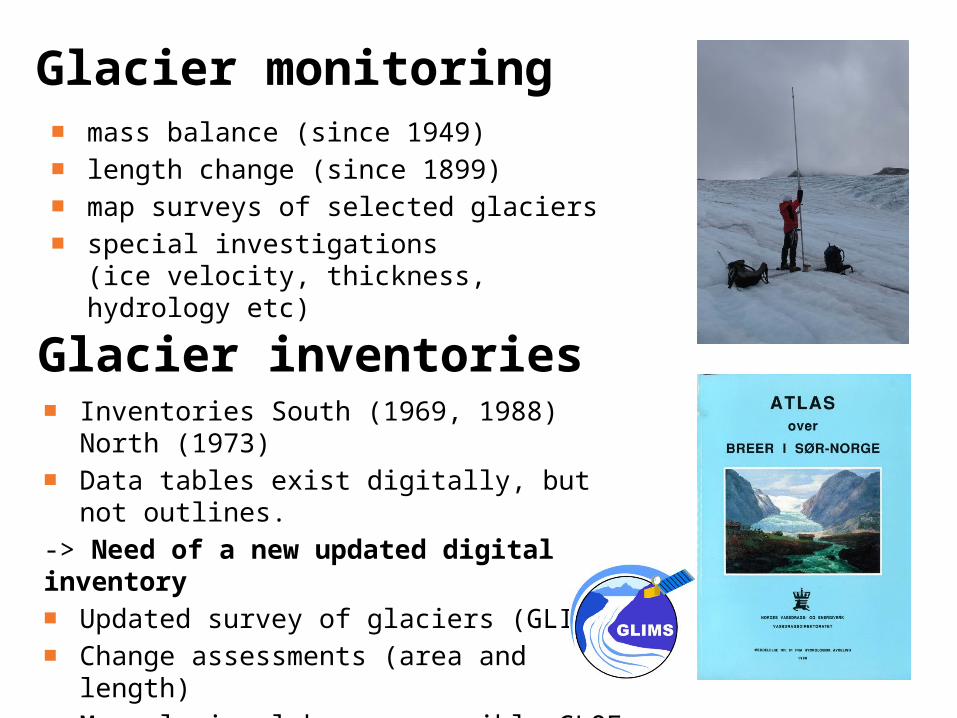
Glacier monitoring■ mass balance (since 1949) ■ length change (since 1899)■ map surveys of selected glaciers■ special investigations
(ice velocity, thickness, hydrology etc)
Glacier inventories■ Inventories South (1969, 1988) North (1973) ■ Data tables exist digitally, but not outlines.
-> Need of a new updated digital inventory■ Updated survey of glaciers (GLIMS)■ Change assessments (area and length)■ Map glacier lakes -> possible GLOF sites■ Baseline for modelling & access future
changes
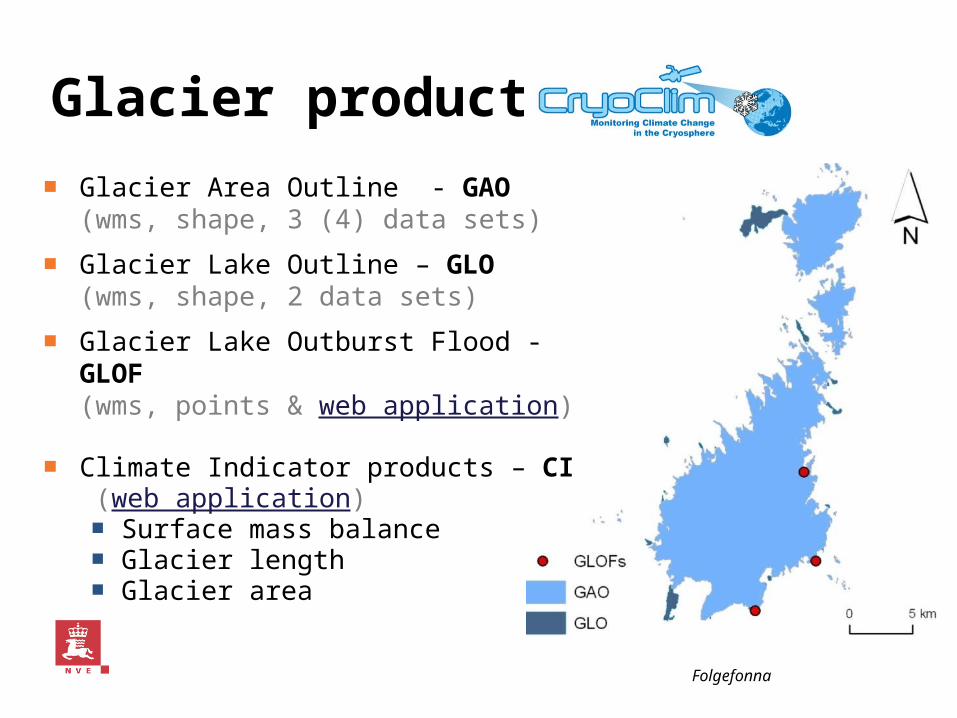
Glacier products
■ Glacier Area Outline - GAO (wms, shape, 3 (4) data sets)
■ Glacier Lake Outline – GLO (wms, shape, 2 data sets)
■ Glacier Lake Outburst Flood - GLOF (wms, points & web application)
■ Climate Indicator products – CI (web application)
■ Surface mass balance ■ Glacier length■ Glacier area
Folgefonna
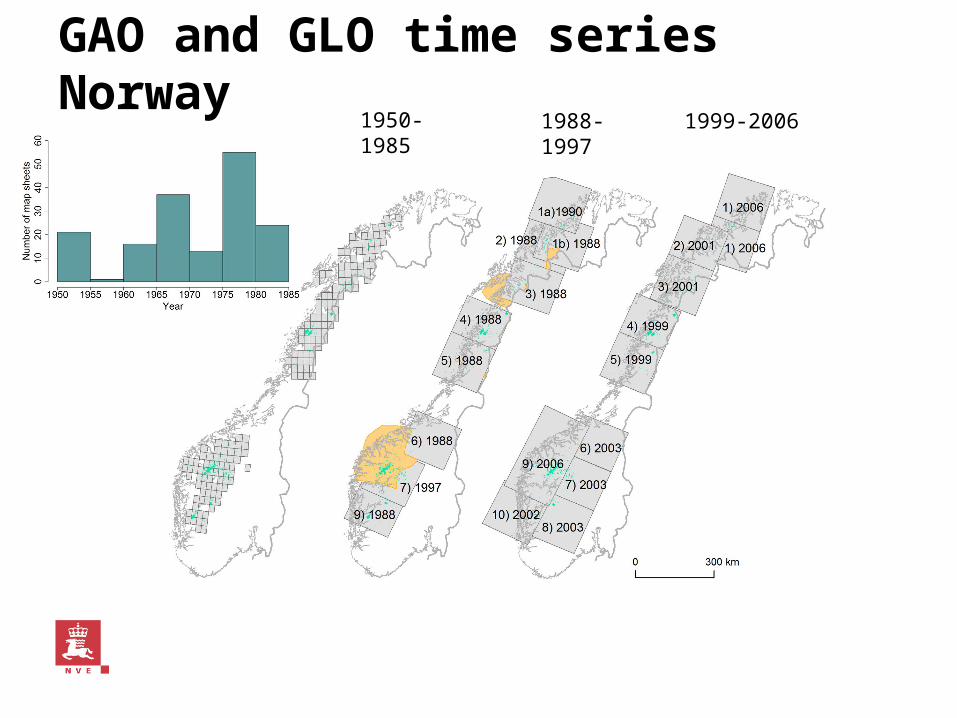
GAO and GLO time series Norway1950-1985
1988-1997
1999-2006
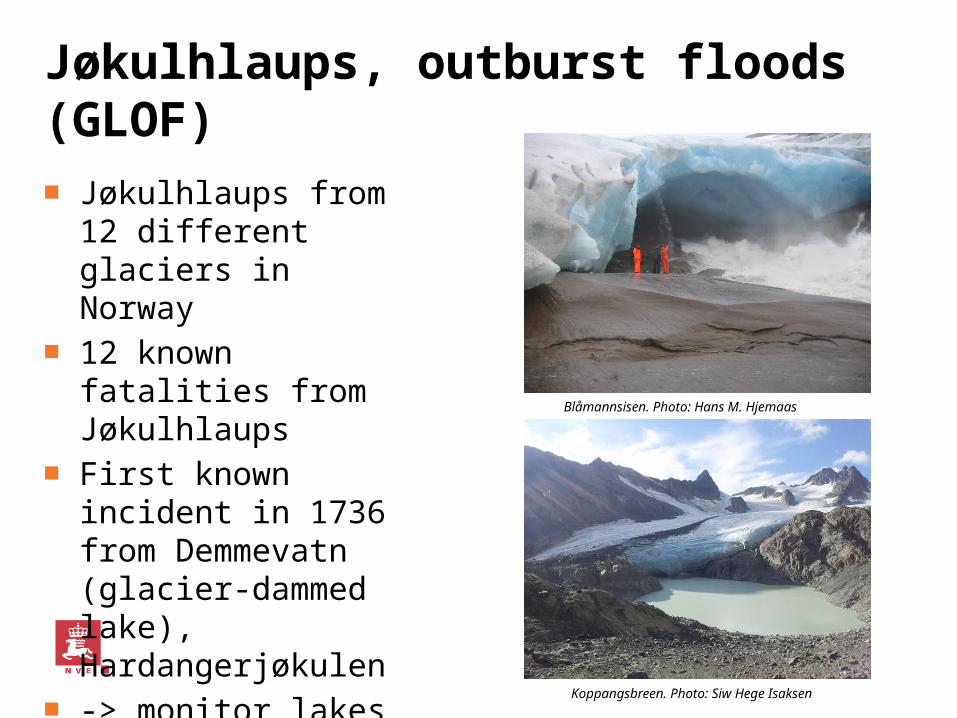
Jøkulhlaups, outburst floods (GLOF)
■ Jøkulhlaups from 12 different glaciers in Norway
■ 12 known fatalities from Jøkulhlaups
■ First known incident in 1736 from Demmevatn (glacier-dammed lake), Hardangerjøkulen
■ -> monitor lakes & their changes & detect possible new
sites
Blåmannsisen. Photo: Hans M. Hjemaas
Koppangsbreen. Photo: Siw Hege Isaksen
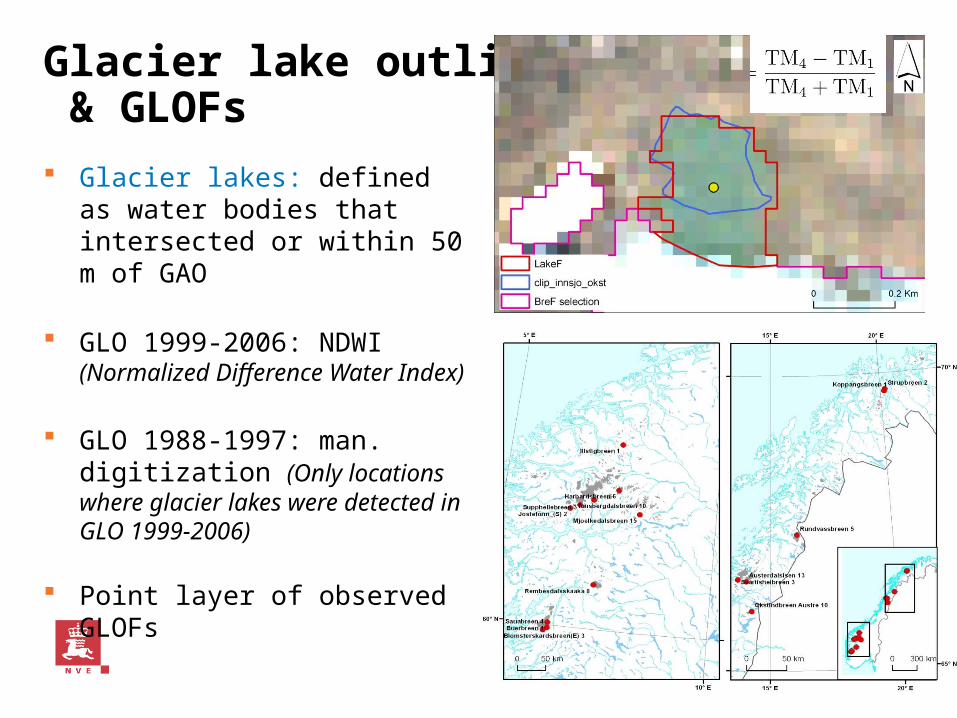
Glacier lake outlines & GLOFs
Glacier lakes: defined as water bodies that intersected or within 50 m of GAO
GLO 1999-2006: NDWI (Normalized Difference Water Index)
GLO 1988-1997: man. digitization (Only locations where glacier lakes were detected in GLO 1999-2006)
Point layer of observed GLOFs
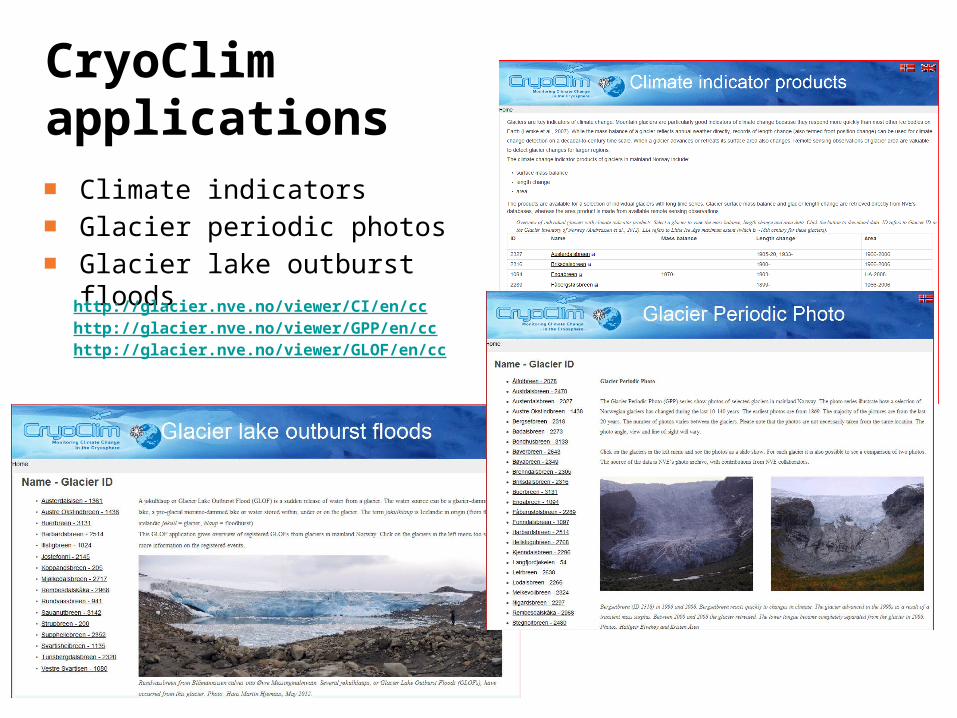
CryoClim applications■ Climate indicators■ Glacier periodic photos■ Glacier lake outburst floods
http://glacier.nve.no/viewer/CI/en/cchttp://glacier.nve.no/viewer/GPP/en/cchttp://glacier.nve.no/viewer/GLOF/en/cc
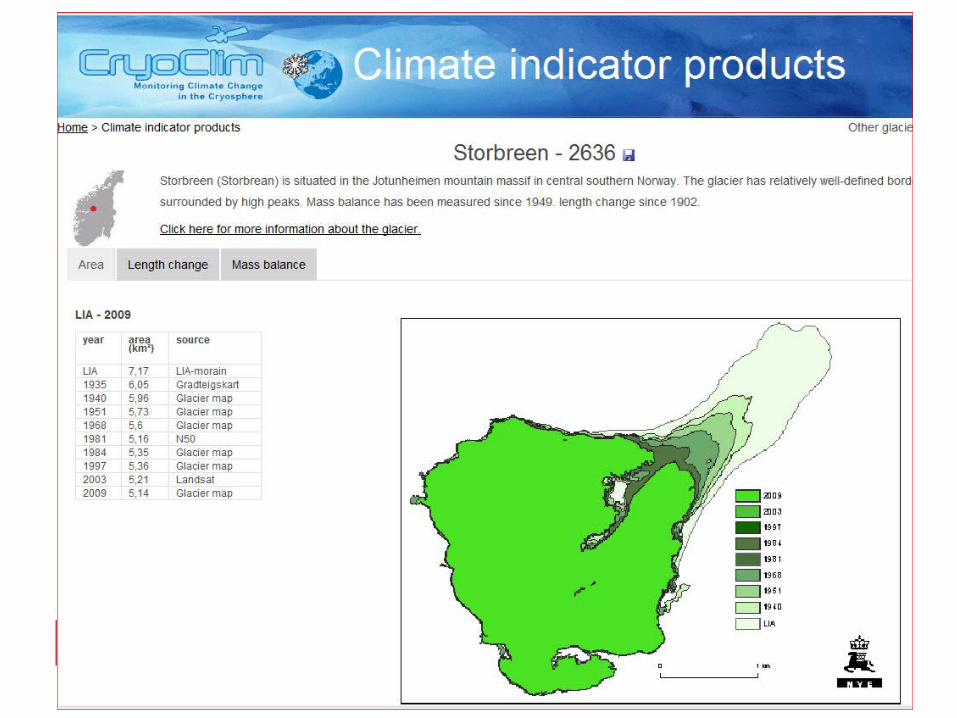
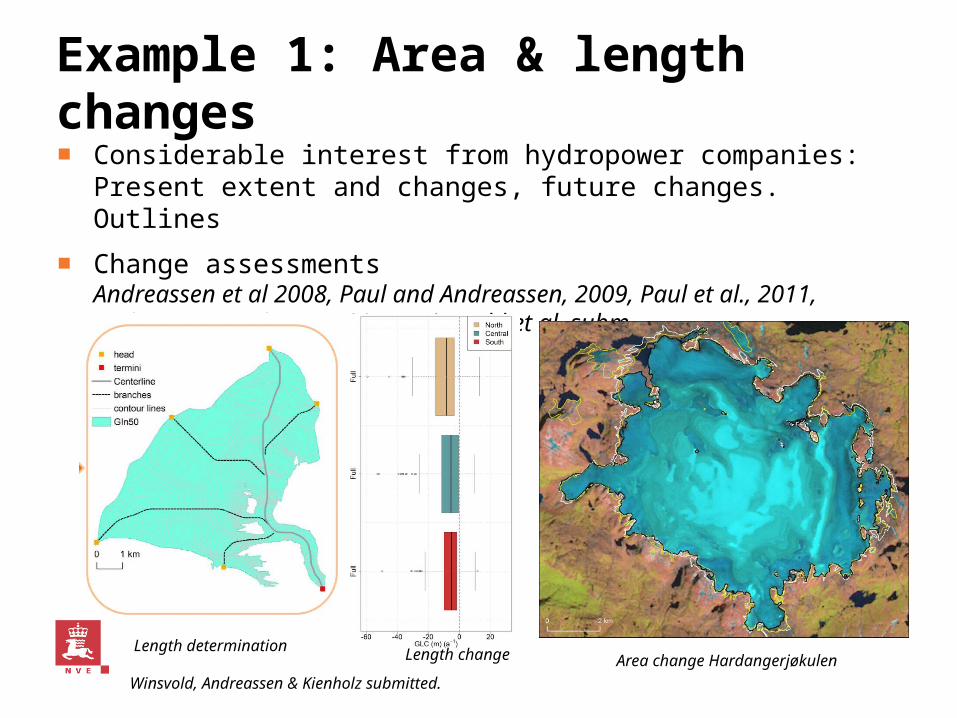
Example 1: Area & length changes ■ Considerable interest from hydropower companies: Present extent
and changes, future changes. Outlines
■ Change assessmentsAndreassen et al 2008, Paul and Andreassen, 2009, Paul et al., 2011, Andreassen et al, 2012; 2014; Winsvold et al. subm
Length determination Length change
Winsvold, Andreassen & Kienholz submitted.
Area change Hardangerjøkulen

Example 2. Little ice age mapping■ Satellite imagery can be an efficient tool for mapping of maximum LIA
extents of glaciers on a regional scale
■ A Landsat image from 2003 were used to map LIA maximum extent (~1750) -> area and length shrank by 35% and 34% from LIA to 2003
Baumann, Winkler & Andreassen, TC, 2009

Example 3: Ice volume modelling
■ Use distributed model (Huss and Farinotti, 2012)
■ Calibrated with ice thickness data for Norway
■ Input data: glacier outlines (inventory data 1999-2006) & national elevation model
Ice thickness data in Norway Andreassen, Huss, Melvold, Elvehøy, Winsvold in prep.
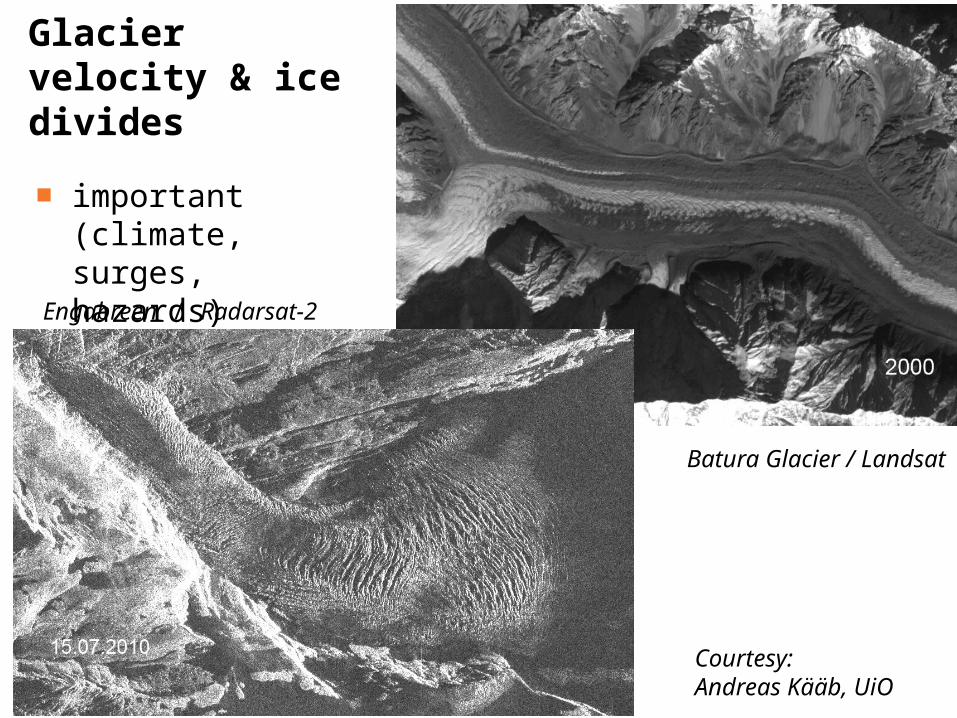
Glacier velocity & ice divides
15
Engabreen / Radarsat-2
Batura Glacier / Landsat
■ important (climate, surges, hazards)
Courtesy:Andreas Kääb, UiO
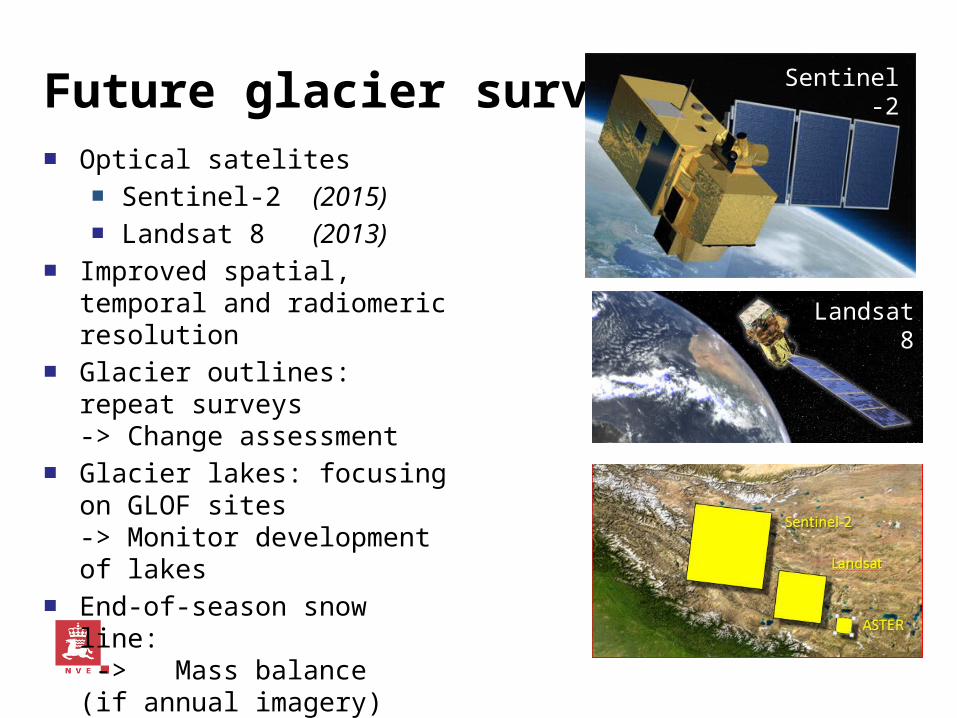
Future glacier survey■ Optical satelites
■ Sentinel-2 (2015)■ Landsat 8 (2013)
■ Improved spatial, temporal and radiomeric resolution
■ Glacier outlines: repeat surveys -> Change assessment
■ Glacier lakes: focusing on GLOF sites -> Monitor development of lakes
■ End-of-season snow line: -> Mass balance(if annual imagery)
■ Ice velocity & ice divides ++
Sentinel-2
Landsat 8
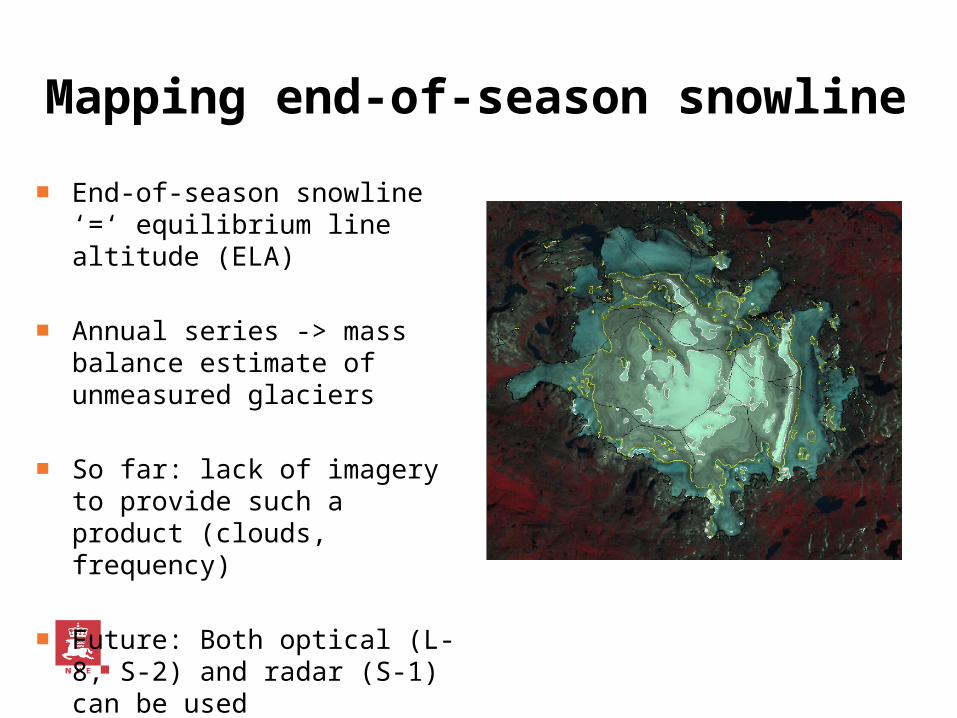
Mapping end-of-season snowline
■ End-of-season snowline ‘=‘ equilibrium line altitude (ELA)
■ Annual series -> mass balance estimate of unmeasured glaciers
■ So far: lack of imagery to provide such a product (clouds, frequency)
■ Future: Both optical (L-8, S-2) and radar (S-1) can be used
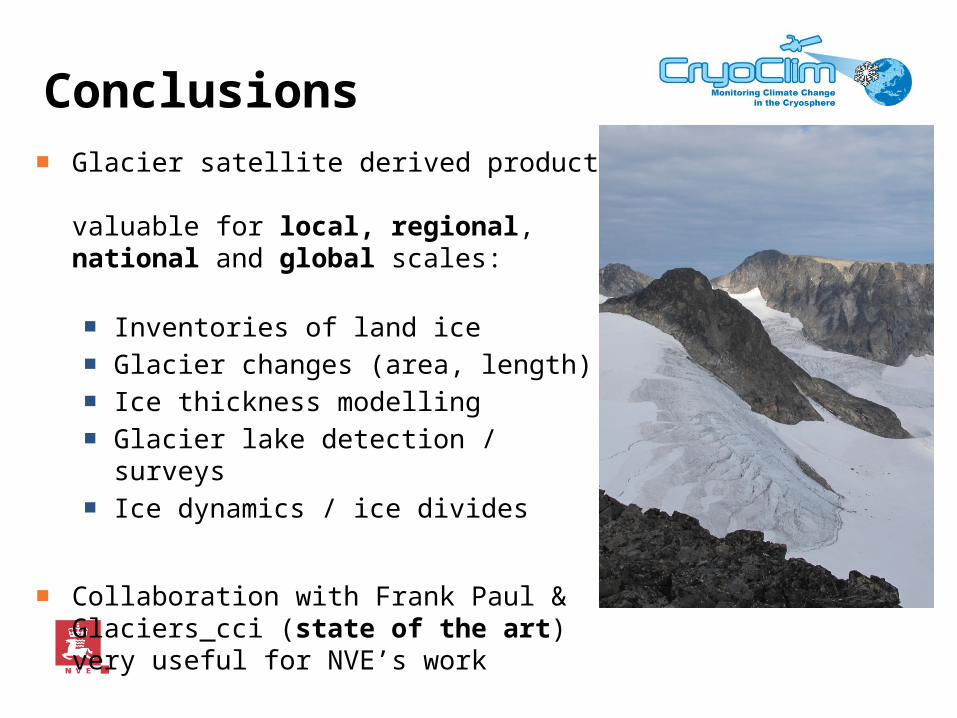
Conclusions■ Glacier satellite derived products
valuable for local, regional, national and global scales:
■ Inventories of land ice■ Glacier changes (area, length)■ Ice thickness modelling■ Glacier lake detection / surveys■ Ice dynamics / ice divides
■ Collaboration with Frank Paul & Glaciers_cci (state of the art) very useful for NVE’s work
Photo: Ragnar Ekker
Thank you for the attention