Embed Size (px)
Citation preview
WORKING PAPER | March 2014 | 1
Suggested Citation: Pahuja, N., N. Pandey, K. Mandal, and C. Bandyopadhyay. 2014. “GHG Mitigation in India: An Overview of the Current Policy Landscape.” Working Paper. Washington, DC: World Resources Institute. Available online at http://www.wri.org/publication/ghg-mitigation-ind-policy.
I N P A R T N E R S H I P W I T H
Working Paper
GHG MITIGATION IN INDIA: AN OVERVIEW OF THE CURRENT POLICY LANDSCAPE
NEHA PAHUJA AND NIMISHA PANDEY (TERI), AND KOYEL MANDAL AND CHAYAN BANDYOPADHYAY (IFMR)
EXECUTIVE SUMMARYLike other countries with emerging economies, India faces the dual challenge of reconciling its rapid economic growth with a pressing need to address climate change. In response, it has enhanced its international and domes-tic efforts to reduce its greenhouse gas emissions.
Internationally, the Indian Government has voluntarily agreed to reduce the emissions intensity of its gross domestic product (GDP) by 20–25 percent from 2005 levels by 2020. Indian and international studies1 suggest that India is likely to meet—or even exceed—this pledge based on its existing policy package and macroeconomic trends. Nevertheless, significant uncertainty surrounds the effective implementation of these policies and changes in the GDP composition.
Domestically, the Indian Government launched the National Action Plan on Climate Change (NAPCC), which includes eight missions to tackle climate change on a sector-by-sector basis.2 Although India has not appor-tioned the 20–25 percent energy intensity reduction target to specific missions, at least two of these missions (the Jawaharlal Nehru National Solar Mission and the National Mission for Enhanced Energy Efficiency) are expected to contribute to meeting this goal. This is an advance over the approach taken in the 11th 5-year plan, in which concern about climate change was expressed in the form of a limited reference to the objective of improving energy efficiency by 20 percent by 2016–17.
CONTENTSExecutive Summary..............................................................1
Key Metrics ..........................................................................2
I: International Statements of Future GHG Mitigation ...........3
II: Relevant Government Institutions and Legal Authorities ...5
III: Overview of Major Policies .............................................7
IV: GHG Projections ...........................................................20
V: Looking Ahead ...............................................................22
Conclusion .........................................................................25
Abbreviations and Acronyms ..............................................26
Endnotes ...........................................................................27
References .....................................................................28
Disclaimer: Working papers contain preliminary research, analysis, findings, and recommendations. They are circulated to stimulate timely discussion and critical feedback and to influence ongoing debate on emerging issues. Most working papers are eventually published in another form, and their content may be revised.
2 |
This working paper summarizes the key national missions and policies already implemented and in development that are likely to reduce greenhouse gas (GHG) emissions in India. Some of the national missions (e.g., the National Solar Mission) are characterized by clear and ambitious targets, detailed policies and measures, and supporting action plans. Others, such as the National Mission on Sustainable Habitat, have not yet developed clear action plans for implementation. Even where the government has formulated policies and measures, a need remains for adequate financing, coordination between national and state implementing agencies, and better coordination of policy initiatives to meet the desired targets and goals.
Looking ahead, India will need to prioritize strategies that strengthen implementation of existing policies if it is to meet its mitigation goals. These strategies include ensuring adequate financing and institutional capacity, as well as better vertical coordination of national, state, and local governments and better horizontal coordination of concerned line ministries and departments. A systematic approach for tracking the progress of mitigation actions could build on the existing system for national communi-cations to the United Nations Framework Convention on Climate Change (UNFCCC) and the Indian Network for Climate Change Assessment (INCAA). Such an approach also could help ensure effective and timely feedback for implementation of mitigation actions.
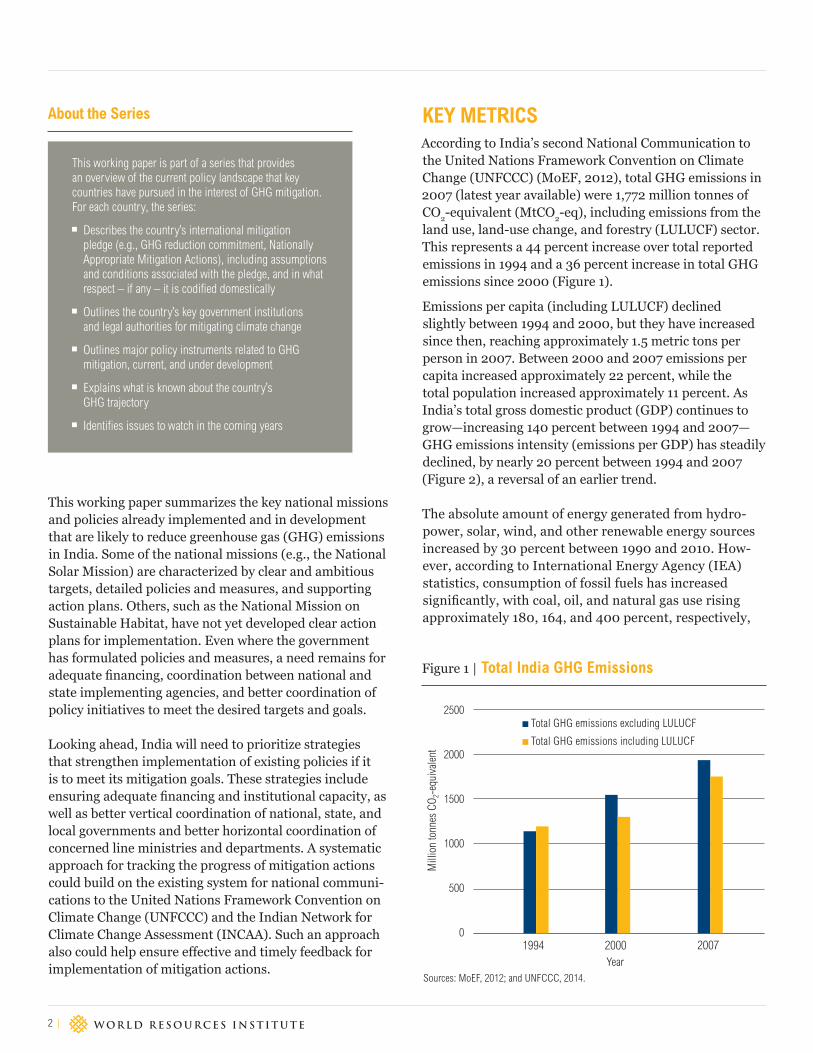
KEY METRICSAccording to India’s second National Communication to the United Nations Framework Convention on Climate Change (UNFCCC) (MoEF, 2012), total GHG emissions in 2007 (latest year available) were 1,772 million tonnes of CO2-equivalent (MtCO2-eq), including emissions from the land use, land-use change, and forestry (LULUCF) sector. This represents a 44 percent increase over total reported emissions in 1994 and a 36 percent increase in total GHG emissions since 2000 (Figure 1).
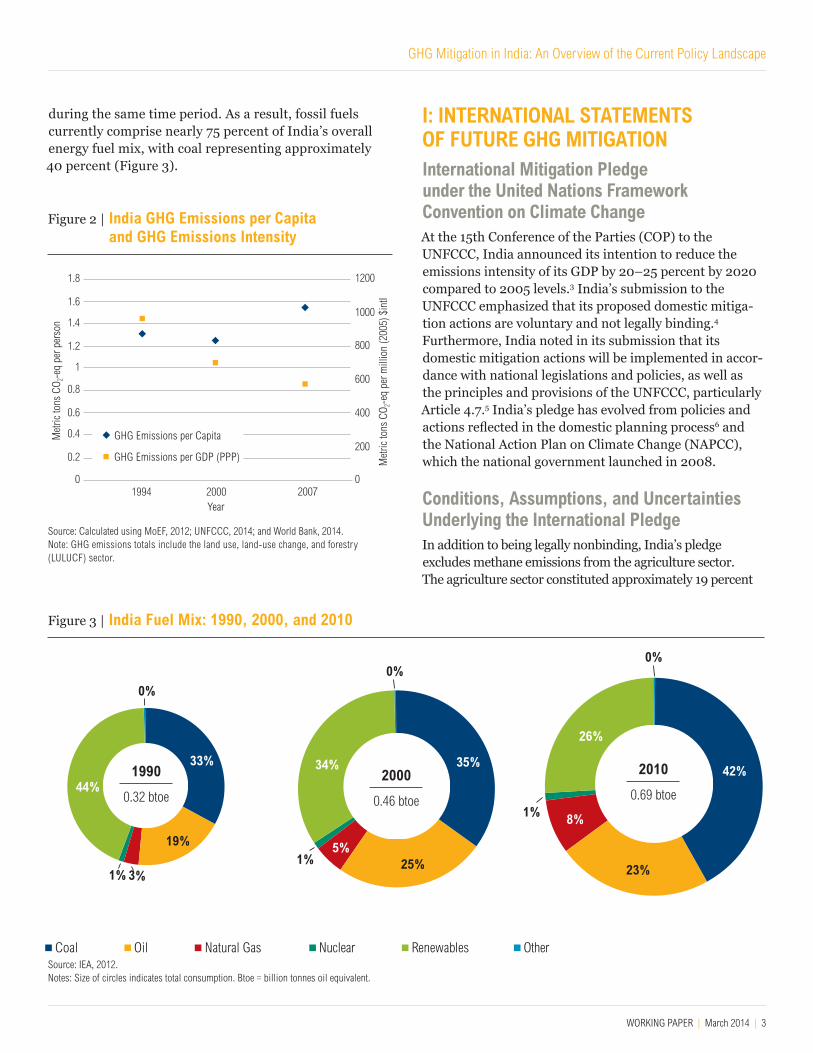
Emissions per capita (including LULUCF) declined slightly between 1994 and 2000, but they have increased since then, reaching approximately 1.5 metric tons per person in 2007. Between 2000 and 2007 emissions per capita increased approximately 22 percent, while the total population increased approximately 11 percent. As India’s total gross domestic product (GDP) continues to grow—increasing 140 percent between 1994 and 2007—GHG emissions intensity (emissions per GDP) has steadily declined, by nearly 20 percent between 1994 and 2007 (Figure 2), a reversal of an earlier trend.
The absolute amount of energy generated from hydro-power, solar, wind, and other renewable energy sources increased by 30 percent between 1990 and 2010. How-ever, according to International Energy Agency (IEA) statistics, consumption of fossil fuels has increased significantly, with coal, oil, and natural gas use rising approximately 180, 164, and 400 percent, respectively,
Figure 1 | Total India GHG Emissions
This working paper is part of a series that provides an overview of the current policy landscape that key countries have pursued in the interest of GHG mitigation. For each country, the series:
Describes the country’s international mitigation pledge (e.g., GHG reduction commitment, Nationally Appropriate Mitigation Actions), including assumptions and conditions associated with the pledge, and in what respect – if any – it is codified domestically
Outlines the country’s key government institutions and legal authorities for mitigating climate change
Outlines major policy instruments related to GHG mitigation, current, and under development
Explains what is known about the country’s GHG trajectory
Identifies issues to watch in the coming years
About the Series
Sources: MoEF, 2012; and UNFCCC, 2014.
0
500
1000
1500
2000
2500
Mill
ion
tonn
es C
O 2-e
quiv
alen
t
Year
Total GHG emissions excluding LULUCF
Total GHG emissions including LULUCF
1994 2000 2007
GHG Mitigation in India: An Overview of the Current Policy Landscape
WORKING PAPER | March 2014 | 3
I: INTERNATIONAL STATEMENTS OF FUTURE GHG MITIGATIONInternational Mitigation Pledge under the United Nations Framework Convention on Climate ChangeAt the 15th Conference of the Parties (COP) to the UNFCCC, India announced its intention to reduce the emissions intensity of its GDP by 20–25 percent by 2020 compared to 2005 levels.3 India’s submission to the UNFCCC emphasized that its proposed domestic mitiga-tion actions are voluntary and not legally binding.4 Furthermore, India noted in its submission that its domestic mitigation actions will be implemented in accor-dance with national legislations and policies, as well as the principles and provisions of the UNFCCC, particularly Article 4.7.5 India’s pledge has evolved from policies and actions reflected in the domestic planning process6 and the National Action Plan on Climate Change (NAPCC), which the national government launched in 2008.
Conditions, Assumptions, and Uncertainties Underlying the International Pledge In addition to being legally nonbinding, India’s pledge excludes methane emissions from the agriculture sector. The agriculture sector constituted approximately 19 percent
Source: IEA, 2012. Notes: Size of circles indicates total consumption. Btoe = billion tonnes oil equivalent.
Figure 3 | India Fuel Mix: 1990, 2000, and 2010
Source: Calculated using MoEF, 2012; UNFCCC, 2014; and World Bank, 2014.Note: GHG emissions totals include the land use, land-use change, and forestry (LULUCF) sector.
Figure 2 | India GHG Emissions per Capita and GHG Emissions Intensity
0
0.2
0.4
0.6
0.8
1.2
1.4
1.6
0
200
400
600
800
1000
12001.8
1
1994 2000 2007
Met
ric to
ns C
O 2-eq
per
per
son
Met
ric to
ns C
O 2-eq
per
mill
ion
(200
5) $
intl
Year
GHG Emissions per Capita
GHG Emissions per GDP (PPP)
Coal Oil Natural Gas Nuclear Renewables Other
33%
0%
1%3%
19%
44%42%
0%
1%
23%
26%
8%
35%
0%
1% 25%
34%
5%
1990
0.32 btoe
2000
0.46 btoe
2010
0.69 btoe
during the same time period. As a result, fossil fuels currently comprise nearly 75 percent of India’s overall energy fuel mix, with coal representing approximately 40 percent (Figure 3).
4 |
of total emissions in 2007, excluding LULUCF, with meth-ane accounting for around 80 percent of emissions from this sector (MoEF, 2012). While there is no explicit mention of emission intensity in 2005 (base year) in the official submis-sion, the Interim Report of the Expert Group on Low Car-bon Strategies for Inclusive Growth (Planning Commission, 2011a)7 suggests that the emission intensity was 66.8 grams of CO2-eq per rupee of GDP in 1994, and 56.21 grams of CO2-eq per rupee of GDP in 2007; the estimated emissions excluding LULUCF and agriculture in 2005 are 1,433 MtCO2-eq (Plan-ning Commission, 2011a).
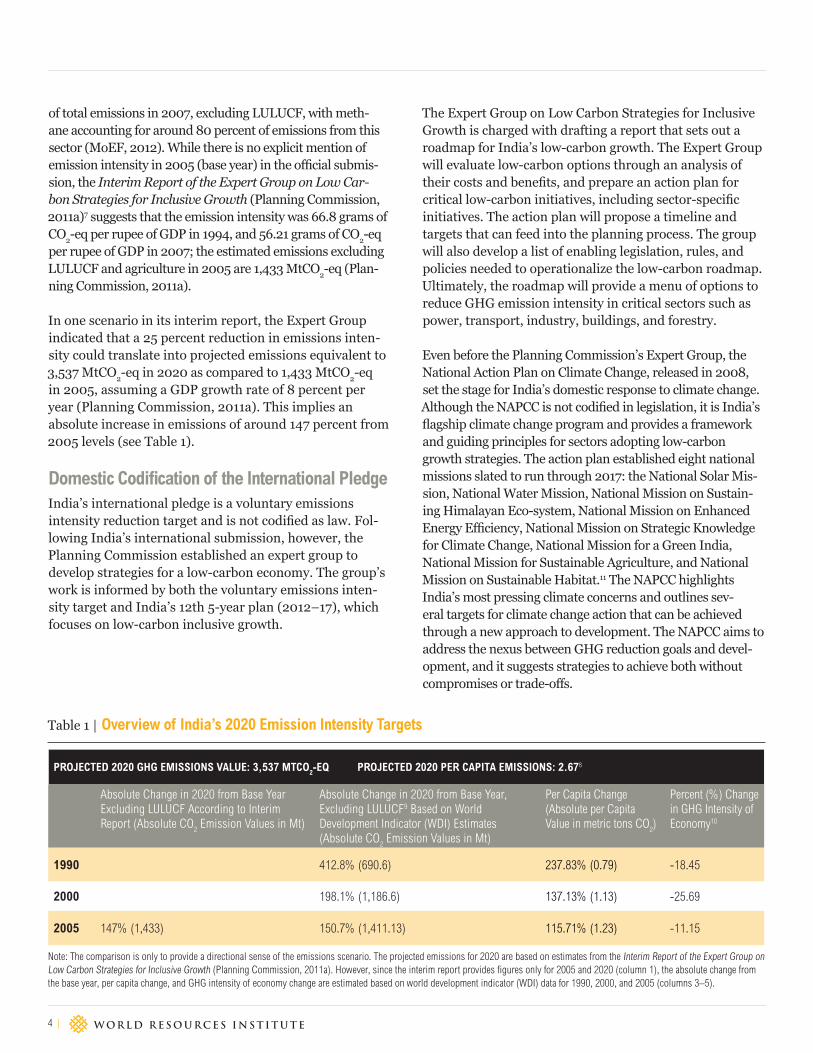
In one scenario in its interim report, the Expert Group indicated that a 25 percent reduction in emissions inten-sity could translate into projected emissions equivalent to 3,537 MtCO2-eq in 2020 as compared to 1,433 MtCO2-eq in 2005, assuming a GDP growth rate of 8 percent per year (Planning Commission, 2011a). This implies an absolute increase in emissions of around 147 percent from 2005 levels (see Table 1).
Domestic Codification of the International Pledge India’s international pledge is a voluntary emissions intensity reduction target and is not codified as law. Fol-lowing India’s international submission, however, the Planning Commission established an expert group to develop strategies for a low-carbon economy. The group’s work is informed by both the voluntary emissions inten-sity target and India’s 12th 5-year plan (2012–17), which focuses on low-carbon inclusive growth.
The Expert Group on Low Carbon Strategies for Inclusive Growth is charged with drafting a report that sets out a roadmap for India’s low-carbon growth. The Expert Group will evaluate low-carbon options through an analysis of their costs and benefits, and prepare an action plan for critical low-carbon initiatives, including sector-specific initiatives. The action plan will propose a timeline and targets that can feed into the planning process. The group will also develop a list of enabling legislation, rules, and policies needed to operationalize the low-carbon roadmap. Ultimately, the roadmap will provide a menu of options to reduce GHG emission intensity in critical sectors such as power, transport, industry, buildings, and forestry.
Even before the Planning Commission’s Expert Group, the National Action Plan on Climate Change, released in 2008, set the stage for India’s domestic response to climate change. Although the NAPCC is not codified in legislation, it is India’s flagship climate change program and provides a framework and guiding principles for sectors adopting low-carbon growth strategies. The action plan established eight national missions slated to run through 2017: the National Solar Mis-sion, National Water Mission, National Mission on Sustain-ing Himalayan Eco-system, National Mission on Enhanced Energy Efficiency, National Mission on Strategic Knowledge for Climate Change, National Mission for a Green India, National Mission for Sustainable Agriculture, and National Mission on Sustainable Habitat.11 The NAPCC highlights India’s most pressing climate concerns and outlines sev-eral targets for climate change action that can be achieved through a new approach to development. The NAPCC aims to address the nexus between GHG reduction goals and devel-opment, and it suggests strategies to achieve both without compromises or trade-offs.
Table 1 | Overview of India’s 2020 Emission Intensity Targets
PROJECTED 2020 GHG EMISSIONS VALUE: 3,537 MTCO2-EQ PROJECTED 2020 PER CAPITA EMISSIONS: 2.678
Absolute Change in 2020 from Base Year Excluding LULUCF According to Interim Report (Absolute CO
2 Emission Values in Mt)
Absolute Change in 2020 from Base Year, Excluding LULUCF9 Based on World Development Indicator (WDI) Estimates (Absolute CO
2 Emission Values in Mt)
Per Capita Change (Absolute per Capita Value in metric tons CO
2)
Percent (%) Change in GHG Intensity of Economy10
1990 412.8% (690.6) 237.83% (0.79) -18.45
2000 198.1% (1,186.6) 137.13% (1.13) -25.69
2005 147% (1,433) 150.7% (1,411.13) 115.71% (1.23) -11.15
Note: The comparison is only to provide a directional sense of the emissions scenario. The projected emissions for 2020 are based on estimates from the Interim Report of the Expert Group on Low Carbon Strategies for Inclusive Growth (Planning Commission, 2011a). However, since the interim report provides figures only for 2005 and 2020 (column 1), the absolute change from the base year, per capita change, and GHG intensity of economy change are estimated based on world development indicator (WDI) data for 1990, 2000, and 2005 (columns 3–5).
GHG Mitigation in India: An Overview of the Current Policy Landscape
WORKING PAPER | March 2014 | 5
The solar mission and the energy efficiency missions, in particular, are likely to contribute to achieving the national goal of 20–25 percent reductions in emissions intensity by directly reducing GHG emissions, although there is no explicit mention of the missions in the emissions intensity pledge. A range of experts from the Institute for Financial Management and Research (IFMR) and the Indian Institute of Technology, Madras, have evaluated the NAPCC and each of the missions (Byravan and Rajan, 2012). The evaluation found that the NAPCC and its missions are critical components of the plan-ning process at the central and state levels. The NAPCC thus serves as the guiding document for climate policy in India.12
Under the 12th 5-year plan, the Planning Commission’s working group on climate change has articulated a need to integrate the objectives of both the NAPCC and the domestic mitigation goal into the development strategy for the various economic sectors. The implications for climate adaptation are that specific policy initiatives should be developed across a range of sectors, such as in agriculture, water, health, coastal management, forests and other eco-systems, energy, including renewable energy, and infra-structure (Planning Commission, 2011b).
The government of India has estimated that Rs 2.3 trillion (US$37 billion13) would be needed to fulfill the objec-tives of the eight national missions of NAPCC in the 12th 5-year plan.
II: RELEVANT GOVERNMENT INSTITUTIONS AND LEGAL AUTHORITIESLegal authority to develop and implement national GHG mitigation policies and programs lies predominantly with the central government, but states also play a significant role. General environmental protection legislation provides the legal framework for regulating GHG emissions from their sources. The key regulations with possible implications for GHG mitigation include the Indian Forests Act of 1927; the Forest (Conservation) Act of 1980; the Air (Prevention and Control of Pollution) Act of 1981; the Environment (Protec-tion) Act of 1986; the Motor Vehicles Act of 1988; and energy legislation such as the Energy Conservation Act of 2001 and the Electricity Act of 2003. These laws authorize several cen-tral and state government agencies to take actions that could reduce India’s GHG emissions.
The Indian Constitution defines the roles of the central and state governments and divides legislative powers into three lists:
The Union List includes items that the federal parlia-ment has exclusive power to legislate. Ninety-seven items fall under the Union List, including trade rep-resentation, United Nations organization, agreements and conventions with foreign countries, atomic power, mineral and oil resources, and control of industries (e.g., railways, aviation, maritime transport, etc.).
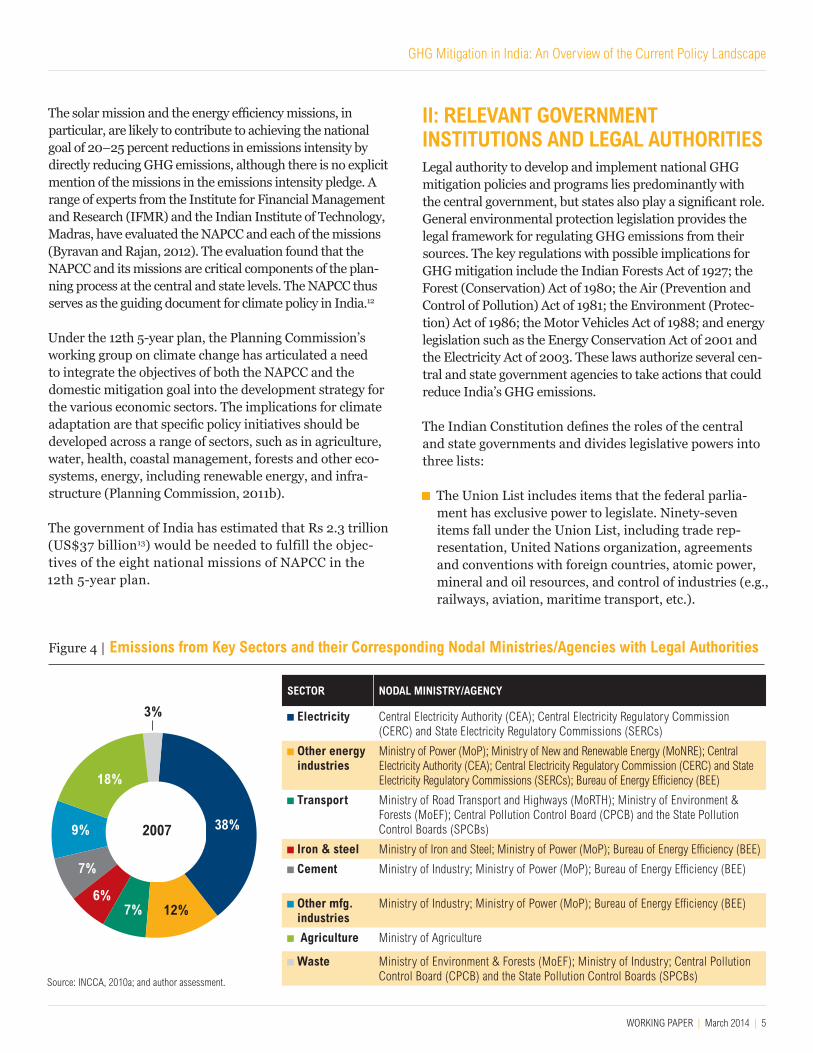
Figure 4 | Emissions from Key Sectors and their Corresponding Nodal Ministries/Agencies with Legal Authorities
Source: INCCA, 2010a; and author assessment.
Agriculture
Waste
Electricity
Other Energy
Cement
Other Industry
Transport
Iron & Steel
38%
3%
12%
9%
18%
7%
7%
6%
SECTOR NODAL MINISTRY/AGENCY
Electricity Central Electricity Authority (CEA); Central Electricity Regulatory Commission (CERC) and State Electricity Regulatory Commissions (SERCs)
Other energy industries
Ministry of Power (MoP); Ministry of New and Renewable Energy (MoNRE); Central Electricity Authority (CEA); Central Electricity Regulatory Commission (CERC) and State Electricity Regulatory Commissions (SERCs); Bureau of Energy Efficiency (BEE)
Transport Ministry of Road Transport and Highways (MoRTH); Ministry of Environment & Forests (MoEF); Central Pollution Control Board (CPCB) and the State Pollution Control Boards (SPCBs)
Iron & steel Ministry of Iron and Steel; Ministry of Power (MoP); Bureau of Energy Efficiency (BEE)
Cement Ministry of Industry; Ministry of Power (MoP); Bureau of Energy Efficiency (BEE)
Other mfg. industries
Ministry of Industry; Ministry of Power (MoP); Bureau of Energy Efficiency (BEE)
Agriculture Ministry of Agriculture
Waste Ministry of Environment & Forests (MoEF); Ministry of Industry; Central Pollution Control Board (CPCB) and the State Pollution Control Boards (SPCBs)
2007
6 |
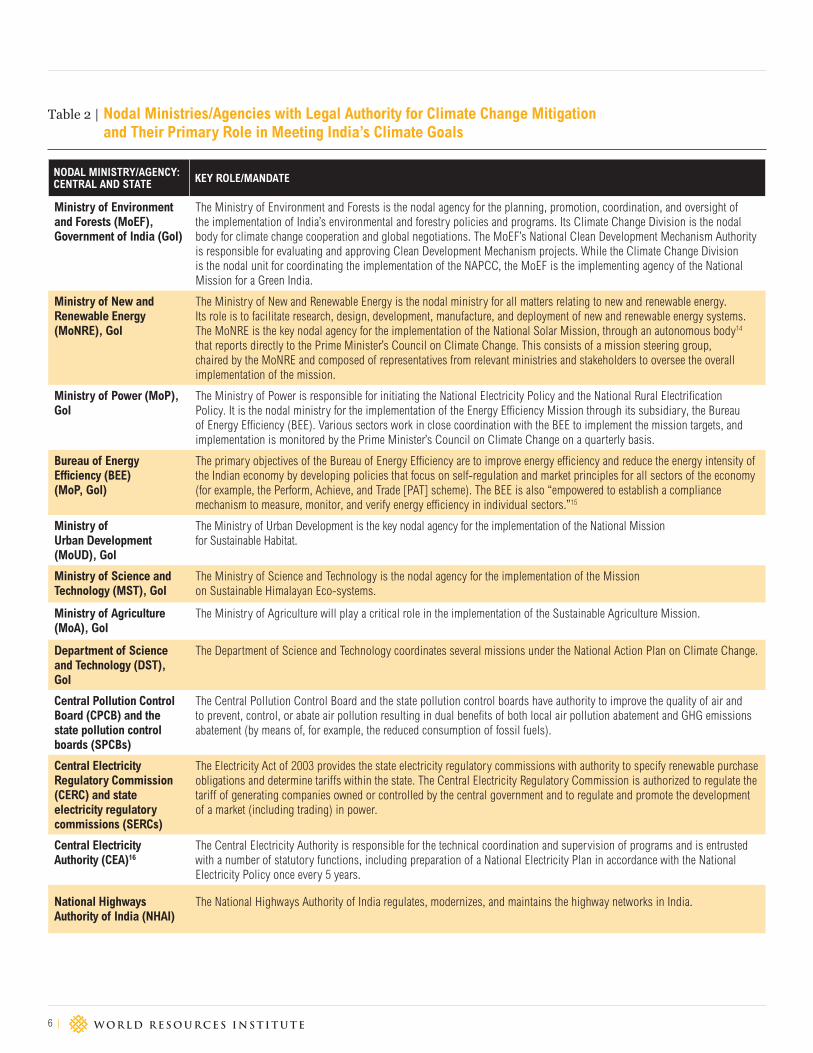
Table 2 | Nodal Ministries/Agencies with Legal Authority for Climate Change Mitigation and Their Primary Role in Meeting India’s Climate Goals
NODAL MINISTRY/AGENCY: CENTRAL AND STATE KEY ROLE/MANDATE
Ministry of Environment and Forests (MoEF), Government of India (GoI)
The Ministry of Environment and Forests is the nodal agency for the planning, promotion, coordination, and oversight of the implementation of India’s environmental and forestry policies and programs. Its Climate Change Division is the nodal body for climate change cooperation and global negotiations. The MoEF’s National Clean Development Mechanism Authority is responsible for evaluating and approving Clean Development Mechanism projects. While the Climate Change Division is the nodal unit for coordinating the implementation of the NAPCC, the MoEF is the implementing agency of the National Mission for a Green India.
Ministry of New and Renewable Energy (MoNRE), GoI
The Ministry of New and Renewable Energy is the nodal ministry for all matters relating to new and renewable energy. Its role is to facilitate research, design, development, manufacture, and deployment of new and renewable energy systems. The MoNRE is the key nodal agency for the implementation of the National Solar Mission, through an autonomous body14 that reports directly to the Prime Minister’s Council on Climate Change. This consists of a mission steering group, chaired by the MoNRE and composed of representatives from relevant ministries and stakeholders to oversee the overall implementation of the mission.
Ministry of Power (MoP), GoI
The Ministry of Power is responsible for initiating the National Electricity Policy and the National Rural Electrification Policy. It is the nodal ministry for the implementation of the Energy Efficiency Mission through its subsidiary, the Bureau of Energy Efficiency (BEE). Various sectors work in close coordination with the BEE to implement the mission targets, and implementation is monitored by the Prime Minister’s Council on Climate Change on a quarterly basis.
Bureau of Energy Efficiency (BEE) (MoP, GoI)
The primary objectives of the Bureau of Energy Efficiency are to improve energy efficiency and reduce the energy intensity of the Indian economy by developing policies that focus on self-regulation and market principles for all sectors of the economy (for example, the Perform, Achieve, and Trade [PAT] scheme). The BEE is also “empowered to establish a compliance mechanism to measure, monitor, and verify energy efficiency in individual sectors.”15
Ministry of Urban Development (MoUD), GoI
The Ministry of Urban Development is the key nodal agency for the implementation of the National Mission for Sustainable Habitat.
Ministry of Science and Technology (MST), GoI
The Ministry of Science and Technology is the nodal agency for the implementation of the Mission on Sustainable Himalayan Eco-systems.
Ministry of Agriculture (MoA), GoI
The Ministry of Agriculture will play a critical role in the implementation of the Sustainable Agriculture Mission.
Department of Science and Technology (DST), GoI
The Department of Science and Technology coordinates several missions under the National Action Plan on Climate Change.
Central Pollution Control Board (CPCB) and the state pollution control boards (SPCBs)
The Central Pollution Control Board and the state pollution control boards have authority to improve the quality of air and to prevent, control, or abate air pollution resulting in dual benefits of both local air pollution abatement and GHG emissions abatement (by means of, for example, the reduced consumption of fossil fuels).
Central Electricity Regulatory Commission (CERC) and state electricity regulatory commissions (SERCs)
The Electricity Act of 2003 provides the state electricity regulatory commissions with authority to specify renewable purchase obligations and determine tariffs within the state. The Central Electricity Regulatory Commission is authorized to regulate the tariff of generating companies owned or controlled by the central government and to regulate and promote the development of a market (including trading) in power.
Central Electricity Authority (CEA)16
The Central Electricity Authority is responsible for the technical coordination and supervision of programs and is entrusted with a number of statutory functions, including preparation of a National Electricity Plan in accordance with the National Electricity Policy once every 5 years.
National Highways Authority of India (NHAI)
The National Highways Authority of India regulates, modernizes, and maintains the highway networks in India.
GHG Mitigation in India: An Overview of the Current Policy Landscape
WORKING PAPER | March 2014 | 7
NODAL MINISTRY/AGENCY: CENTRAL AND STATE KEY ROLE/MANDATE
Ministry of Environment and Forests (MoEF), Government of India (GoI)
The Ministry of Environment and Forests is the nodal agency for the planning, promotion, coordination, and oversight of the implementation of India’s environmental and forestry policies and programs. Its Climate Change Division is the nodal body for climate change cooperation and global negotiations. The MoEF’s National Clean Development Mechanism Authority is responsible for evaluating and approving Clean Development Mechanism projects. While the Climate Change Division is the nodal unit for coordinating the implementation of the NAPCC, the MoEF is the implementing agency of the National Mission for a Green India.
Ministry of New and Renewable Energy (MoNRE), GoI
The Ministry of New and Renewable Energy is the nodal ministry for all matters relating to new and renewable energy. Its role is to facilitate research, design, development, manufacture, and deployment of new and renewable energy systems. The MoNRE is the key nodal agency for the implementation of the National Solar Mission, through an autonomous body14 that reports directly to the Prime Minister’s Council on Climate Change. This consists of a mission steering group, chaired by the MoNRE and composed of representatives from relevant ministries and stakeholders to oversee the overall implementation of the mission.
Ministry of Power (MoP), GoI
The Ministry of Power is responsible for initiating the National Electricity Policy and the National Rural Electrification Policy. It is the nodal ministry for the implementation of the Energy Efficiency Mission through its subsidiary, the Bureau of Energy Efficiency (BEE). Various sectors work in close coordination with the BEE to implement the mission targets, and implementation is monitored by the Prime Minister’s Council on Climate Change on a quarterly basis.
Bureau of Energy Efficiency (BEE) (MoP, GoI)
The primary objectives of the Bureau of Energy Efficiency are to improve energy efficiency and reduce the energy intensity of the Indian economy by developing policies that focus on self-regulation and market principles for all sectors of the economy (for example, the Perform, Achieve, and Trade [PAT] scheme). The BEE is also “empowered to establish a compliance mechanism to measure, monitor, and verify energy efficiency in individual sectors.”15
Ministry of Urban Development (MoUD), GoI
The Ministry of Urban Development is the key nodal agency for the implementation of the National Mission for Sustainable Habitat.
Ministry of Science and Technology (MST), GoI
The Ministry of Science and Technology is the nodal agency for the implementation of the Mission on Sustainable Himalayan Eco-systems.
Ministry of Agriculture (MoA), GoI
The Ministry of Agriculture will play a critical role in the implementation of the Sustainable Agriculture Mission.
Department of Science and Technology (DST), GoI
The Department of Science and Technology coordinates several missions under the National Action Plan on Climate Change.
Central Pollution Control Board (CPCB) and the state pollution control boards (SPCBs)
The Central Pollution Control Board and the state pollution control boards have authority to improve the quality of air and to prevent, control, or abate air pollution resulting in dual benefits of both local air pollution abatement and GHG emissions abatement (by means of, for example, the reduced consumption of fossil fuels).
Central Electricity Regulatory Commission (CERC) and state electricity regulatory commissions (SERCs)
The Electricity Act of 2003 provides the state electricity regulatory commissions with authority to specify renewable purchase obligations and determine tariffs within the state. The Central Electricity Regulatory Commission is authorized to regulate the tariff of generating companies owned or controlled by the central government and to regulate and promote the development of a market (including trading) in power.
Central Electricity Authority (CEA)16
The Central Electricity Authority is responsible for the technical coordination and supervision of programs and is entrusted with a number of statutory functions, including preparation of a National Electricity Plan in accordance with the National Electricity Policy once every 5 years.
National Highways Authority of India (NHAI)
The National Highways Authority of India regulates, modernizes, and maintains the highway networks in India.
The Concurrent List includes legislative items that fall under the purview of both the central and state govern-ments, where uniformity across states may be desirable but is not essential. Examples include energy, forestry, factories, and boilers. Energy policy is on the Concur-rent List, which means that there are both overarching national policies and independent state-level supporting policies and incentives working toward national goals.
The State List comprises 66 item areas where the state governments have exclusive jurisdiction. This includes areas of public health and sanitation, agriculture, land use, industries, and water.
A more detailed account of key agencies and their primary responsibilities/mandates is outlined in Table 2. At the central government level, the Ministry of Environment and Forests (MoEF) is the nodal agency responsible for coordi-nating the implementation of the NAPCC, but implemen-tation of each of the eight missions falls under a number of agencies (Table 2). The Prime Minister’s Council on Climate Change also plays an important role, by guiding the implementation of the missions under the NAPCC.
Although they are not included in Table 2, the Planning Commission and the Finance Commission are also impor-tant climate policy actors. Both play important roles in India’s centralized policymaking: the Planning Commis-sion is responsible for central long-term planning, and the Finance Commission oversees financial transfer schemes involving all levels of government.
III: OVERVIEW OF MAJOR POLICIES Introduction and MethodsThis paper focuses on some of the key policies, imple-menting legislation, and mandatory requirements that can reduce GHG emission intensity in critical sectors of the Indian economy (Table 3). It does not consider volun-tary initiatives such as research and development (R&D) programs, and awareness-raising efforts; although these efforts are also important, it is difficult to estimate their impact on GHG emissions because they are more indirect and intangible. The policies considered here are organized into “existing” policies and policies “under development.”
“Existing” policies include mandatory and non-mandatory policies, standards, and measures that have been imple-mented to support the goals of the NAPCC. Existing
national policies that rely on state-level implementation are also described below. Policies “under development” include policies that have been enacted, but are still awaiting implementing regulations. An overview of steps required for implementation is included when possible.
Existing PoliciesCross-Cutting Economic Incentives
A Tax on Coal to Fund Clean Energy: The Indian Government assesses a cess17 of Rs 50 (US$0.81) per tonne on both domestic and imported coal. This corner-stone regulatory policy acts as a sort of carbon tax. In April 2011, the Cabinet Committee on Economic Affairs, which is headed by the prime minister, approved a National Clean Energy Fund to invest in entrepreneurial ventures and research in clean energy technologies. When the government introduced the coal cess, the general perception was that power-generating companies would pass the increased cost of generation to the customers. Although the fund promotes clean energy technologies, the cess may not significantly reduce consumption, as the continued dominance of coal in India’s overall installed capacity suggests. The Union Budget for 2010–11 imposed a cess on all the coal mined in the country or imported at an effective rate of Rs 50 (US$0.81) a tonne, generating Rs 10.66 billion (US$171.9 million). The revised estimate of the National Clean Energy Fund corpus from tax reve-nues for 2011–12 was Rs 32.49 billion (US$524.0 million), and the budget estimate for 2012–13 was Rs 38.64 billion (US$623.2 million). The Economic Survey for 2011–12 mentions that the government expects to collect Rs 100 billion (US$1.61 billion) from the Clean Energy Fund by 2015 (Mandal, 2012). Rs 2 billion (US$32 million) from this fund was allotted for the Green India Mission under the NAPCC (Mukul, 2011). The Union Budget for 2013–14 announced that the National Clean Energy Fund would fund the Indian Renewable Energy Development Agency (IREDA) to provide low-interest loans to viable renewable energy projects (Kumar and Preetha, 2013).
A 2012 report by the Centre for Budget and Governance Accountability identified two areas of concern for the National Clean Energy Fund: inconsistencies between its stated objectives, operational guidelines, and actual implementation by sponsor ministries and the Intermin-isterial Group; and shortcomings in operationalization under existing guidelines. As of July 2012, an estimated Rs 82 billion (US$1.3 billion) was collected under the National Clean Energy Fund, but only about an eighth of
8 |
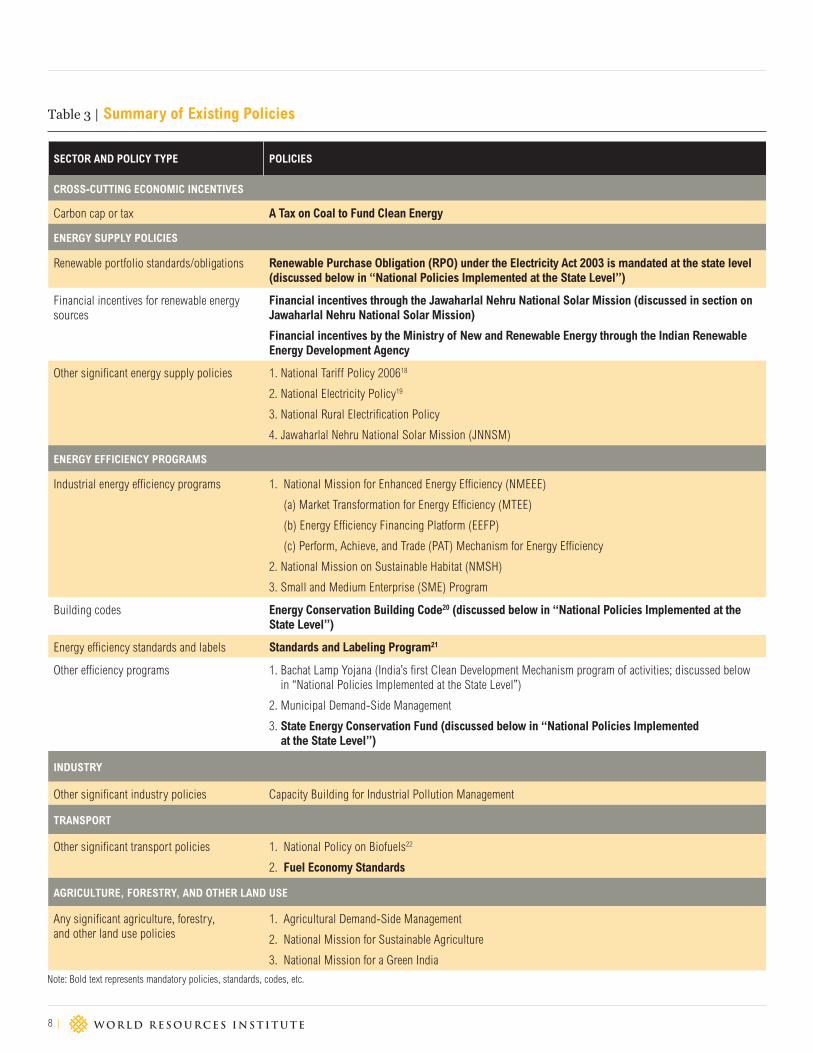
SECTOR AND POLICY TYPE POLICIES
CROSS-CUTTING ECONOMIC INCENTIVES
Carbon cap or tax A Tax on Coal to Fund Clean Energy
ENERGY SUPPLY POLICIES
Renewable portfolio standards/obligations Renewable Purchase Obligation (RPO) under the Electricity Act 2003 is mandated at the state level (discussed below in “National Policies Implemented at the State Level”)
Financial incentives for renewable energy sources
Financial incentives through the Jawaharlal Nehru National Solar Mission (discussed in section on Jawaharlal Nehru National Solar Mission)
Financial incentives by the Ministry of New and Renewable Energy through the Indian Renewable Energy Development Agency
Other significant energy supply policies 1. National Tariff Policy 200618
2. National Electricity Policy19
3. National Rural Electrification Policy
4. Jawaharlal Nehru National Solar Mission (JNNSM)
ENERGY EFFICIENCY PROGRAMS
Industrial energy efficiency programs 1. National Mission for Enhanced Energy Efficiency (NMEEE)
(a) Market Transformation for Energy Efficiency (MTEE)
(b) Energy Efficiency Financing Platform (EEFP)
(c) Perform, Achieve, and Trade (PAT) Mechanism for Energy Efficiency
2. National Mission on Sustainable Habitat (NMSH)
3. Small and Medium Enterprise (SME) Program
Building codes Energy Conservation Building Code20 (discussed below in “National Policies Implemented at the State Level”)
Energy efficiency standards and labels Standards and Labeling Program21
Other efficiency programs 1. Bachat Lamp Yojana (India’s first Clean Development Mechanism program of activities; discussed below in “National Policies Implemented at the State Level”)
2. Municipal Demand-Side Management
3. State Energy Conservation Fund (discussed below in “National Policies Implemented at the State Level”)
INDUSTRY
Other significant industry policies Capacity Building for Industrial Pollution Management
TRANSPORT
Other significant transport policies 1. National Policy on Biofuels22
2. Fuel Economy Standards
AGRICULTURE, FORESTRY, AND OTHER LAND USE
Any significant agriculture, forestry, and other land use policies
1. Agricultural Demand-Side Management
2. National Mission for Sustainable Agriculture
3. National Mission for a Green India
Table 3 | Summary of Existing Policies
Note: Bold text represents mandatory policies, standards, codes, etc.
GHG Mitigation in India: An Overview of the Current Policy Landscape
WORKING PAPER | March 2014 | 9
that amount was disbursed. Reasons for underutiliza-tion include, among other things, the sponsor minis-tries’ lack of capacity to develop proposals of sufficient quality and size to tap the fund’s full potential, lack of clarity in the eligibility criteria, and lack of provision for public-private partnerships. Severe underutilization of the National Clean Energy Fund is only one concern, however. More worrisome is the way the fund is used and administered. Rather than following its mandate of
“funding research and innovative projects in clean energy technologies,” it seems that ministries are using the fund to bridge the gap between budgetary allocations and programmatic requirements (CBGA, 2012).
Energy Supply Policies
National Tariff Policy: In compliance with section 3 of the Electricity Act 2003,23 the central government announced the Tariff Policy in January 2006. In 2011, the government amended the Tariff Policy in line with a State Electricity Regulatory Commission requirement that a fixed percentage of energy purchase come from renewable sources under the renewable purchase obligations (RPOs). As part of the strategy to construct a solar grid under the national solar mission, a specific solar component under the RPOs is proposed for power utilities. This solar power purchase obli-gation for states may start with 0.25 percent in phase 1 (by 2013) and go up to 3 percent by phase 3 (by 2022). Currently, every state but Arunachal Pradesh and Sikkim has its own annual solar RPO targets. Additionally, several feed-in tariffs target renewable energy generators. Specific feed-in tariffs are discussed in the next section on the National Electricity Policy. The Central Electricity Regulatory Commission is the central authority responsible for determining and monitor-ing tariffs, with the state electricity regulatory commissions responsible for the same at the state level.
National Electricity Policy: Administered by the Ministry of Power (MoP), the National Electricity Policy envisions a progressive increase in the share of electricity from nonconventional sources and a competitive bidding process for purchase by distribution companies. Consid-ering that it will take some time before nonconventional technologies can compete in cost with conventional sources, the Ministry of Power suggested that the Central Electricity Regulatory Commission might determine an appropriate differential in price to promote these tech-nologies (MoP, 2005). The Central Electricity Regulatory Commission is currently following this approach, and differential tariffs have been set to promote the use of solar, biomass, and wind energy.
Despite this national-level provision, however, each state electricity regulatory commission has the author-ity to apply its own fixed rate, which results in a range of applied feed-in tariffs at the state level. For example, the feed-in tariff for biomass cogeneration projects in Gujarat is Rs 5.17/kWh (US$0.08/kWh), while Maharashtra has a feed-in tariff of Rs 4.79/kWh (US$0.08/kWh) (MERC, 2012). In addition, state wind energy preferential tar-iffs range from Rs 3.51/kWh (US$0.06/kWh) in Tamil Nadu (for windmills commissioned after 31 July, 2012) to Rs 5.92/kWh (US$0.10/kWh) in Madhya Pradesh (Wind Power India, 2013), even though identical tariffs are applied at the national level. This variation in tariff policies means that some states are more attractive than others for new renewable energy project investments.
National Rural Electrification Policy: The National Electricity Policy states that the key development objec-tive of the power sector is to supply electricity to all areas, including rural areas, as mandated in section 6 of the Electricity Act (2003). In 2006, the Ministry of Power announced the National Rural Electrification Policy, which aims to provide access to electricity for all households by 2009, ensure quality and reliable power supply at reasonable rates, and ensure a minimum lifeline consumption24 of 1 unit per household per day as a merit good by 2012 (MoP, 2006). As of December 31, 2012, nine states and five union territories had 100 per-cent village electrification25 (Central Electricity Author-ity, 2013). Decentralized distribution-cum-generation is one initiative that has been implemented by the Ministry of Power under this policy. This initiative is designed to provide off-grid solutions for villages and habitations where grid connectivity is not feasible, and it encour-ages provision of alternative sources of power, provided these are more cost-effective than grid-integration. It is implemented on a build, operate, maintain, and transfer basis for 5 years, with the central government providing a 90 percent capital subsidy for projects. As of Septem-ber 2012, 284 projects based on solar photovoltaic (PV)/biomass/small hydro covering 682 villages/habitations and 73,904 households with a sanctioned cost of Rs 2.83 billion (US$45.6 million) were under implementation (Kumar, 2012). These villages are among the 34,875 unelectrified villages in India, representing 6 percent of all villages nationwide.
As of now, only grid-connected renewable power can be traded as renewable energy certificates (RECs) and con-tribute to the RPO targets. Because the Ministry of Power
10 |
initiative focuses on decentralized distribution-cum-generation with the primary goal of providing electricity, renewable energy projects under this initiative do not qualify for RECs and cannot contribute to RPOs. This and other associated challenges—including high capital and operating costs, lack of consumer awareness of technolo-gies, and lack of clarity of whether there is potential for grid-integration in the future—may discourage implemen-tation at the state level (Kumar, 2012).
Jawaharlal Nehru National Solar Mission (JNNSM): The JNNSM is one of the eight missions under the NAPCC and is dedicated to making India a global leader in solar energy through policies that aim to rapidly expand solar technologies across the country. The Ministry of New and Renewable Energy is the nodal agency for implementing the JNNSM.
The JNNSM facilitates a policy framework for deployment of an ambitious 20,000 megawatts (MW) of grid- connected solar power by 2022 (introduced through a phased approach) and promotes programs for off-grid applications to achieve targets of 1,000 MW by 2017 and 2,000 MW by 2022. The JNNSM promotes solar power through the use of a solar-specific renewable purchase obligation, which will make it mandatory for power utilities to supply a specified share of their power from solar power plants. In addition, the JNNSM offers two types of incentives to solar projects:
Generation-based incentives: The Indian Renewable Energy Development Agency (IREDA) selected 78 proj-ects with a total capacity of about 98 MW for which the ministry would provide generation-based incentives of Rs 12.41 per kWh (US$0.20 per kWh) to the state utili-ties when they directly purchase solar power from the project developers.
Capital subsidy: To support deployment of off-grid solar applications, the government provides a capital subsidy up to 30 percent of the benchmark cost and/or a soft loan at 5 percent interest (EnergyNext, 2012).
To help meet the targets set out in the first phase of the solar mission (1,000 – 2,000 MW by 2013), 1,000 MW of grid-connected projects that met minimum size and com-missioning date requirements were selected through two batches of reverse auctions. For the allocation in batch 2 of phase I, the CERC base price for solar PV projects was Rs 15.39/kWh (US$0.25/kWh) (against a base price of
Rs 17.91/kWh or US$0.29/kWh for allocation in batch 1). The winning bids for solar PV under batch 2 of JNNSM phase I varied from Rs 7.49/kWh (US$0.12/kWh) to Rs 9.41/kWh (US$0.15/kWh). It is notable that in batch 1, the range varied from Rs 10.95/kWh (US$0.18/kWh) to Rs 12.76/kWh (US$0.21/kWh).
To date, 1,100 MW of the proposed 1,000–2,000 MW grid-connected solar target for 2013 has been allocated. As of August 31, 2012, 1,044 MW of grid-connected solar power had been installed in the country (MoNRE, 2012). The sanctioned capacity of off-grid applications is more than 128 MW (the target is 200 MW). From the targeted 7 million square meters of collector area by 2013, more than 5.7 million (more than 80 percent) square meters of thermal collectors has been installed since August 31, 2012 (MoNRE, 2012).
In order to provide solar power at affordable prices, the national thermal power corporation Vidyut Vyapar Nigam has put in place a scheme to support 1,000 MW of grid-connected solar PV through a mechanism that bundles solar power with thermal power from the government’s unallocated quota.26
Financial Incentives Offered by the Ministry of New and Renewable Energy through the Indian Renewable Energy Development Agency: The Min-istry of New and Renewable Energy (MoNRE), through the Indian Renewable Energy Development Agency (IREDA), offers a number of financial incentives in renew-able energy sectors, including hydro-, solar, wind, and bio-energy, as well as energy efficiency and conservation. The schemes are numerous and wide ranging, and a descrip-tion of each is beyond the scope of this paper. In addi-tion to the feed-in tariffs described earlier, the types of schemes offered include small subsidies for small hydro-power projects of up to 25 MW (e.g., subsidy of Rs 37.5 million per MW (US$0.06 million per MW) apart from 45 percent of project cost or Rs 22.5 million (US$0.36 mil-lion), whichever is lower); fiscal tax incentives for biomass power generation (e.g., 100 percent depreciation in the first year claimable for power generation equipment such as fluidized bed boilers, back pressure pass out, and high efficiency boilers); and incentives for the wind energy sector (such as exemption/reduction in central sales tax and general sales tax available on sale of renewable energy equipment in various states) (IREDA, 2011). The Ministry of New and Renewable Energy also has a scheme for generation-based incentives for grid-connected wind
GHG Mitigation in India: An Overview of the Current Policy Landscape
WORKING PAPER | March 2014 | 11
power projects, with IREDA as the nodal agency. Under the scheme, the ministry provides a generation-based incentive of Rs 0.50/kWh (US$0.01/kWh), with a total cap of Rs 6.2 million/MW (US$0.10 million/MW) spread over a minimum of 4 years, translating to an annual cap of Rs 1.55 million/MW (US$0.03 million/MW). The scheme ended on March 31, 2012, but the generation-based incentive was again approved by the central gov-ernment in August 2013. Wind projects registered under the scheme will get the earlier incentive of Rs 0.50/kWh (US$0.01/kWh), with an increased cap of Rs 10 million/MW (US$0.16 million/MW) eligible for a period spanning from 4 to 10 years. In addition to direct support for renew-able energy sources, the Ministry of New and Renewable Energy also offers financing of new and emerging technol-ogies such as fuel cells and battery-powered vehicles.
Energy Efficiency Programs
National Mission for Enhanced Energy Efficiency: The National Mission for Enhanced Energy Efficiency is one of the eight missions under the NAPCC. The Energy Conservation Act of 2001 provides a legal mandate for the implementation of energy efficiency measures through the Bureau of Energy Efficiency (BEE) by establishing state-level designated agencies. A number of schemes and programs aim to save fuel in excess of 23 million tons of oil equivalent (mtoe), avoid capacity addition of 19,000 MW, and mitigate 98 million tons of CO2 emissions per year by 2014–15 (Garnaik, 2011). Market Transformation for Energy Efficiency; Energy Efficiency Financing Plat-form; and Perform, Achieve, and Trade are key initiatives under this mission.
Market Transformation for Energy Efficiency: One of the key strategies under the National Mission for Enhanced Energy Efficiency uses international financ-ing instruments to finance key energy efficiency proj-ects. The Market Transformation for Energy Efficiency initiative envisages aggregating small demand-side management (DSM) projects under one roof, thereby reducing the transaction costs in obtaining Clean Devel-opment Mechanism funds (MoP, 2010). BEE is consid-ering a Clean Development Mechanism programme of activities in the lighting sector (Bachat Lamp Yojana); municipal DSM; agricultural DSM; the micro-, small, and medium enterprise (MSME) sector; the commercial building sector; and distribution transformers. Mar-ket Transformation for Energy Efficiency also seeks to accelerate the shift to energy efficient appliances in designated sectors, reducing the manufacturing cost
of these products through market incentives and thus making them more affordable. Bachat Lamp Yojana, currently implemented under Market Transformation for Energy Efficiency, has resulted in the distribution of over 20 million compact fluorescent lamps (CFLs) to households. To date, 16 states have taken steps toward implementing Bachat Lamp Yojana, with Kerala the most successful. Low certified emission reduction (CER) prices and a 20–30 percent increase in CFL manufacturing cost over the past 2 years have cre-ated financing issues for Bachat Lamp Yojana’s project developers (Paliwal, 2013).
Energy Efficiency Financing Platform: The Energy Efficiency Financing Platform is another complemen-tary strategy under the National Mission for Enhanced Energy Efficiency. The initiatives under this platform focus on the creation of mechanisms to help finance demand-side management programs in all sectors by capturing future energy savings. This includes ensuring availability of finance at reasonable rates for energy effi-ciency project implementation, expanding the financing platform to include public and private sector banks, and accrediting energy service companies (ESCOs) through rating agencies like CRISIL/ICRA (MoP, 2010). The Ministry of Power created Energy Efficiency Services Ltd. as a corporate entity to coordinate and lead these market-related activities. In its current capacity, Energy Efficiency Services Ltd. serves as an ESCO, a consul-tancy organization for CDM and energy efficiency projects, and a capacity-building resource center for utilities and financial institutions (EESL, 2010). As of May 2013, 128 ESCOs have been accredited by BEE with validity until September 30, 2013 (BEE, 2013). The Global Environment Facility and the World Bank, in partnership with the Small Industries Development Bank of India and BEE, have implemented an initia-tive on financing energy efficiency in MSME clusters to improve energy efficiency and reduce GHG emissions from MSMEs utilizing increased commercial financing for energy efficiency (Garnaik, 2011).
Perform, Achieve, and Trade (PAT) Mechanism for Energy Efficiency: The Energy Conservation Act of 2001 identified 15 large energy-intensive industries for energy efficiency improvements. Sections 14 (e) and 14 (g) of the act empower the central government, on the recommendations of BEE, to prescribe energy consumption norms and standards for energy intensive industries. The Energy Conservation Act names these
12 |
energy intensive industries as designated consumers. Of the 15 designated consumers, eight (aluminum, textile, cement, chlor-alkali, pulp and paper, fertil-izers, power generation plants, and iron and steel) are covered under the Perform, Achieve, and Trade (PAT) scheme. PAT is a market-based mechanism to reduce the specific energy consumption of these designated consumers. The first phase of the scheme began in April 2011 and will end by March 2014. The Energy Conser-vation Act was amended in 2010 to reduce the risk of noncompliance by increasing the penalty. Each desig-nated consumer is given a specific energy consumption target to meet over a period of 3 years. Any additional savings can be used to earn energy saving certificates (ESCerts), which are tradable with designated consumers who are short of targets. Consumers unable to nullify their shortfalls will be penalized Rs 1 million (US$0.02 million), in addition to an amount proportional to the number of units the target is short by. The first 3 years of the Perform, Achieve, and Trade scheme are expected to see savings of 9.78 million tons of oil equivalent (mtoe) and 26.21 Mt of GHG emissions, resulting in an expected avoided capac-ity addition of 5,623 MW (Garnaik, 2011). There are estimates that this scheme, if implemented fully, will result in overall energy savings of around 24 mtoe by 2020 (Planning Commission, 2011a). As of September 2012, the total number of designated consumers was 478 (aluminum: 10; cement: 76; chlor-alkali: 22; fertil-izer: 29; iron and steel: 28; iron and steel integrated: 27; iron and steel sponge: 25; power plant: 145; pulp and paper: 31; textile: 85) (BEE, 2012d). This scheme applies only to large industries, but gains could be realized by expanding its provisions to smaller industries. States are best positioned to assess the barriers—such as huge upfront capital requirement, limited access to energy efficient technologies, and the dispersed nature of these industries (Shrivastava and Upadhyaya, 2008)—and work toward including smaller industries under the PAT scheme.
National Mission on Sustainable Habitat: Approved as one of the eight missions of the NAPCC, the National Mission on Sustainable Habitat seeks to promote sus-tainable habitats through improved energy efficiency of buildings, urban planning, management of solid and liquid waste, modal shift toward public transport, and conserva-tion through appropriate changes in the legal and regula-tory framework (MoUD, 2010). The transport sector plays a
crucial role in energy use and GHG emissions. This mission therefore prioritizes vehicle energy efficiency, use of mass transport, walking and cycling, and transport demand man-agement measures. Specific strategies for the transport sec-tor include strengthening the public transportation system in urban areas through a combination of promotional, regu-latory, and fiscal measures; reducing the fuel consumed per passenger traveled using modal shift transfer; integrating the entire intercity road passenger transport network with urban transport systems; introducing fuel efficiency stan-dards for new and used vehicles; and facilitating research and development to develop new products and technologies that can help reduce energy consumption in Indian cities. In addition to transport sector initiatives, the mission also focuses on enforcing policies and regulations strictly at the local level and on defining future growth strategies through urban planning that keeps in mind both poverty reduction and climate mitigation considerations.
The National Mission on Sustainable Habitat lacks clear policies and measures, however, as well as associated implications for GHG reductions. The only concrete lines of action are the three initiatives mentioned in the mis-sion document: the Energy Conservation Building Code, recycling of material and urban waste management, and improved urban planning and modal shift to public trans-port. Among these, the Energy Conservation Building Code is mandated for commercial27 buildings in eight states by BEE (PTI, 2011). It is discussed in more detail in the section
“National Policies Implemented at the State Level.”
Small and Medium Enterprise (SME) Program: BEE initiated its SME program to accelerate the adoption of energy efficiency technologies and practices in 25 clusters28 in the SME sector through knowledge sharing, capacity building, and innovative financing mechanisms to gradually eliminate the barriers mentioned above and make these industries capable of achieving time-bound, reduced energy consumption targets. The micro-, small-, and medium- enterprise (MSME) sector contributes to over 45 percent of industrial production and around 40 percent of total exports (BEE, 2012a). The targeted clusters are spread across 12 states. Several activities were planned for the SME clusters for the year 2011–12, including better adoption of identified measures and technologies, the dissemination of cluster-specific results, and an impact assessment of the program (BEE, 2012a). In partnership with the Ministry of Power, BEE prepares manuals for industry-specific energy conservation mea-sures for different clusters. A targeted energy reduction of
GHG Mitigation in India: An Overview of the Current Policy Landscape
WORKING PAPER | March 2014 | 13
1.75 mtoe (or 5.75 percent) as a result of the SME program has been set for the 12th 5-year plan period (2012–17) (Working Group on Power, 2012).
Standards and Labeling Program: Another key area for BEE is the Standards and Labeling program. The program’s key objective is to provide consumers with the information needed to make informed choices about the energy and cost saving potential of household appli-ances and equipment (BEE, 2012b). The Standards and Labeling program is expected to realize energy savings in the medium and long term, while at the same time posi-tioning domestic industry to compete in markets where norms for energy efficiency are mandatory. The scheme will involve mandatory labeling of equipment and appli-ances for domestic sectors, hotel equipment, office equip-ment, industrial products, and transport equipment. As of January 2013, labeling was mandatory for four appliances: frost-free refrigerators, tubular fluorescent light bulbs, air conditioners, and distribution transformers. Labels for direct cool refrigerators, induction motors, pump sets, ceiling fans, liquefied petroleum gas, electric geysers, and color televisions are voluntary. In January 2014, BEE tightened the energy norms for air conditioners by one level and those for refrigerators by two levels (Mukherjee, 2014). Between 2007 and 2011, 11,600 million units (MUs) of electricity were saved and an avoided capacity of 5,115.5 MW was achieved as a result of the Standards and Labeling program (BEE, 2012c). Likely savings from the program in the year 2016–17 is estimated at 10.4 billion units (BUs) of electrical energy and 4.3 mtoe of thermal energy (Working Group on Power, 2012). According to the 12th 5-year plan, overall savings from the Standards and Labeling program resulted in an estimated avoided installed capacity of more than 7,500 MW during the 11th 5-year plan period.
Municipal Demand-Side Management: Another BEE initiative, this scheme targets replacement of equipment in street lighting and other services provided by munici-pal bodies in response to increasing urbanization. These services usually consume large amounts of electricity inef-ficiently. The implementation of these energy efficiency measures can reduce the cost of energy in the municipali-ties’ budget (it currently amounts to approximately 50 percent of their budget) by up to 25 percent (Demand Side Management, 2012). The government of India, through BEE, has initiated a program to cover 175 municipalities by conducting investment grade energy audits and prepar-ing detailed project reports. Energy service companies (ESCOs) are being encouraged to implement the program
with the help of financial institutions (Demand Side Man-agement, 2012). The projected electricity savings at the end of the 12th 5-year plan (2012–17) is estimated at 0.47 BUs (Working Group on Power, 2012).
Industry
Capacity Building for Industrial Pollution Man-agement: The state pollution control boards implement this project, which scales up the cleanup and rehabili-tation of polluted sites and facilitates the reduction of environmental and health risks through technical capac-ity building. With financial and technical assistance from the World Bank, the states of Andhra Pradesh and West Bengal have begun implementing this initiative. The proj-ect, which will last 5 years, became effective on October 13, 2010. Its total cost is US$75.39 million (85 percent as financial assistance from the World Bank and 15 percent as contribution by the government of India, West Bengal, and Andhra Pradesh) (MoEF, 2010c). The project was envisioned to support the development of a policy, insti-tutional, and methodological framework for the estab-lishment of the National Program for Rehabilitation of Polluted Sites. The methodological framework for invento-rying polluted sites is already developed, establishing best practice solutions and engaging multiple stakeholders during the implementation. Additionally, environmental compliance assistance centers, now fully functional, and pollution remediation technologies have been piloted at select sites. Mechanisms have been established to moni-tor water quality and soil characteristics at the pilot sites over the long term, and the Ministry of Environment and Forests has established a network of state pollution con-trol boards to disseminate knowledge and provide project-based training (MoEF, 2010c; MoEF, 2011).
Transport
National Policy on Biofuels: Administered by the Ministry of New and Renewable Energy and approved in December 2009, this policy aims to create a central role for biofuels in the energy and transportation sectors. An indicative target of 20 percent blending of biofuels, both for biodiesel and bioethanol, by 2017, has been proposed. In October 2008, a 10 percent blending level of bioethanol with gasoline became mandatory, so that the indicative blending target of 20 percent can be reached (MoNRE, 2009). The government failed to achieve the goal of 20 percent diesel blending by 2012, however, because not enough jatropha seeds were available for biodiesel pro-duction (Zafar, 2013).
14 |
Fuel Economy Standards: Fuel economy standards and their implementation timeline are set by the Cen-tral Pollution Control Board. The standards regulate the output of air pollutants from internal combustion engine equipment, including motor vehicles. The standards were first introduced in 2000 and became progressively more stringent. The current norms, which took effect in April 2010, are Bharat Stage IV in 15 major cities and Bharat Stage III29 in the rest of India. India follows European norms for fuel efficiency with a 5-year lag (Chauhan, 2013). Moreover, the current standards are voluntary. In 2012, the central government cleared the fuel mileage standards and labeling for new cars, requiring automobile manufacturers to display certified efficiency labels on each car they sell. Under the new norms (which BEE designed), fuel efficiency targets for each company will be based on the average weight of its entire fleet. The new standards were announced in late 2013 and companies were pro-vided with a 3-year window to improve their technology to meet the standards (Bhattacharya, 2013).
Agriculture, Forestry, and Other Land Use
Agricultural Demand-Side Management: BEE’s Agricultural Demand-Side Management scheme aims to save energy and cost by replacing inefficient pump sets. Under this program, BEE provides resources to create a set of bankable detailed project reports in the agricultural sector, specifically to replace inefficient irrigation pumps. BEE has already initiated the Agricultural Demand-Side Management program for preparation of detailed proj-ect reports as pilot projects in five states: Maharashtra, Gujarat, Haryana, Punjab, and Rajasthan (BEE, 2009a). Countrywide electricity savings (from replacement of 20 million pumps) is estimated at 62.1 BUs annually, which translates to savings of Rs 180 billion (US$2.90 billion) (BEE, 2009a). Projected savings under the Agricultural Demand-Side Management program (with targeted replacement of 0.25 million pump sets) at the end of the 12th 5-year plan period (2012–17) is about 0.7 BUs (Work-ing Group on Power, 2012).
National Mission on Sustainable Agriculture: This mission strives to devise strategies to make Indian agriculture more resilient to climate change, especially by improving the productivity of rainfed agriculture. Some of the mission interventions have implications for climate change mitigation, such as research and development on energy efficient irrigation systems and promotion of energy-conserving equipment at the farm level.
National Mission for a Green India: The Indian Gov-ernment launched the National Mission for a Green India (one of the eight missions under the NAPCC) to increase forest/tree cover, improve ecosystem services, increase forest-based livelihood income, and enhance CO2 seques-tration. This mission aims to increase the forest and tree cover on 5 million hectares of forest and nonforest lands and improve quality of forest cover on another 5 million hectares of nonforest and forest lands. The proposed rate of planting increased from 1.6 million hectares to 3.3 million hectares during the 11th 5-year plan. Joint forest management committees will participate in the afforesta-tion of 6 million hectares of degraded forest land, with Rs 60 billion (US$968 million) in funding (NAPCC, 2008).
Another objective of the National Mission for a Green India is to enhance annual CO2 sequestration by 50 to 60 million tonnes by the year 2020 (MoEF, 2010b). Among northeastern states, Nagaland started implementing the mission in its two most vulnerable districts in 2011–12 and plans to expand the mission to other districts in 2012–13. Punjab recently launched its green mission to double its forest area from 7 percent to 15 percent. Most states run the mission as a bridge plan under the prepara-tory phase, and they are required to present the perspec-tive plan for the present year. Entry-point activities like measures to retain improved soil moistures, increasing green cover by involving local communities directly, and channeling available funds with other welfare schemes are underway. Chhattisgarh, Madhya Pradesh, and Maharash-tra received the largest fund allocations from the central government, at least for the kickoff/preparatory efforts (Collaco, 2012).
National Policies Implemented at the State Level
Renewable Purchase Obligation (RPO) under the Electricity Act 2003: The Electricity Act 2003 supports the market expansion of renewable energy by stipulating that a percentage of the power procured by distribution utilities be from renewable energy sources. The renewable purchase obligation (RPO) is mandated at the state level with a target of producing 15 percent of India’s electricity from renewable sources by 2020. The RPO, as well as the preferential tariff for procurement of such power, has been specified by various state electricity regulatory commissions (SERCs). The renewable energy certificate (REC) mechanism, launched in November 2010, is a market-based instrument promoting the twin goals of harnessing renewable energy sources in areas with high potential and ensuring compliance with the
GHG Mitigation in India: An Overview of the Current Policy Landscape
WORKING PAPER | March 2014 | 15
RPO by resource-deficit states. One REC represents a tradable commodity of 1 MWh of electricity from eligible renewable energy sources.
As of June 2012, 26 SERCs have set the mandatory purchase obligation under the Electricity Act 2003 for purchase of a fixed percentage of energy generated from renewable energy sources (Table 4). In 2012–13, the RPO percentages varied from 0.5 percent to 10 percent, depending on the local renewable resources and the electricity distributed in that area (Global Wind Energy Council et al., 2012).
Recently, the Delhi Electricity Regulatory Commission announced RPO regulations for the national capital region. Electricity consumption in Delhi is high, and the REC market would be strengthened by strong enforcement there. Like other cap-and-trade mechanisms around the world, the REC mechanism faces implementation and enforcement challenges. Key challenges include:
Some states have found it difficult to achieve the RPO targets from the onset of the regulation. Between 2007 to 2010, states like Bihar, Haryana, Kerala, Madhya Pradesh, Odisha, and Punjab have consistently failed to achieve the RPO targets (ranging from 30 percent for Punjab to 90 percent for Kerala) (Singh, 2010). In contrast, states like Karnataka and Tamil Nadu have surpassed their respective targets for each year.
The RPO targets are not economically related to the prescribed level of feed-in tariffs in most states, leading to a demand-supply mismatch for electricity generated from renewable energy (Singh, 2010). Calculation of feed-in tariffs currently does not consider the RPO tar-gets. Hence states with higher RPO targets might have lower feed-in tariffs and vice versa. This discourages the producers, leading to a demand-supply mismatch. The Odisha government has asked the central government for a subsidy to purchase solar power, making it the first state to openly express its inability to purchase renew-able energy that is generally very expensive.
Most of the state distribution companies are cash-strapped. Even in states like Tamil Nadu and Rajasthan, the state distribution companies are debt-ridden and delay payments to renewable energy developers (Paliwal, 2012).
Enforcement is often inconsistent. None of the state distribution companies have come forward to buy RECs,
even though they are obligated by law to do so. This has a direct impact on the price of RECs. The price of RECs fell by 45 percent in October 2012 relative to prices in 2011. The unsold certificates reduced the incentives for gen-eration by states with a surplus of renewable energy and eventually the investment flow in the clean energy sector of the country (Power Today, 2012). Some states, like Pun-jab, have secured approval to carry forward their obliga-tions to the following year, while others have appealed to the courts to decide whether the RPO even applies to them (Ramesh, 2012). Although there has been no significant change in the demand, supply, and cleared volumes of the solar RECs, the November 2013 numbers point toward an increase in the traded volume of nonsolar RECs dur-ing the last quarter of the year. This implies increased momentum toward compliance with RPO targets by the end of 2013–14. States like Punjab, Uttarakhand, Maha-rashtra, and union territories have recently mandated stricter RPO compliance regimes.
Energy Conservation Building Code: The Ministry of Power launched the Energy Conservation Building Code in 2007, under the auspices of the Energy Conservation Act (2001). The code sets minimum energy efficiency stan-dards for commercial buildings. It applies to buildings or building complexes that have a connected load of 500 KW or greater, or a contract demand of 600 kilovolt-amps or greater. As of 2013, the code was mandatory in eight states (Table 4). Labeling programs for three categories of build-ings (day-use office buildings, business process outsourc-ing buildings, and shopping malls) have been developed and implemented. As of March 2011, 136 buildings had been found eligible for labels. Moreover, BEE-empaneled ESCOs are engaged in performance-based contracts with client firms to implement energy efficient retrofit mea-sures in existing buildings to reduce costs and energy consumption in a technically viable manner. According to BEE, as of August 2012, Rajasthan and Odisha had issued notifications for Energy Conservation Building Code rules; Uttar Pradesh, Uttaranchal, Karnataka, and Lakshadweep had amended the Energy Conservation Building Code to suit their local and regional climatic conditions; and Punjab, Gujarat, and Chhattisgarh were in the process of amending the Energy Conservation Building Code. Pro-jected energy savings at the end of the 12th 5-year plan (2012–17) are 5.07 BUs (Working Group on Power, 2012).
State governments are responsible for enforcing the Energy Conservation Building Code, and improved coor-dination between the central and state governments is
16 |
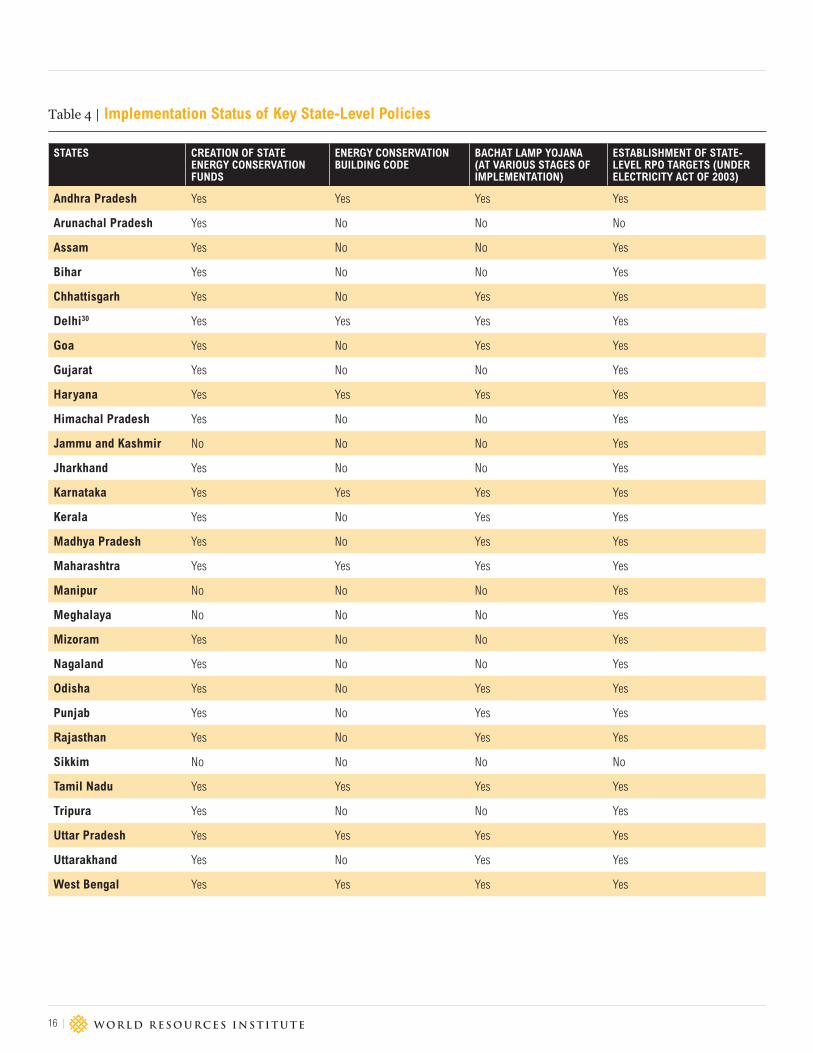
Table 4 | Implementation Status of Key State-Level Policies
STATES CREATION OF STATE ENERGY CONSERVATION FUNDS
ENERGY CONSERVATION BUILDING CODE
BACHAT LAMP YOJANA (AT VARIOUS STAGES OF IMPLEMENTATION)
ESTABLISHMENT OF STATE-LEVEL RPO TARGETS (UNDER ELECTRICITY ACT OF 2003)
Andhra Pradesh Yes Yes Yes Yes
Arunachal Pradesh Yes No No No
Assam Yes No No Yes
Bihar Yes No No Yes
Chhattisgarh Yes No Yes Yes
Delhi30 Yes Yes Yes Yes
Goa Yes No Yes Yes
Gujarat Yes No No Yes
Haryana Yes Yes Yes Yes
Himachal Pradesh Yes No No Yes
Jammu and Kashmir No No No Yes
Jharkhand Yes No No Yes
Karnataka Yes Yes Yes Yes
Kerala Yes No Yes Yes
Madhya Pradesh Yes No Yes Yes
Maharashtra Yes Yes Yes Yes
Manipur No No No Yes
Meghalaya No No No Yes
Mizoram Yes No No Yes
Nagaland Yes No No Yes
Odisha Yes No Yes Yes
Punjab Yes No Yes Yes
Rajasthan Yes No Yes Yes
Sikkim No No No No
Tamil Nadu Yes Yes Yes Yes
Tripura Yes No No Yes
Uttar Pradesh Yes Yes Yes Yes
Uttarakhand Yes No Yes Yes
West Bengal Yes Yes Yes Yes
GHG Mitigation in India: An Overview of the Current Policy Landscape
WORKING PAPER | March 2014 | 17
needed. State governments may amend the codes pre-pared by the central government, however, to meet their local and regional climatic conditions. Proper delegation of responsibilities to urban local bodies will be the key to Energy Conservation Building Code compliance. National- and state-level recognition to reward exemplary works will motivate owners, designers, and building developers to follow the Energy Conservation Building Code’s require-ments in the projects (Satish Kumar, 2010).
Bachat Lamp Yojana: This BEE-developed scheme promotes energy efficient lighting. The Bachat Lamp Yojana scheme was registered as a “Small-Scale CDM Program of Activities” by the UNFCCC Execution Board on April 29, 2010. It is estimated that CFLs are up to 80 percent more energy efficient and can last 10 times longer than incandescent bulbs (Ndungu, Nderu, & Ngoo, 2012). As part of the Bachat Lamp Yojana scheme, a 60-watt incandescent bulb can be replaced with a 11–15-watt CFL and a 100-watt bulb with a 18–23-watt CFL. A maximum of four bulbs can be replaced per household. Under each CDM program of activities, approximately 600,000 CFLs can be distributed (at four CFLs per household), with the limit of 60 GWh or approximately 60,000 tonnes of CO2-eq savings yearly. It is estimated that replacing 400 million incandescent lamps (ICLs) with CFLs will result in a combined reduction of 20 million tonnes of CO2 from grid-connected power plants (BEE, 2009b). Sixteen states and one union territory (Table 4) have taken steps toward implementation of the scheme in their respective Distribu-tion Company (DISCOM) regions (BEE, 2011a) (different states are in different stages of implementation—20 CDM projects have been registered from Kerala alone and seven in Karnataka). The projected energy savings at the end
of the 12th 5-year plan (2012–17) are 4.4 BUs (Working Group on Power, 2012).
State Energy Conservation Fund: Each state is required to establish a state energy conservation fund under section 16 of the Energy Conservation Act of 2001. State energy conservation funds aim to promote the efficient use and conservation of energy within the state. State-proposed activities include awareness raising, R&D, development and execution of energy efficiency demon-stration projects, and energy conservation (UPSDA, 2012). The Ministry of Power approved a scheme in 2009–10 to provide initial contributions to each state energy conserva-tion fund through BEE. The total financial outlay of the scheme was Rs 700 million (US$11.3 million) for the last 3 years of the 11th 5-year plan (2009–10 to 2011–12) (BEE, 2011b). All but four states have established energy conser-vation funds (Table 4).
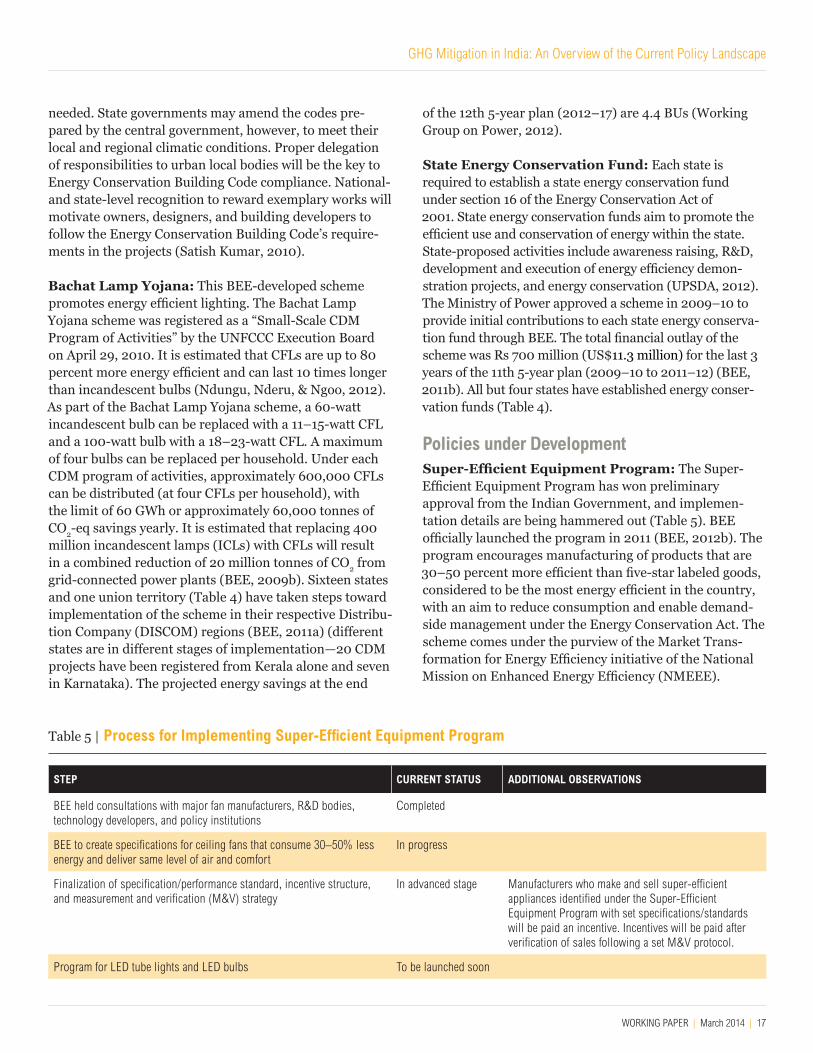
Policies under DevelopmentSuper-Efficient Equipment Program: The Super-Efficient Equipment Program has won preliminary approval from the Indian Government, and implemen-tation details are being hammered out (Table 5). BEE officially launched the program in 2011 (BEE, 2012b). The program encourages manufacturing of products that are 30–50 percent more efficient than five-star labeled goods, considered to be the most energy efficient in the country, with an aim to reduce consumption and enable demand-side management under the Energy Conservation Act. The scheme comes under the purview of the Market Trans-formation for Energy Efficiency initiative of the National Mission on Enhanced Energy Efficiency (NMEEE).
Table 5 | Process for Implementing Super-Efficient Equipment Program
STEP CURRENT STATUS ADDITIONAL OBSERVATIONS
BEE held consultations with major fan manufacturers, R&D bodies, technology developers, and policy institutions
Completed
BEE to create specifications for ceiling fans that consume 30–50% less energy and deliver same level of air and comfort
In progress
Finalization of specification/performance standard, incentive structure, and measurement and verification (M&V) strategy
In advanced stage Manufacturers who make and sell super-efficient appliances identified under the Super-Efficient Equipment Program with set specifications/standards will be paid an incentive. Incentives will be paid after verification of sales following a set M&V protocol.
Program for LED tube lights and LED bulbs To be launched soon
18 |
The goal of the Super-Efficient Equipment Program is not only to reduce the cost of energy efficient equipment to stimulate accelerated market transformation but also to provide financial incentives to domestic manufacturers to cover the incremental cost of producing super-efficient (SE) fans so that they are able to sell the products at prices com-parable to normal appliances (Chunekar and Singh, 2013) and sustain the market. Savings of 60 billion kWh and peak capacity avoidance of 20,000 MW can be achieved by 2020 under a moderate standards and labels (S&Ls) scenario if 60 percent of the stock of only four appliances (room air conditioners, refrigerator, fans, TVs) is super-efficient (Prayas Energy Group, 2012). The program design phase for ceiling fans is complete, and the framework for imple-mentation has been proposed by BEE. To move forward, BEE must publicize the program and invite participation, after which it can collect and review applications from interested manufacturers. Qualifiers will start producing super-efficient fans after a sample is successfully tested and incentives awarded. The Super-Efficient Equipment Pro-gram will be extended to light-emitting diode (LED) tube lights and LED bulbs as well. According to the 12th 5-year plan, this program has the potential to save 6.06 billion units per annum by 2016–17, thereby avoiding an installed capacity of 1,500 MW during this period.
Strategic Plan for the New and Renewable Energy Sector: The Ministry of New and Renewable Energy has prepared the Strategic Plan for the New and Renewable Energy Sector for the period 2011–17, covering the last year of the 11th 5-year plan and the 5 years of the 12th plan. It has also developed aspirational goals until 2022 that articu-late the strategy to achieve those goals and the correspond-ing action plan (for specific information by technology, see Table 6). The Strategic Plan is intended to aid the ministry in its mission to increase the contribution of renewable energy to the country’s total energy mix to 6 percent by 2022, with about a 10 percent contribution to total electric-ity mix, which is in line with the Integrated Energy Policy Report projections. The following key factors will play an important role in policy effectiveness (MoNRE, 2011):
Achievements of installed capacity of grid-interactive renewable power and its contribution to electricity mix
Achievements with regard to deployment of various off-grid/decentralized renewable energy systems vis-à-vis the set targets
Deployment in areas not covered by conventional elec-tricity supply
Substitution of usage of kerosene and diesel in different sectors—rural, urban, and industrial
General improvement in quality and affordability of renewable energy systems and devices
General user perception and satisfaction
Technical R&D, substitution of fossil fuel, and increasing the contribution of renewables to India’s electricity mix by 10 percent are identified as the ministry’s mission until 2022. The ministry’s desire to create an industrial manu-facturing base for renewable technologies is also evident in the plan. Based on the cumulative targets provided for the entire 6 years, solar PV, solar lighting for remote village electrification, and microhydel water mill systems appear most promising for off-grid application (MoNRE, 2011). From the total fund allocation requirement of approximately Rs 137 billion (US$2.21 billion), 69 percent is envisaged for off-grid solar PV-based rural electrifica-tion systems. Solar (both PV and thermal) dominates the targets for grid-based addition too, with 65 percent of total funds earmarked for it (MoNRE, 2011). The ministry considers the deployment of new financial instruments, opening of new market channels, and reduction of renew-able system costs to be “high” and “near term” priorities. While promoting small power plants as tail-end genera-tors to the centralized grid and associated RPO possibili-ties may encourage physical scale-up, providing platforms for rural enterprises and new financial instruments may encourage new business models in the renewable sector.
Reducing Emissions from Deforestation and For-est Degradation Plus (REDD+): The Indian Network for Climate Change Assessment (INCCA) estimates that by 2030, 8–56 percent of India’s forests are likely to experi-ence a change in vegetation type compared to the 1970s. There is likely to be an increase in net primary produc-tivity of 20 to 57 percent (INCCA, 2010b). The Ministry of Environment and Forests has estimated that a REDD+ program for India can incentivize capture of more than 1 billion tons of additional forest carbon (other than that from the ongoing social forestry and national afforestation programs) over the next three decades and provide more than US$3 billion as carbon service incentives (MoEF, 2011).
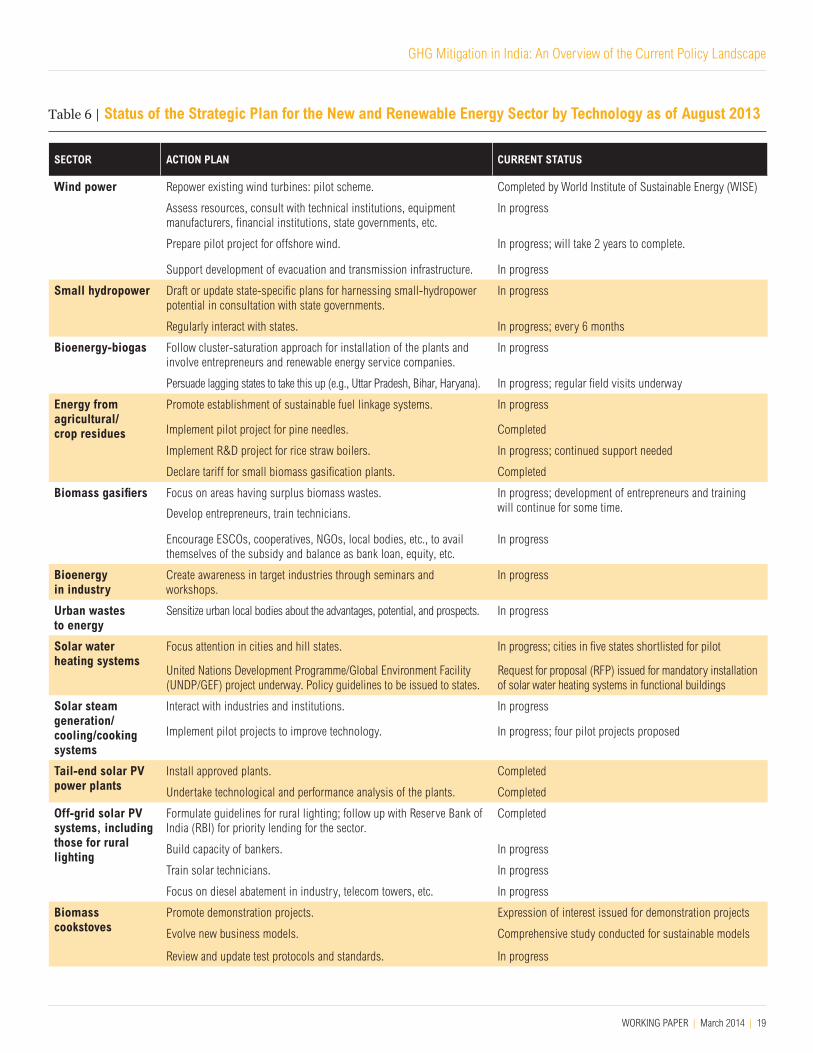
GHG Mitigation in India: An Overview of the Current Policy Landscape
WORKING PAPER | March 2014 | 19
Table 6 | Status of the Strategic Plan for the New and Renewable Energy Sector by Technology as of August 2013
SECTOR ACTION PLAN CURRENT STATUS
Wind power Repower existing wind turbines: pilot scheme. Completed by World Institute of Sustainable Energy (WISE)
Assess resources, consult with technical institutions, equipment manufacturers, financial institutions, state governments, etc.
In progress
Prepare pilot project for offshore wind. In progress; will take 2 years to complete.
Support development of evacuation and transmission infrastructure. In progress
Small hydropower Draft or update state-specific plans for harnessing small-hydropower potential in consultation with state governments.
In progress
Regularly interact with states. In progress; every 6 months
Bioenergy-biogas Follow cluster-saturation approach for installation of the plants and involve entrepreneurs and renewable energy service companies.
In progress
Persuade lagging states to take this up (e.g., Uttar Pradesh, Bihar, Haryana). In progress; regular field visits underway
Energy from agricultural/ crop residues
Promote establishment of sustainable fuel linkage systems. In progress
Implement pilot project for pine needles. Completed
Implement R&D project for rice straw boilers. In progress; continued support needed
Declare tariff for small biomass gasification plants. Completed
Biomass gasifiers Focus on areas having surplus biomass wastes.
Develop entrepreneurs, train technicians.
In progress; development of entrepreneurs and training will continue for some time.
Encourage ESCOs, cooperatives, NGOs, local bodies, etc., to avail themselves of the subsidy and balance as bank loan, equity, etc.
In progress
Bioenergy in industry
Create awareness in target industries through seminars and workshops.
In progress
Urban wastes to energy
Sensitize urban local bodies about the advantages, potential, and prospects. In progress
Solar water heating systems
Focus attention in cities and hill states. In progress; cities in five states shortlisted for pilot
United Nations Development Programme/Global Environment Facility (UNDP/GEF) project underway. Policy guidelines to be issued to states.
Request for proposal (RFP) issued for mandatory installation of solar water heating systems in functional buildings
Solar steam generation/cooling/cooking systems
Interact with industries and institutions. In progress
Implement pilot projects to improve technology. In progress; four pilot projects proposed
Tail-end solar PV power plants
Install approved plants. Completed
Undertake technological and performance analysis of the plants. Completed
Off-grid solar PV systems, including those for rural lighting
Formulate guidelines for rural lighting; follow up with Reserve Bank of India (RBI) for priority lending for the sector.
Completed
Build capacity of bankers. In progress
Train solar technicians. In progress
Focus on diesel abatement in industry, telecom towers, etc. In progress
Biomass cookstoves
Promote demonstration projects. Expression of interest issued for demonstration projects
Evolve new business models. Comprehensive study conducted for sustainable models
Review and update test protocols and standards. In progress
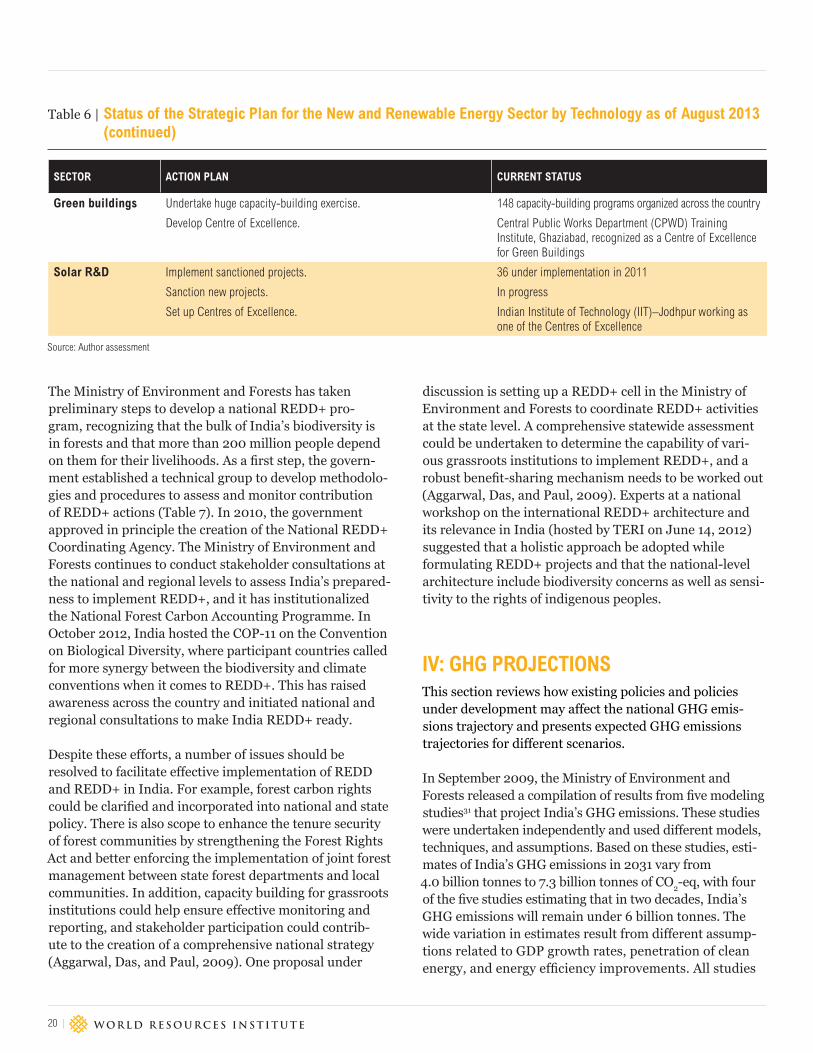
20 |
The Ministry of Environment and Forests has taken preliminary steps to develop a national REDD+ pro-gram, recognizing that the bulk of India’s biodiversity is in forests and that more than 200 million people depend on them for their livelihoods. As a first step, the govern-ment established a technical group to develop methodolo-gies and procedures to assess and monitor contribution of REDD+ actions (Table 7). In 2010, the government approved in principle the creation of the National REDD+ Coordinating Agency. The Ministry of Environment and Forests continues to conduct stakeholder consultations at the national and regional levels to assess India’s prepared-ness to implement REDD+, and it has institutionalized the National Forest Carbon Accounting Programme. In October 2012, India hosted the COP-11 on the Convention on Biological Diversity, where participant countries called for more synergy between the biodiversity and climate conventions when it comes to REDD+. This has raised awareness across the country and initiated national and regional consultations to make India REDD+ ready.
Despite these efforts, a number of issues should be resolved to facilitate effective implementation of REDD and REDD+ in India. For example, forest carbon rights could be clarified and incorporated into national and state policy. There is also scope to enhance the tenure security of forest communities by strengthening the Forest Rights Act and better enforcing the implementation of joint forest management between state forest departments and local communities. In addition, capacity building for grassroots institutions could help ensure effective monitoring and reporting, and stakeholder participation could contrib-ute to the creation of a comprehensive national strategy (Aggarwal, Das, and Paul, 2009). One proposal under
discussion is setting up a REDD+ cell in the Ministry of Environment and Forests to coordinate REDD+ activities at the state level. A comprehensive statewide assessment could be undertaken to determine the capability of vari-ous grassroots institutions to implement REDD+, and a robust benefit-sharing mechanism needs to be worked out (Aggarwal, Das, and Paul, 2009). Experts at a national workshop on the international REDD+ architecture and its relevance in India (hosted by TERI on June 14, 2012) suggested that a holistic approach be adopted while formulating REDD+ projects and that the national-level architecture include biodiversity concerns as well as sensi-tivity to the rights of indigenous peoples.
IV: GHG PROJECTIONSThis section reviews how existing policies and policies under development may affect the national GHG emis-sions trajectory and presents expected GHG emissions trajectories for different scenarios.
In September 2009, the Ministry of Environment and Forests released a compilation of results from five modeling studies31 that project India’s GHG emissions. These studies were undertaken independently and used different models, techniques, and assumptions. Based on these studies, esti-mates of India’s GHG emissions in 2031 vary from 4.0 billion tonnes to 7.3 billion tonnes of CO2-eq, with four of the five studies estimating that in two decades, India’s GHG emissions will remain under 6 billion tonnes. The wide variation in estimates result from different assump-tions related to GDP growth rates, penetration of clean energy, and energy efficiency improvements. All studies
SECTOR ACTION PLAN CURRENT STATUS
Green buildings Undertake huge capacity-building exercise. 148 capacity-building programs organized across the country
Develop Centre of Excellence. Central Public Works Department (CPWD) Training Institute, Ghaziabad, recognized as a Centre of Excellence for Green Buildings
Solar R&D Implement sanctioned projects. 36 under implementation in 2011
Sanction new projects. In progress
Set up Centres of Excellence. Indian Institute of Technology (IIT)–Jodhpur working as one of the Centres of Excellence
Table 6 | Status of the Strategic Plan for the New and Renewable Energy Sector by Technology as of August 2013 (continued)
Source: Author assessment
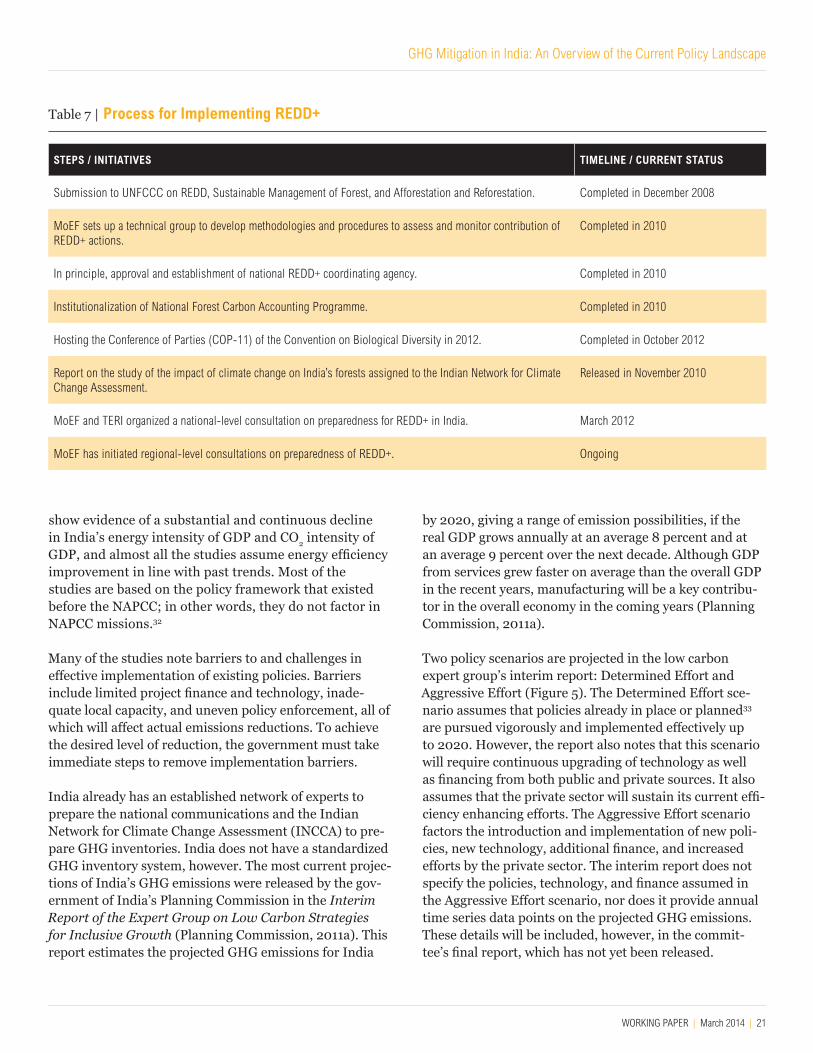
GHG Mitigation in India: An Overview of the Current Policy Landscape
WORKING PAPER | March 2014 | 21
show evidence of a substantial and continuous decline in India’s energy intensity of GDP and CO2 intensity of GDP, and almost all the studies assume energy efficiency improvement in line with past trends. Most of the studies are based on the policy framework that existed before the NAPCC; in other words, they do not factor in NAPCC missions.32
Many of the studies note barriers to and challenges in effective implementation of existing policies. Barriers include limited project finance and technology, inade-quate local capacity, and uneven policy enforcement, all of which will affect actual emissions reductions. To achieve the desired level of reduction, the government must take immediate steps to remove implementation barriers.
India already has an established network of experts to prepare the national communications and the Indian Network for Climate Change Assessment (INCCA) to pre-pare GHG inventories. India does not have a standardized GHG inventory system, however. The most current projec-tions of India’s GHG emissions were released by the gov-ernment of India’s Planning Commission in the Interim Report of the Expert Group on Low Carbon Strategies for Inclusive Growth (Planning Commission, 2011a). This report estimates the projected GHG emissions for India
by 2020, giving a range of emission possibilities, if the real GDP grows annually at an average 8 percent and at an average 9 percent over the next decade. Although GDP from services grew faster on average than the overall GDP in the recent years, manufacturing will be a key contribu-tor in the overall economy in the coming years (Planning Commission, 2011a).
Two policy scenarios are projected in the low carbon expert group’s interim report: Determined Effort and Aggressive Effort (Figure 5). The Determined Effort sce-nario assumes that policies already in place or planned33 are pursued vigorously and implemented effectively up to 2020. However, the report also notes that this scenario will require continuous upgrading of technology as well as financing from both public and private sources. It also assumes that the private sector will sustain its current effi-ciency enhancing efforts. The Aggressive Effort scenario factors the introduction and implementation of new poli-cies, new technology, additional finance, and increased efforts by the private sector. The interim report does not specify the policies, technology, and finance assumed in the Aggressive Effort scenario, nor does it provide annual time series data points on the projected GHG emissions. These details will be included, however, in the commit-tee’s final report, which has not yet been released.
STEPS / INITIATIVES TIMELINE / CURRENT STATUS
Submission to UNFCCC on REDD, Sustainable Management of Forest, and Afforestation and Reforestation. Completed in December 2008
MoEF sets up a technical group to develop methodologies and procedures to assess and monitor contribution of REDD+ actions.
Completed in 2010
In principle, approval and establishment of national REDD+ coordinating agency. Completed in 2010
Institutionalization of National Forest Carbon Accounting Programme. Completed in 2010
Hosting the Conference of Parties (COP-11) of the Convention on Biological Diversity in 2012. Completed in October 2012
Report on the study of the impact of climate change on India’s forests assigned to the Indian Network for Climate Change Assessment.
Released in November 2010
MoEF and TERI organized a national-level consultation on preparedness for REDD+ in India. March 2012
MoEF has initiated regional-level consultations on preparedness of REDD+. Ongoing
Table 7 | Process for Implementing REDD+
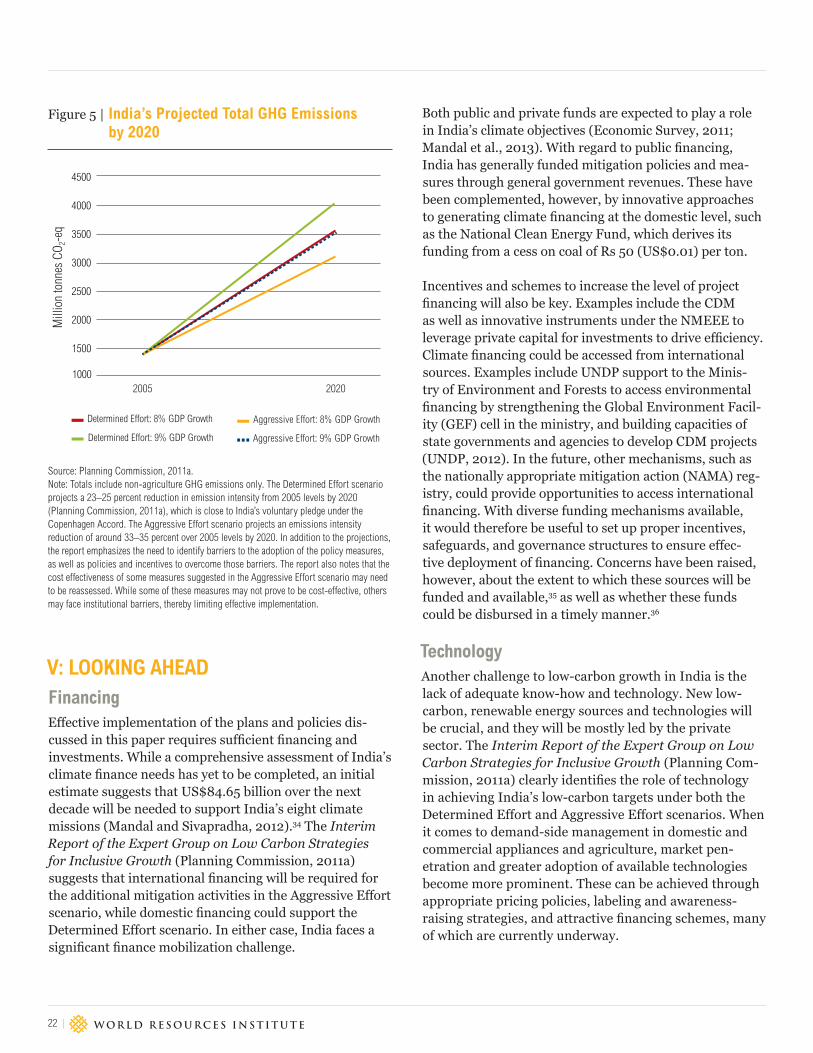
22 |
V: LOOKING AHEADFinancingEffective implementation of the plans and policies dis-cussed in this paper requires sufficient financing and investments. While a comprehensive assessment of India’s climate finance needs has yet to be completed, an initial estimate suggests that US$84.65 billion over the next decade will be needed to support India’s eight climate missions (Mandal and Sivapradha, 2012).34 The Interim Report of the Expert Group on Low Carbon Strategies for Inclusive Growth (Planning Commission, 2011a) suggests that international financing will be required for the additional mitigation activities in the Aggressive Effort scenario, while domestic financing could support the Determined Effort scenario. In either case, India faces a significant finance mobilization challenge.
Both public and private funds are expected to play a role in India’s climate objectives (Economic Survey, 2011; Mandal et al., 2013). With regard to public financing, India has generally funded mitigation policies and mea-sures through general government revenues. These have been complemented, however, by innovative approaches to generating climate financing at the domestic level, such as the National Clean Energy Fund, which derives its funding from a cess on coal of Rs 50 (US$0.01) per ton.
Incentives and schemes to increase the level of project financing will also be key. Examples include the CDM as well as innovative instruments under the NMEEE to leverage private capital for investments to drive efficiency. Climate financing could be accessed from international sources. Examples include UNDP support to the Minis-try of Environment and Forests to access environmental financing by strengthening the Global Environment Facil-ity (GEF) cell in the ministry, and building capacities of state governments and agencies to develop CDM projects (UNDP, 2012). In the future, other mechanisms, such as the nationally appropriate mitigation action (NAMA) reg-istry, could provide opportunities to access international financing. With diverse funding mechanisms available, it would therefore be useful to set up proper incentives, safeguards, and governance structures to ensure effec-tive deployment of financing. Concerns have been raised, however, about the extent to which these sources will be funded and available,35 as well as whether these funds could be disbursed in a timely manner.36
TechnologyAnother challenge to low-carbon growth in India is the lack of adequate know-how and technology. New low- carbon, renewable energy sources and technologies will be crucial, and they will be mostly led by the private sector. The Interim Report of the Expert Group on Low Carbon Strategies for Inclusive Growth (Planning Com-mission, 2011a) clearly identifies the role of technology in achieving India’s low-carbon targets under both the Determined Effort and Aggressive Effort scenarios. When it comes to demand-side management in domestic and commercial appliances and agriculture, market pen-etration and greater adoption of available technologies become more prominent. These can be achieved through appropriate pricing policies, labeling and awareness- raising strategies, and attractive financing schemes, many of which are currently underway.
Source: Planning Commission, 2011a.Note: Totals include non-agriculture GHG emissions only. The Determined Effort scenario projects a 23–25 percent reduction in emission intensity from 2005 levels by 2020 (Planning Commission, 2011a), which is close to India’s voluntary pledge under the Copenhagen Accord. The Aggressive Effort scenario projects an emissions intensity reduction of around 33–35 percent over 2005 levels by 2020. In addition to the projections, the report emphasizes the need to identify barriers to the adoption of the policy measures, as well as policies and incentives to overcome those barriers. The report also notes that the cost effectiveness of some measures suggested in the Aggressive Effort scenario may need to be reassessed. While some of these measures may not prove to be cost-effective, others may face institutional barriers, thereby limiting effective implementation.
Figure 5 | India’s Projected Total GHG Emissions by 2020
1000
1500
2000
2500
3000
3500
4000
4500
2005 2020
Aggressive Effort: 8% GDP Growth
Aggressive Effort: 9% GDP Growth
Determined Effort: 8% GDP Growth
Determined Effort: 9% GDP Growth
Mill
ion
tonn
es C
O 2-e
q
GHG Mitigation in India: An Overview of the Current Policy Landscape
WORKING PAPER | March 2014 | 23
In the case of supply-side options and energy efficiency in industry, it is equally important to develop new technologies and facilitate their market penetration by enabling policies and building institutional capacity. To reduce emission intensity in India’s power sector, for example, 50 percent of coal-based capacity addition in the 12th 5-year plan and 100 percent in the 13th 5-year plan will be accomplished by deploying supercritical tech-nology. Ultrasupercritical power plants operate at even higher efficiency, and large-scale adoption of this technol-ogy would further reduce the emission intensity of the power sector. The first ultrasupercritical plant is expected in 2017 (Economic Survey, 2011).
Integrated coal gasification combined cycle (IGCC) is another promising technology. It can attain higher efficiencies and lower GHG emissions and also produce synthetic chemical fuels such as diesel and hydrogen. Initial estimates under Indian conditions of high-ash coal, however, show very high auxiliary power consump-tion, making the overall efficiency comparable with that of subcritical units at almost double the cost. While the government intends to pursue research in IGCC, commercial deployment of IGCC is unlikely before 2020 (Planning Commission, 2011a).
In renewable energy, the government is pursuing solar power as a critical technology for achieving both long-term energy security and low-carbon growth targets. The National Solar Mission has given solar power a much-needed push by increasing the country’s manufacturing capacity, viability gap funding, aggressive research and development, and large-scale deployment.
Options to reduce emissions in the industry sector, especially in cement, iron and steel, and oil and gas, hinge on the development, adaptation, and adoption of newer technologies. Industry efforts have been important in driving the development of emissions-reductions tech-nologies. For example:
India’s cement industry, among the largest producers in the world, is also one of the most technologically advanced (Riccardi, Oggioni, and Toninelli, 2012). In the past several years, facilities have gradually transi-tioned to dry process technology during cement pro-duction to replace the less efficient wet process that dominated the industry during the 1960s (Dutta and Mukherjee, 2010).
The iron and steel industry, which provides key resources to sectors including construction, transporta-tion, and power transmission, has had mixed success in reducing emissions. Some Indian steel producers have indigenized and improvised on imported technology, and competition among domestic industries is likely to increase the energy efficiency of techniques used during the production process (Dutta and Mukherjee, 2010). There has been limited policy support for formalization of R&D in this sector, however.
In the oil and gas sector, capturing fugitive emissions from industrial activities has recently emerged as a sig-nificant issue (India produced 21.2 MtCO2-eq of methane emissions in 2010, or 1.3 percent of the global total). For example, the country’s largest oil and gas producer, Oil and Natural Gas Corporation Ltd. (ONGC), is work-ing to reduce methane emissions through awareness-raising workshops and capacity-building initiatives. Beginning in 2008, ONGC conducted measurement studies across seven company facilities with the greatest potential for emissions reductions. The company also mapped fugitive emissions from their facilities and is looking to develop a fugitive emission inventory (Global Methane Initiative, 2011).
Looking ahead, such industry-led improvements in tech-nology mix and implementation of existing policies such as the PAT scheme will likely bring some reduction in emissions intensity. Nonetheless, technology transfer sup-port, R&D to facilitate both technology development and adaptation, new technologies that suit Indian conditions, and timely adoption of suitable technologies will be cru-cial for achieving the Aggressive Effort targets in industry (Planning Commission, 2011a).
Eliminating Barriers to ImplementationThree major issues arise in implementing climate policies:
State Policies and Actions: India’s federal structure creates space for state-level policies and actions. Under the NAPCC, for example, national-level policies and measures are in place. It is now up to the states to move those policies forward and translate them into concrete actions. State-designated agencies are supposed to implement several initiatives under the NMEEE, but the effectiveness of these agencies is uncertain. State-designated agencies must also devolve some initiative to the municipal and industry levels. For example, the bylaws regulating buildings must be applied at the
24 |
municipal level. Only a few states and municipal bodies, however, have guidelines in place for developing and/or implementing building energy efficiency programs and policies. Similarly, the PAT scheme currently applies only to large industries (478 in total) (BEE, 2012d). Smaller industries must be brought into the fold, and states are best positioned to do that. The limited capac-ity of many states often poses a challenge. Furthermore, national and state priorities differ, which may impede adoption of a national policy. At the Conference of State Environment Ministers on August 18, 2009, the prime minister of India requested that all state governments prepare their state action plans on climate change. These action plans took their lead from national mission documents when formulat-ing the strategies. Several states have developed state climate action plans focused on approaches that are sectoral but with regional ramifications. Gujarat, Rajas-than, and Karnataka also have their own, independent state solar power policy. The progress of state-level schemes will depend on the dynamic nature of state politics and political entities, which are in constant flux.
Fragmented Authority: Often, the roles and respon-sibilities of ministries and agencies at the national and state levels are not clearly delineated, leading to a lack of coordination among institutions working in the same area. The Ministry of New and Renew-able Energy, for example, is promoting microgrids in remote and rural areas through various schemes and incentives. These will eventually need to be connected to the national grid, which will require the Ministry of Power to resolve grid-capacity issues. Prior consulta-tion is, therefore, necessary before the launch of such schemes. More importantly, there needs to be an integrated approach to addressing these sector-spe-cific issues rather than ad hoc measures based on the mandates of the respective ministries.
Central Government-State Government Financial Flows: States rely predominantly on central funds for climate action. Only recently have states like Maha-rashtra started using fiscal incentives like a green cess on electricity to raise their own funds. Central funds are not always reliable and timely, and this can delay implementation.
UrbanizationCities will be central to India’s economic future. The country’s urban population grew from 290 million in 2001 to 340 million in 2008, an increase of 17.24 percent over an 8-year period (Nagarajan, 2011). McKinsey Global Institute (2010) predicts that by 2030, the urban population could further soar to 590 million. The mid-term appraisal of the 11th 5-year plan puts the urban share of GDP at 62–63 percent in 2009–10 and projects this share to increase to 75 percent by 2030.
There is very little empirical information on carbon emis-sions in Indian cities. According to analysis by Sridhar and Kumar (2013) based on a 2009 study by ICLEI - Local Governments for Sustainability, the average per capita car-bon emissions in metropolitan cities in India is 1.19 tons, that in nonmetropolitan cities 0.90 tons, and the national average 0.93 tons per capita. Currently, most urban poli-cies and initiatives focus on ensuring basic public services for all Indian cities and towns. Energy and GHG concerns are either viewed as “add-ons” to overall strategies driven by service delivery concerns or as a subject for conven-tional environmental infrastructure programming as an important routine task for cities. India needs a fundamen-tal shift to sustainable urban development and energy, and GHG considerations should become part of the core city development planning process (IIED, 2010).
New Institutional Structure for GHG Inventory SystemA new institutional structure for GHG inventory and management would be useful at the national level. This will ensure a systematic approach to measure the impact of the mitigation policies and actions. Implementing such a system will be a challenge, as there is a lack of activity data and specific emissions factors. The interim report of the low carbon expert group suggests that these challenges can be overcome by collating activity data from various ministries, departments, and industries; performing qual-ity assurance and control checks routinely; commission-ing surveys to ascertain data gaps; developing emission factors for key emission sources; identifying uncertainties; and regularly reviewing the estimates (Planning Commis-sion, 2011a). The report further suggests key initiatives that would require several new institutions:
GHG Mitigation in India: An Overview of the Current Policy Landscape
WORKING PAPER | March 2014 | 25
1. A National Greenhouse Gas Inventory Management Authority to track the trends of GHG emissions from all sectors of the economy at national, state, district, and point-source levels. This authority should be housed under INCCA but operationalized under the Ministry of Environment and Forests.
2. A National GHG Inventory Management System for archiving, updating, and producing information on activity leading to GHG emissions or removals. The system would produce the trends of emissions or removals by sector at national, state, district, and point-source levels.
3. Designing mechanisms for voluntary disclosure of GHGs from installations managed by Public Sector Undertakings (PSUs)/corporates and from medium-scale enterprises to track the impact of their energy efficiency measures or GHG mitigating measures on their annual GHG emissions.
Although it remains to be seen how these institutions will be organized and whether they can effectively imple-ment the GHG inventory and management system, some initial work is underway. Other parallel initiatives are also underway. For example, in early 2014, WRI India, the Confederation of Indian Industry (CII), and TERI estab-lished a voluntary industry-based platform with 27 of the country’s largest companies to share best practices on GHG accounting.37
CONCLUSIONIndia’s climate mitigation policy landscape is active and ambitious. It is essential, however, that these plans be operationalized and implemented on the ground. Accord-ing to the Planning Commission’s working group (for the 12th 5-year plan) on climate change, the “optimal way of achieving overall climate change goals would be to integrate the objectives of the NAPCC and the domes-tic mitigation goal in the development strategy of the respective sectors. In the area of adaptation, this calls for specific policy initiatives across a wide variety of sec-tors, particularly in the areas of agriculture, water, health, coastal management, forests and other ecosystems, energy including renewable energy, and infrastructure and cli-mate change assessment.” The government of India has estimated that Rs 2.3 trillion (US$ 37 billion) would be needed to fulfill the objectives of the eight national mis-sions of NAPCC in the 12th 5-year plan. While it is impor-tant to have access to climate financing and technology, a proactive approach to removing some of the implementa-tion barriers to these plans is necessary. This calls for bet-ter vertical integration at all governance levels (national, state, and local) and horizontal integration of concerned line ministries and departments. A systematic approach for tracking the progress and impact of mitigation actions by way of a new institutional structure for a GHG inven-tory system at corporate, city, state, and national levels is an important way forward to ensure effective and inte-grated planning and implementation of India’s low-carbon development plans. The GHG inventory system, for example, could be designed to track both GHG emissions and other related key impacts including water, energy, and air pollution to facilitate an integrated approach.
26 |
ABBREVIATIONS AND ACRONYMSBEE Bureau of Energy Efficiency
BUs billion units
CDF Centre for Development Finance
CDM Clean Development Mechanism
CEA Central Electricity Authority
CER certified emission reduction
CERC Central Electricity Regulatory Commission
CFL compact fluorescent lamp
CII Confederation of Indian Industry
COP Conference of the Parties
CPCB Central Pollution Control Board
CPWD Central Public Works Department
CRISIL Credit Rating Information Services of India Limited
DC designated consumer
DISCOM Distribution Company
DSM demand-side management
DST Department of Science and Technology
EEFP Energy Efficiency Financing Platform
ESCO energy service company
ESCert energy saving certificate
FICCI Federation of Indian Chambers of Commerce and Industry
GDP gross domestic product
GEF Global Environment Facility
GHG greenhouse gas
GoI government of India
ICL incandescent lamp
IEA International Energy Agency
IFMR Institute for Financial Management and Research
IGCC integrated coal gasification combined cycle
IIFM Indian Institute of Forest Management
IIT Indian Institute of Technology
INCCA Indian Network for Climate Change Assessment
IRADe Integrated Research and Action for Development
IREDA Indian Renewable Energy Development Agency
JNNSM Jawaharlal Nehru National Solar Mission
kWh kilowatt-hour
LED light-emitting diode
LULUCF land use, land-use change, and forestry
M&V measurement and verification
MoA Ministry of Agriculture
MoEF Ministry of Environment and Forests
MoNRE Ministry of New and Renewable Energy
MoP Ministry of Power
MoUD Ministry of Urban Development
MSME micro-, small, and medium enterprise
MST Ministry of Science and Technology
MTEE Market Transformation for Energy Efficiency
mtoe million tons of oil equivalent
MUs million units
MW megawatt
NAMA nationally appropriate mitigation action
NAPCC National Action Plan on Climate Change
NCAER National Council of Applied Economic Research
NGO nongovernmental organization
NHAI National Highways Authority of India
NMEEE National Mission for Enhanced Energy Efficiency
NMSH National Mission on Sustainable Habitat
ONGC Oil and Natural Gas Corporation
PAT Perform, Achieve, and Trade
PSU Public Sector Undertaking
PV photovoltaic
R&D research and development
RBI Reserve Bank of India
REC renewable energy certificate
REDD Reducing Emissions from Deforestation and Forest Degradation
RFP request for proposal
RPO renewable purchase obligation
S&Ls standards and labels
SAPCC state-level action plan on climate change
SE super-efficient
SERC State Electricity Regulatory Commission
SME small and medium enterprise
SPCB State Pollution Control Board
TERI The Energy and Resources Institute
UNDP United Nations Development Programme
UNFCCC United Nations Framework Convention on Climate Change
USAID United States Agency for International Development
WDI world development indicator
WISE World Institute of Sustainable Energy
WRI World Resources Institute
GHG Mitigation in India: An Overview of the Current Policy Landscape
WORKING PAPER | March 2014 | 27
ENDNOTES1. Grantham Institute for Climate Change, 2012; Fekete et al., 2013;
Höhne et al., 2012.
2. The National Action Plan on Climate Change (NAPCC), India’s flagship program related to climate change, outlines a framework and guiding principles for eight national missions. It lays out low-carbon growth strategies for various sectors.
3. India Ministry of Environment and Forests, “Press Note,” 30 January 2010, http://moef.nic.in/downloads/public-information/UNFCCC%20Submission_press_note.pdf.
4. unfccc.int/files/meetings/cop_15/copenhagen_accord/application/pdf/indiacphaccord_app2.pdf.
5. unfccc.int/essential_background/convention/background/items/1362.php.
6. For instance, one of the targets in India’s 11th 5-year plan (2007–12) was to increase energy efficiency by 20 percent by 2016–17 (Planning Commission, 2008). Both the 11th 5-year plan and India’s integrated energy policy document suggested that increased energy efficiency was possible with greater effort.
7. In order to harmonize the country’s development priorities and its climate goals, the Expert Group on Low Carbon Strategies for Inclusive Growth was established. Its members come from industry, think tanks, research institutions, civil society, and government.
8. 2020 projection data from Planning Group, 2011a; assumption based on determined scenario with 8 percent GDP growth rate and per capita change of 2.67.
9. Baseline estimates include carbon dioxide emissions from burning fossil fuels and cement manufacture. This includes carbon dioxide produced during consumption of solid, liquid, and gas fuels and gas flaring. WDI estimates accessed at http://data.worldbank.org/indicator/EN.ATM.CO2E.KT/countries. WDI data is used because domestic estimates are only available for base year 2005.
10. Calculated on the basis of down-scaled GDP data for IPCC A1 emissions projection scenarios, published by the Center for International Earth Sci-ence Information Network. For more information, see http://pdf.wri.org/working_papers/comparability_of_annex1_emission_reduction_pledg-es_2010-02-01.pdf.
11. The 12th 5-year plan reorganized the NAPCC missions from their original incarnation from their original incarnation of eight missions to seven missions (the seven missions are the National Solar Mission, the National Wind Energy Mission, the Energy Efficiency Mission, the Sustainable Habitat Mission, the Sustainable Agriculture Mission, the Mission on Sustainable Himalayan Eco-systems, and the National Mis-sion for a Green India) and identified policy thrust areas. The key areas include advanced coal technologies, energy efficiency improvements in major industries, solid waste management systems in towns and cities, treatment of all sewage before release into the water bodies, improved urban public transport, dedicated freight corridors along major routes, and climate-related research through scientific departments. See http://planningcommission.gov.in/plans/planrel/12thplan/pdf/vol_1.pdf.
12. Although the NAPCC prioritizes India’s development with climate as a cobenefit, it does not discuss the level of ambition of the cobenefit or its relation to the 20 percent energy intensity reduction target. However, the Interim Report of the Expert Group on Low-Carbon Strategies (Planning Commission, 2011a) does refer to various missions and their goals and how recommended actions would help achieve the goals.
13. For all monetary figures, we use an approximate exchange rate of 1 USD equals 62 Indian Rupee, current as of February 28, 2014.
14. The solar mission will be implemented by an autonomous solar energy authority or an autonomous and enabled solar mission, embedded within the existing structure of the Ministry of New and Renewable Energy. The authority/mission secretariat will be responsible for monitoring technology developments, reviewing and adjusting incentives, manag-ing funding requirements, and executing pilot projects. The mission will report to the Prime Minister’s Council on Climate Change on the status of its program.
15. Desai et al., n.d., 10.
16. Some state electricity departments are also key players, since they plan their own electricity supply with a limited reliance on the central allocation.
17. The cess is paid in addition to the tax and is normally calculated as a percentage of the tax.
18. The mandatory portion of the policy states that the procurement of power by distribution licensees and the procurement of transmission services must be done through tariff-based competitive bidding, even from government or state-owned entities.
19. The mandatory portion of the policy includes energy accounting and declaration of results.
20. The energy conservation building code is currently mandatory for com-mercial buildings in eight states.
21. The policy is mandatory for four appliances: frost-free refrigerators, air conditioners, distribution transformers, and fluorescent tube lights.
22. 10 percent blending of bioethanol with gasoline is mandatory.
23. Section 3 of the Electricity Act 2003 states that the central government shall, from time to time, prepare and publish the National Electricity Policy and Tariff Policy, in consultation with the state governments and authority for development of the power system based on optimal utilization of resources such as coal, natural gas, nuclear substances or material, as well as hydro and renewable sources of energy.
24. Lifeline consumers are defined as households below the poverty line consuming 30 units of electricity per month.
25. The term electrified village was defined by Ministry of Power O.M. No. 42/1/2001-D(RE), February 5, 2004: A village would be classified as electrified based on a Certificate issued by the Gram Panchayat, certifying that (a) Basic infrastructure such as Distribution Transformer and Distribu-tion Lines are provided in the inhabited locality as well as a minimum of one Dalit Basti / hamlet where it exists (For electrification through Non-Conventional Energy Sources a Distribution transformer may not be necessary); and (b) Electricity is provided to public places like Schools, Panchayat Office, Health Centers, Dispensaries, Community Centers, etc.; and (c) The number of households electrified are at least 10% of the total number of households in the village.
26. Unallocated power is the unsold power left with the generating stations after all the power purchase agreements are signed.
27. The commercial sector comprises various industrial and institutional establishments such as banks, hotels, restaurants, shopping complexes, offices, and public departments supplying basic utilities.
28 |
28.“Clusters” refers to groups of similar industries existing in a specific geographic location.
29. Bharat Stage norms are implemented in India based on a report by the Mashelkar Committee, which proposed the rollout of Euro-based emis-sion norms. Bharat Stage III developed after Euro 3 came into effect in 13 major cities beginning in April 2005 and scaled up nationwide begin-ning in April 2010. Bharat Stage IV following the Euro 4 norm became effective in 15 major cities beginning in April 2010.
30. The National Capital Territory of Delhi is one of India’s seven union territories.
31. This was presented in Climate Modelling Forum, 2009. In terms of broad approach and methodology, among the five studies the report consid-ered, India’s National Council of Applied Economic Research (NCAER) used a computable general equilibrium (CGE) model, The Energy and Resources Institute (TERI) used a market allocation (MARKAL) model, the Integrated Research and Action for Development (IRADe) used an ac-tivity analysis model, another TERI study used MARKAL, and McKinsey conducted a detailed sector-by-sector analysis of GHG emissions.
32. This can be substantiated by findings of INCCA, 2010a, which compares emissions in 1994 and 2007 and suggests that in terms of CO
2-eq, the
total GHG emissions increased from 870 Mt in 1994 to 1,570 Mt in 2007. This further implies an emission-GDP intensity reduction of 24.9 percent over this period (INCCA, 2010a).
33. For a detailed sectoral (power, transport, industry, buildings, and for-estry) listing of policy assumptions, see Planning Commission, 2011a.
34. The NMEEE itself was estimated to require Rs 4.25 billion (US$68.55 million) between 2010 and 2012.
35. http://www.odi.org.uk/sites/odi.org.uk/files/odi-assets/publications-opinion-files/6457.pdf.
36. http://www.guardian.co.uk/environment/2009/feb/20/climate-funds-developing-nations.
37. For more information see indiaghgp.org.
REFERENCESAggarwal, A., Das, S. and Paul, V. 2009. “Is India Ready to Implement REDD Plus? A Preliminary Assessment.” http://www.teriin.org/events/docs/1_India%20REDD%20REady.pdf.
Bhattacharya, Roudra. 2013. “Meet Fuel Efficiency Norms In 3 Years or Shut Shop: Govt Tells Carmakers.” Indian Express. April 26. http://archive.indian-express.com/news/meet-fuel-efficiency-norms-in-3-years-or-shut-shop-govt-tells-carmakers/1107942/.
Bureau of Energy Efficiency (BEE). 2009a. “Agricultural Demand Side Man-agement Program.” http://bee-dsm.in/PoliciesRegulations_1_4.aspx.
———. 2009b. “BEE Initiatives.” Demand Side Management. DSM Infor-mation Hub. http://bee-dsm.in/PoliciesRegulations_1_4.aspx.
———. 2011a. “Bachat Lamp Yojana.” http://www.beeindia.in/schemes/schemes.php?id=1.
———. 2011b. “Schemes for Promoting Energy Efficiency in India during the XI Plan.” http://beeindia.in/miscellaneous/documents/rti_act/schemes_for_promoting_energy_efficiency_in_India_during_the_%20XI_Plan.pdf.
———. 2012a. “From Small to Medium Steps: Energy Efficiency in SME Clusters.” BEELINE. January: 2.
———. 2012b. BEELINE. Quarterly Newsletter. http://www.beeindia.in/docu-ments/BEE%20newsletter.pdf.
———. 2012c. “India’s Energy Efficiency Standards and Labelling Pro-gramme.”
———. 2012d. “PAT: Perform, Achieve and Trade.” http://beenet.gov.in:90/downloadbooks.aspx?fname=BEE_PAT_Booklet_Final.pdf.
———. 2013. Bureau of Energy Efficiency (BEE) accredited ESCOs. http://www.emt india.net/ESCO/BEE_Empannelled_ESCO_List_Oct_2012.pdf.
Byravan, Sujatha, and S. C. Rajan. 2012. “An Evaluation of India’s National Ac-tion Plan on Climate Change.” A report published by the Centre for Development Finance and the Indian Institute for Technology. Chennai (Madras), July.
Central Electricity Authority. 2013. All India Regionwise Generating Installed Capacity. http://www.cea.nic.in/installed_capacity.html.
Centre for Budget and Governance Accountability (CBGA). 2012. “Framework and Performance of National Clean Energy Fund.” Policy brief.
Chauhan, Chanchal Pal. 2013. “Policy Soon to End Ambiguity on Auto Emis-sion.” Economic Times. April 15. http://articles.economictimes.indiatimes.com/2013-04-15/news/38555992_1_ford-india-india-head-bs-iv.
Chunekar, A. and Singh, D. 2013. A Guidebook on Super-Efficient Equipment Program (SEEP).
Climate Modelling Forum. 2009. “India’s GHG Emissions Profile: Results of Five Climate Modelling Studies.” September. http://www.moef.nic.in/down-loads/home/GHG-report.pdf.
Collaco, Danielle. 2012. “India’s Top Green Spend States; Chhattisgarh & Madhya Pradesh.” IndiaSpend. July 24. http://www.indiaspend.com/states/indias-top-green-spend-states-chhattisgarh-madhya-pradesh.
Demand Side Management—Bureau of Energy Efficiency. 2012. “Municipal DSM.” March. http://bee-dsm.in/PoliciesRegulations_1_4.aspx#L7 (accessed March 2012).
GHG Mitigation in India: An Overview of the Current Policy Landscape
WORKING PAPER | March 2014 | 29
Desai, Bharat H. et al. n.d. “Strengthening Legal and Policy Frameworks for Addressing Climate Change in Asia.” Draft paper. New Delhi.
Dutta, Monica, and Saptarshi Mukherjee. 2010. “An Outlook into Energy Con-sumption in Large-Scale Industries in India: The Cases of Steel, Aluminum and Cement.” Energy Policy 38: 7286–98.
Economic Survey of India. 2011. “Climate Change and Sustainable Development.”
Energy Efficiency Services Limited (EESL). 2010. “PAT Scheme.” http://www.eesl.co.in/website/PAT.aspx.
EnergyNext. 2012. http://www.energynext.in/entire-grid-connected-solar-capacity-under-phase-i-of-jnnsm-allocated-mnre-minister/ (accessed November 6, 2012).
Fekete, Hanna, et al. 2013. “Emerging Economies: Potentials, Pledges and Fair Shares of Greenhouse Gas Reduction.” Climate Change 6 (June). http://www.uba.de/uba-info-medien-e/4483.html.
Garnaik, S. P. 2011. “National Mission on Enhanced Energy Efficiency.” New Delhi: Bureau of Energy Efficiency. http://moef.nic.in/downloads/others/Mission-SAPCC-NMEEE.pdf.
Global Methane Initiative. 2011. “Oil and Gas Systems Methane: Reducing Emissions, Advancing Recovery and Use.” https://www.globalmethane.org/documents/oil-gas_fs_eng.pdf.
Global Wind Energy Council, World Institute of Sustainable Energy, and In-dian Wind Turbine Manufacturing Association. 2012. “India Wind Energy Out-look 2012.” New Delhi: Ministry of New and Renewable Energy. http://www.gwec.net/wp-content/uploads/2012/11/India-Wind-Energy-Outlook-2012.pdf.
Grantham Institute for Climate Change. 2012. “An Assessment of India’s 2020 Carbon Intensity Target.” Report Gr4, April. https://workspace.imperial.ac.uk/climatechange/Public/pdfs/Grantham%20Report/India_2020_Grantham%20Report%20GR4.pdf.
Höhne, Niklas, et al. 2012. “Greenhouse Gas Emission Reduction Proposals and National Climate Policies of Major Economies.” ECOFYS policy brief, November. http://www.ecofys.com/files/files/ecofys_pbl_iiasa_2012_analy-sis_of_domestic_climate_change_policies_new.pdf.
ICLEI-Local Governments for Sustainability, South Asia. 2009. “Energy and Carbon Emissions Profiles of 54 South Asian Cities.” New Delhi, November. http://archive.iclei.org/fileadmin/user_upload/documents/Global/Progams/CCP/CCP_Reports/ICLEI_Indian_Cities_2009.pdf.
Indian Network for Climate Change Assessment (INCCA). 2010a. “India: Greenhouse Gas Emissions 2007.”
———. 2010b. Study on the Impact of Climate Change on India’s Forests.
Indian Renewable Energy Development Agency (IREDA). 2011. “Wind Energy—Incentives Available in the Sector.” http://www.ireda.gov.in/forms/contentpage.aspx?lid=1340 (accessed May 2012).
International Energy Agency (IEA). 2012. Energy Statistics of Non-OECD countries. Paris: OECD/IEA. Available online at http://data.iea.org/ieastore/default.asp.
International Institute of Environment and Development (IIED). 2010. “Fast Start Adaptation Funding: Keeping Promises from Copenhagen.”
Kumar, N. R. and M. S. Preetha. 2013. “Budget 2013-14: Wind Energy Sector Gets a Fillip.” The Hindu. May 6. http://www.thehindu.com/business/Industry/budget-201314-wind-energy-sector-gets-a-fillip/article4463847.ece.
Kumar, Sanjeev. 2012. “Initiatives of Govt. of India For Providing Electricity to Rural Areas.” New Delhi.
Maharashtra Electricity Regulatory Commission (MERC). 2012. “ORDER (SUO-MOTU) for Case No. 10 of 2012.” http://www.mercindia.org.in/pdf/Order%2058%2042/MERC_RE%20Tariff%20Order%20(SuoMotu)_for%20FY2012-13_Case%20No.%2010%20of%202012.pdf.
Mandal, P. 2012. “Clean Energy Fund Swells to Rs. 3,864 cr.” Business Stan-dard. March 22. http://www.business-standard.com/article/economy-policy/clean-energy-fund-swells-to-rs-3-864-cr-112032200064_1.html.
Mandal, K. and Sivapradha, C. 2012. “Climate Finance: Understanding India’s Requirements and Opportunities.” IFMR Centre for Development Finance. http://cdf.ifmr.ac.in/wp-content/uploads/2012/07/CDF-Brief_-Climate-Finance.pdf.
Mandal, K., Rathi, S., and Venkataramani, V. 2013. “Developing Financ-ing Strategies for Implementing the State Action Plans on Climate Change.” IFMR Centre for Development Finance. http://cdf.ifmr.ac.in/wp-content/up-loads/2013/03/SAPCC-Phase-I-Report-Final_CDF_IFMR.pdf.
McKinsey Global Institute. 2010. “India’s Urban Awakening: Building Inclu-sive Cities, Sustaining Economic Growth.” April. http://www.mckinsey.com/insights/urbanization/urban_awakening_in_india.
Ministry of Environment and Forests. 2011. “CBD Report—Combined Safeguards and Sub-regional Capacity Building Workshop on Redd-plus, Singapore.” Singapore.
Ministry of Environment and Forests (MoEF), Government of India (GoI). 2010a. India: Making Rapid Strides on Forests and Climate Change.
———. 2010b. “Mission Document Green India Mission.” New Delhi.
———. 2010c. “India, World Bank Sign Two Loan Agreements for Coastal Zone Management and Remediation of Polluted Sites.” http://moef.nic.in/downloads/public-information/World-Bank-Loans-Press-Brief.pdf.
———. 2011. “Capacity Building For Industrial Pollution Management.” http://moef.nic.in/sites/default/files/cbipmp/index.htm (accessed March 21, 2012).
———. 2012. “Second National Communication to the United Nations Framework Convention on Climate Change.” New Delhi.
Ministry of New and Renewable Energy (MoNRE), Government of India (GoI). 2009. “National Policy on Biofuels.” New Delhi.
———. 2011. “Strategic Plan for the New and Renewable Energy Sector for the Period 2011–17.”
———. 2012. “Jawaharlal Nehru National Solar Mission – An Update.” http://mnre.gov.in/file-manager/UserFiles/presentations-pwc-work-shop-06092012/MNRE.pdf.
Ministry of Power (MoP), Government of India (GoI). 2005. “Mission Docu-ment, National Electricity Policy.” New Delhi.
———. 2006. “Mission Document, National Rural Electrification Policy.” New Delhi.
———. 2010. “Mission Document, National Mission on Enhanced Energy Efficiency.” New Delhi.
Ministry of Urban Development (MoUD), Government of India (GoI). 2010. “Mission Document National Mission on Sustainable Habitat.” New Delhi.
30 |
Mukherjee, Writankar. 2014. “Stricter energy norms to push up AC, fridge prices by between Rs 3,500 and Rs 5,500.” The Economic Times. January 2. http://articles.economictimes.indiatimes.com/2014-01-02/news/45799495_1_refrigerator-sales-ac-prices-refrigerator-prices.
Mukul, Jyoti. 2011. “Govt’s Clean Energy Fund Stays Pristine.” March 11. http:/www.business-standard.com/india/news/govt%5Cs-clean-energy-fund-stays-pristine/427521/ (accessed January 12, 2012).
Nagarajan, V. 2011. “India’s urban awakening on the cards.” The Economic Times. January 9. http://articles.economictimes.indiatimes.com/2011-01-09/news/28427585_1_urban-population-cities-demographic-dividend.
National Action Plan on Climate Change (NAPCC). 2008. “National Action Plan on Climate Change Mission Document.”
Ndungu, C., J. Nderu, and L. Ngoo. 2012. “Effects of Compact Fluorescence Light (CFL) Bulbs on Power Quality.” Journal of Energy Technologies and Policy.
Paliwal, Ankur. 2012. “Odisha Seeks Help to Buy Costly Renewable Energy.” Down to Earth, April 24.
———. 2013. “Planning Realities: Bachat Lamp Yojana Founders.” Chauthi Duniya. March 11. http://www.eng.chauthiduniya.com/planning-realities-bachat-lamp-yojana-flounders/.
Planning Commission, Government of India (GOI). 2008. “Eleventh Five Year Plan (2007-2012): Inclusive Growth.” New Delhi. http://planningcommission.nic.in/plans/planrel/fiveyr/11th/11_v1/11th_vol1.pdf.
———. 2011a. Interim Report of the Expert Group on Low Carbon Strate-gies for Inclusive Growth. New Delhi, May. http://planningcommission.nic.in/reports/genrep/Inter_Exp.pdf.
———. 2011b. Climate Change and 12th Five-Year Plan: Report of Sub-group on Climate Change. New Delhi.
Power Today. 2012. “Fall in REC Prices Hits Renewable Energy Sector.” November. http://www.powertoday.in/News.aspx?nId=2kSwLxMRAlqm0adb2ITCNQ==.
Prayas Energy Group. 2012. “Super-Efficient Equipment Programme.” Pre-sentation at workshop on standards and labels organized by CLASP Dehli. New Delhi, February 6. http://www.clasponline.org/en/Resources/Resources/SLHeadlines/~/media/Files/SLHeadlines/IndiaWorkshop/2012-02-06_Ses-sion2_SEEP_Prayas_DSingh.pdf.
Press Trust of India (PTI). 2011. “ECBC for commercial buildings mandatory for eight states from FY 12.” Deccan Herald. February 24. http://www.deccanherald.com/content/148204/ecbc-commercial-buildings-mandatory-eight.html.
Ramesh, M. 2012. “Renewable Purchase Obligations Enforcement ‘Big Con-cern.’” Business Line, August 31.
Riccardi, R., G. Oggioni, and R. Toninelli. 2012. “Efficiency Analysis of World Cement Industry in Presence of Undesirable Output: Application of Data Envelopment Analysis and Directional Distance Function.” Energy Policy 44: 140–52.
Satish Kumar, R. K. 2010. Developing an Energy Conservation Building Code Implementation Strategy in India.
Shrivastava and Upadhyaya. 2008. Promotion of demand side energy ef-ficiency: Evaluation of the Clean Development Mechanism. TERI.
Singh, Anoop. 2010. “Economics, Regulation, and Implementation Strategy for Renewable Energy Certificates in India.”
Sridhar, Kala Seetharam and Kumar, Surender. 2013. “India’s Urban Environ-ment: Air/Water Pollution and Pollution Abatement.” Economic and Political Weekly. 48(6). http://www.pacindia.org/uploads/default/files/publications/pdf/bce62e8c13bb4697ba7d68cefb800abd.pdf
United Nations Development Programme (UNDP). 2012. “UNDP in India: Addressing Climate Change.”
United Nations Framework Convention on Climate Change (UNFCCC). 2014. GHG Data: Detailed Data by Party. Bonn: UNFCCC. Available online at unfccc.int/di/DetailedByParty.do (accessed February, 2014).
UPSDA. 2012. The Uttar Pradesh State Energy Conservation Fund Rules. Government Notification, Lucknow.
Wind Power India. 2013. “State Government Policies.” Accessed 20 May, 2013. http://www.windpowerindia.com/index.php.
Working Group on Power for the 12th Plan. 2012. “Demand Side Manage-ment Energy Efficiency and Energy Conservation.” http://planningcommission.nic.in/aboutus/committee/wrkgrp12/wg_power1904.pdf.
World Bank. 2014. World Development Indicators. Washington, DC: World Bank Group. Available online at http://data.worldbank.org/data-catalog/world-development-indicators (accessed February, 2014).
Zafar, Salman. 2013. “Biodiesel Program in India: An Analysis.” BioEnergy Consult.
GHG Mitigation in India: An Overview of the Current Policy Landscape
WORKING PAPER | March 2014 | 31
ACKNOWLEDGMENTSThe authors would like to thank the following people for their peer review and insightful feedback: Sujatha Byravan, formerly with IFMR’s Centre for Development Finance; Anuradha R. V. of Clarus Law Associates; Takeshi Kuramochi of IGES; and Vivek Adhia, Pankaj Bhatia, Jared Finnegan, Bharath Jairaj, Apurba Mitra, and Neelam Singh of the World Resources Institute, as well as Siddarthan Balasubramania, formerly with WRI. We would also like to acknowledge Farhaad Khazvini and Sivapradha C. R., formerly with IFMR, for their research inputs on earlier versions of this paper.
Thank you also to Hyacinth Billings, Alex Martin, Nick Price, Emily Scha-backer, and Alston Taggart for their editing and publication design work. At WRI, Priya Barua, Jenna Blumenthal, Thomas Damassa, and Taryn Fransen provided feedback and editing that helped shape this paper.
ABOUT THE AUTHORSNeha Pahuja is a multidisciplinary researcher working on international climate policy and its relevance to domestic policymaking. Her work, which focuses on equity, mitigation, climate finance, and market-based approaches, seeks to bring a developing-country perspective to a range of global gov-ernance issues. She also studies the implications of the new international regime for India, its domestic policies, and its development process. She had helped develop many state-level action plans on climate change (SAPCCs) and capacity-building initiatives at all governance levels. At TERI, she con-venes the activities of the Center for Global Environment Research. Prior to this, she worked with Emergent Ventures India Pvt. Ltd. as a carbon advisory consultant on projects under the Clean Development Mechanism (CDM) as well as on renewable energy policy, strategic corporate social responsibility, and carbon neutrality. She has a management master’s degree from the Indian Institute of Forest Management, Bhopal.
Nimisha Pandey has 9 years of experience in the sphere of environment management and climate change at both the policy and field levels. Currently she is an associate fellow at TERI’s Center for Global Environment Research. She focuses on issues related to mitigation being discussed in international climate-policy negotiations; international and domestic climate-policy dia-logue in the context of existing and emerging carbon markets at the interna-tional and national levels; nationally appropriate mitigation actions (NAMAs); and opportunities for and barriers to international technology sharing and its implications for promotion of low-carbon, sustainable development. Prior to this, she worked with the Federation of Indian Chambers of Commerce and Industry (FICCI) as assistant director in the Environment and Climate Change Division. She has a master’s degree in environmental science from Banaras Hindu University, Varanasi, and a postgraduate diploma in environmental law from the National Law School of India University, Bangalore.
Koyel Mandal has always been interested, as a researcher and practitioner, in understanding the interactions between environment and development and how they fare in dynamic, decentralized decision-making contexts that are shaped by policies, market frameworks, and information systems. As senior research manager of the IFMR’s Environment and Climate Change program, he has worked on projects that evaluate the environment and climate policies and programs, investments and adoption barriers in renewable energy, and the role of technology and innovation in sustainable development. He has also coordinated outreach activities and conducted policy advocacy in order to secure support for conservation and legislative initiatives. He has been part of several expert committees and technical groups and has presented at nu-merous conferences. He has also handled communications, media relations, and government affairs. Prior to joining IFMR, he worked as an economist with Ocean Conservancy, a policy advocacy group based in the United States. He has also worked with the Madhya Pradesh State Forest Department to implement community-based models of forestry and wildlife management. He holds an MS in environmental science and policy from the University of Wisconsin–Green Bay, a postgraduate diploma in forest management from the Indian Institute of Forest Management (IIFM), Bhopal, and a B.Sc. in econom-ics from St. Xavier’s College, Calcutta.
Chayan Bandyopadhyay is a researcher with the Environment and Climate Change program at IFMR’s Centre for Development Finance. His current areas of work include low-carbon investment mapping, studying the potential of decentralized renewable solutions, and estimating tourists’ willingness to pay in nature parks. His research interests also include sustainable transportation, efficient resource consumption, green supply chain, and environmental policy analysis. He holds a postgraduate degree in environmental management from the Indian Institute of Forest Management (IIFM), Bhopal. As part of his graduate training, he completed three independent research projects related to (1) the feasibility of non-timber forest product supply chain at the state level, (2) social cost-benefit analysis of the bus rapid transport system in Bhopal, and (3) the electricity, water, and food wastage patterns of IIFM students.
ABOUT WRI WRI is a global research organization that works closely with leaders to turn big ideas into action to sustain a healthy environment—the foundation of economic opportunity and human well-being. Our ChallengeNatural resources are at the foundation of economic opportunity and human well-being. But today, we are depleting Earth’s resources at rates that are not sustainable, endangering economies and people’s lives. People depend on clean water, fertile land, healthy forests, and a stable climate. Livable cities and clean energy are essential for a sustainable planet. We must address these urgent, global challenges this decade. Our VisionWe envision an equitable and prosperous planet driven by the wise manage-ment of natural resources. We aspire to create a world where the actions of government, business, and communities combine to eliminate poverty and sustain the natural environment for all people. Our Approach
COUNT IT
We start with data. We conduct independent research and draw on the latest technology to develop new insights and recommendations. Our rigorous analysis identifies risks, unveils opportunities, and informs smart strategies. We focus our efforts on influential and emerging economies where the future of sustainability will be determined. CHANGE IT
We use our research to influence government policies, business strategies, and civil society action. We test projects with communities, companies, and government agencies to build a strong evidence base. Then, we work with partners to deliver change on the ground that alleviates poverty and strength-ens society. We hold ourselves accountable to ensure our outcomes will be bold and enduring. SCALE IT
We don’t think small. Once tested, we work with partners to adopt and expand our efforts regionally and globally. We engage with decision-makers to carry out our ideas and elevate our impact. We measure success through government and business actions that improve people’s lives and sustain a healthy environment.
ABOUT TERIThe Energy and Resources Institute (TERI), New Delhi, India, is an autono-mous, not-for-profit research institute established in 1974. Its research activities are in the field of climate change, energy, environment, water, biotechnology, forestry, policy, and the whole range of sustainable develop-ment issues. It has more than 30 years of experience of and its research activities are largely supported by grants from ministries and departments of the government of India, the industrial sector, and international organiza-tions such as USAID, Swiss Development Co-operation, the European Community, the World Bank, the Department for International Development (UK), the Asian Development Bank, the Ford Foundation, the MacArthur Foundation, and various UN agencies. TERI’s Centre for Global Environ-ment Research conducts research and outlines policy initiatives to integrate developing-country concerns in addressing global environmental challeng-es. The center endeavors to present the perspective of developing countries to contribute to an equitable policy regime on climate change. The thrust areas for the center are policy analysis, climate change mitigation, and CDM project development, impacts, vulnerability and adaptation assessment, climate modeling, GHG inventorization, capacity building, and outreach.
ABOUT THE INSTITUTE FOR FINANCIAL MANAGEMENT AND RESEARCHIFMR’s vision is a world in which all individuals, households, and small businesses have access to the enabling financial services, legal and physi-cal infrastructure, and social services that empower them to realize their aspirations. Each of the six research centers that constitute IFMR defines its own mission that contributes to this common vision, including access to financial services, improving opportunities to mitigate risk, improving pub-lic goods provision, and ensuring scientific evaluation of scalable solutions to meet the broad goals of our vision. This paper was written by researchers at IFMR’s Centre for Development Finance (CDF). CDF is an action research think tank focused on improving the capacity of government systems and markets to channel finance into sustainable, holistic development. CDF’s research in two core areas, environment and climate change and infrastruc-ture and governance, seeks to influence public policies, improve program implementation and impact, and inform private and nonprofit interventions. Our team at CDF consists of development practitioners as well as research-ers with substantial operational and field experience. This ensures that our data, insight, and advice are an ideal blend of sound theoretical knowledge and real-world pragmatism.
At CDF, we believe that development is a multidimensional process that can create economic security, long-lasting environmental quality, access to op-portunity, and, most important, inclusive government and market systems. The Centre for Development Finance supports the creation of a social, political, and economic environment where all citizens have the confidence and the tools to shape fulfilling individual and collective futures.
Copyright 2014 World Resources Institute. This work is licensed under the Creative Commons Attribution-NonCommercial-NoDerivative Works 3.0 License. To view a copy of the license, visit http://creativecommons.org/licenses/by-nc-nd/3.0/
10 G Street, NE | Washington, DC 20002 | www.WRI.org


