Embed Size (px)
Citation preview

©2014 International Monetary Fund
IMF Country Report No. 14/129
GHANA 2014 ARTICLE IV CONSULTATION—STAFF REPORT; PRESS RELEASE; AND STATEMENT BY THE EXECUTIVE DIRECTOR FOR GHANA
Under Article IV of the IMF’s Articles of Agreement, the IMF holds bilateral discussions with members, usually every year. In the context of the 2014 Article IV consultation with Ghana, the following documents have been released and are included in this package: The Staff Report prepared by a staff team of the IMF for the Executive Board’s
consideration on May 7, 2014, following discussions that ended on February 25, 2014, with the officials of Ghana on economic developments and policies. Based on information available at the time of these discussions, the staff report was completed on April 21, 2014.
An Informational Annex prepared by the IMF.
A Debt Sustainability Analysis prepared by the staffs of the IMF and the World Bank.
A Staff Statement of May 7, 2014 updating information on recent developments.
A Press Release summarizing the views of the Executive Board as expressed during its May 7, 2014 consideration of the staff report that concluded the Article IV consultation with Ghana.
A Statement by the Executive Director for Ghana.
The publication policy for staff reports and other documents allows for the deletion of market-sensitive information.
Copies of this report are available to the public from
International Monetary Fund Publication Services PO Box 92780 Washington, D.C. 20090
Telephone: (202) 623-7430 Fax: (202) 623-7201 E-mail: [email protected] Web: http://www.imf.org
Price: $18.00 per printed copy
International Monetary Fund Washington, D.C.
May 2014

GHANA STAFF REPORT FOR THE 2014 ARTICLE IV CONSULTATION
KEY ISSUES Short-term vulnerabilities have risen significantly amid high fiscal and current account deficits. The international reserve position has weakened alongside mounting public debt. High interest rates and a depreciating currency have begun to weaken private sector activity, and spreads on Ghana’s Eurobonds have risen above those of regional peers. Economic growth is slowing from previously high levels. Following estimated GDP growth of 5½ percent in 2013, staff projects a further deceleration to 4¾ percent in 2014. Driven by the depreciation and administered price increases, inflation reached 13½ percent at end-2013 and 14½ percent in March. Monetary policy was tightened, as the fiscal consolidation target was missed. Despite significant policy efforts, the 2013 fiscal (cash) deficit reached an estimated 10.9 percent of GDP, versus a target of 9 percent. In the absence of additional measures, the 2014 deficit is projected at 10¼ percent of GDP, with consolidation made more difficult by slower growth. To address rising inflation, the monetary policy rate was raised to 18 percent and reserve requirements were tightened. Current vulnerabilities put Ghana’s transformation agenda at risk. The government’s objectives of economic diversification, shared growth and job creation, and macroeconomic stability rely on the reallocation of resources from current to capital spending. Yet, high twin deficits and large interest payments on rising public debt are crowding out priority expenditure and private sector activity. Macroeconomic stability will need to be restored to preserve a positive medium-term outlook. The financial sector is adequately capitalized and liquid, but increasing exposures will need to be monitored closely. Stress tests conducted by the Bank of Ghana suggest that buffers are adequate in most banks and the system in aggregate. Nevertheless, the weaker macroeconomic outlook and currency depreciation expose the financial sector to credit and foreign exchange risks, warranting a strengthening of crisis prevention and management capabilities.
April 21, 2014
GHANA
2 INTERNATIONAL MONETARY FUND
Approved By Michael Atingi-Ego and Mark Flanagan
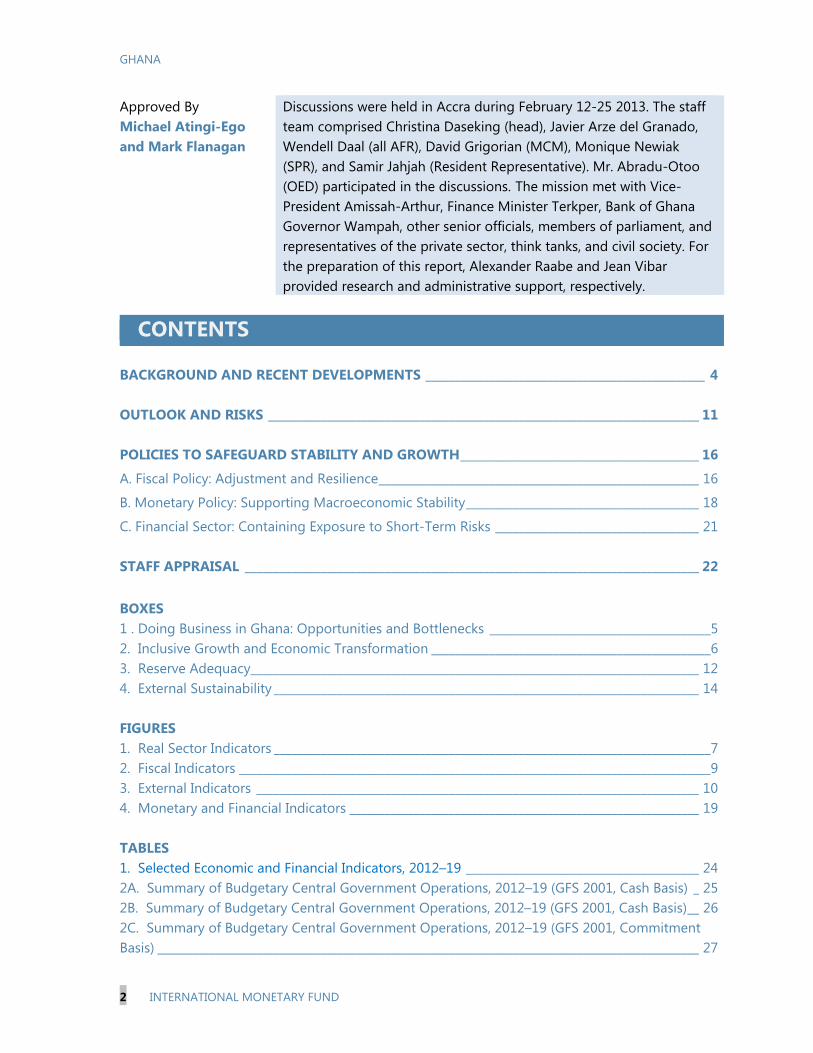
Discussions were held in Accra during February 12-25 2013. The staff team comprised Christina Daseking (head), Javier Arze del Granado, Wendell Daal (all AFR), David Grigorian (MCM), Monique Newiak (SPR), and Samir Jahjah (Resident Representative). Mr. Abradu-Otoo (OED) participated in the discussions. The mission met with Vice-President Amissah-Arthur, Finance Minister Terkper, Bank of Ghana Governor Wampah, other senior officials, members of parliament, and representatives of the private sector, think tanks, and civil society. For the preparation of this report, Alexander Raabe and Jean Vibar provided research and administrative support, respectively.
CONTENTS
BACKGROUND AND RECENT DEVELOPMENTS ________________________________________________ 4
OUTLOOK AND RISKS __________________________________________________________________________ 11
POLICIES TO SAFEGUARD STABILITY AND GROWTH _________________________________________ 16
A. Fiscal Policy: Adjustment and Resilience _______________________________________________________ 16
B. Monetary Policy: Supporting Macroeconomic Stability ________________________________________ 18
C. Financial Sector: Containing Exposure to Short-Term Risks ___________________________________ 21
STAFF APPRAISAL ______________________________________________________________________________ 22 BOXES 1 . Doing Business in Ghana: Opportunities and Bottlenecks ______________________________________5 2. Inclusive Growth and Economic Transformation ________________________________________________6 3. Reserve Adequacy _____________________________________________________________________________ 12 4. External Sustainability _________________________________________________________________________ 14 FIGURES 1. Real Sector Indicators ___________________________________________________________________________7 2. Fiscal Indicators _________________________________________________________________________________9 3. External Indicators ____________________________________________________________________________ 10 4. Monetary and Financial Indicators ____________________________________________________________ 19 TABLES 1. Selected Economic and Financial Indicators, 2012–19 ________________________________________ 24 2A. Summary of Budgetary Central Government Operations, 2012–19 (GFS 2001, Cash Basis) _ 25 2B. Summary of Budgetary Central Government Operations, 2012–19 (GFS 2001, Cash Basis) __ 26 2C. Summary of Budgetary Central Government Operations, 2012–19 (GFS 2001, Commitment Basis) _____________________________________________________________________________________________ 27

GHANA
INTERNATIONAL MONETARY FUND 3
2D. Summary of Budgetary Central Government Operations, 2012–19 (GFS 2001, Commitment Basis) _____________________________________________________________________________________________ 28 3. Monetary Survey, 2011–14 ____________________________________________________________________ 29 4. Balance of Payments, 2012–19 ________________________________________________________________ 30 5. Financial Soundness Indicators, 2008–13 _____________________________________________________ 31 6. Selected Indicators on the Millennium Development Goals, 1990–2013 ______________________ 32 APPENDIX I. Risk Assessment Matrix ________________________________________________________________________ 33

GHANA
4 INTERNATIONAL MONETARY FUND
01020304050607080 Avg. 1990-95 Avg. 2005-2010
Poverty Ratio
Sources: World Bank, World Development Indicators, 2013.
BACKGROUND AND RECENT DEVELOPMENTS 1. Political uncertainty has been resolved. President Mahama’s National Democratic Congress was reelected in December 2012 by a small margin in the popular vote, but with a sizeable parliamentary majority. Following a challenge by the opposition party, the supreme court confirmed the election results in September, ending a period of political uncertainty.
2. Ghana has experienced strong and broadly inclusive growth over the past two decades and its medium-term prospects are supported by rising energy production. The country has outperformed regional peers in reducing poverty and improving social indicators. Robust democratic credentials and a highly-rated business climate (Box 1) have helped attract significant FDI, supporting a strong growth record and graduation to lower-middle income status. Over the medium term, growing energy production will boost exports and carry the potential of easing one of Ghana’s main growth constraints by making the provision of energy more reliable.
3. The government’s transformation agenda is focused on economic diversification, social inclusion, and macroeconomic stability (Box 2). A key aspect of the strategy is a major shift of public expenditure from current to capital spending, to ensure that Ghana’s still new oil and gas resources are channeled into productive investment, as mandated in the Petroleum Revenue Management Act.
4. However, the emergence of large fiscal and external imbalances since 2012 has created significant challenges. The fiscal (cash) deficit rose to 12 percent of GDP in 2012, fueled by a large public sector wage bill and costly energy subsidies. The fiscal expansion was accompanied by a growing current account deficit that exceeded significant FDI, loans, and portfolio inflows attracted by high interest rates on domestic bonds. As a result, public debt increased significantly and the international reserve position weakened alongside a depreciating currency.
5. A swift return to macroeconomic stability in 2013 was thwarted by weaker domestic and external conditions and ongoing difficulties in controlling public wages:
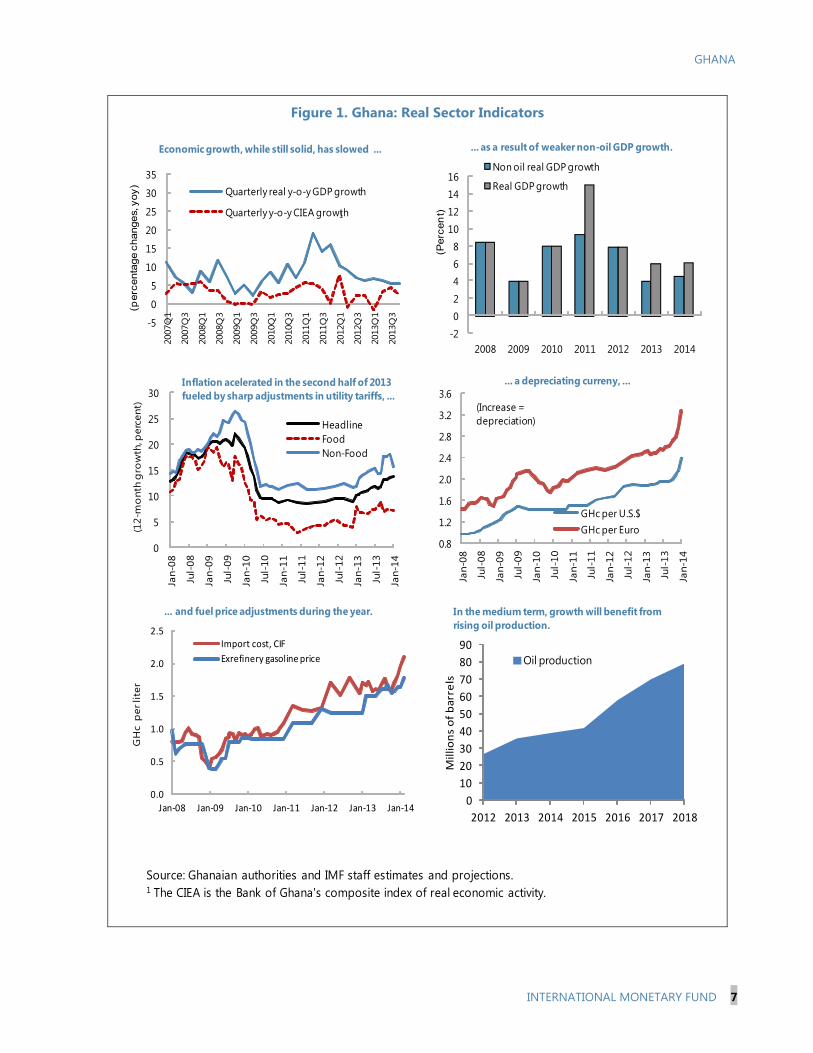
Economic growth slowed from previously high levels (Figure 1). While oil production grew strongly, non-oil growth was affected by disruptions in power supply in the first half of the year and falling gold production related to the drop in world prices. High interest rates and rising import costs due to the depreciation began to depress private sector activity. Staff assumes a growth deceleration to 5½ percent in 2013.
GHANA
INTERNATIONAL MONETARY FUND 5
01020304050607080
Ow
n fu
nds
Frie
nds
/rel
ativ
es
Supp
liers
/cus
tom
ers
Mic
rofin
ance
Bank
s
Mon
ey
lend
ers
Pe
rce
nt
en
terp
rise
s
Manufacturing
Services
Sources of financing day-to-day operations
Box 1. Doing Business in Ghana: Opportunities and Bottlenecks
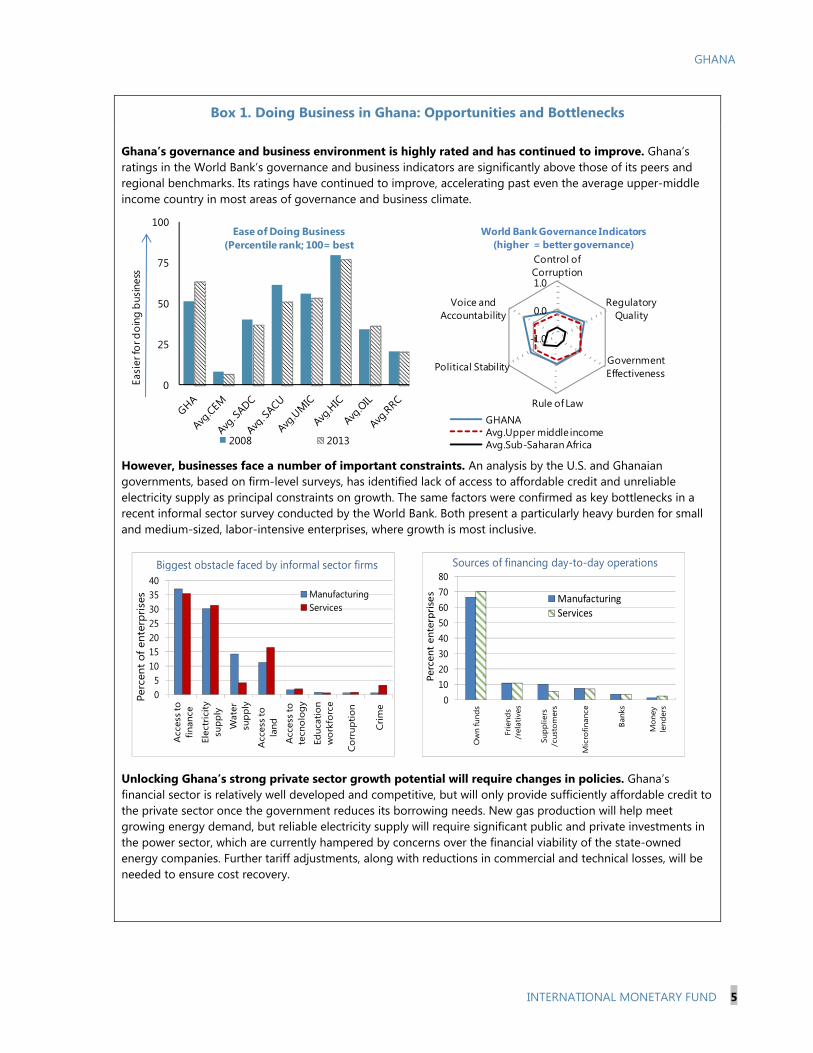
Ghana’s governance and business environment is highly rated and has continued to improve. Ghana’s ratings in the World Bank’s governance and business indicators are significantly above those of its peers and regional benchmarks. Its ratings have continued to improve, accelerating past even the average upper-middle income country in most areas of governance and business climate.
However, businesses face a number of important constraints. An analysis by the U.S. and Ghanaian governments, based on firm-level surveys, has identified lack of access to affordable credit and unreliable electricity supply as principal constraints on growth. The same factors were confirmed as key bottlenecks in a recent informal sector survey conducted by the World Bank. Both present a particularly heavy burden for small and medium-sized, labor-intensive enterprises, where growth is most inclusive.
Unlocking Ghana’s strong private sector growth potential will require changes in policies. Ghana’s financial sector is relatively well developed and competitive, but will only provide sufficiently affordable credit to the private sector once the government reduces its borrowing needs. New gas production will help meet growing energy demand, but reliable electricity supply will require significant public and private investments in the power sector, which are currently hampered by concerns over the financial viability of the state-owned energy companies. Further tariff adjustments, along with reductions in commercial and technical losses, will be needed to ensure cost recovery.
0
25
50
75
100
Easi
er fo
r doi
ng b
usin
ess
Ease of Doing Business(Percentile rank; 100= best
2008 2013
05
10152025303540
Acc
ess
to
finan
ce
Elec
tric
ity
supp
ly
Wat
er
supp
ly
Acc
ess
to
land
Acc
ess
to
tecn
olog
y
Educ
atio
n w
orkf
orce
Cor
rupt
ion
Crim
e
Perc
ent o
f ent
erpr
ises Manufacturing
Services
Biggest obstacle faced by informal sector firms
-1.0
0.0
1.0
Control of Corruption
Regulatory Quality
Government Effectiveness
Rule of Law
Political Stability
Voice and Accountability
World Bank Governance Indicators(higher = better governance)
GHANAAvg.Upper middle incomeAvg.Sub-Saharan Africa
GHANA
6 INTERNATIONAL MONETARY FUND
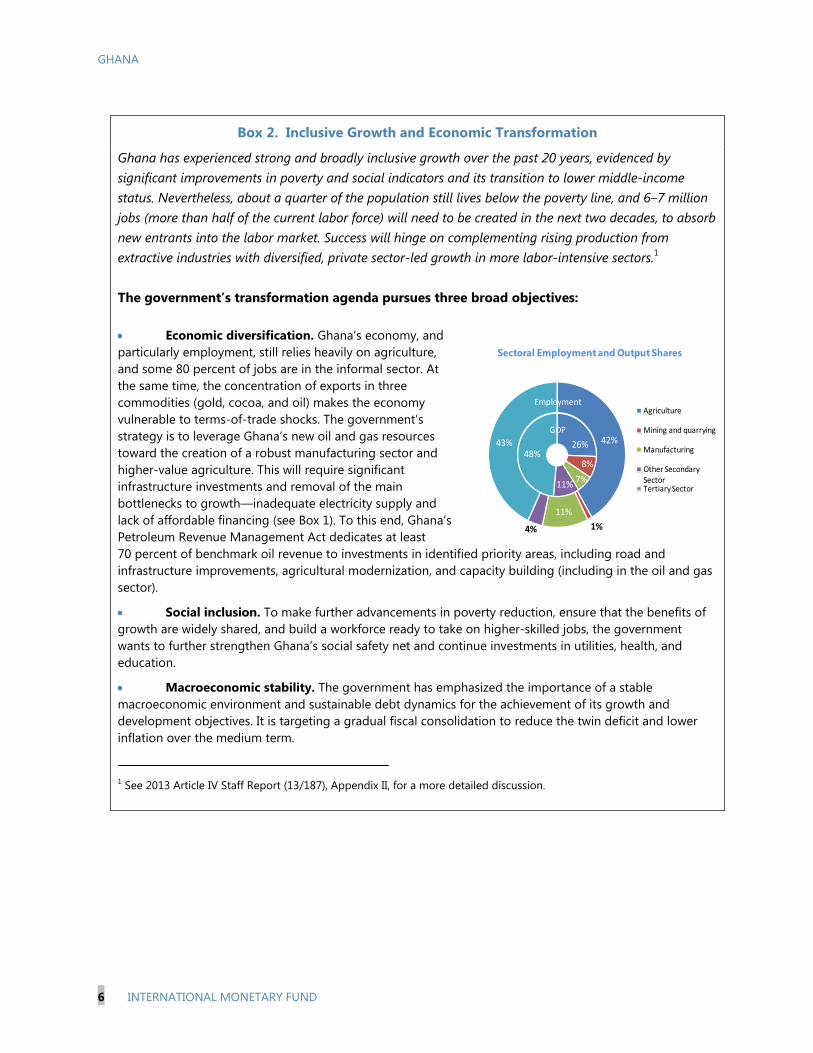
Box 2. Inclusive Growth and Economic Transformation
Ghana has experienced strong and broadly inclusive growth over the past 20 years, evidenced by significant improvements in poverty and social indicators and its transition to lower middle-income status. Nevertheless, about a quarter of the population still lives below the poverty line, and 6–7 million jobs (more than half of the current labor force) will need to be created in the next two decades, to absorb new entrants into the labor market. Success will hinge on complementing rising production from extractive industries with diversified, private sector-led growth in more labor-intensive sectors.1 The government’s transformation agenda pursues three broad objectives: Economic diversification. Ghana’s economy, and particularly employment, still relies heavily on agriculture, and some 80 percent of jobs are in the informal sector. At the same time, the concentration of exports in three commodities (gold, cocoa, and oil) makes the economy vulnerable to terms-of-trade shocks. The government’s strategy is to leverage Ghana’s new oil and gas resources toward the creation of a robust manufacturing sector and higher-value agriculture. This will require significant infrastructure investments and removal of the main bottlenecks to growth—inadequate electricity supply and lack of affordable financing (see Box 1). To this end, Ghana’s Petroleum Revenue Management Act dedicates at least 70 percent of benchmark oil revenue to investments in identified priority areas, including road and infrastructure improvements, agricultural modernization, and capacity building (including in the oil and gas sector).
Social inclusion. To make further advancements in poverty reduction, ensure that the benefits of growth are widely shared, and build a workforce ready to take on higher-skilled jobs, the government wants to further strengthen Ghana’s social safety net and continue investments in utilities, health, and education.
Macroeconomic stability. The government has emphasized the importance of a stable macroeconomic environment and sustainable debt dynamics for the achievement of its growth and development objectives. It is targeting a gradual fiscal consolidation to reduce the twin deficit and lower inflation over the medium term.
1 See 2013 Article IV Staff Report (13/187), Appendix II, for a more detailed discussion.
26%
8%
7%11%
48%
42%
1%
11%
4%
43%
Sectoral Employment and Output Shares
Agriculture
Mining and quarrying
Manufacturing
Other Secondary SectorTertiary Sector
Employment
GDP
GHANA
INTERNATIONAL MONETARY FUND 7
Figure 1. Ghana: Real Sector Indicators
Source: Ghanaian authorities and IMF staff estimates and projections.1 The CIEA is the Bank of Ghana's composite index of real economic activity.
-2
02
46
81012
1416
2008 2009 2010 2011 2012 2013 2014
(Perc
en
t)
Non oil real GDP growth
Real GDP growth
... as a result of weaker non-oil GDP growth.
-5
0
5
10
15
20
25
30
3520
07Q
1
2007
Q3
2008
Q1
2008
Q3
2009
Q1
2009
Q3
2010
Q1
2010
Q3
2011
Q1
2011
Q3
2012
Q1
2012
Q3
2013
Q1
2013
Q3
(perc
enta
ge c
hanges,
yoy)
Economic growth, while still solid, has slowed ...
Quarterly real y-o-y GDP growth
Quarterly y-o-y CIEA growth
0
5
10
15
20
25
30
Jan-
08
Jul-
08
Jan-
09
Jul-
09
Jan-
10
Jul-
10
Jan-
11
Jul-
11
Jan-
12
Jul-
12
Jan-
13
Jul-
13
Jan-
14
(12-
mo
nth
gro
wth
, per
cent
)
Inflation acelerated in the second half of 2013 fueled by sharp adjustments in utility tariffs, ...
HeadlineFoodNon-Food
0.0
0.5
1.0
1.5
2.0
2.5
Jan-08 Jan-09 Jan-10 Jan-11 Jan-12 Jan-13 Jan-14
GH
c p
er li
ter
Import cost, CIF
Exrefinery gasoline price
... and fuel price adjustments during the year.
0.8
1.2
1.6
2.0
2.4
2.8
3.2
3.6
Jan-
08
Jul-
08
Jan-
09
Jul-
09
Jan-
10
Jul-
10
Jan-
11
Jul-
11
Jan-
12
Jul-
12
Jan-
13
Jul-
13
Jan-
14
GHc per U.S.$GHc per Euro
(Increase = depreciation)
... a depreciating curreny, ...
0
10
20
30
40
50
60
70
80
90
2012 2013 2014 2015 2016 2017 2018
Mill
ion
s o
f b
arre
ls
Oil production
In the medium term, growth will benefit from rising oil production.
1

GHANA
8 INTERNATIONAL MONETARY FUND
-600
-400
-200
0
200
400
600
800
1000
Jan-09 Jul-09 Jan-10 Jul-10 Jan-11 Jul-11 Jan-12 Jul-12 Jan-13 Jul-13 Jan-14
EMP
units
Annualized interest rate on 3-months treasury bill
Nominal exchange rate
Reserves, net
EMP
Exchange Market Pressure Index (EMP) and components
Sources: Ghanaian authorities; and IMF staff estimates
100
200
300
400
500
600
700
Dec
-12
Jan-
13
Feb-
13
Mar
-13
Apr-
13
May
-13
Jun-
13
Jul-1
3
Aug-
13
Sep-
13
Oct
-13
Nov
-13
Dec
-13
Jan-
14
Feb-
14
Ghana 2017 * Nigeria 2021 * Rwanda 2023 *Senegal ** Zambia **
Sovereign Spread, SSA Frontier Markets (USD-denominated, basis points)
Sources: * Security specific spread.** JP Morgan Bond Index Global (EMBIG).
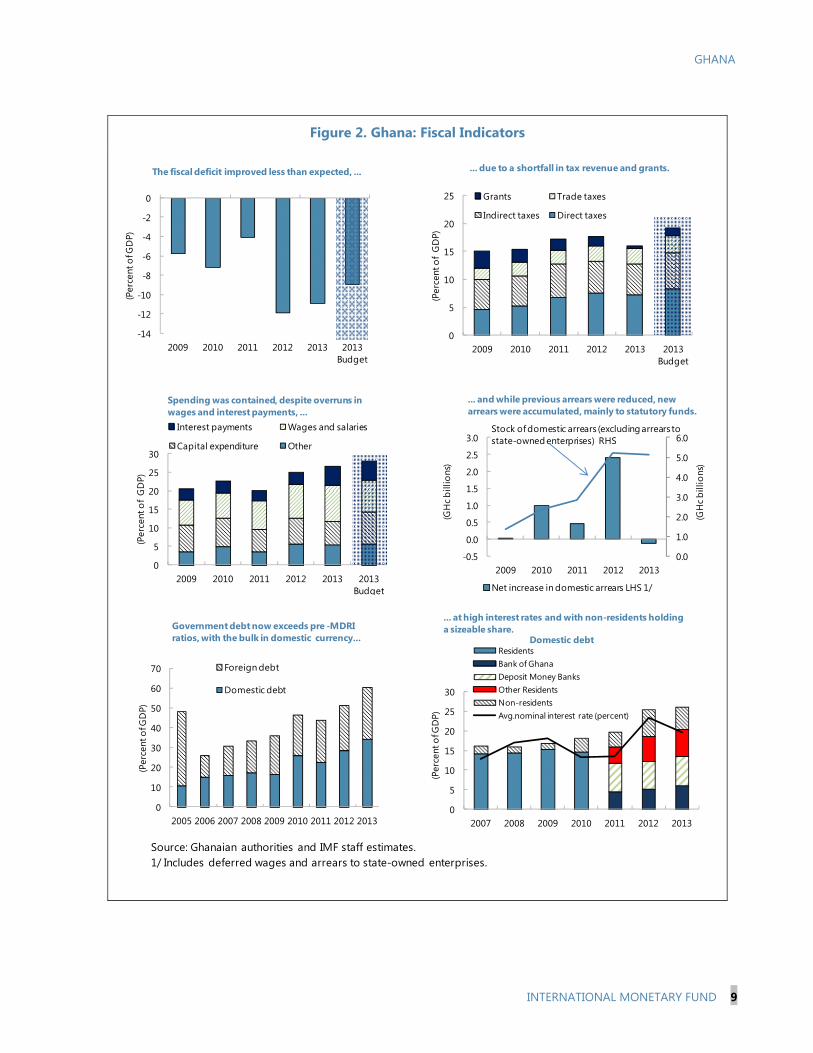
The fiscal target was missed, despite significant measures to contain the deficit (Figure 2). Faced with shortfalls in tax collection and grants, relative to budget targets, and ongoing overruns in the wage bill, the government imposed levies on certain imports and on profits of specific sectors mid-year. It also reinstated the fuel-price adjustment mechanism to eliminate subsidies; sharply raised electricity and water tariffs (the former by 60 percent); and compressed other spending. While these measures were in line with recommendations in the 2013 Article IV consultation, the weaker-than-anticipated economic environment would have demanded a stronger and earlier effort. The cash deficit reached an estimated 10.9 percent of GDP, versus a 9 percent target. Domestic arrears declined marginally, implying a slightly smaller deficit (10.8 percent of GDP) on a commitment basis.
Inflation ended the year at 13½ percent, above the 9+/-2 percent target range. Large administered price hikes contributed to this outcome, though staff’s estimate of core inflation (excluding high administered, but also low food price increases) was even larger at 15 percent. Faced with growing liquidity from a high fiscal deficit and currency swaps with local banks, the BOG ramped up sterilization operations, while steering interbank rates close to the policy rate. The latter was raised in February 2014 by 200 basis points to 18 percent, and in April, the BOG increased reserve requirements from 9 to 11 percent and tightened limits on banks’ net open positions. Government bond rates, which had declined to 19 percent during 2013, helped by a US$1 billion Eurobond, climbed again to 23 percent in early 2014.
The external position has become increasingly fragile. With weaker gold and cocoa exports, the estimated current account deficit rose above 13 percent of GDP in 2013, with some 7 percent of GDP financed by FDI (Figure 3). As a result, the cedi depreciated by close to 15 percent in 2013 and 18 percent in the first quarter of 2014 alone, while spreads on Ghana’s Eurobonds are now the highest among SSA frontier markets. An exchange market pressure index—combining changes in the exchange rate, interest rates, and reserves—has recently risen above 2009 levels, but remains below 2012 peaks.
-0.6
-0.4
-0.2
0.0
0.2
0.4
0.6
0.8
1.0
De
c-1
0
Mar
-11
Jun
-11
Sep
-11
De
c-1
1
Mar
-12
Jun
-12
Sep
-12
De
c-1
2
Mar
-13
Jun
-13
Sep
-13
De
c-1
3
Interbank Liquidity Index 1/
1 Interbank liquidity index computed by BOG based on the average daily bid-ask spread; daily change of overnight rate; daily turnover,
-
0.5
1.0
1.5
2.0
2.5
3.0
3.5
4.0
Jan-
12
Mar
-12
May
-12
Jul-1
2
Sep-
12
Nov
-12
Jan-
13
Mar
-13
May
-13
Jul-1
3
Sep-
13
Nov
-13
(bill
ion
GH
c)
91-DAYS 182-DAYS 1-YEAR
56-DAYS 28-DAYS
Sterilization: Stock Open Market Operations
GHANA
INTERNATIONAL MONETARY FUND 9
Figure 2. Ghana: Fiscal Indicators
Source: Ghanaian authorities and IMF staff estimates. 1/ Includes deferred wages and arrears to state-owned enterprises.
0
5
10
15
20
25
2009 2010 2011 2012 2013 2013 Budget
(Per
cent
of
GD
P)
Grants Trade taxes
Indirect taxes Direct taxes
... due to a shortfall in tax revenue and grants.... due to a shortfall in tax revenue and grants.... due to a shortfall in tax revenue and grants.... due to a shortfall in tax revenue and grants.... due to a shortfall in tax revenue and grants.... due to a shortfall in tax revenue and grants.... due to a shortfall in tax revenue and grants.... due to a shortfall in tax revenue and grants.... due to a shortfall in tax revenue and grants.... due to a shortfall in tax revenue and grants.... due to a shortfall in tax revenue and grants.... due to a shortfall in tax revenue and grants.... due to a shortfall in tax revenue and grants.... due to a shortfall in tax revenue and grants.... due to a shortfall in tax revenue and grants.... due to a shortfall in tax revenue and grants.... due to a shortfall in tax revenue and grants.... due to a shortfall in tax revenue and grants.... due to a shortfall in tax revenue and grants.... due to a shortfall in tax revenue and grants.... due to a shortfall in tax revenue and grants.... due to a shortfall in tax revenue and grants.... due to a shortfall in tax revenue and grants.... due to a shortfall in tax revenue and grants.... due to a shortfall in tax revenue and grants.... due to a shortfall in tax revenue and grants.... due to a shortfall in tax revenue and grants.... due to a shortfall in tax revenue and grants.... due to a shortfall in tax revenue and grants.... due to a shortfall in tax revenue and grants.... due to a shortfall in tax revenue and grants.... due to a shortfall in tax revenue and grants.... due to a shortfall in tax revenue and grants.... due to a shortfall in tax revenue and grants.... due to a shortfall in tax revenue and grants.... due to a shortfall in tax revenue and grants.... due to a shortfall in tax revenue and grants.... due to a shortfall in tax revenue and grants.... due to a shortfall in tax revenue and grants.... due to a shortfall in tax revenue and grants.... due to a shortfall in tax revenue and grants.... due to a shortfall in tax revenue and grants.... due to a shortfall in tax revenue and grants.... due to a shortfall in tax revenue and grants.... due to a shortfall in tax revenue and grants.... due to a shortfall in tax revenue and grants.... due to a shortfall in tax revenue and grants.... due to a shortfall in tax revenue and grants.... due to a shortfall in tax revenue and grants.... due to a shortfall in tax revenue and grants.... due to a shortfall in tax revenue and grants.... due to a shortfall in tax revenue and grants.... due to a shortfall in tax revenue and grants.... due to a shortfall in tax revenue and grants.... due to a shortfall in tax revenue and grants.... due to a shortfall in tax revenue and grants.... due to a shortfall in tax revenue and grants.... due to a shortfall in tax revenue and grants.... due to a shortfall in tax revenue and grants.... due to a shortfall in tax revenue and grants.... due to a shortfall in tax revenue and grants.... due to a shortfall in tax revenue and grants.... due to a shortfall in tax revenue and grants.... due to a shortfall in tax revenue and grants.... due to a shortfall in tax revenue and grants.... due to a shortfall in tax revenue and grants.... due to a shortfall in tax revenue and grants.... due to a shortfall in tax revenue and grants.... due to a shortfall in tax revenue and grants.... due to a shortfall in tax revenue and grants.... due to a shortfall in tax revenue and grants.... due to a shortfall in tax revenue and grants.... due to a shortfall in tax revenue and grants.... due to a shortfall in tax revenue and grants.... due to a shortfall in tax revenue and grants.... due to a shortfall in tax revenue and grants.... due to a shortfall in tax revenue and grants.... due to a shortfall in tax revenue and grants.... due to a shortfall in tax revenue and grants.... due to a shortfall in tax revenue and grants.... due to a shortfall in tax revenue and grants.... due to a shortfall in tax revenue and grants.... due to a shortfall in tax revenue and grants.... due to a shortfall in tax revenue and grants.... due to a shortfall in tax revenue and grants.... due to a shortfall in tax revenue and grants.... due to a shortfall in tax revenue and grants.... due to a shortfall in tax revenue and grants.... due to a shortfall in tax revenue and grants.... due to a shortfall in tax revenue and grants.... due to a shortfall in tax revenue and grants.... due to a shortfall in tax revenue and grants.... due to a shortfall in tax revenue and grants.... due to a shortfall in tax revenue and grants.... due to a shortfall in tax revenue and grants.... due to a shortfall in tax revenue and grants.... due to a shortfall in tax revenue and grants.... due to a shortfall in tax revenue and grants.... due to a shortfall in tax revenue and grants.... due to a shortfall in tax revenue and grants.... due to a shortfall in tax revenue and grants.... due to a shortfall in tax revenue and grants.... due to a shortfall in tax revenue and grants.... due to a shortfall in tax revenue and grants.... due to a shortfall in tax revenue and grants.... due to a shortfall in tax revenue and grants.... due to a shortfall in tax revenue and grants.... due to a shortfall in tax revenue and grants.... due to a shortfall in tax revenue and grants.... due to a shortfall in tax revenue and grants.... due to a shortfall in tax revenue and grants.... due to a shortfall in tax revenue and grants.... due to a shortfall in tax revenue and grants.... due to a shortfall in tax revenue and grants.... due to a shortfall in tax revenue and grants.... due to a shortfall in tax revenue and grants.... due to a shortfall in tax revenue and grants.... due to a shortfall in tax revenue and grants.... due to a shortfall in tax revenue and grants.... due to a shortfall in tax revenue and grants.... due to a shortfall in tax revenue and grants.... due to a shortfall in tax revenue and grants.... due to a shortfall in tax revenue and grants.... due to a shortfall in tax revenue and grants.... due to a shortfall in tax revenue and grants.... due to a shortfall in tax revenue and grants.... due to a shortfall in tax revenue and grants.... due to a shortfall in tax revenue and grants.... due to a shortfall in tax revenue and grants.... due to a shortfall in tax revenue and grants.... due to a shortfall in tax revenue and grants.... due to a shortfall in tax revenue and grants.... due to a shortfall in tax revenue and grants.... due to a shortfall in tax revenue and grants.... due to a shortfall in tax revenue and grants.... due to a shortfall in tax revenue and grants.... due to a shortfall in tax revenue and grants.... due to a shortfall in tax revenue and grants.... due to a shortfall in tax revenue and grants.... due to a shortfall in tax revenue and grants.... due to a shortfall in tax revenue and grants.... due to a shortfall in tax revenue and grants.... due to a shortfall in tax revenue and grants.... due to a shortfall in tax revenue and grants.... due to a shortfall in tax revenue and grants.... due to a shortfall in tax revenue and grants.... due to a shortfall in tax revenue and grants.... due to a shortfall in tax revenue and grants.... due to a shortfall in tax revenue and grants.... due to a shortfall in tax revenue and grants.... due to a shortfall in tax revenue and grants.... due to a shortfall in tax revenue and grants.... due to a shortfall in tax revenue and grants.... due to a shortfall in tax revenue and grants.... due to a shortfall in tax revenue and grants.... due to a shortfall in tax revenue and grants.... due to a shortfall in tax revenue and grants.... due to a shortfall in tax revenue and grants.... due to a shortfall in tax revenue and grants.... due to a shortfall in tax revenue and grants.... due to a shortfall in tax revenue and grants.... due to a shortfall in tax revenue and grants.... due to a shortfall in tax revenue and grants.... due to a shortfall in tax revenue and grants.... due to a shortfall in tax revenue and grants.... due to a shortfall in tax revenue and grants.... due to a shortfall in tax revenue and grants.... due to a shortfall in tax revenue and grants.
0
5
10
15
20
25
30
2007 2008 2009 2010 2011 2012 2013
(Per
cent
of G
DP)
Domestic debtResidentsBank of GhanaDeposit Money BanksOther ResidentsNon-residentsAvg.nominal interest rate (percent)
... at high interest rates and with non-residents holding a sizeable share.
0
10
20
30
40
50
60
70
2005 2006 2007 2008 2009 2010 2011 2012 2013
(Per
cent
of G
DP)
Government debt now exceeds pre -MDRI ratios, with the bulk in domestic currency...
Foreign debt
Domestic debt
-14
-12
-10
-8
-6
-4
-2
0
2009 2010 2011 2012 2013 2013 Budget
(Per
cent
of G
DP)
The fiscal deficit improved less than expected ...... due to a shortfall in tax revenue and grants.... due to a shortfall in tax revenue and grants.... due to a shortfall in tax revenue and grants.... due to a shortfall in tax revenue and grants.... due to a shortfall in tax revenue and grants.... due to a shortfall in tax revenue and grants.... due to a shortfall in tax revenue and grants.... due to a shortfall in tax revenue and grants.... due to a shortfall in tax revenue and grants.... due to a shortfall in tax revenue and grants.... due to a shortfall in tax revenue and grants.... due to a shortfall in tax revenue and grants.... due to a shortfall in tax revenue and grants.... due to a shortfall in tax revenue and grants.... due to a shortfall in tax revenue and grants.... due to a shortfall in tax revenue and grants.... due to a shortfall in tax revenue and grants.... due to a shortfall in tax revenue and grants.... due to a shortfall in tax revenue and grants.... due to a shortfall in tax revenue and grants.... due to a shortfall in tax revenue and grants.... due to a shortfall in tax revenue and grants.... due to a shortfall in tax revenue and grants.... due to a shortfall in tax revenue and grants.... due to a shortfall in tax revenue and grants.... due to a shortfall in tax revenue and grants.... due to a shortfall in tax revenue and grants.... due to a shortfall in tax revenue and grants.... due to a shortfall in tax revenue and grants.... due to a shortfall in tax revenue and grants.... due to a shortfall in tax revenue and grants.... due to a shortfall in tax revenue and grants.... due to a shortfall in tax revenue and grants.... due to a shortfall in tax revenue and grants.... due to a shortfall in tax revenue and grants.... due to a shortfall in tax revenue and grants.... due to a shortfall in tax revenue and grants.... due to a shortfall in tax revenue and grants.... due to a shortfall in tax revenue and grants.... due to a shortfall in tax revenue and grants.... due to a shortfall in tax revenue and grants.... due to a shortfall in tax revenue and grants.... due to a shortfall in tax revenue and grants.... due to a shortfall in tax revenue and grants.... due to a shortfall in tax revenue and grants.... due to a shortfall in tax revenue and grants.... due to a shortfall in tax revenue and grants.... due to a shortfall in tax revenue and grants.... due to a shortfall in tax revenue and grants.... due to a shortfall in tax revenue and grants.... due to a shortfall in tax revenue and grants.... due to a shortfall in tax revenue and grants.... due to a shortfall in tax revenue and grants.... due to a shortfall in tax revenue and grants.... due to a shortfall in tax revenue and grants.... due to a shortfall in tax revenue and grants.... due to a shortfall in tax revenue and grants.... due to a shortfall in tax revenue and grants.... due to a shortfall in tax revenue and grants.... due to a shortfall in tax revenue and grants.... due to a shortfall in tax revenue and grants.... due to a shortfall in tax revenue and grants.... due to a shortfall in tax revenue and grants.... due to a shortfall in tax revenue and grants.... due to a shortfall in tax revenue and grants.... due to a shortfall in tax revenue and grants.... due to a shortfall in tax revenue and grants.... due to a shortfall in tax revenue and grants.... due to a shortfall in tax revenue and grants.... due to a shortfall in tax revenue and grants.... due to a shortfall in tax revenue and grants.... due to a shortfall in tax revenue and grants.... due to a shortfall in tax revenue and grants.... due to a shortfall in tax revenue and grants.... due to a shortfall in tax revenue and grants.... due to a shortfall in tax revenue and grants.... due to a shortfall in tax revenue and grants.... due to a shortfall in tax revenue and grants.
The fiscal deficit improved less than expected, ...
0
5
10
15
20
25
30
2009 2010 2011 2012 2013 2013 Budget
(Per
cent
of
GD
P)
Interest payments Wages and salaries
Capital expenditure Other
... due to a shortfall in tax revenue and grants.... due to a shortfall in tax revenue and grants.... due to a shortfall in tax revenue and grants.... due to a shortfall in tax revenue and grants.... due to a shortfall in tax revenue and grants.... due to a shortfall in tax revenue and grants.... due to a shortfall in tax revenue and grants.... due to a shortfall in tax revenue and grants.... due to a shortfall in tax revenue and grants.... due to a shortfall in tax revenue and grants.... due to a shortfall in tax revenue and grants.... due to a shortfall in tax revenue and grants.... due to a shortfall in tax revenue and grants.... due to a shortfall in tax revenue and grants.... due to a shortfall in tax revenue and grants.... due to a shortfall in tax revenue and grants.... due to a shortfall in tax revenue and grants.... due to a shortfall in tax revenue and grants.... due to a shortfall in tax revenue and grants.... due to a shortfall in tax revenue and grants.... due to a shortfall in tax revenue and grants.... due to a shortfall in tax revenue and grants.... due to a shortfall in tax revenue and grants.... due to a shortfall in tax revenue and grants.... due to a shortfall in tax revenue and grants.... due to a shortfall in tax revenue and grants.... due to a shortfall in tax revenue and grants.... due to a shortfall in tax revenue and grants.... due to a shortfall in tax revenue and grants.... due to a shortfall in tax revenue and grants.... due to a shortfall in tax revenue and grants.... due to a shortfall in tax revenue and grants.... due to a shortfall in tax revenue and grants.... due to a shortfall in tax revenue and grants.... due to a shortfall in tax revenue and grants.... due to a shortfall in tax revenue and grants.... due to a shortfall in tax revenue and grants.... due to a shortfall in tax revenue and grants.... due to a shortfall in tax revenue and grants.... due to a shortfall in tax revenue and grants.... due to a shortfall in tax revenue and grants.... due to a shortfall in tax revenue and grants.... due to a shortfall in tax revenue and grants.... due to a shortfall in tax revenue and grants.... due to a shortfall in tax revenue and grants.... due to a shortfall in tax revenue and grants.... due to a shortfall in tax revenue and grants.... due to a shortfall in tax revenue and grants.... due to a shortfall in tax revenue and grants.... due to a shortfall in tax revenue and grants.... due to a shortfall in tax revenue and grants.... due to a shortfall in tax revenue and grants.... due to a shortfall in tax revenue and grants.... due to a shortfall in tax revenue and grants.... due to a shortfall in tax revenue and grants.... due to a shortfall in tax revenue and grants.... due to a shortfall in tax revenue and grants.... due to a shortfall in tax revenue and grants.... due to a shortfall in tax revenue and grants.... due to a shortfall in tax revenue and grants.... due to a shortfall in tax revenue and grants.... due to a shortfall in tax revenue and grants.... due to a shortfall in tax revenue and grants.... due to a shortfall in tax revenue and grants.... due to a shortfall in tax revenue and grants.... due to a shortfall in tax revenue and grants.... due to a shortfall in tax revenue and grants.... due to a shortfall in tax revenue and grants.... due to a shortfall in tax revenue and grants.... due to a shortfall in tax revenue and grants.... due to a shortfall in tax revenue and grants.... due to a shortfall in tax revenue and grants.... due to a shortfall in tax revenue and grants.... due to a shortfall in tax revenue and grants.... due to a shortfall in tax revenue and grants.... due to a shortfall in tax revenue and grants.... due to a shortfall in tax revenue and grants.... due to a shortfall in tax revenue and grants.... due to a shortfall in tax revenue and grants.... due to a shortfall in tax revenue and grants.... due to a shortfall in tax revenue and grants.... due to a shortfall in tax revenue and grants.... due to a shortfall in tax revenue and grants.... due to a shortfall in tax revenue and grants.... due to a shortfall in tax revenue and grants.... due to a shortfall in tax revenue and grants.... due to a shortfall in tax revenue and grants.... due to a shortfall in tax revenue and grants.... due to a shortfall in tax revenue and grants.... due to a shortfall in tax revenue and grants.... due to a shortfall in tax revenue and grants.... due to a shortfall in tax revenue and grants.... due to a shortfall in tax revenue and grants.... due to a shortfall in tax revenue and grants.... due to a shortfall in tax revenue and grants.... due to a shortfall in tax revenue and grants.... due to a shortfall in tax revenue and grants.... due to a shortfall in tax revenue and grants.... due to a shortfall in tax revenue and grants.... due to a shortfall in tax revenue and grants.... due to a shortfall in tax revenue and grants.... due to a shortfall in tax revenue and grants.... due to a shortfall in tax revenue and grants.... due to a shortfall in tax revenue and grants.... due to a shortfall in tax revenue and grants.... due to a shortfall in tax revenue and grants.... due to a shortfall in tax revenue and grants.... due to a shortfall in tax revenue and grants.... due to a shortfall in tax revenue and grants.... due to a shortfall in tax revenue and grants.... due to a shortfall in tax revenue and grants.... due to a shortfall in tax revenue and grants.... due to a shortfall in tax revenue and grants.... due to a shortfall in tax revenue and grants.... due to a shortfall in tax revenue and grants.... due to a shortfall in tax revenue and grants.... due to a shortfall in tax revenue and grants.... due to a shortfall in tax revenue and grants.... due to a shortfall in tax revenue and grants.... due to a shortfall in tax revenue and grants.... due to a shortfall in tax revenue and grants.... due to a shortfall in tax revenue and grants.... due to a shortfall in tax revenue and grants.... due to a shortfall in tax revenue and grants.... due to a shortfall in tax revenue and grants.... due to a shortfall in tax revenue and grants.... due to a shortfall in tax revenue and grants.... due to a shortfall in tax revenue and grants.... due to a shortfall in tax revenue and grants.... due to a shortfall in tax revenue and grants.... due to a shortfall in tax revenue and grants.... due to a shortfall in tax revenue and grants.... due to a shortfall in tax revenue and grants.... due to a shortfall in tax revenue and grants.... due to a shortfall in tax revenue and grants.... due to a shortfall in tax revenue and grants.... due to a shortfall in tax revenue and grants.... due to a shortfall in tax revenue and grants.... due to a shortfall in tax revenue and grants.... due to a shortfall in tax revenue and grants.... due to a shortfall in tax revenue and grants.... due to a shortfall in tax revenue and grants.... due to a shortfall in tax revenue and grants.... due to a shortfall in tax revenue and grants.... due to a shortfall in tax revenue and grants.... due to a shortfall in tax revenue and grants.... due to a shortfall in tax revenue and grants.... due to a shortfall in tax revenue and grants.... due to a shortfall in tax revenue and grants.... due to a shortfall in tax revenue and grants.... due to a shortfall in tax revenue and grants.... due to a shortfall in tax revenue and grants.... due to a shortfall in tax revenue and grants.... due to a shortfall in tax revenue and grants.... due to a shortfall in tax revenue and grants.... due to a shortfall in tax revenue and grants.... due to a shortfall in tax revenue and grants.... due to a shortfall in tax revenue and grants.... due to a shortfall in tax revenue and grants.... due to a shortfall in tax revenue and grants.... due to a shortfall in tax revenue and grants.... due to a shortfall in tax revenue and grants.... due to a shortfall in tax revenue and grants.... due to a shortfall in tax revenue and grants.... due to a shortfall in tax revenue and grants.... due to a shortfall in tax revenue and grants.... due to a shortfall in tax revenue and grants.... due to a shortfall in tax revenue and grants.... due to a shortfall in tax revenue and grants.... due to a shortfall in tax revenue and grants.... due to a shortfall in tax revenue and grants.... due to a shortfall in tax revenue and grants.... due to a shortfall in tax revenue and grants.... due to a shortfall in tax revenue and grants.... due to a shortfall in tax revenue and grants.... due to a shortfall in tax revenue and grants.... due to a shortfall in tax revenue and grants.... due to a shortfall in tax revenue and grants.... due to a shortfall in tax revenue and grants.... due to a shortfall in tax revenue and grants.... due to a shortfall in tax revenue and grants.... due to a shortfall in tax revenue and grants.... due to a shortfall in tax revenue and grants.... due to a shortfall in tax revenue and grants.... due to a shortfall in tax revenue and grants.... due to a shortfall in tax revenue and grants.... due to a shortfall in tax revenue and grants.... due to a shortfall in tax revenue and grants.... due to a shortfall in tax revenue and grants.... due to a shortfall in tax revenue and grants.... due to a shortfall in tax revenue and grants.... due to a shortfall in tax revenue and grants.... due to a shortfall in tax revenue and grants.... due to a shortfall in tax revenue and grants.... due to a shortfall in tax revenue and grants.... due to a shortfall in tax revenue and grants.... due to a shortfall in tax revenue and grants.... due to a shortfall in tax revenue and grants.... due to a shortfall in tax revenue and grants.... due to a shortfall in tax revenue and grants.... due to a shortfall in tax revenue and grants.... due to a shortfall in tax revenue and grants.... due to a shortfall in tax revenue and grants.... due to a shortfall in tax revenue and grants.... due to a shortfall in tax revenue and grants.... due to a shortfall in tax revenue and grants.... due to a shortfall in tax revenue and grants.... due to a shortfall in tax revenue and grants.... due to a shortfall in tax revenue and grants.... due to a shortfall in tax revenue and grants.... due to a shortfall in tax revenue and grants.Spending was contained, despite overruns in wages and interest payments, ...
0.0
1.0
2.0
3.0
4.0
5.0
6.0
-0.5
0.0
0.5
1.0
1.5
2.0
2.5
3.0
2009 2010 2011 2012 2013
(GH
c bill
ions
)
(GH
c bill
ions
)
Net increase in domestic arrears LHS 1/
... and while previous arrears were reduced, new arrears were accumulated, mainly to statutory funds.
Stock of domestic arrears (excluding arrears to state-owned enterprises) RHS

GHANA
10 INTERNATIONAL MONETARY FUND
Figure 3. Ghana: External Indicators
Source: Ghanaian authorities and IMF staff estimates.
50
70
90
110
130
150
170
190
210
Jan-
08Ap
r-08
Jul-0
8O
ct-0
8Ja
n-09
Apr-
09Ju
l-09
Oct
-09
Jan-
10Ap
r-10
Jul-1
0O
ct-1
0Ja
n-11
Apr-
11Ju
l-11
Oct
-11
Jan-
12Ap
r-12
Jul-1
2O
ct-1
2Ja
n-13
Apr-
13Ju
l-13
Oct
-13
Jan-
14
(In
dex
; Jan
. 200
5 =
100)
The terms of trade have weakened on the back of decling gold prices.
Cocoa Beans
Gold
Crude Oil
Jan. 2008 – Jan. 2014
-14
-12
-10
-8
-6
-4
-2
0
-80
-60
-40
-20
0
20
40
60
2007 2008 2009 2010 2011 2012 2013
(Per
cen
t of G
DP
)
(Per
cen
t of G
DP
)
Exports of goods and servicesImports of goods and servicesCurrent account (RHS)
…but did not prevent the widening of the current account deficit as a share of GDP.
0
5
10
15
20
2007 2008 2009 2010 2011 2012 2013
(Per
cen
t of G
DP
)Official financing Direct investment
Short-term capital Financial account
Current account deficit
Despite strong capital inflows, the BOP ended the year again in a deficit position.
00.511.522.533.54
0
1
2
3
4
5
6
7
2007 2008 2009 2010 2011 2012 2013
(Mo
nth
s of
impo
rts)
(Bill
ions
of U
S D
olla
rs) Millions of US Dollars
Months of imports
Gross international reserves
Gross international reserves are still around3 months of imports...
70
90
110
130
150
170
190
0
2
4
6
8
10
12
14
2007 2008 2009 2010 2011 2012 2013
(Inde
x)
(Bill
ions
of U
S D
olla
rs) Gold
CocoaOilToT index (RHS)
Growing oil production made up for most of the losses from lower gold and cocoa exports…
Feb-
13
Mar
-13
Apr
-13
May
-13
Jun-
13
Jul-
13
Aug
-13
Sep-
13
Oct
-13
Nov
-13
Dec
-13
Jan-
14
Feb-
14
0
1
2
3
4
5
6
7
8
(Bill
ions
of U
S D
olla
rs)
Gross International Reserves
.. but have been declining in recent months.

GHANA
INTERNATIONAL MONETARY FUND 11
OUTLOOK AND RISKS Rising vulnerabilities were a central focus of the discussions. Staff saw serious risks to the government’s transformation agenda. It cautioned that macroeconomic stability will need to be restored to preserve a positive medium-term outlook.
6. The government’s policy is guided by a gradual reduction in macroeconomic imbalances to preserve economic growth. The 2014 budget foresees a reduction in primary current spending by about 3 percentage points of GDP, mainly through tight limits on the wage bill and elimination of subsidies. This would make room for a larger capital budget, higher interest payments, and clearance of arrears. Revenue is projected to increase by 2½ percentage points of GDP, reflecting tax policy measures and revenue administration reforms (see next section). Based on these plans and projected growth of 8 percent, the budget envisages a deficit of 8.5 percent of GDP this year and a medium-term deficit of 6 percent of GDP in 2016. The fiscal adjustment is expected to be mirrored in a gradual reduction in external imbalances, a stabilization of the currency, and a declining inflation path, with continued strong growth.
7. Staff saw the government’s targets at risk in the absence of additional fiscal measures, pointing to the macroeconomic costs of large fiscal imbalances. Constrained foreign financing and limited scope to boost exports in the short term will keep pressure on the cedi, forcing an adjustment in imports and keeping inflation high. Staff’s baseline assumes a contraction in the current account deficit by 2½ percentage points of GDP in 2014, with high interest rates and the depreciation slowing growth to a projected 4¾ percent. This will raise government interest payments and dampen revenue, implying a projected fiscal deficit of 10¼ percent of GDP. Any slippages in ambitious primary current spending projections would raise the deficit further.
8. Staff stressed more serious risks to this outlook in the event of a further deterioration in the external environment (see Appendix I). Ghana’s main vulnerability arises from its large twin deficits in the context of a low reserve buffer, sustained by swaps and bridging loans (Box 3). The sum of Ghana’s non-FDI financed current account deficit, amortization on foreign loans, maturing domestic bonds held by non-residents, and maturing swaps and bridging loans, amounts to a total gross external financing need of $4.3 billion in 2014—corresponding to about three-quarters of the reserve stock at end-2013. Against this background, a further weakening in the terms of trade, or a larger outflow of foreign financing, could have a significant impact on reserves and force a more drastic depreciation
2014 2015 2016
Budget Proj. Outturn
Budget Budget Budget
Total revenue and grants 21.0 18.1 21.2 21.2 21.2Revenue 19.5 17.6 20.1 19.9 20.4
Oil revenue 1.2 1.9 1.6 1.4 1.4Nonoil revenue 18.3 15.8 18.5 18.5 19.0
Grants 1.4 0.5 1.1 1.2 0.8Total expenditure 28.0 26.5 26.6 26.2 26.0
Wages and salaries1 8.4 9.6 8.5 7.5 7.0Interest costs 3.6 5.0 5.9 5.2 4.6Other recurrent expenditure 7.4 5.5 4.0 4.0 4.5Capital expenditure 8.5 6.4 8.3 9.6 9.9
Arrears clearance and VATrefunds 2 -2.0 -2.5 -3.1 -2.5 -1.2
Overall balance (financing) -9.0 -10.8 -8.5 -7.5 -6.0
Memorandum items: Nominal GDP (millions of GHc) 88,764 87,155 105,504 129,289 163,105Real GDP growth (in percent) 8.0 7.4 8.0 8.2 10.0
Sources: Ghanaian authorities.
2013
Ghana: Authorities' Budget Scenario, 2013–16 (In percent of GDP)
1 Excludes deferred wage payments.2 Also includes deferred wage payments and discrepancy (for 2013)
GHANA
12 INTERNATIONAL MONETARY FUND
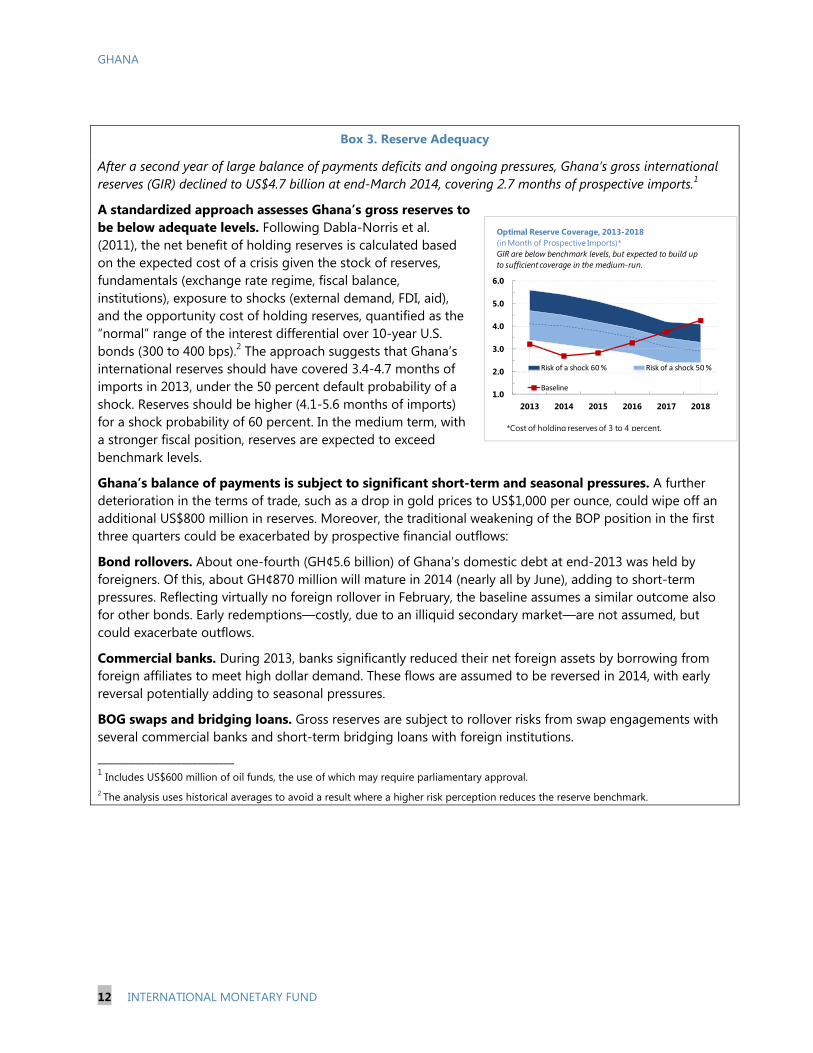
1.0
2.0
3.0
4.0
5.0
6.0
2013 2014 2015 2016 2017 2018
Risk of a shock 60 % Risk of a shock 50 %
Baseline
Optimal Reserve Coverage, 2013-2018 (in Month of Prospective Imports)*GIR are below benchmark levels, but expected to build up to sufficient coverage in the medium-run.
*Cost of holding reserves of 3 to 4 percent.
Box 3. Reserve Adequacy
After a second year of large balance of payments deficits and ongoing pressures, Ghana’s gross international reserves (GIR) declined to US$4.7 billion at end-March 2014, covering 2.7 months of prospective imports.1
A standardized approach assesses Ghana’s gross reserves to be below adequate levels. Following Dabla-Norris et al. (2011), the net benefit of holding reserves is calculated based on the expected cost of a crisis given the stock of reserves, fundamentals (exchange rate regime, fiscal balance, institutions), exposure to shocks (external demand, FDI, aid), and the opportunity cost of holding reserves, quantified as the “normal” range of the interest differential over 10-year U.S. bonds (300 to 400 bps).2 The approach suggests that Ghana’s international reserves should have covered 3.4-4.7 months of imports in 2013, under the 50 percent default probability of a shock. Reserves should be higher (4.1-5.6 months of imports) for a shock probability of 60 percent. In the medium term, with a stronger fiscal position, reserves are expected to exceed benchmark levels.
Ghana’s balance of payments is subject to significant short-term and seasonal pressures. A further deterioration in the terms of trade, such as a drop in gold prices to US$1,000 per ounce, could wipe off an additional US$800 million in reserves. Moreover, the traditional weakening of the BOP position in the first three quarters could be exacerbated by prospective financial outflows:
Bond rollovers. About one-fourth (GH¢5.6 billion) of Ghana’s domestic debt at end-2013 was held by foreigners. Of this, about GH¢870 million will mature in 2014 (nearly all by June), adding to short-term pressures. Reflecting virtually no foreign rollover in February, the baseline assumes a similar outcome also for other bonds. Early redemptions—costly, due to an illiquid secondary market—are not assumed, but could exacerbate outflows.
Commercial banks. During 2013, banks significantly reduced their net foreign assets by borrowing from foreign affiliates to meet high dollar demand. These flows are assumed to be reversed in 2014, with early reversal potentially adding to seasonal pressures.
BOG swaps and bridging loans. Gross reserves are subject to rollover risks from swap engagements with several commercial banks and short-term bridging loans with foreign institutions. __________________________ 1 Includes US$600 million of oil funds, the use of which may require parliamentary approval. 2 The analysis uses historical averages to avoid a result where a higher risk perception reduces the reserve benchmark.

GHANA
INTERNATIONAL MONETARY FUND 13
15
25
35
45
55
2014 2019 2024 2029 2034
baseline
alternative
Public Debt Service-to-Revenue Ratio
15
25
35
45
55
65
75
2014 2019 2024 2029 2034
baseline
alternative
Public Debt-to-GDP Ratio
and import compression. Interest rates would have to be hiked by more to contain an accelerating inflation rate, while lower revenue combined with higher interest payments would further widen the fiscal deficit. In this case, the economic costs in terms of growth and employment, and the efforts needed to restore stability, would be significant.
9. Apart from short-term risks, the authorities’ gradual fiscal adjustment implies continuing vulnerabilities and significant costs over the medium term. It would keep the fiscal and current account deficits elevated and above external sustainability benchmarks (Box 4), prolonging the need for a tight monetary policy stance and leaving external buffers low. Moreover, Ghana’s risk of debt distress would be approaching high levels, with the public debt ratio remaining close to 60 percent of GDP and debt service absorbing some 40-50 percent of revenue.1
10. Staff recommended a more ambitious adjustment scenario. Additional consolidation of close to 2 percentage points of GDP in 2014, combined with a more significant adjustment over the medium term, could set off a virtuous cycle, where lower fiscal deficits and falling interest rates would create room for higher social and infrastructure spending and a crowding-in of private sector activity. In the short run, growth will be subject to two offsetting factors, with the contractionary impact of fiscal consolidation assumed to be fully neutralized by the positive impact of lower interest rates and contained depreciation. In the medium term, the positive impact is expected to dominate, resulting in higher growth and significantly lower debt and debt-service ratios.
Indicators of Public Sector Indebtedness Under Alternative Scenarios
1 See Supplement on Joint IMF and World Bank Debt Sustainability Analysis.
2012 2013 2014 2015 2016 2017 2018 2019Prel.
BaselineReal GDP (annual percent change) 7.9 5.4 4.8 5.4 8.1 7.5 6.8 3.8Real GDP non-oil (annual percent change) 7.8 3.9 4.5 5.2 6.6 6.7 6.2 5.6Inflation, eop (annual percent change) 8.8 13.5 12.3 9.8 9.2 8.8 8.2 8.0Overall fiscal balance (financing) -12.0 -10.9 -10.2 -9.2 -7.6 -5.3 -4.6 -4.3Central government debt (net) 49.1 54.8 61.9 65.1 66.2 61.1 57.1 55.1Current account balance (percent of GDP) -12.2 -13.2 -10.5 -7.8 -7.4 -6.9 -6.7 -6.7
AlternativeReal GDP (annual percent change) 7.9 5.4 4.8 5.6 8.6 8.0 7.4 4.3Real GDP non-oil (annual percent change) 7.8 3.9 4.5 5.5 7.1 7.3 6.9 6.1Inflation, eop (annual percent change) 8.8 13.5 9.8 9.4 8.7 8.0 7.5 7.0Overall fiscal balance (financing) -12.0 -10.9 -8.5 -6.3 -4.5 -2.5 -1.8 -1.7Central government debt (net) 49.1 54.8 59.7 59.2 56.8 50.2 44.8 41.4Current account balance (percent of GDP) -12.2 -13.2 -10.0 -6.9 -7.0 -6.8 -6.1 -5.7
Sources: Ghanaian authorities and IMF staff projections.
Proj.
Macroeconomic Indicators, 2012-2019
(Percent of GDP; unless otherwise indicated)
GHANA
14 INTERNATIONAL MONETARY FUND
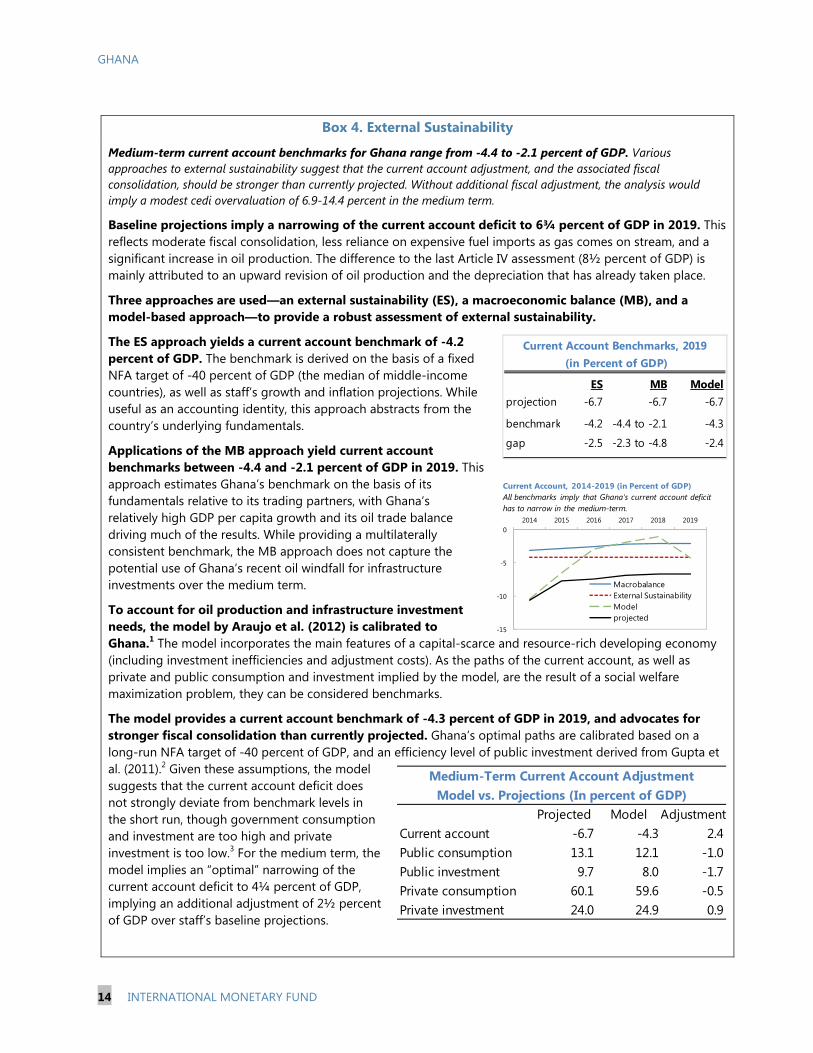
ES MB Modelprojection -6.7 -6.7 -6.7
benchmark -4.2 -4.4 to -2.1 -4.3
gap -2.5 -2.3 to -4.8 -2.4
Current Account Benchmarks, 2019 (in Percent of GDP)
-15
-10
-5
02014 2015 2016 2017 2018 2019
MacrobalanceExternal SustainabilityModelprojected
Current Account, 2014-2019 (in Percent of GDP)All benchmarks imply that Ghana's current account deficit has to narrow in the medium-term.
Projected Model AdjustmentCurrent account -6.7 -4.3 2.4Public consumption 13.1 12.1 -1.0Public investment 9.7 8.0 -1.7Private consumption 60.1 59.6 -0.5Private investment 24.0 24.9 0.9
Medium-Term Current Account AdjustmentModel vs. Projections (In percent of GDP)
Box 4. External Sustainability
Medium-term current account benchmarks for Ghana range from -4.4 to -2.1 percent of GDP. Various approaches to external sustainability suggest that the current account adjustment, and the associated fiscal consolidation, should be stronger than currently projected. Without additional fiscal adjustment, the analysis would imply a modest cedi overvaluation of 6.9-14.4 percent in the medium term.
Baseline projections imply a narrowing of the current account deficit to 6¾ percent of GDP in 2019. This reflects moderate fiscal consolidation, less reliance on expensive fuel imports as gas comes on stream, and a significant increase in oil production. The difference to the last Article IV assessment (8½ percent of GDP) is mainly attributed to an upward revision of oil production and the depreciation that has already taken place.
Three approaches are used—an external sustainability (ES), a macroeconomic balance (MB), and a model-based approach—to provide a robust assessment of external sustainability.
The ES approach yields a current account benchmark of -4.2 percent of GDP. The benchmark is derived on the basis of a fixed NFA target of -40 percent of GDP (the median of middle-income countries), as well as staff’s growth and inflation projections. While useful as an accounting identity, this approach abstracts from the country’s underlying fundamentals.
Applications of the MB approach yield current account benchmarks between -4.4 and -2.1 percent of GDP in 2019. This approach estimates Ghana’s benchmark on the basis of its fundamentals relative to its trading partners, with Ghana’s relatively high GDP per capita growth and its oil trade balance driving much of the results. While providing a multilaterally consistent benchmark, the MB approach does not capture the potential use of Ghana’s recent oil windfall for infrastructure investments over the medium term.
To account for oil production and infrastructure investment needs, the model by Araujo et al. (2012) is calibrated to Ghana.1 The model incorporates the main features of a capital-scarce and resource-rich developing economy (including investment inefficiencies and adjustment costs). As the paths of the current account, as well as private and public consumption and investment implied by the model, are the result of a social welfare maximization problem, they can be considered benchmarks.
The model provides a current account benchmark of -4.3 percent of GDP in 2019, and advocates for stronger fiscal consolidation than currently projected. Ghana’s optimal paths are calibrated based on a long-run NFA target of -40 percent of GDP, and an efficiency level of public investment derived from Gupta et al. (2011).2 Given these assumptions, the model suggests that the current account deficit does not strongly deviate from benchmark levels in the short run, though government consumption and investment are too high and private investment is too low.3 For the medium term, the model implies an “optimal” narrowing of the current account deficit to 4¼ percent of GDP, implying an additional adjustment of 2½ percent of GDP over staff’s baseline projections.
GHANA
INTERNATIONAL MONETARY FUND 15
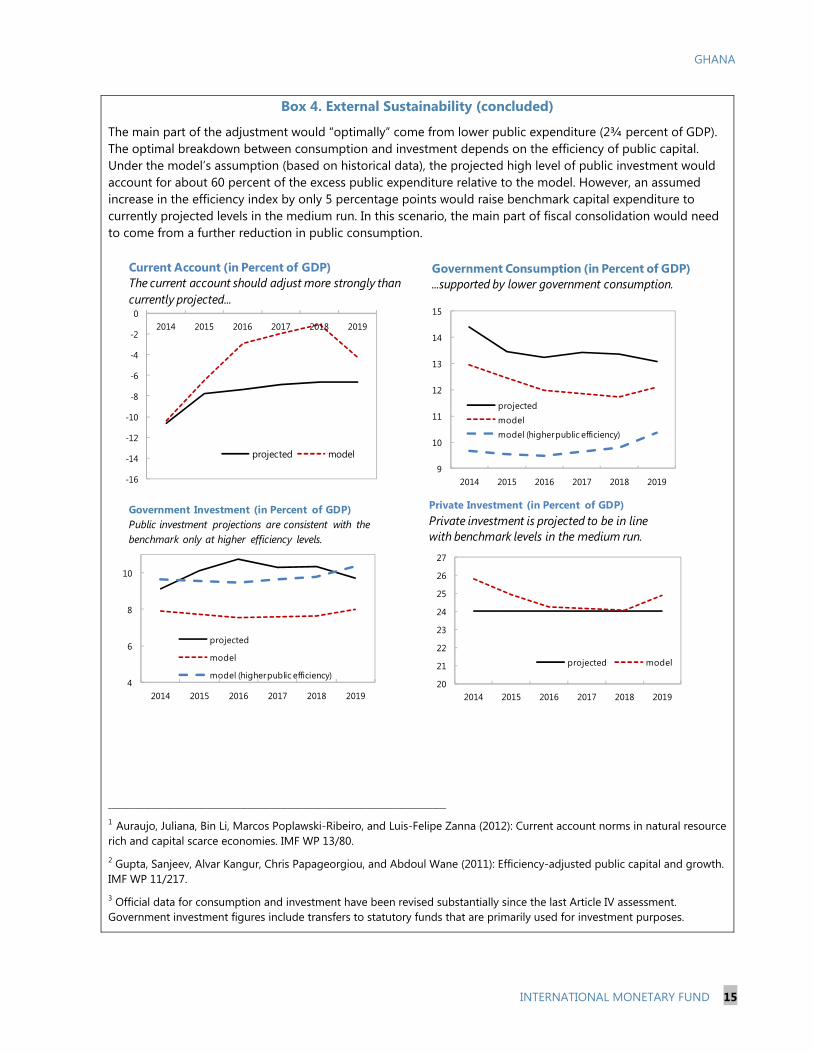
Box 4. External Sustainability (concluded)
The main part of the adjustment would “optimally” come from lower public expenditure (2¾ percent of GDP). The optimal breakdown between consumption and investment depends on the efficiency of public capital. Under the model’s assumption (based on historical data), the projected high level of public investment would account for about 60 percent of the excess public expenditure relative to the model. However, an assumed increase in the efficiency index by only 5 percentage points would raise benchmark capital expenditure to currently projected levels in the medium run. In this scenario, the main part of fiscal consolidation would need to come from a further reduction in public consumption.
______________________________________________________________________________________________________
1 Auraujo, Juliana, Bin Li, Marcos Poplawski-Ribeiro, and Luis-Felipe Zanna (2012): Current account norms in natural resource rich and capital scarce economies. IMF WP 13/80.
2 Gupta, Sanjeev, Alvar Kangur, Chris Papageorgiou, and Abdoul Wane (2011): Efficiency-adjusted public capital and growth. IMF WP 11/217. 3 Official data for consumption and investment have been revised substantially since the last Article IV assessment. Government investment figures include transfers to statutory funds that are primarily used for investment purposes.
9
10
11
12
13
14
15
2014 2015 2016 2017 2018 2019
projectedmodelmodel (higher public efficiency)
Government Consumption (in Percent of GDP)...supported by lower government consumption.
4
6
8
10
2014 2015 2016 2017 2018 2019
projected
model
model (higher public efficiency)
Government Investment (in Percent of GDP)Public investment projections are consistent with the benchmark only at higher efficiency levels.
-16
-14
-12
-10
-8
-6
-4
-2
02014 2015 2016 2017 2018 2019
projected model
Current Account (in Percent of GDP)The current account should adjust more strongly thancurrently projected...
20
21
22
23
24
25
26
27
2014 2015 2016 2017 2018 2019
projected model
Private Investment (in Percent of GDP)Private investment is projected to be in line with benchmark levels in the medium run.

GHANA
16 INTERNATIONAL MONETARY FUND
POLICIES TO SAFEGUARD STABILITY AND GROWTH
A. Fiscal Policy: Adjustment and Resilience
To restore confidence and build resilience, staff recommended a comprehensive policy package that (i) targets additional fiscal adjustment of about 1¾ percent of GDP in 2014, and (ii) entrenches the structural and legislative reforms that ensure more significant and durable consolidation over the medium term.
11. The authorities agreed with staff on the need to reduce the fiscal deficit, pointing to the significant measures already underway. They saw the current challenges as temporary, stressing that their measures will take some time to materialize fully and that their policies needed to be viewed in a medium-term context. In addition to regular adjustments of fuel and utility prices, budget measures include:
Revenue mobilization. The VAT rate was raised by 2.5 percentage points and coverage was broadened to previously exempted activities; an ad valorem tax on fuel was introduced; and taxes were raised on rent for non-residential accommodation, management and technical services fees, and free zone companies selling on the local market.
Wage bill control. Tight budget limits on the wage bill (proposed freeze on wage increases and net hiring in most sectors) are being complemented by a range of measures to improve monitoring and control, including an improved payroll database, audits, and the introduction of an electronic payment voucher system. The implementation of HRMIS (a comprehensive personnel data base) and its integration with GIFMIS, once completed, should greatly facilitate strategic HR management.
Prioritized capital spending. This is implemented through a moratorium on new contracts; alignment of investment programs of statutory funds with national priorities to avoid duplications; and the planned creation a Ghana Infrastructure Fund (GIF), to leverage private financing of infrastructure projects and improve their selection and implementation. The authorities took note of the mission’s advice to carefully assess fiscal risks arising from contingent liabilities and to reconsider a permanent earmarking of VAT revenue to the GIF.
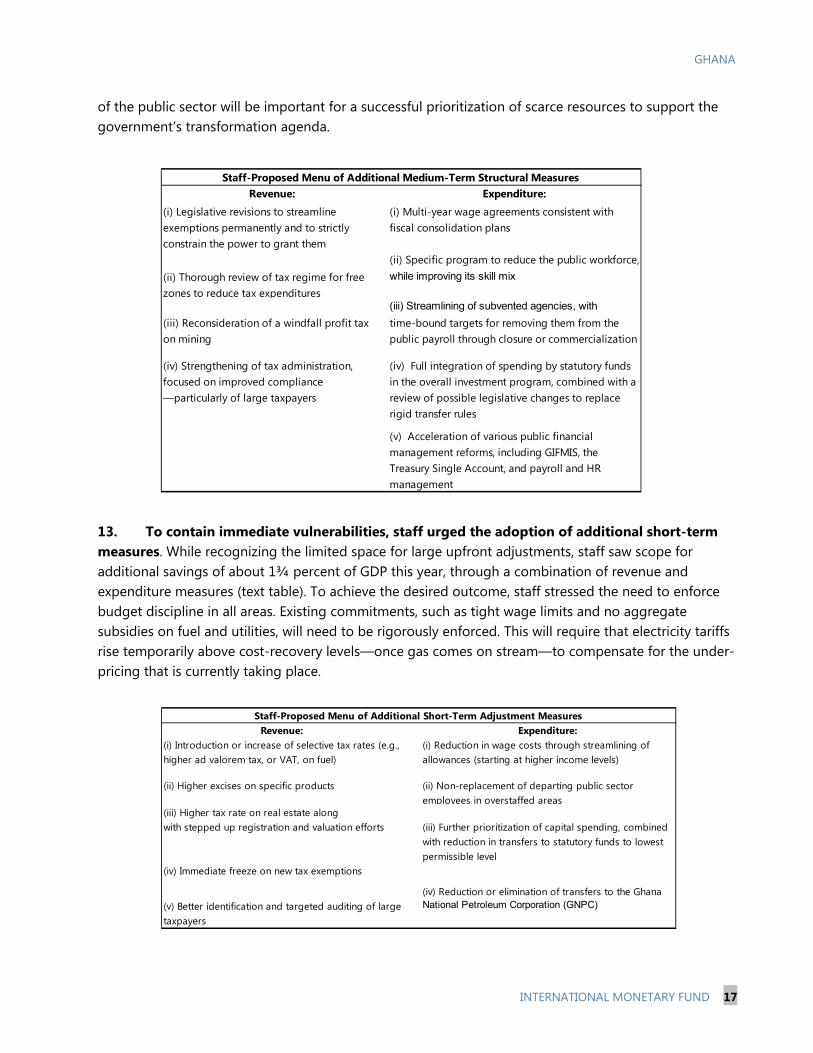
12. While agreeing with the thrust of these reforms, the mission argued for deeper irreversible reforms to entrench significant medium-term consolidation. A credible program for reducing the public wage bill, including streamlining of subvented agencies, will be key for addressing imbalances, restoring confidence, and creating fiscal space for priority spending. At the same time, public financial management reforms should be accelerated and combined with a relaxation of rigid earmarking of tax revenue. Staff also saw scope for raising revenue by reducing tax expenditure and increasing compliance, in line with the recommendations of recent Fund technical assistance missions. The mission identified a set of measures (text table) that should allow a larger deficit reduction, in line with staff’s proposed adjustment scenario (4½ percent of GDP deficit in 2016 and 1¾ percent in 2019). In addition, it stressed that increased transparency of revenue and expenditure allocations at all levels
GHANA
INTERNATIONAL MONETARY FUND 17
of the public sector will be important for a successful prioritization of scarce resources to support the government’s transformation agenda.
13. To contain immediate vulnerabilities, staff urged the adoption of additional short-term measures. While recognizing the limited space for large upfront adjustments, staff saw scope for additional savings of about 1¾ percent of GDP this year, through a combination of revenue and expenditure measures (text table). To achieve the desired outcome, staff stressed the need to enforce budget discipline in all areas. Existing commitments, such as tight wage limits and no aggregate subsidies on fuel and utilities, will need to be rigorously enforced. This will require that electricity tariffs rise temporarily above cost-recovery levels—once gas comes on stream—to compensate for the under-pricing that is currently taking place.
Revenue: Expenditure:(i) Introduction or increase of selective tax rates (e.g., higher ad valorem tax, or VAT, on fuel)
(i) Reduction in wage costs through streamlining of allowances (starting at higher income levels)
(ii) Higher excises on specific products (ii) Non-replacement of departing public sector employees in overstaffed areas
(iii) Higher tax rate on real estate along with stepped up registration and valuation efforts (iii) Further prioritization of capital spending, combined
with reduction in transfers to statutory funds to lowest permissible level
(iv) Reduction or elimination of transfers to the Ghana (v) Better identification and targeted auditing of large taxpayers
National Petroleum Corporation (GNPC)
Staff-Proposed Menu of Additional Short-Term Adjustment Measures
(iv) Immediate freeze on new tax exemptions
Revenue: Expenditure:
(i) Legislative revisions to streamline exemptions permanently and to strictly constrain the power to grant them
(i) Multi-year wage agreements consistent with fiscal consolidation plans
(ii) Specific program to reduce the public workforce, (ii) Thorough review of tax regime for free zones to reduce tax expenditures
while improving its skill mix
(iii) Streamlining of subvented agencies, with
(iii) Reconsideration of a windfall profit tax on mining
time-bound targets for removing them from the public payroll through closure or commercialization
(iv) Strengthening of tax administration, focused on improved compliance —particularly of large taxpayers
(iv) Full integration of spending by statutory funds in the overall investment program, combined with a review of possible legislative changes to replace rigid transfer rules
(v) Acceleration of various public financial management reforms, including GIFMIS, the Treasury Single Account, and payroll and HR management
Staff-Proposed Menu of Additional Medium-Term Structural Measures
GHANA
18 INTERNATIONAL MONETARY FUND
14. In early April, the government issued a policy statement to parliament, aimed at addressing the current economic challenges. Subsequently, it provided a more detailed report on its Economic and Financial Policies for the Medium Term to the Fund and other development partners. The policy document maintains the government’s fiscal targets, clarifies the 2014 budget measures, and outlines additional reforms to safeguard the medium-term consolidation path. The additional measures include intentions to rationalize the public service, restructure statutory funds to reduce budget rigidities, and enhance revenue administration through ongoing GRA reforms and a revision of tax laws.
15. Staff welcomes the government’s homegrown strategy to address the current macroeconomic imbalances. The policy documents provide a clear and comprehensive description of the government’s reform agenda, covering the key fiscal challenges. This is an important first step that now needs to be translated into specific, quantified, and time-bound actions, particularly with respect to the planned rationalization of the public service and tax policy measures. In light of Ghana’s significant fiscal and external imbalances, staff would strongly encourage the government to target a larger and more frontloaded fiscal consolidation.
B. Monetary Policy: Supporting Macroeconomic Stability
Staff supported the tightening of monetary policy. It expressed reservations about the effectiveness of recent foreign exchange regulations, and agreed with the BOG that these measures alone will not solve the underlying pressures in the foreign exchange market.
16. Staff supported the recent policy rate adjustment, anticipating that further tightening may be warranted in light of rising inflation and a depreciating currency. Second-round effects of large administered price increases and rising inflation expectations may call for further rate hikes to steer inflation back toward the end-year target band of 9.5+/-2 percent. A tight monetary policy stance will also support a smooth adjustment of the exchange rate, which should be allowed to adjust to prevent further erosion of an already low reserve buffer. To contain short-term pressures, staff advised the BOG to continue its efforts to lengthen the maturity structure of its existing swaps and bridging loans beyond the third quarter of 2014. Once external pressures subside, reserves should be rebuilt, and the volume of swaps should be reduced and limited to the management of seasonal balance of payments volatility.
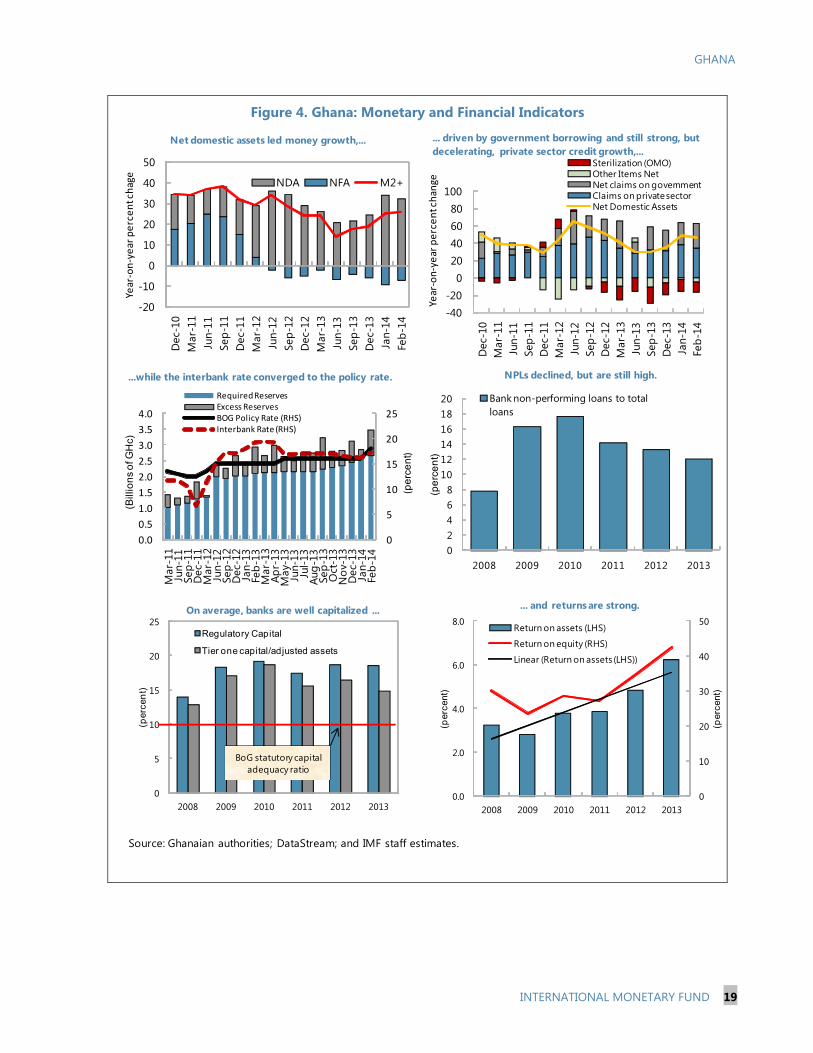
17. Staff welcomed improvements in monetary policy operations, while advocating against direct government financing and for more transparent foreign exchange operations. The BOG made progress in strengthening its liquidity management framework, evidenced by the convergence of the overnight interbank rate with the policy rate (Figure 4). Staff also commended the BOG for enhancing the use of its model-based inflation forecasting tool to support Monetary Policy Committee
GHANA
INTERNATIONAL MONETARY FUND 19
Figure 4. Ghana: Monetary and Financial Indicators
Source: Ghanaian authorities; DataStream; and IMF staff estimates.
0
5
10
15
20
25
2008 2009 2010 2011 2012 2013
(per
cen
t)
Regulatory Capital
Tier one capital/adjusted assets
On average, banks are well capitalized ...
BoG statutory capital adequacy ratio
0
10
20
30
40
50
0.0
2.0
4.0
6.0
8.0
2008 2009 2010 2011 2012 2013
(per
cent
)
(per
cent
)
Return on assets (LHS)
Return on equity (RHS)
Linear (Return on assets (LHS))
... and returns are strong.
02468
101214161820
2008 2009 2010 2011 2012 2013
(pe
rce
nt)
Bank non-performing loans to total loans
NPLs declined, but are still high.
0
5
10
15
20
25
0.0
0.5
1.0
1.5
2.0
2.5
3.0
3.5
4.0
Mar
-11
Jun-
11Se
p-11
Dec
-11
Mar
-12
Jun-
12Se
p-12
Dec
-12
Jan-
13Fe
b-13
Mar
-13
Apr-
13M
ay-1
3Ju
n-13
Jul-1
3Au
g-13
Sep-
13O
ct-1
3N
ov-1
3D
ec-1
3Ja
n-14
Feb-
14
(pe
rce
nt)
(Bill
ion
s o
f GH
c)
Required ReservesExcess ReservesBOG Policy Rate (RHS)Interbank Rate (RHS)
...while the interbank rate converged to the policy rate.
-20
-10
0
10
20
30
40
50D
ec-1
0M
ar-1
1Ju
n-11
Sep-
11D
ec-1
1M
ar-1
2Ju
n-12
Sep-
12D
ec-1
2M
ar-1
3Ju
n-13
Sep-
13D
ec-1
3Ja
n-14
Feb-
14
Year
-on
-ye
ar p
erc
en
t ch
age
NDA NFA M2+
Net domestic assets led money growth,...
-40-20
020406080
100
Dec
-10
Mar
-11
Jun-
11Se
p-11
Dec
-11
Mar
-12
Jun-
12Se
p-12
Dec
-12
Mar
-13
Jun-
13Se
p-13
Dec
-13
Jan-
14Fe
b-14
Year
-on
-ye
ar p
erc
en
t ch
ange
Sterilization (OMO)Other Items NetNet claims on governmentClaims on private sectorNet Domestic Assets
... driven by government borrowing and still strong, but decelerating, private sector credit growth,...

GHANA
20 INTERNATIONAL MONETARY FUND
decisions and for reducing the gap between its transaction and interbank exchange rate and shifting toward the latter for its own transactions.2 Staff suggested to:
Reduce direct government financing which amounted to 7½ percent of current-year revenue in 2013 (exceeding the BOG’s own target of 5 percent). Besides boosting liquidity, deficit financing raises concerns about fiscal dominance and the credibility of the inflation-targeting framework. The BOG agreed that it will be important to keep its deficit financing at, or below, the 5 percent target in 2014, which is comparable with provisions in other countries in the region.
Adopt a unified market-determined exchange rate: The current use of different exchange rates lacks transparency, can create distortions, and gives rise to a multiple-currency practice. Following the introduction of an electronic platform, the BOG is working with banks on establishing a system of more frequent adjustments in the interbank rate to better reflect market conditions. This should facilitate unification, while effective price discovery would be improved by allowing more foreign exchange transactions to pass through the market.
Increase the inflation target horizon: Replacing the end-year inflation target with a rolling target, set for a 1-2 year policy horizon, would further enhance the credibility of the IT framework. The BOG will consider this proposal.
18. Staff expressed reservations about some of the new foreign exchange regulations, aimed at curbing foreign currency shortages and dollarization. The new regulations reinforce preexisting requirements for the repatriation of export proceeds, ban foreign-currency denominated loans to non-foreign exchange earners, impose the creation of margin accounts for import bills, tighten operating procedures for forex bureaus, and circumscribe the use of foreign exchange held in foreign currency accounts. While noting that restrictions on foreign-currency loans have been adopted by many countries as a macro-prudential measure to contain exposures, staff recommended a review of all measures after an appropriate evaluation period to mitigate any unintended consequences, such as reduced foreign exchange inflows as a result of rising transaction costs.3 The BOG agreed with this proposal and with the need to address the root causes of current imbalances. Staff supported steps taken by the authorities to prevent the misuse of foreign exchange bureaus for money laundering, while arguing that de-dollarization is best achieved in a stable macroeconomic environment.
2 The BOG previously conducted all its transactions using the weighted average of reported bank-customer exchange rates of the previous day, after discretionary removal of outliers (transaction rate). It now uses the average interbank rate of the previous day for most of its own transactions. While this shift does not fully remove the existing multiple-currency practice, it is a step toward its elimination. 3 The ban on foreign-currency denominated loans to non-foreign exchange earners, which includes importers, constitutes the withdrawal of a normal, short-term banking and credit facility and gives rise to an exchange restriction. Another exchange restriction arises from the requirement for importers to submit to their commercial bank customs entry forms not yet submitted for any past foreign exchange transactions related to imports before foreign exchange may be transferred abroad for any further import transaction. The BOG assured staff that it will remove both restrictions following its planned review of the regulations in May.

GHANA
INTERNATIONAL MONETARY FUND 21
C. Financial Sector: Containing Exposure to Short-Term Risks
The financial sector is adequately capitalized and liquid, but increasing exposures will need to be monitored closely.
19. Stress tests conducted by the BOG based on end-2013 data point to adequate buffers in most banks and the system in aggregate. Only one bank would have negative capital under various stress tests, while about two-thirds of all banks (representing about two-thirds of total assets) would stay above the regulatory minimum capital requirement. Hence, potential recapitalization needs based on estimates of direct impact would likely be small, relative to GDP. On the funding side, conditions have remained stable, as banks rely mainly on domestic deposits as a steady financing source. Staff welcomed the authorities’ new stress-testing model, and encouraged developing it further and testing for a wider range of shocks, including scenarios with tail risk, to ascertain the robustness of the system.
20. Staff pointed to emerging vulnerabilities that may not be fully captured in the stress test and, if compounded, could pose challenges to the system. Asset quality is likely to decline if macroeconomic imbalances persist and the economy slows down, while banks’ significant holdings of government securities expose them to interest rate and sovereign risks. Most strikingly, bank’s (mainly short-term) foreign borrowing has more than tripled in 2013. Much of the borrowing originates from parent institutions, and the associated foreign exchange risk is in large part covered by swap contracts with the BOG. Banks’ direct exposure to foreign-exchange risk was curtailed in April by a reduction in net open position limits to 5 percent of capital for single currency and 10 percent for aggregate exposure, while the BOG’s recent ban on on-lending to non-foreign exchange earners should contain indirect exposures.
21. The mission advised the authorities to strengthen their crisis prevention and management capabilities. Stronger off-site supervision capabilities to complement on-site inspections are an effective way to identify major build-up of risks. Communication with banks—especially on emergency liquidity provision and modalities of BOG or government support—could also be improved. Staff further encouraged the BOG to conduct contingency planning and crisis simulation exercises to help identify gaps in the framework. Expedited completion and adoption of new banking sector legislation, drafted
-1,000
-500
0
500
1,000
1,500
2,000
2,500
3,000
3,500
4,000
Jan:
201
1
Mar
: 201
1
May
: 201
1
Jul:
2011
Sep:
201
1
Nov
: 201
1
Jan:
201
2
Mar
: 201
2
May
: 201
2
Jul:
2012
Sep:
201
2
Nov
: 201
2
Jan:
201
3
Mar
: 201
3
May
: 201
3
Jul:
2013
Sept
: 201
3
Nov
: 201
3
Jan:
201
4
Net Foreign Assets Balances w banks abroadForeign currency OtherForeign Liabilities
Commercial Banks Foreign Assets and Liabilities(million GHc)
Sources: BOG
Weighted
average
CAR
Number
of banks
below
statutory
CAR
Number
of banks
with
negative
CAR
Baseline 18.5 0 0
Credit Risk—Deterioration of loan quality 1/ 15.4 4 0
Credit Risk—Concentration (Failure of the largest borrower) 12.9 5 1
Exchange rate shock (51.2 percent depreciation of cedi) 18.4 0 0
Interest rate shock (Increase in 91 day T-bill rate to 38.4 percent) 12 6 1
Multi-factor shock: Exchange rate depreciation and credit risk 12 8 0
1/ Assumes a migration/reclassification of 17 percent of all loans to a riskier category. Source: Bank of Ghana
Summary of Selected Stress Test Results
GHANA
22 INTERNATIONAL MONETARY FUND
with extensive IMF technical assistance, will be important to clarify and enhance the BOG’s powers with respect to consolidated and cross-border supervision, as well as crisis management and resolution. A deposit insurance act, recommended in the 2011 FSAP Update, is expected to be submitted to parliament this year.
STAFF APPRAISAL 22. Short-term vulnerabilities have risen significantly amid high fiscal and current account deficits. The international reserve position has weakened alongside mounting public debt. High interest rates and a depreciating currency have begun to depress private sector activity, and spreads on Ghana’s Eurobonds have risen above those of regional peers.
23. Additional measures are required to contain short-term risks and safeguard the government’s transformation agenda. Despite significant policy efforts, the 2014 fiscal deficit of 8½ percent of GDP is unlikely to be met in the absence of further measures. Staff welcomes the authorities’ recent policy documents. They now need to be complemented by additional short-term measures to contain the 2014 deficit and by specific action plans to entrench significant and durable consolidation over the medium term. Swift implementation of a strong package of policy measures is needed to restore confidence in the government’s ability to address large imbalances and to provide the needed space for infrastructure and social priority spending.
24. The case for stronger consolidation is supported by staff’s external stability assessment and debt sustainability analysis. The medium-term analysis suggests that Ghana’s real effective exchange would be modestly overvalued without further adjustment. A model-based approach confirms that the main part of the adjustment should come from lower public expenditure. Further delays in fiscal consolidation would keep public debt and debt service at uncomfortably high levels.
25. Further monetary policy tightening may be needed to tame inflationary pressures. Faced with second-round effects of large administered price increases and a depreciating currency, the recent hike in the policy rate and the subsequent tightening of reserve requirements may not be sufficient to steer inflation back into the target range. The BOG should continue to manage liquidity tightly and refrain from direct financing of the fiscal deficit. The exchange rate should be allowed to adjust to prevent further erosion of an already low reserve buffer, and the authorities need to begin rebuilding the buffer as market conditions permit.
26. The new foreign exchange regulations will not be effective, unless the underlying macroeconomic imbalances are resolved. The BOG’s agreement to review these measures with the objective of mitigating any unintended consequences and removing the exchange restrictions is welcome. As the restrictions are not imposed for balance of payments reasons, staff does not recommend their approval. In preparing to move to a fully market-determined exchange rate system, the BOG should allow more foreign exchange transactions to pass through the market.
GHANA
INTERNATIONAL MONETARY FUND 23
27. The financial sector is adequately capitalized and liquid, but increasing exposures will need to be monitored closely. Stress tests conducted by the BOG suggest that buffers are adequate in most banks and the system in aggregate. Nevertheless, the weaker macroeconomic outlook and currency depreciation expose the financial sector to currency and credit risks, warranting a strengthening of crisis prevention and management capabilities.
28. Data provision, while broadly adequate for standard surveillance, should be strengthened. In current circumstances, effective surveillance warrants a more timely provision of critical high-frequency data to monitor risks.
29. It is recommended that the next Article IV Consultation be held on the regular twelve-month cycle.

GHANA
24 INTERNATIONAL MONETARY FUND
2014 2015 2016 2017 2018 2019
Prel.
(Annual percentage change; unless otherwise indicated)
National account and pricesGDP at constant prices 7.9 5.4 4.8 5.4 8.1 7.5 6.8 3.8Real GDP (nonoil) 7.8 3.9 4.5 5.2 6.6 6.7 6.2 5.6Real GDP per capita 5.2 2.8 2.2 2.8 5.4 4.8 4.1 1.2GDP deflator 13.3 12.3 13.1 11.2 9.4 9.4 9.3 9.0Consumer price index (annual average) 9.2 11.7 13.0 11.1 9.5 9.0 8.5 8.1Consumer price index (end of period) 8.8 13.5 12.3 9.8 9.2 8.8 8.2 8.0Consumer price index (excl. food, annual average) 11.6 18.1 12.1 8.6 7.6 8.3 8.1 7.9
Money and creditCredit to the private sector 32.9 29.0 16.9 20.1 21.7 22.8 23.2 23.9Broad money (M2+) 24.3 19.1 20.4 20.6 16.9 17.4 16.9 19.9Velocity (non-oil GDP/M2, end of period) 3.9 3.9 3.8 3.7 3.7 3.7 3.7 3.7Base money 36.0 15.1 17.9 17.8 17.5 18.2 17.4 17.4Banks' lending rate (weighted average; percent) 25.7 25.6 … … … … … …Policy rate (in percent, end of period) 15.0 16.0 … … … … … …
National accountsGross capital formation 29.0 33.4 33.1 34.1 34.8 34.3 34.3 33.7
Government 6.8 6.4 9.1 10.1 10.8 10.3 10.3 9.7Private 22.2 27.0 24.0 24.0 24.0 24.0 24.0 24.0
National savings 26.2 20.2 22.9 26.4 27.4 27.4 27.6 27.0Government 2.9 1.5 3.6 4.4 5.1 7.4 8.2 8.1Private1 23.3 18.8 19.3 21.9 22.2 20.0 19.5 18.9
Foreign savings -12.2 -13.2 -10.6 -7.8 -7.4 -6.9 -6.7 -6.7
External sectorCurrent account balance -12.2 -13.2 -10.6 -7.8 -7.4 -6.9 -6.7 -6.7
(including official grants) -12.2 -13.2 -10.6 -7.8 -7.4 -6.9 -6.7 -6.7(excluding official grants) -12.8 -13.4 -11.0 -7.8 -7.5 -6.9 -6.7 -6.7
External public debt (including IMF) 22.6 25.6 32.3 33.8 35.9 35.7 35.4 34.9NPV of external debt outstanding 10.2 9.1 10.1 13.5 17.6 19.9 22.0 23.2
percent of exports of goods and services 24.4 25.0 24.0 31.5 38.4 43.4 48.6 54.4Gross international reserves (millions of US$) 5,349 5,632 4,706 5,478 6,912 8,642 9,989 10,261
Months of prospective imports of goods and services 2.9 3.2 2.7 2.8 3.3 3.8 4.3 4.1Total donor support (millions of US$) 1,132 940 1,110 1,535 1,614 1,171 1,130 1,032
percent of GDP 2.8 2.1 2.9 3.8 3.8 2.5 2.1 1.8
Central government budgetRevenue 19.1 18.0 20.8 20.8 21.0 23.4 24.0 23.9Expenditure 31.0 29.0 31.1 30.1 28.7 28.7 28.6 28.2Overall balance -12.0 -10.9 -10.2 -9.2 -7.6 -5.3 -4.6 -4.3Net domestic financing 9.5 7.2 7.3 6.6 4.0 1.0 1.6 2.3Central government debt (gross) 51.2 57.4 64.2 67.2 68.1 63.9 60.9 59.6
Domestic debt 28.6 31.7 31.9 33.4 32.2 28.1 25.5 24.7External debt 22.6 25.6 32.3 33.8 35.9 35.7 35.4 34.9
Central government debt (net) 49.1 54.8 61.9 65.1 66.2 61.1 57.1 55.1
Memorandum items:
Nominal GDP (millions of GHc) 73,109 86,596 102,631 120,277 142,273 167,258 195,154 220,870GDP per capita (U.S. dollars) 1,622 1,730 1,486 1,509 1,551 1,681 1,816 1,908
Sources: Ghanaian authorities; and Fund staff estimates and projections.1 Including public enterprises and errors and omissions.
Table 1. Ghana: Selected Economic and Financial Indicators, 2012–19
(Percent of GDP)
(Percent of GDP)
2012
Proj.
2013

GHANA
INTERNATIONAL MONETARY FUND 25
2012 2013 2014 2015 2016 2017 2018 2019
Proj. Proj. Proj. Proj. Proj. Proj. Proj.
Revenue 19.1 18.0 20.8 20.8 21.0 23.4 24.0 23.4Taxes 15.8 15.3 17.8 17.7 18.1 20.3 21.1 21.0
Direct taxes 7.6 7.3 8.6 8.5 8.9 11.0 11.6 11.1 Personal income tax 3.0 2.7 3.1 3.1 3.0 3.0 3.0 3.4
Self-employed tax 0.2 0.2 0.2 0.2 0.2 0.2 0.2 0.2Corporate tax 3.2 2.7 3.4 3.3 3.7 3.7 3.7 3.7Oil sector 0.0 0.5 0.5 0.5 0.6 2.6 3.0 2.4Other direct taxes 1.1 1.2 1.4 1.4 1.4 1.4 1.6 1.3
of which: oil royalties 0.4 0.4 0.4 0.4 0.4 0.4 0.7 0.5 Indirect taxes 5.5 5.4 6.2 6.2 6.4 6.5 6.5 6.8
Excises 1.0 0.8 1.1 1.2 1.4 1.4 1.4 1.4VAT 3.6 3.6 4.1 4.1 3.9 4.0 4.1 4.3Communications service tax 0.2 0.2 0.2 0.2 0.2 0.2 0.2 0.2Social Contributions National Health Insurance 0.8 0.7 0.7 0.7 0.9 0.9 0.9 0.9
Trade taxes 2.7 2.7 3.0 2.9 2.9 2.9 2.9 3.1Other tax revenues 0.2 0.2 0.2 0.2 0.2 0.2 0.2 0.2
Other revenue 1.5 2.0 1.5 1.6 1.6 2.0 2.0 1.7Grants 1.6 0.5 1.3 1.3 1.1 0.9 0.8 0.6
Project grants 0.7 0.1 0.9 1.3 1.0 0.9 0.8 0.6 Program grants 0.7 0.2 0.4 0.1 0.1 0.1 0.0 0.0 HIPC Assistance 0.1 0.2 0.0 0.0 0.0 0.0 0.0 0.0 MDRI 0.1 0.1 0.0 0.0 0.0 0.0 0.0 0.0
Expenditure 31.0 29.0 31.1 30.1 28.7 28.7 28.6 27.7Expense 25.2 24.0 24.5 22.5 20.5 21.7 21.9 21.9
Compensation of employees 12.4 11.9 10.9 9.5 9.5 9.7 9.6 9.6 Wages and salaries1 9.1 9.6 8.7 8.1 8.0 8.1 8.1 8.1 Deferred wage payments 2.6 1.0 0.5 0.0 0.0 0.0 0.0 0.0
Social Contributions 0.7 1.3 1.6 1.5 1.5 1.6 1.5 1.5 Purchases of goods and services 1.8 1.1 1.5 1.5 1.6 1.8 1.9 1.9 Interest 3.3 5.1 6.4 6.0 5.7 5.9 5.8 5.3 Domestic 2.6 4.4 5.5 5.2 4.6 4.5 4.0 3.6
Foreign 0.8 0.7 1.0 0.8 1.1 1.4 1.7 1.8Subsidies 1.1 1.3 0.1 0.1 0.1 0.0 0.1 0.0Grants to Other Government Units 2.7 2.3 3.4 3.5 3.6 4.2 4.7 4.9
Other expense2 3.9 2.3 2.2 1.9 0.0 0.0 0.0 0.0Net acquisition of nonfinancial assets 4.9 5.0 6.5 7.6 8.2 7.1 6.7 5.9
Domestic financing 1.4 1.9 1.4 1.5 1.3 1.1 1.2 1.4 Foreign financing 3.5 3.1 5.1 6.1 6.9 5.9 5.6 4.5
Discrepancy 0.9 0.0 0.0 0.0 0.0 0.0 0.0 0.0Net lending / borrowing (overall balance) -12.0 -10.9 -10.2 -9.2 -7.6 -5.3 -4.6 -4.3
Net financial transactions -12.0 -10.9 -10.2 -9.2 -7.6 -5.3 -4.6 -4.3 Net acquisition of financial assets -1.1 0.8 0.5 0.0 0.0 0.0 0.9 1.1 Net incurrence of liabilities 10.9 11.7 10.8 9.2 7.6 5.3 5.6 5.4 Domestic 8.5 8.0 7.9 6.7 4.0 1.1 2.6 3.5 Foreign 2.4 3.7 2.9 2.6 3.6 4.2 3.0 1.9Memorandum items: Nominal GDP (millions of GHc) 73,109 86,596 102,631 120,277 142,273 167,258 195,154 220,870Sources: Ghanaian authorities; and IMF staff estimates and projections.1 Excludes deferred wage payments which are reported on an independent line.2 Includes payments of cash arrears and promisory notes to statutory funds.
(In percent of GDP)
Table 2A. Ghana: Summary of Budgetary Central Government Operations, 2012–19 (GFS 2001, Cash Basis)

GHANA
26 INTERNATIONAL MONETARY FUND
2012 2013 2014 2015 2016 2017 2018 2019Proj. Proj. Proj. Proj. Proj. Proj. Proj.
Revenue 13,935 15,630 21,369 25,074 29,922 39,194 46,879 51,772Taxes 11,575 13,284 18,271 21,300 25,803 33,999 41,155 46,342
Direct taxes 5,536 6,302 8,872 10,257 12,651 18,350 22,687 24,478 Personal income tax 2,204 2,367 3,198 3,685 4,281 5,063 5,948 7,590
Self-employed tax 164 182 211 243 283 334 393 465Corporate tax 2,362 2,316 3,480 4,010 5,320 6,254 7,297 8,259Oil sector 0 419 560 615 810 4,426 5,886 5,225Other direct taxes 806 1,018 1,422 1,705 1,957 2,272 3,163 2,940
of which: oil royalties 270 339 366 513 623 664 1,290 1,150 Indirect taxes 4,048 4,651 6,350 7,511 9,049 10,797 12,767 15,115
Excises 730 694 1,154 1,471 1,934 2,288 2,688 3,182VAT 2,614 3,135 4,257 4,874 5,601 6,720 7,977 9,444Communications service tax 128 174 207 267 276 327 384 455Social Contributions National Health Insurance 576 648 732 900 1,237 1,463 1,718 2,034
Trade taxes 1,990 2,331 3,049 3,531 4,103 4,852 5,701 6,749Social Contributions 138 159 154 192 223 264 310 367Other revenue 1,062 1,749 1,589 1,971 2,319 3,342 3,820 3,703Grants 1,160 438 1,354 1,611 1,577 1,589 1,594 1,360
Expenditure 22,675 25,084 31,888 36,183 40,774 48,069 55,891 61,283Expense 18,418 20,793 25,180 27,052 29,116 36,220 42,797 48,295
Compensation of employees 9,050 10,312 11,159 11,459 13,492 16,222 18,661 21,213 Wages and salaries1 6,666 8,334 8,968 9,697 11,417 13,561 15,808 17,891 Deferred wages 1,872 846 562 0 0 0 0 0
Social Contributions 512 1,132 1,629 1,762 2,075 2,662 2,853 3,322 Purchases of goods and services 1,322 938 1,530 1,762 2,243 2,947 3,635 4,263 Interest 2,436 4,397 6,604 7,273 8,145 9,893 11,229 11,812 Domestic 1,880 3,788 5,628 6,304 6,601 7,477 7,865 7,932
Foreign 556 609 976 969 1,544 2,416 3,364 3,880Subsidies 809 1,159 99 107 119 76 185 93Grants to Other Government Units 1,974 2,032 3,535 4,150 5,118 7,082 9,088 10,915
Other expense2 2,827 1,955 2,254 2,302 0 0 0 0Net acquisition of nonfinancial assets 3,584 4,303 6,708 9,131 11,658 11,849 13,093 12,988
Domestic financing 1,050 1,646 1,442 1,823 1,869 1,915 2,250 3,112 Foreign financing 2,535 2,657 5,266 7,308 9,789 9,933 10,843 9,876
Discrepancy 672 -11 0 0 0 0 0 0Net lending / borrowing (overall balance) -8,740 -9,455 -10,519 -11,109 -10,852 -8,875 -9,011 -9,510
Net financial transactions -8,740 -9,455 -10,519 -11,109 -10,852 -8,875 -9,011 -9,510 Net acquisition of financial assets -781 678 564 3 16 47 1,822 2,514 Net incurrence of liabilities 7,959 10,133 11,083 11,112 10,869 8,923 10,834 12,025 Domestic 6,186 6,921 8,135 8,019 5,754 1,877 5,060 7,786 Foreign 1,773 3,212 2,949 3,093 5,114 7,045 5,774 4,238
Memorandum items: Nominal GDP (millions of GHc) 73,109 86,596 102,631 120,277 142,273 167,258 195,154 220,870
Sources: Ghanaian authorities; and IMF staff estimates and projections.1 Excludes deferred wage payments which are reported on an independent line.2 Includes payments of cash arrears and promisory notes to statutory funds.
(Millions of GHc, unless otherwise specified)
Table 2B. Ghana: Summary of Budgetary Central Government Operations, 2012–19 (GFS 2001, Cash Basis)
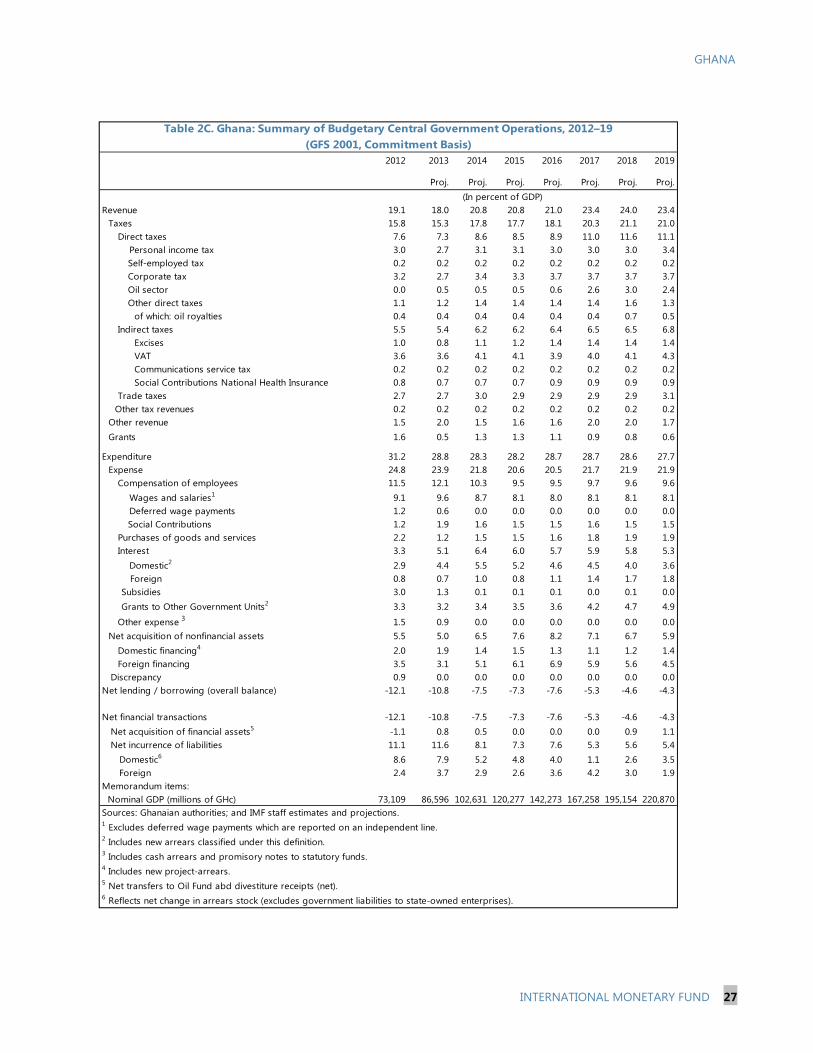
GHANA
INTERNATIONAL MONETARY FUND 27
2012 2013 2014 2015 2016 2017 2018 2019
Proj. Proj. Proj. Proj. Proj. Proj. Proj.
Revenue 19.1 18.0 20.8 20.8 21.0 23.4 24.0 23.4Taxes 15.8 15.3 17.8 17.7 18.1 20.3 21.1 21.0
Direct taxes 7.6 7.3 8.6 8.5 8.9 11.0 11.6 11.1 Personal income tax 3.0 2.7 3.1 3.1 3.0 3.0 3.0 3.4
Self-employed tax 0.2 0.2 0.2 0.2 0.2 0.2 0.2 0.2Corporate tax 3.2 2.7 3.4 3.3 3.7 3.7 3.7 3.7Oil sector 0.0 0.5 0.5 0.5 0.6 2.6 3.0 2.4Other direct taxes 1.1 1.2 1.4 1.4 1.4 1.4 1.6 1.3
of which: oil royalties 0.4 0.4 0.4 0.4 0.4 0.4 0.7 0.5 Indirect taxes 5.5 5.4 6.2 6.2 6.4 6.5 6.5 6.8
Excises 1.0 0.8 1.1 1.2 1.4 1.4 1.4 1.4VAT 3.6 3.6 4.1 4.1 3.9 4.0 4.1 4.3Communications service tax 0.2 0.2 0.2 0.2 0.2 0.2 0.2 0.2Social Contributions National Health Insurance 0.8 0.7 0.7 0.7 0.9 0.9 0.9 0.9
Trade taxes 2.7 2.7 3.0 2.9 2.9 2.9 2.9 3.1Other tax revenues 0.2 0.2 0.2 0.2 0.2 0.2 0.2 0.2
Other revenue 1.5 2.0 1.5 1.6 1.6 2.0 2.0 1.7Grants 1.6 0.5 1.3 1.3 1.1 0.9 0.8 0.6
Expenditure 31.2 28.8 28.3 28.2 28.7 28.7 28.6 27.7Expense 24.8 23.9 21.8 20.6 20.5 21.7 21.9 21.9
Compensation of employees 11.5 12.1 10.3 9.5 9.5 9.7 9.6 9.6 Wages and salaries1 9.1 9.6 8.7 8.1 8.0 8.1 8.1 8.1 Deferred wage payments 1.2 0.6 0.0 0.0 0.0 0.0 0.0 0.0
Social Contributions 1.2 1.9 1.6 1.5 1.5 1.6 1.5 1.5 Purchases of goods and services 2.2 1.2 1.5 1.5 1.6 1.8 1.9 1.9 Interest 3.3 5.1 6.4 6.0 5.7 5.9 5.8 5.3 Domestic2 2.9 4.4 5.5 5.2 4.6 4.5 4.0 3.6
Foreign 0.8 0.7 1.0 0.8 1.1 1.4 1.7 1.8Subsidies 3.0 1.3 0.1 0.1 0.1 0.0 0.1 0.0Grants to Other Government Units2 3.3 3.2 3.4 3.5 3.6 4.2 4.7 4.9
Other expense 3 1.5 0.9 0.0 0.0 0.0 0.0 0.0 0.0Net acquisition of nonfinancial assets 5.5 5.0 6.5 7.6 8.2 7.1 6.7 5.9
Domestic financing4 2.0 1.9 1.4 1.5 1.3 1.1 1.2 1.4 Foreign financing 3.5 3.1 5.1 6.1 6.9 5.9 5.6 4.5
Discrepancy 0.9 0.0 0.0 0.0 0.0 0.0 0.0 0.0Net lending / borrowing (overall balance) -12.1 -10.8 -7.5 -7.3 -7.6 -5.3 -4.6 -4.3
Net financial transactions -12.1 -10.8 -7.5 -7.3 -7.6 -5.3 -4.6 -4.3 Net acquisition of financial assets5 -1.1 0.8 0.5 0.0 0.0 0.0 0.9 1.1 Net incurrence of liabilities 11.1 11.6 8.1 7.3 7.6 5.3 5.6 5.4 Domestic6 8.6 7.9 5.2 4.8 4.0 1.1 2.6 3.5 Foreign 2.4 3.7 2.9 2.6 3.6 4.2 3.0 1.9Memorandum items: Nominal GDP (millions of GHc) 73,109 86,596 102,631 120,277 142,273 167,258 195,154 220,870Sources: Ghanaian authorities; and IMF staff estimates and projections.1 Excludes deferred wage payments which are reported on an independent line.2 Includes new arrears classified under this definition.3 Includes cash arrears and promisory notes to statutory funds.4 Includes new project-arrears.5 Net transfers to Oil Fund abd divestiture receipts (net).6 Reflects net change in arrears stock (excludes government liabilities to state-owned enterprises).
(In percent of GDP)
Table 2C. Ghana: Summary of Budgetary Central Government Operations, 2012–19(GFS 2001, Commitment Basis)

GHANA
28 INTERNATIONAL MONETARY FUND
2012 2013 2014 2015 2016 2017 2018 2019Proj. Proj. Proj. Proj. Proj. Proj. Proj.
Revenue 13,935 15,630 21,369 25,074 29,922 39,194 46,879 51,772Taxes 11,575 13,284 18,271 21,300 25,803 33,999 41,155 46,342
Direct taxes 5,536 6,302 8,872 10,257 12,651 18,350 22,687 24,478 Personal income tax 2,204 2,367 3,198 3,685 4,281 5,063 5,948 7,590
Self-employed tax 164 182 211 243 283 334 393 465Corporate tax 2,362 2,316 3,480 4,010 5,320 6,254 7,297 8,259Oil sector 0 419 560 615 810 4,426 5,886 5,225Other direct taxes 806 1,018 1,422 1,705 1,957 2,272 3,163 2,940
of which: oil royalties 270 339 366 513 623 664 1,290 1,150 Indirect taxes 4,048 4,651 6,350 7,511 9,049 10,797 12,767 15,115
Excises 730 694 1,154 1,471 1,934 2,288 2,688 3,182VAT 2,614 3,135 4,257 4,874 5,601 6,720 7,977 9,444Communications service tax 128 174 207 267 276 327 384 455Social Contributions National Health Insurance 576 648 732 900 1,237 1,463 1,718 2,034
Trade taxes 1,990 2,331 3,049 3,531 4,103 4,852 5,701 6,749Social Contributions 138 159 154 192 223 264 310 367Other revenue 1,062 1,749 1,589 1,971 2,319 3,342 3,820 3,703Grants 1,160 438 1,354 1,611 1,577 1,589 1,594 1,360
Expenditure 22,799 24,969 29,072 33,881 40,774 48,069 55,891 61,283Expense 18,102 20,678 22,364 24,751 29,116 36,220 42,797 48,295
Compensation of employees 8,387 10,512 10,597 11,459 13,492 16,222 18,661 21,213 Wages and salaries1 6,666 8,334 8,968 9,697 11,417 13,561 15,808 17,891 Deferred wages 846 562 0 0 0 0 0 0
Social Contributions 876 1,616 1,629 1,762 2,075 2,662 2,853 3,322 Purchases of goods and services 1,592 1,019 1,530 1,762 2,243 2,947 3,635 4,263 Interest 2,436 4,397 6,604 7,273 8,145 9,893 11,229 11,812 Domestic2 2,103 3,788 5,628 6,304 6,601 7,477 7,865 7,932
Foreign 556 609 976 969 1,544 2,416 3,364 3,880Subsidies2 2,185 1,159 99 107 119 76 185 93Grants to Other Government Units2 2,428 2,793 3,535 4,150 5,118 7,082 9,088 10,915
Other expense3 1,072 798 0 0 0 0 0 0Net acquisition of nonfinancial assets 4,025 4,303 6,708 9,131 11,658 11,849 13,093 12,988
Domestic financing4 1,491 1,646 1,442 1,823 1,869 1,915 2,250 3,112 Foreign financing 2,535 2,657 5,266 7,308 9,789 9,933 10,843 9,876
Discrepancy 672 -11 0 0 0 0 0 0Net lending / borrowing (overall balance) -8,864 -9,339 -7,703 -8,807 -10,852 -8,875 -9,011 -9,510
Net financial transactions -8,864 -9,339 -7,703 -8,807 -10,852 -8,875 -9,011 -9,510 Net acquisition of financial assets5 -781 678 564 3 16 47 1,822 2,514 Net incurrence of liabilities 8,083 10,017 8,267 8,810 10,869 8,923 10,834 12,025 Domestic6 6,310 6,805 5,318 5,717 5,754 1,877 5,060 7,786 Foreign 1,773 3,212 2,949 3,093 5,114 7,045 5,774 4,238
Memorandum items: Nominal GDP (millions of GHc) 73,109 86,596 102,631 120,277 142,273 167,258 195,154 220,870Sources: Ghanaian authorities; and IMF staff estimates and projections.1 Excludes deferred wage payments which are reported on an independent line.2 Includes new arrears classified under this definition.3 Includes cash arrears and promisory notes to statutory funds.4 Includes new project-arrears.5 Net transfers to Oil Fund abd divestiture receipts (net).6 Reflects net change in arrears stock (excludes government liabilities to state-owned enterprises).
(Millions of GHc, unless otherwise specified)
Table 2D. Ghana: Summary of Budgetary Central Government Operations, 2012–19 (GFS 2001, Commitment Basis)

GHANA
INTERNATIONAL MONETARY FUND 29
2013 2014Prel. Proj.
Net foreign assets 7,880 6,953 5,700 6,531
Net Domestic Assets 10,315 15,667 21,237 25,906 Domestic Claims 15,665 22,662 31,269 36,775 Net Claims on Central Government 5,181 7,716 11,327 13,933 Claims on Other Sectors 10,485 14,945 19,942 22,842 Claims on Public Non-financial Corporations 1,342 2,719 2,206 2,446 Claims on Private Sector 9,150 12,161 15,689 18,348 Other -7 65 2,047 2,047 Other Items (Net) -5,350 -6,995 -10,032 -10,869
Money and quasi-money (M3) 18,195 22,620 26,937 32,437Broad money (M2) 14,241 17,503 20,692 24,407Foreign exchange deposits 3,954 5,117 6,245 8,030
Net foreign assets 6,670 5,781 5,973 4,435
Net domestic assets -890 2,079 3,078 6,238 Net Domestic Claims 287 5,252 6,602 10,500
Claims on Other Depository Corporations -2,299 -694 -1,683 487 Net Claims on Central Government 1,943 4,140 5,306 7,033
Claims on Other Sectors2 643 1,806 2,979 2,979Other Items (Net)3 -1,177 -3,172 -3,524 -4,261
Base money 4 5,780 7,860 9,051 10,674Currency In Circulation (net of cash in vaults) 3,763 4,919 5,500 5,959Currency in Banks (Cash in Vault) 481 637 698 822
Bank Deposits in BOG 5 1,359 2,030 2,430 3,469 Required Reserves 927 1,108 1,329 1,622 Excess Reserves 432 922 1,100 1,847Liabilities To Other Sectors 176 275 424 424
Memorandum items:
Base money 31.1 36.0 15.1 17.9
M2+ 6 29.3 22.9 18.2 18.0Credit to the private sector 29.0 32.9 29.0 16.9M2-to-GDP ratio (in percent) 30.4 23.9 23.9 23.8Base money multiplier (M2/base money) 2.5 2.2 2.3 2.3Credit to the private sector (in percent of GDP) 15.3 16.6 18.1 17.9
Sources: Ghanaian authorities; and Fund staff estimates and projections.1 End of period.2 Include public enterprises and the local government.3 Including valuation.4 Bank of Ghana's Base Money definition, does not include foreign currency deposits.5 Does not include foreign currency deposits.6 Includes foreign currency deposits.
(In 12-month percentage change; unless otherwise indicated)
II. Central Bank
(In millions of GHc, unless otherwise indicated)
I. Depository Corporation Survey
Table 3. Ghana: Monetary Survey, 2011–141
2011 2012
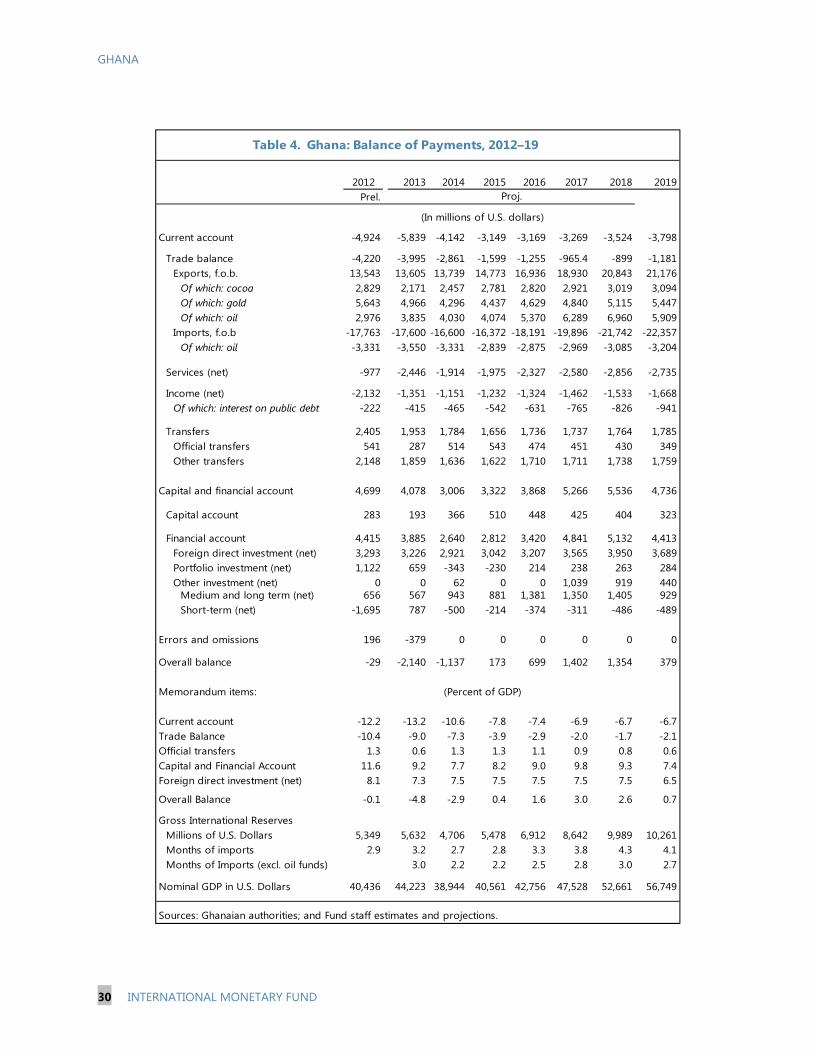
GHANA
30 INTERNATIONAL MONETARY FUND
2013 2014 2015 2016 2017 2018 2019Prel.
Current account -4,924 -5,839 -4,142 -3,149 -3,169 -3,269 -3,524 -3,798
Trade balance -4,220 -3,995 -2,861 -1,599 -1,255 -965.4 -899 -1,181Exports, f.o.b. 13,543 13,605 13,739 14,773 16,936 18,930 20,843 21,176
Of which: cocoa 2,829 2,171 2,457 2,781 2,820 2,921 3,019 3,094Of which: gold 5,643 4,966 4,296 4,437 4,629 4,840 5,115 5,447Of which: oil 2,976 3,835 4,030 4,074 5,370 6,289 6,960 5,909
Imports, f.o.b -17,763 -17,600 -16,600 -16,372 -18,191 -19,896 -21,742 -22,357Of which: oil -3,331 -3,550 -3,331 -2,839 -2,875 -2,969 -3,085 -3,204
Services (net) -977 -2,446 -1,914 -1,975 -2,327 -2,580 -2,856 -2,735 Income (net) -2,132 -1,351 -1,151 -1,232 -1,324 -1,462 -1,533 -1,668
Of which: interest on public debt -222 -415 -465 -542 -631 -765 -826 -941
Transfers 2,405 1,953 1,784 1,656 1,736 1,737 1,764 1,785Official transfers 541 287 514 543 474 451 430 349Other transfers 2,148 1,859 1,636 1,622 1,710 1,711 1,738 1,759
Capital and financial account 4,699 4,078 3,006 3,322 3,868 5,266 5,536 4,736
Capital account 283 193 366 510 448 425 404 323
Financial account 4,415 3,885 2,640 2,812 3,420 4,841 5,132 4,413Foreign direct investment (net) 3,293 3,226 2,921 3,042 3,207 3,565 3,950 3,689Portfolio investment (net) 1,122 659 -343 -230 214 238 263 284Other investment (net) 0 0 62 0 0 1,039 919 440
Medium and long term (net) 656 567 943 881 1,381 1,350 1,405 929Short-term (net) -1,695 787 -500 -214 -374 -311 -486 -489
Errors and omissions 196 -379 0 0 0 0 0 0
Overall balance -29 -2,140 -1,137 173 699 1,402 1,354 379
Memorandum items:
Current account -12.2 -13.2 -10.6 -7.8 -7.4 -6.9 -6.7 -6.7Trade Balance -10.4 -9.0 -7.3 -3.9 -2.9 -2.0 -1.7 -2.1Official transfers 1.3 0.6 1.3 1.3 1.1 0.9 0.8 0.6Capital and Financial Account 11.6 9.2 7.7 8.2 9.0 9.8 9.3 7.4Foreign direct investment (net) 8.1 7.3 7.5 7.5 7.5 7.5 7.5 6.5
Overall Balance -0.1 -4.8 -2.9 0.4 1.6 3.0 2.6 0.7
Gross International ReservesMillions of U.S. Dollars 5,349 5,632 4,706 5,478 6,912 8,642 9,989 10,261Months of imports 2.9 3.2 2.7 2.8 3.3 3.8 4.3 4.1Months of Imports (excl. oil funds) 3.0 2.2 2.2 2.5 2.8 3.0 2.7
Nominal GDP in U.S. Dollars 40,436 44,223 38,944 40,561 42,756 47,528 52,661 56,749
Sources: Ghanaian authorities; and Fund staff estimates and projections.
Proj.
(In millions of U.S. dollars)
(Percent of GDP)
Table 4. Ghana: Balance of Payments, 2012–19
2012

GHANA
INTERNATIONAL MONETARY FUND 31
2008 2009 2010 2011 2012 2013
Capital adequacy: Regulatory capital ratio 14.8 18.2 19.1 17.4 18.6 18.5Regulatory tier 1 capital ratio 12.8 17.0 18.6 15.5 16.4 14.7
Asset quality:Nonperforming loans to total gross loans 7.7 16.2 17.6 14.1 13.2 12.0Credit to total assets 52.3 43.8 40.1 37.8 42.9 42.6Loan provision to Gross loan 6.3 9.4 9.4 7.7 6.4 5.5Bank Provisions to NPLs … 68.7 70.6 76.2 77.9 78.3
Earnings and profitability:Return on assets, before taxes (average) 3.2 2.8 3.8 3.9 4.8 6.2Return on equity, before taxes (average) 30.1 23.6 28.6 27.2 34.6 42.5
Interest margin to gross income 41.3 39.4 50.1 46.8 48.5 50.4 Interest spread 20.8 25.9 22.7 22.2 21.4 25.6
Liquidity: Core liquid assets to total assets ratio 25.2 26.3 25.3 27.8 24.1 21.7
39.4 47.2 51.3 54.9 51.0 51.3 Core liquid assets to short-term liabilities ratio 33.5 34.5 32.9 35.3 30.7 28.2 Broad liquid assets to short-term liabilities ratio 52.4 62.0 66.6 69.6 64.8 66.5
Exposure to foreign exchange risk: Share of foreign currency deposits in total deposits 28.1 32.7 25.4 27.4 28.9 27.1 Share of foreign liabilities in total liabilities 7.0 6.2 4.7 3.4 3.5 8.5
Source: Bank of Ghana.
Table 5. Ghana: Financial Soundness Indicators, 2008–13
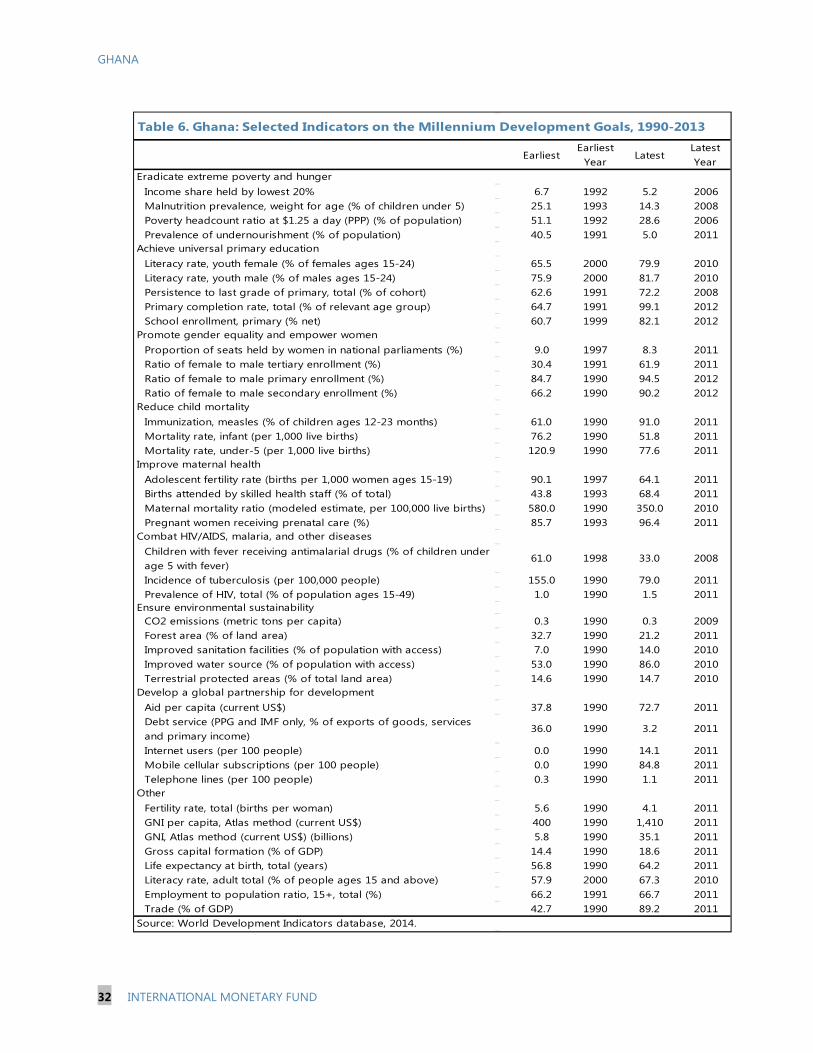
GHANA
32 INTERNATIONAL MONETARY FUND
Table 6. Ghana: Selected Indicators on the Millennium Development Goals, 1990-2013
Earliest
Earliest Year
LatestLatest Year
Income share held by lowest 20% 6.7 1992 5.2 2006Malnutrition prevalence, weight for age (% of children under 5) 25.1 1993 14.3 2008Poverty headcount ratio at $1.25 a day (PPP) (% of population) 51.1 1992 28.6 2006Prevalence of undernourishment (% of population) 40.5 1991 5.0 2011
Literacy rate, youth female (% of females ages 15-24) 65.5 2000 79.9 2010Literacy rate, youth male (% of males ages 15-24) 75.9 2000 81.7 2010Persistence to last grade of primary, total (% of cohort) 62.6 1991 72.2 2008Primary completion rate, total (% of relevant age group) 64.7 1991 99.1 2012School enrollment, primary (% net) 60.7 1999 82.1 2012
Proportion of seats held by women in national parliaments (%) 9.0 1997 8.3 2011Ratio of female to male tertiary enrollment (%) 30.4 1991 61.9 2011Ratio of female to male primary enrollment (%) 84.7 1990 94.5 2012Ratio of female to male secondary enrollment (%) 66.2 1990 90.2 2012
Immunization, measles (% of children ages 12-23 months) 61.0 1990 91.0 2011Mortality rate, infant (per 1,000 live births) 76.2 1990 51.8 2011Mortality rate, under-5 (per 1,000 live births) 120.9 1990 77.6 2011
Adolescent fertility rate (births per 1,000 women ages 15-19) 90.1 1997 64.1 2011Births attended by skilled health staff (% of total) 43.8 1993 68.4 2011Maternal mortality ratio (modeled estimate, per 100,000 live births) 580.0 1990 350.0 2010Pregnant women receiving prenatal care (%) 85.7 1993 96.4 2011
Children with fever receiving antimalarial drugs (% of children under age 5 with fever)
61.0 1998 33.0 2008
Incidence of tuberculosis (per 100,000 people) 155.0 1990 79.0 2011Prevalence of HIV, total (% of population ages 15-49) 1.0 1990 1.5 2011
CO2 emissions (metric tons per capita) 0.3 1990 0.3 2009Forest area (% of land area) 32.7 1990 21.2 2011Improved sanitation facilities (% of population with access) 7.0 1990 14.0 2010Improved water source (% of population with access) 53.0 1990 86.0 2010Terrestrial protected areas (% of total land area) 14.6 1990 14.7 2010
Aid per capita (current US$) 37.8 1990 72.7 2011Debt service (PPG and IMF only, % of exports of goods, services and primary income)
36.0 1990 3.2 2011
Internet users (per 100 people) 0.0 1990 14.1 2011Mobile cellular subscriptions (per 100 people) 0.0 1990 84.8 2011Telephone lines (per 100 people) 0.3 1990 1.1 2011
Fertility rate, total (births per woman) 5.6 1990 4.1 2011GNI per capita, Atlas method (current US$) 400 1990 1,410 2011GNI, Atlas method (current US$) (billions) 5.8 1990 35.1 2011Gross capital formation (% of GDP) 14.4 1990 18.6 2011Life expectancy at birth, total (years) 56.8 1990 64.2 2011Literacy rate, adult total (% of people ages 15 and above) 57.9 2000 67.3 2010Employment to population ratio, 15+, total (%) 66.2 1991 66.7 2011Trade (% of GDP) 42.7 1990 89.2 2011
Eradicate extreme poverty and hunger
Achieve universal primary education
Promote gender equality and empower women
Reduce child mortality
Improve maternal health
Combat HIV/AIDS, malaria, and other diseases
Ensure environmental sustainability
Develop a global partnership for development
Other
Source: World Development Indicators database, 2014.
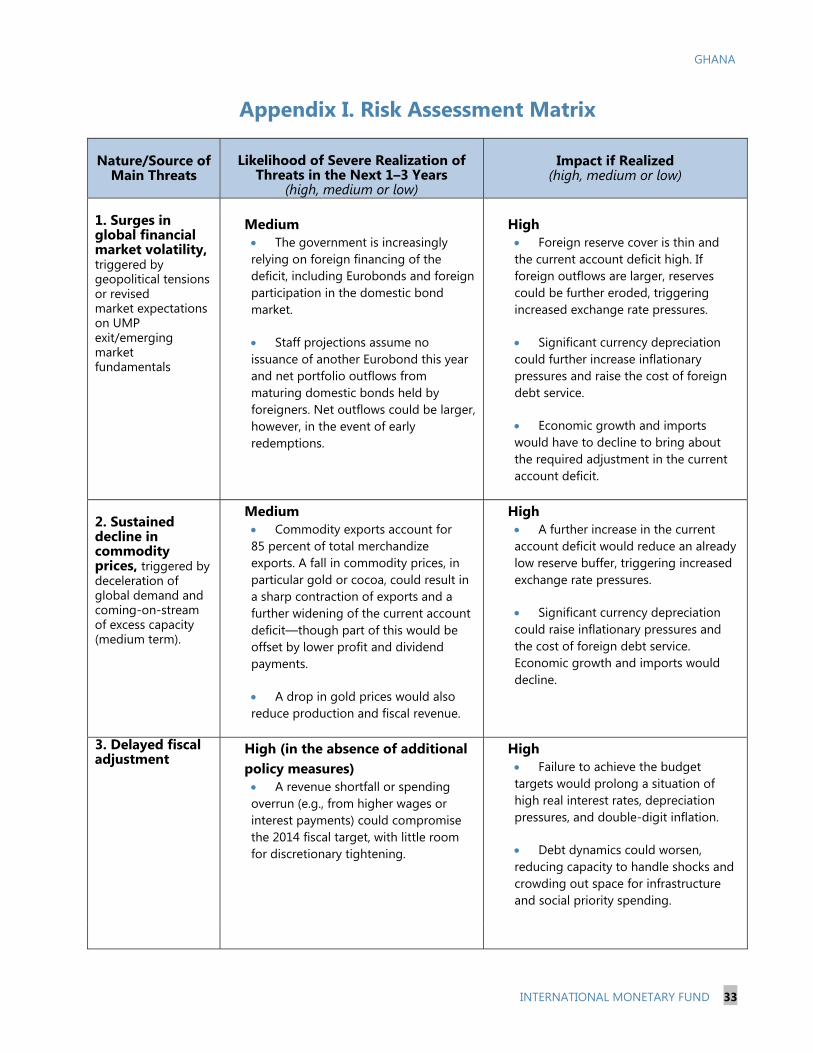
GHANA
INTERNATIONAL MONETARY FUND 33
Appendix I. Risk Assessment Matrix
Nature/Source of Main Threats
Likelihood of Severe Realization of
Threats in the Next 1–3 Years (high, medium or low)
Impact if Realized (high, medium or low)
1. Surges in global financial market volatility, triggered by geopolitical tensions or revised market expectations on UMP exit/emerging market fundamentals
Medium The government is increasingly relying on foreign financing of the deficit, including Eurobonds and foreign participation in the domestic bond market.
Staff projections assume no issuance of another Eurobond this year and net portfolio outflows from maturing domestic bonds held by foreigners. Net outflows could be larger, however, in the event of early redemptions.
High Foreign reserve cover is thin and the current account deficit high. If foreign outflows are larger, reserves could be further eroded, triggering increased exchange rate pressures.
Significant currency depreciation could further increase inflationary pressures and raise the cost of foreign debt service.
Economic growth and imports would have to decline to bring about the required adjustment in the current account deficit.
2. Sustained decline in commodity prices, triggered by deceleration of global demand and coming-on-stream of excess capacity (medium term).
Medium Commodity exports account for 85 percent of total merchandize exports. A fall in commodity prices, in particular gold or cocoa, could result in a sharp contraction of exports and a further widening of the current account deficit—though part of this would be offset by lower profit and dividend payments.
A drop in gold prices would also reduce production and fiscal revenue.
High A further increase in the current account deficit would reduce an already low reserve buffer, triggering increased exchange rate pressures.
Significant currency depreciation could raise inflationary pressures and the cost of foreign debt service. Economic growth and imports would decline.
3. Delayed fiscal adjustment
High (in the absence of additional policy measures) A revenue shortfall or spending overrun (e.g., from higher wages or interest payments) could compromise the 2014 fiscal target, with little room for discretionary tightening.
High Failure to achieve the budget targets would prolong a situation of high real interest rates, depreciation pressures, and double-digit inflation.
Debt dynamics could worsen, reducing capacity to handle shocks and crowding out space for infrastructure and social priority spending.
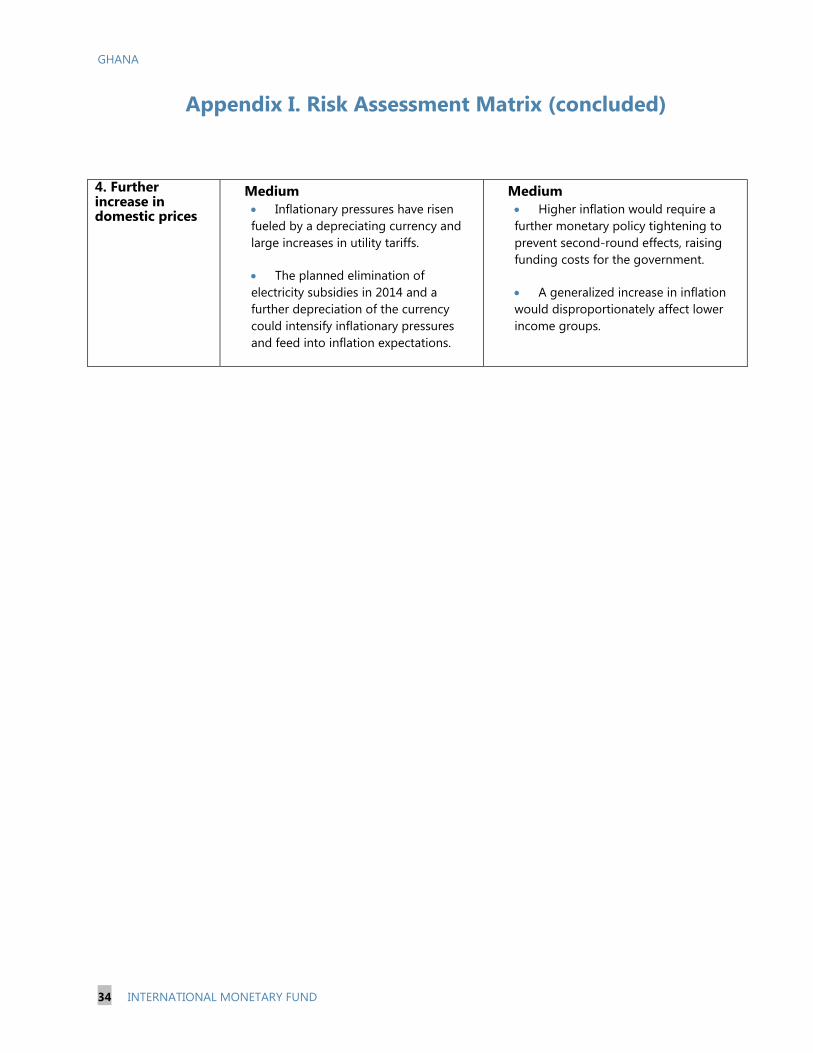
GHANA
34 INTERNATIONAL MONETARY FUND
Appendix I. Risk Assessment Matrix (concluded)
4. Further increase in domestic prices
Medium Inflationary pressures have risen fueled by a depreciating currency and large increases in utility tariffs.
The planned elimination of electricity subsidies in 2014 and a further depreciation of the currency could intensify inflationary pressures and feed into inflation expectations.
Medium Higher inflation would require a further monetary policy tightening to prevent second-round effects, raising funding costs for the government.
A generalized increase in inflation would disproportionately affect lower income groups.

GHANA STAFF REPORT FOR THE 2014 ARTICLE IV CONSULTATION—INFORMATIONAL ANNEX Prepared By
African Department
RELATIONS WITH THE FUND ____________________________________________________________ 2
JOINT WORLD BANK-IMF WORK PROGRAM, 2013–14 ________________________________ 8
STATISTICAL ISSUES ____________________________________________________________________ 10
CONTENTS
April 21, 2014

GHANA
2 INTERNATIONAL MONETARY FUND
RELATIONS WITH THE FUND (As of March 25, 2014)
Membership Status: Joined: September 20, 1957; Article VIII
General Resources Account: SDR Million %Quota
Quota 369.00 100.00
Fund holdings of currency (Exchange Rate) 369.00 100.00
Reserve Tranche Position 0.00 0.00
SDR Department: SDR Million %Allocation
Net cumulative allocation 353.87 100.00
Holdings 235.46 66.54
Outstanding Purchases and Loans: SDR Million %Quota
ECF Arrangements 437.55 118.58
Latest Financial Arrangements: Type Date of Arrangement Expiration Date Amount Approved Amount Drawn
(SDR Million) (SDR Million) ECF 1/ Jul 15, 2009 Jul 23, 2012 387.45 387.45 ECF 1/ May 09, 2003 Oct 31, 2006 184.50 184.50 ECF 1/ May 03, 1999 Nov 30, 2002 228.80 176.22
1/ Formerly PRGF.
Projected Payments to Fund 2/ (SDR Million; based on existing use of resources and present holdings of SDRs):
Forthcoming 2014 2015 2016 2017 2018
Principal 18.46 42.77 46.34 53.66 77.49 Charges/Interest 0.11 1.15 1.04 0.92 0.74 Total 18.56 43.92 47.38 54.58 78.23
2/ When a member has overdue financial obligations outstanding for more than three months, the amount of such arrears will be shown in this section.

GHANA
INTERNATIONAL MONETARY FUND 3
Implementation of HIPC Initiative:
Enhanced
I. Commitment of HIPC assistance Framework
Decision point date Feb 2002
Assistance committed
by all creditors (US$ Million) 1/ 2,186.00
Of which: IMF assistance (US$ million) 112.10
(SDR equivalent in millions) 90.05
Completion point date Jul 2004
II. Disbursement of IMF assistance (SDR Million)
Assistance disbursed to the member 90.05
Interim assistance 25.06
Completion point balance 64.99
Additional disbursement of interest income 2/ 4.25
Total disbursements 94.30
1/ Assistance committed under the original framework is expressed in net present value (NPV) terms at the completion point, and assistance committed under the enhanced framework is expressed in NPV terms at the decision point. Hence these two amounts cannot be added.2/ Under the enhanced framework, an additional disbursement is made at the completion point corresponding to interest income earned on the amount committed at the decision point but not disbursed during the interim period.
Implementation of Multilateral Debt Relief Initiative (MDRI):
I. MDRI-eligible debt (SDR Million)1/ 265.39
Financed by: MDRI Trust 220.04
Remaining HIPC resources 45.35
II. Debt Relief by Facility (SDR Million)
Eligible Debt
Delivery Date
GRA
PRGT
Total
January 2006 N/A 265.39 265.39
1/ The MDRI provides 100 percent debt relief to eligible member countries that qualified for the assistance. Grant assistance from the MDRI Trust and HIPC resources provide debt relief to cover the full stock of debt owed to the Fund as of end-2004 that remains outstanding at the time the member qualifies for such debt relief.

GHANA
4 INTERNATIONAL MONETARY FUND
Implementation of Post-Catastrophe Debt Relief (PCDR): Not Applicable
Decision point—point at which the IMF and the World Bank determine whether a country qualifies for assistance under the HIPC Initiative and decide on the amount of assistance to be committed.
Interim assistance—amount disbursed to a country during the period between decision and completion points, up to 20 percent annually and 60 percent in total of the assistance committed at the decision point (or 25 percent and 75 percent, respectively, in exceptional circumstances).
Completion point—point at which a country receives the remaining balance of its assistance committed at the decision point, together with an additional disbursement of interest income as defined in footnote 2 above. The timing of the completion point is linked to the implementation of pre-agreed key structural reforms (i.e., floating completion point).
Safeguards Assessment The Bank of Ghana (BoG) was subject to an update safeguards assessment with respect to the PRGF arrangement approved on July 15, 2009; the assessment, completed on December 2, 2009, followed an initial safeguards assessment from October 2003. The update assessment found that while the safeguards framework of the BoG had been strengthened in several areas, new risks in governance oversight emerged with the removal of the former Board in January 2009. In March 2010, a new Board was appointed. Exchange Rate Arrangement On February 2, 1994, Ghana accepted obligations under Article VIII, Sections 2(a), 3, and 4, of the Fund’s Articles of Agreement. The exchange rate regime is classified as a managed float. Ghana currently maintains two exchange restrictions and a multiple currency practice (MCP) subject to Fund approval. The exchange restrictions arise from (1) the limitation/prohibition on purchasing and transferring foreign exchange for import transactions by importers who have not submitted to the commercial bank customs entry forms for any past foreign exchange transactions related to imports, and which are unrelated to the underlying transaction; and (2) the prohibition for commercial banks to grant foreign currency-denominated loans to non-foreign exchange earners (including importers), which constitutes the withdrawal of previously existing normal, short-term banking and credit facilities. An MCP also arises, because the BOG requires the use of its internal rate (i.e., the previous day’s weighted average interbank exchange rate) for government transactions and the surrender of cocoa and gold foreign exchange proceeds without having a mechanism in place to ensure that, at the time of the transaction, this exchange rate does not differ from the rate prevailing in the market rate (i.e., the interbank exchange rate) and the rates used by banks in their transactions with their customers by more than 2 percent. At the end of March 2013, the average exchange rate for transactions in the interbank market was GH¢ 2.6885 per U.S. dollar.

GHANA
INTERNATIONAL MONETARY FUND 5
Article IV Consultation The 2013 Article IV consultation discussions were held in Accra during April 2-12, 2013. The staff report (Country Report No. 13/187) was discussed by the Executive Board on June 12, 2013 and is posted on the IMF website. FSAP Participation Ghana participated in the FSAP in 2000–01, and a Financial System Stability Assessment (FSSA) was issued to the Executive Board in 2001. An FSAP update was presented to the Board in December 2003 and May 2011. Technical Assistance
Subject
Department
Date
Advise on establishing large taxpayers unit FAD 2002/03 Review of public expenditure management reforms FAD 2002/03 Tax policy FAD May 2003 Fiscal ROSC FAD Feb. 2004 Regional advisor on public expenditure management FAD 2004/06 Assessment of petroleum pricing mechanism FAD Jan. 2005 Public financial management (PFM) FAD Mar.-Jun. 2006 Public financial management (PFM) FAD Feb. 2010 Enhancing fiscal discipline FAD May 2008 Revenue administration FAD Jan. 2009 Tax policy FAD Apr. 2009 Revenue administration FAD Apr. 2009
Mar. 2010 Fiscal regime for natural resources FAD Jun. 2009 Tax administration FAD Mar. 2010 Expenditure Control and Arrears FAD Jan. Feb. 2011 Small taxpayer regime FAD Feb. 2011 Revenue Administration Strengthening the compliance enforcement and debt management function and program
FAD March 2013
Accounting and internal audit reform MFD Jul.–Nov. 2002 Mar. 2003
Foreign exchange market, government securities market, and banking system issues
MFD Apr. 2003
Joint FSAP follow-up with World Bank MFD Jun. 2003 Multitopic technical assistance initiation MFD Nov. 2004 Improving monetary operations, banking supervision and payment systems
MFD Nov. 2004

GHANA
6 INTERNATIONAL MONETARY FUND
Medium-term debt management strategy MCM Mar. 2008 Banking supervision MCM Dec. 2009 Review options for resolution of the weak state-owned banks MCM Apr.-May 2011 Problem Bank Resolution MCM Mar.-Apr. 2011 Bank supervision and regulations MCM […] Joint FSAP follow-up with World Bank MCM Mar. 2011 Monetary and Exchange Rate Operations MCM Jan.-Feb. 2012 Problem Bank Resolution MCM Sep. 2012/
Jan. 2013 Macrofinancial Stress Testing and Early Warning System MCM Feb. 2013 Joint Financial Stability Review with World Bank MCM Apr. 2013 The road to Basel II and bank resolution. Jul. 2013 Monetary data reported in SRF STA Jun. 2011 Money and banking statistics STA Jul. 2002
Jan.-Feb. 2004 Apr. 2007 Mar. 2008 Apr.-May 2009
National accounts statistics STA Sept./Oct. 2001 Aug.-Dec. 2002 Sep. 2003 Feb. 2009 Sep. 2010 Apr. 2011 Nov.-Dec. 2011 Nov.-Dec. 2013
National accounts and prices STA Mar. 2004 Oct. 2004 Apr.-May 2005 Apr.-May 2006 Sep. 2006 Apr. 2011
Government finance statistics STA Mar. 2005 May-Jun. 2006 May-Jun. 2009
Balance of payment statistics STA Feb. 2009 Apr.-May 2010 Apr. 2011 Jun.-Sep. 2012
Pilot study of access to private capital markets ICM May 2003 Nov. 2004
The remittance market LEG Apr.-May 2006 Fiscal law: review of tax laws LEG Jan. 2011
GHANA
INTERNATIONAL MONETARY FUND 7
AML/CFT structures and tools
LEG Feb-Mar. 2011 Feb. 2012 Jan. 2013
Resident Representative The Fund has had a Resident Representative office in Accra since June 1985. The current resident representative is Mr. Samir Jahjah who assumed the post in October 2012.

GHANA
8 INTERNATIONAL MONETARY FUND
JOINT WORLD BANK-IMF WORK PROGRAM, 2013–14 Title Products Provisional timing
of mission Expected delivery date
A. Mutual information on relevant work programs Bank work program in next 12 months
TA on design of the Ghana Infrastructure Fund.
First mission in February, 2014.
December, 2014
TA on governance reform of state-owned enterprises and regulators.
First mission on March 2014.
December, 2014
Policy Note on implementation of single spine salary structure.
First mission in March, 2014
June, 2014
Oil and Gas Capacity Building Project
Ongoing
December, 2016
E-Ghana (GIFMIS) May 2014 To be extended to December 2014
IMF work program in next 12 months
Article IV Consultation Technical assistance:
April 2014
Board: April 2014
Public Financial Management
February 2012–March 2015
Revenue Administration May 2012–April 2013
AML/CFT Structures and Tools for Supervisory Framework
FY 12-13
Monetary and Foreign Exchange Operations
June 2014 –December 2015
Supervisions of foreign Exchange Issues
May, 2014
Stress Testing and Capacity Building
July 2014
Basel I and II June, 2014

GHANA
INTERNATIONAL MONETARY FUND 9
B. Requests for work program inputs World Bank request to IMF
Regular update of macroeconomic projections.
Continuous
IMF request to World Bank
Regular update on Bank activities
Continuous
C. Agreement on joint products and missions Joint products in next 12 months
Joint Bank-Fund Debt Sustainability Analysis (Update)
April 2003 May 2013
GHANA
10 INTERNATIONAL MONETARY FUND
STATISTICAL ISSUES I. Assessment of Data Adequacy for Surveillance
General: Data provision has some shortcomings, but is broadly adequate for standard surveillance. The quality and timeliness of certain data need to be improved. To monitor vulnerabilities, effective surveillance warrants a more timely provision of critical high-frequency data. There are notable deficiencies in the dissemination of statistical information to the public, although the situation has improved with the recurrent publication on the Bank of Ghana’s (BOG) website of the Monetary Policy Committee Statement, Statistical Releases, and economic and financial reports since 2003. National Accounts: Ghana compiles annual and quarterly estimates of GDP by economic activities at current and constant (2006) prices following the System of National Accounts 1993 regularly. Incorporation of latest/updated data sources, changes in conceptual treatment/methodologies and rebasing of national accounts to 2006 led to a significant upward revision of the estimates of GDP published in November 2010. In addition, Ghana Statistical Service recently published annual GDP by expenditure estimates at current and constant (2006) prices for the years 2006-12. Private consumption expenditure which was estimated as a residual in the old series, has been calculated directly in the rebased series. Ghana is one of the countries participating in the Quarterly National Accounts Module of the Enhanced Data Dissemination Initiative (EDDI) supported by the United Kingdom Department for International Development (DFID). Four missions have been conducted (September 2010, April 2011, November/December 2011, and February 2013) under this project. The February 2013 mission worked towards further improving the methodology of the current and constant price QGDP estimates by economic activity. In addition, the methodology for each component of the published annual expenditure estimates was scrutinized and a preliminary methodology for expanding these to quarterly was developed. The constant price methodology has been improved by introducing forestry stock changes and extending the range of indicators for measuring cocoa production, hotels, and air transportation. It is expected that estimates of QGDP by expenditure will be compiled by mid-2014. Labor statistics: The scarcity of labor statistics is a cause for concern. Labor statistics are almost nonexistent, although some wage indicators are available from the Social Security National Insurance Trust (SSNIT). The Ministry of Employment has been receiving technical assistance from the United Nations Development Program and the International Labor Organization in the design and compilation of labor statistics. Government finance statistics: Steps have been taken to improve fiscal data. The Controller Accountant General Department (CAGD) currently compiles monthly budget implementation reports, and the data are available within six weeks, although some factors undermine their reliability. There is a need for comprehensive and timely reconciliation of monthly treasury data with bank accounts. To address these shortcomings, the government has formed a committee to define the nature of “broad” and “narrow” government; moved to a system of immediate booking for “direct debits” and more frequent reporting of government account balances; and is implementing a new automated Budget and Public Expenditure Management System (BPEMS). The BPEMS covers ministries, departments, and agencies. Several GFS missions worked with the authorities to improve the economic classification of
GHANA
INTERNATIONAL MONETARY FUND 11
data in accordance with the requirements of GFSM 2001. In 2009, an STA mission also provided guidance on the compilation of a partial financial balance sheet for budgetary central government, and proposed that information on debt stocks that is available on a monthly basis be reported for the inclusion in the International Financial Statistics (IFS). The coverage of transactions is uneven. There are also difficulties in accounting for expenses paid by extrabudgetary funds. The operations of special funds, such as the SSNIT (currently regarded as a public financial corporation by the authorities), the Ghana Education Trust Fund (GETF) and the District Assemblies Common Fund (DACF), are not yet covered in the fiscal accounts. Although the majority of local government expenses are directly met from budgetary accounts, the revenue of local governments and related spending, and transactions financed from the DACF are not yet covered. Extending the coverage of fiscal data to general government is strongly encouraged. Comprehensive solutions to some of the data problems may have to await full implementation of the BPEMS system and incorporation of Fund technical advice. Various missions from FAD have suggested short-term temporary solutions to alleviate current data quality problems. Monetary and financial statistics: While BOG has made significant progress on implementing the previous missions’ recommendations on monetary and financial statistics, continued efforts are needed to expand the institutional coverage and improve the timeliness of the data reporting. The June 2011 monetary and financial statistics mission assisted in improving the data mapping for compiling the standardized report forms (SRFs) for central bank (SRF 1SR) and other depository corporations (ODCs) (SRF 2SR). BOG has used the updated mapping to compile and report SFR 1SR, SRF 2SR, and SRF 5SR for monetary aggregates for publication in the IMF’s International Financial Statistics (IFS). As a result, the data quality has improved. However, data have not been reported regularly and the timeliness has worsened. Data through October 2012 were published in the April 2013 issue of IFS—a lag of more than six months. The mission also assisted in mapping the statistical returns for other financial institutions to SRFs with a view to expanding the data coverage. However, no further progress has been made on including these other financial institutions in the coverage of monetary statistics. Debt statistics: The responsibility for external debt recording and payment is divided among three agencies. The Ministry of Finance and Economic Planning (MOFEP), through its Aid and Debt Management Unit (ADMU), maintains the external debt database. It is responsible for recording debt payment obligations, issuing payment requests, and tracking HIPC debt relief. The CAGD confirms the legality of the payment and authorizes the release of public funds. It is responsible for accounting for debt payments and rendering reports to parliament. The BOG as the payment agent for the government verifies payments made to ADMU and CAGD. To enable systematic comparison of the budget, the balance of payments and the BOG cash-flow data, the authorities should clearly identify the government subsectors for which data are reported and prepare a clear classification of financing, outstanding debt, and guarantees issued. External sector Statistics: The Balance of Payments Office (BPO) of the Research Department of the BOG is responsible for the compilation and dissemination of balance of payments and International Investment Position (IIP) data for Ghana. Ghana participates in the external sector module of EDDI and has benefited extensively from technical assistance in developing and undertaking enterprise surveys of cross-border financial flows and stocks (Foreign Assets and Liabilities Survey (FALS)), with a view to improve the quality of balance of payments statistics and IIP statistics. A major achievement was the
GHANA
12 INTERNATIONAL MONETARY FUND
submission of an IIP to the Fund’s Statistics Department (STA) during 2011 for the period 2006 through 2009 and the data were subsequently published in the March 2011 International Financial Statistics (IFS). However, there are still some challenges to overcome with respect to the timeliness of the data. Next steps are, therefore, the implementation of a small timely sample quarterly survey of cross-border capital to overcome the timeliness and quarterly estimates challenges. Despite the progress achieved in improving the data sources and compilation techniques, substantial work is still needed to strengthen existing, and develop new data sources to improve the accuracy and reliability of the current and capital, and financial account. The missions urged the BPO to work towards closing major remaining data gaps by making the International Transactions Reporting System (ITRS) a reliable data source to the extent possible, and use it at its full potential and as a cost-efficient way to receive information for the current, capital, and financial account. ITRS reporting is being revised to ensure that it serves as: (i) a broad indicator of BOP current, capital, and financial account transactions; and (ii) a data source for transactions of which direct reporting is not feasible. Trade statistics: Currently, the GSS is not publishing timely monthly trade statistics, although the data are available from the Customs, Excise, and Preventive Service (CEPS). The staff has recommended that the GSS collaborate with the CEPS to process customs data within six weeks and with the Ministry of Trade and Industry (MOT) and the BOG to identify and reduce discrepancies in trade statistics and to ensure that imports into bonded warehouses are not double-counted. Data collection procedures of the CEPS need to be improved, and there is also room for improving trade volume data collected by the CEPS through customs invoices, which would help the GSS to extract meaningful import and export unit values. The May 2010 STA mission found that BPO treats goods that are temporarily imported into Ghana without passing the customs authorities (i.e. not yet captured by customs) and then sold to enterprises in the free zone as exports. This treatment would imply that free trade zones are treated as located outside the Ghanaian economic territory, which should not be the case. Fund staff has recommended that the GSS produce export unit values for major export commodities, such as gold and cocoa. A high coverage of the country’s export bundle can be obtained from just three major exports—cocoa, gold, and unwrought aluminum. In contrast, deflation of imports is likely to require an iterative procedure to strike a balance between coverage of the index and its stability, owing to the heterogeneity of the basket. II. Data Standards and Quality Participant in the General Data Dissemination System (GDDS) since July 20, 2005. III. Reporting to STA (Optional) STA found some major issues in the March 2010 data for the Central Bank and the February 2010 data for the ODCs that the authorities submitted in April 2010 for publication in the IFS. For this reason, STA thoroughly reviewed the entire mapping of source data to the SRFs and several misclassifications were fixed. As a result, the updating of the IFS page for Ghana was resumed in March 2011 after a long delay. The latest data published in the IFS are for December 2010. Data for publication in the IFS on international transactions were last reported for 2009, quarterly government finances for March 2010, and national accounts for 1997. No quarterly balance of payments data are currently reported for publication in the IFS. The latest available data reported for publication in the Government Finance Statistics Yearbook (GFSY) are for 2009. However, these data cover only the cash revenue and expense transactions of the budgetary central government.

GHANA
INTERNATIONAL MONETARY FUND 13
Ghana: Table of Common Indicators Required for Surveillance (As of March, 2014)
Date of latest
observation
Date
received
Frequency of
Data6
Frequency of
Reporting6
Frequency of
Publication6
Exchange Rates Feb 2014 Feb 2014 D M NA
International Reserve Assets and Reserve
Liabilities of the Monetary Authorities1
Feb 2014 Feb 2014 M M Q
Reserve/Base Money Feb 2014 Apr 2014 M M I
Broad Money Feb 2014 Apr 2014 M M I
Central Bank Balance Sheet Feb 2014 Apr 2014 M M I
Consolidated Balance Sheet of the Banking
System
Jan 2014 Mar 2014 M M I
Interest Rates2 Feb 2013 Apr 2014 M M I
Consumer Price Index Mar 2014 Apr 2014 M M M
Revenue, Expenditure, Balance and Composition
of Financing3 – general government4
NA NA NA NA NA
Revenue, Expenditure, Balance and Composition
of Financing3 – central government
Dec 2013 Feb 2014 M M I
Stocks of Central Government and Central
Government-Guaranteed Debt5
Dec 2013 Feb 2014 M Q I
External Current Account Balance Dec 2013 Feb 2014 Q Q Q
Exports and Imports of Goods and Services Dec 2013 Feb 2014 Q Q Q
GDP/GNP 2013 Feb 2014 Q/A Q/A Q/A
Gross External Debt Dec 2014 Feb 2014 M I A
International Investment Position7 NA NA NA NA NA
1Includes reserve assets pledged or otherwise encumbered as well as net derivative positions.
2 Both market-based and officially determined, including discount rates, money market rates, rates on treasury bills, notes and bonds.
3 Foreign, domestic bank, and domestic nonbank financing.
4 The general government consists of the central government (budgetary funds, extrabudgetary funds, and social security funds) and
state and local governments.
5 Including currency and maturity composition.
6 Daily (D); Weekly (W); Monthly (M); Quarterly (Q); Annually (A); Irregular (I); Not Available (NA). 7 Includes external gross financial assets and liability positions vis-à-vis non residents.
GHANA STAFF REPORT FOR THE 2014 ARTICLE IV CONSULTATION—DEBT SUSTAINABILITYANALYSIS
Based on an assessment of external public debt indicators, Ghana still faces a moderate risk of debt distress, but overall debt vulnerabilities have increased, and Ghana’s debt service-to-revenue ratio is approaching high-risk levels. Driven by loose fiscal policy, deteriorating financing terms and external pressures, several of Ghana’s public domestic and external debt indicators have deteriorated. Assuming fiscal policies are implemented as planned, total public debt is projected to hover around 55 to 60 percent of GDP, with rising debt service absorbing more than 40 percent of government revenue in the long run. The external debt service-to-revenue ratio temporarily breaches and subsequently stays close to its indicative threshold in the long term. Additional consolidation measures of about 2 percent of GDP in 2014, combined with a more ambitious medium-term adjustment, would greatly reduce the risk of worsening debt and debt service indicators.
1 Prepared in collaboration with Ghanaian authorities. The previous DSA was prepared in May 2013 (IMF Country Report No. 13/187)
Approved By Michael Atingi-Ego and Mark Joseph Flanagan (IMF) and Marcelo Giugale and Jeff Lewis (IDA)
Prepared by the International Monetary Fund and the World Bank1
April 21, 2014

GHANA
2 INTERNATIONAL MONETARY FUND
KEY ASSUMPTIONS UNDER THE BASELINE SCENARIO 1. Macroeconomic assumptions are broadly in line with those in the 2013 DSA, with deviations mainly related to the projection of oil production and higher cost of borrowing (Box 1, Tables 1–2). Revisions reflect: (i) updated information on the timing of oil production; (ii) an associated upward revision in real growth for the medium term and lower growth subsequently; and (iii) higher cost of borrowing, consistent with current lending conditions and projected rising world interest rates in the medium term. As projections on future oil discoveries and gas production are not available (and thus, not captured), the growth projections are conservative.
2. The projected debt dynamics are, however, contingent on successful fiscal consolidation. The baseline assumes fiscal consolidation that is consistent with the authorities’ 2014 nominal budget targets and stated policies, but a more conservative growth outlook and higher interest payments. This implies a gradual reduction in the fiscal deficit to 7½ percent of GDP in 2016, with subsequent changes driven primarily by the profile for oil revenue.
EXTERNAL AND PUBLIC DEBT SUSTAINABILITY A. External Debt Sustainability Analysis
Baseline scenario
3. Ghana’s external debt indicators are broadly in line with the 2013 DSA, with PV indicators moderated by a change in the discount rate (Table 3 and Figure A1). The deterioration in the PV of debt stock indicators compared to last year’s assessment was mitigated by an increase in the discount rate
Table 1. Key Macroeconomic Assumptions
2013 2014 2014-19 2020-33Real GrowthDSA-2013 7.9 6.1 5.8 5.3DSA-2014 5.4 4.8 6.1 4.7
Inflation (GDP deflator)DSA-2013 13.7 12.8 9.6 6.9DSA-2014 12.3 13.1 10.2 6.8
Real interest Rate (foreign debt)DSA-2013 1.6 1.1 1.7 3.7DSA-2014 3.0 2.4 2.6 3.8
Current account balanceDSA-2013 -11.9 -9.1 -8.3 -6.0DSA-2014 -13.2 -10.6 -7.7 -6.0
Primary fiscal balanceDSA-2013 -6.5 -5.1 -2.6 -0.4DSA-2014 -5.6 -3.6 -0.9 -0.3
(in percent of GDP)
(annual percentage change)
(annual percentage change)
(percent)
(in percent of GDP)

GHANA
INTERNATIONAL MONETARY FUND 3
Box 1. Baseline Macroeconomic Assumptions
Real GDP-growth: While still solid, real growth has declined to a projected 5½ percent in 2013, due to disruptions in power supply from the West African Gas Pipeline in the first half of the year, crowding out from high real interest rates, higher import costs due to the depreciation, and falling gold production related to the drop in world prices. In 2014-15, growth is projected to remain at this more moderate level until production from new oil fields boosts output in 2016. In the long run, real growth is assumed to stabilize at 4¾ percent, with new oil discoveries and the associated gas production implying significant upside potential.
Inflation: Inflation overshot the end of the year target range of 9+/-2 percent (end-year CPI inflation was 13.5 percent, partly due to large increases in utility prices), and is projected to remain at this elevated level in 2014. Supported by an improvement in the policy mix, inflation is expected to decline in the medium run, with the GDP deflator stabilizing at 6¾ percent in 2020–2033.
Government balances: The overall fiscal balance fell only slightly to an estimated 10.9 percent of GDP in 2013, with interest expenditures amounting to some 5 percent of GDP. Based on the government’s policy pronouncements and updated macro-projections, including lower growth and higher interest rates than assumed in the budget, the deficit is expected to stay above 10 percent of GDP in 2014 (primary deficit of 3½ percent). Increased revenues from the production of oil and further consolidation in 2015 and 2016 would balance primary expenditures and revenues in the medium to long term.
Current account balance: On the back of a higher fiscal deficit, declining gold and cocoa prices and large oil imports due to electricity disruptions in the first half of the year, the 2013 current account deficit rose above 13 percent of GDP. Owing to weak terms of trade, the deficit is expected to remain above 10 percent of GDP in 2014 and elevated until 2015. With increased oil production, the deficit is projected to decline to about 7 percent of GDP by 2017 and to fall gradually to about 4 percent of GDP in the long run, broadly in line with its optimal level according to staff’s external balance assessment. Reserves would build up to about 4 months of imports in the long run, consistent with the government’s own medium-term target.
Financing flows: While still significant, FDI is estimated to have declined to about 7¼ percent of GDP in 2013. Driven by the discovery of new fields, FDI is projected to stay close to 7½ percent of GDP until 2018, and then to gradually decline to 4 percent of GDP in the long run. Consistent with Ghana’s improving income status and wealth, inflows from grants are projected to decline to less than ½ percent of GDP in the medium to long term. Borrowing is projected to become increasingly nonconcessional, with rates for external commercial borrowing revised upwards by 1 percentage point compared to the last DSA.
Table 2. Official Borrowing Assumptions (in Millions of U.S. Dollars)
2014 2015 2016 2017 2018 2019DisbursementsMultilateral 365 518 596 380 361 343Bilateral 231 474 545 339 339 339Commercial 1131 963 1403 2178 1822 1532
of which: CDB 525 567 567 395 400 0Total 1955 2543 2897 2522 2214 2371

GHANA
4 INTERNATIONAL MONETARY FUND
from 3 to 5 percent.2 Export related indicators improve related to the update in the oil production profile. Most importantly, the debt service-to-revenue indicator deteriorates compared to the last assessment due to expected rising costs of external commercial borrowing (1 percentage point above the assumptions in the last DSA), the issuance of the 2013 Eurobond, and the weakening of the cedi.
4. The external debt service-to-revenue ratio breaches its indicative threshold temporarily in the long term, but a probability approach confirms that the breach is not significant (Figure A2). Without assuming measures to smooth the amortization of the 2013 Eurobond, the 2023 bullet repayment results in a breach in the indicative external debt service-to-revenue ratio. Issuance of another Eurobond in 2014 would lead to a breach in two consecutive years in the absence of measures to smooth the amortization profile, and to a possibly more sustained breach of the same threshold towards the end of the projection period. A complementary probability approach, which assesses Ghana’s external debt sustainability based on an indicative threshold derived from Ghana’s own institutional and growth characteristics, suggests that this breach is minor and temporary (1 year). Thus, the breach, which could be smoothed out in the course of the next 10 years, does not warrant a change in Ghana’s assessed risk of debt distress, but is nonetheless indicative of the longer-term perils of continued resorting to market financing to finance recurrent fiscal deficits.
Standard stress tests
5. Standard stress tests confirm a moderate risk of debt distress (Figure A1 and A2, Table 3A). All three stock indicators as well as the external debt service-to-export ratio remain under their respective thresholds even under the standardized stress tests. However, the external debt service to-revenue-ratio—temporarily breaching its threshold level in the baseline scenario—increases to above 30 percent under the most extreme shock which constitutes a one-time 30 percent real depreciation relative to the baseline in 2015. While having a more moderate impact, standardized shocks to non-debt creating flows, growth, or financing conditions would also imply breaches of the debt service-to-revenue threshold.
2 The discount rate was increased to 5 percent as of October 2013.
Table 3. Indicators of External Debt Vulnerabilities (Baseline)
2018 2024 2033
PV of debt-to-GDP ratioDSA-2013 26 29 24DSA-2014 32 29 23Threshold 50 50 50
PV of debt-to-exports ratioDSA-2013 83 96 76DSA-2014 70 71 56Threshold 200 200 200
PV of debt-to-revenue ratioDSA-2013 121 137 110DSA-2014 134 134 112Threshold 300 300 300
Debt service-to-exports ratioDSA-2013 6 14 14DSA-2014 7 11 11Threshold 25 25 25
Debt service-to-revenue ratioDSA-2013 9 19 20DSA-2014 13 20 22Threshold 22 22 22

GHANA
INTERNATIONAL MONETARY FUND 5
B. Public Debt Sustainability Analysis
Baseline scenario 6. Additional risks arise from the high level and rising trend of domestic debt, as indicated by the total public debt dynamics (Table 4, Figure A3). Despite the upward revision in the discount rate to 5 percent, stock indicators of public debt are still close to the 2013 assessment levels. However, owing to deteriorated domestic and external borrowing conditions, and in line with the external debt sustainability assessment, the total public debt service-to-revenue ratio (including payments on external and domestic debt) has deteriorated. It is now projected to increase to 45 percent in the long run, thus absorbing a large part of revenues and leaving the country vulnerable to shocks.
Stress tests and customized scenario 7. Fiscal policy will have to be tighter than in the past to prevent unsustainable debt dynamics (Figure A3, Table A4). Fixing the primary balance at its 2013 level, or growth and the primary balance at 10-year historical averages, confirms that the historical fiscal stance would not be sustainable in the long run; the PV of public debt-to-GDP ratio would be quickly approaching the benchmark (set at 74 percent for strong policy performers), and debt service would soon absorb most of revenues. Consistent with the results of the external debt sustainability analysis, a one-time 30 percent real depreciation in 2015, relative to the baseline, is the most extreme shock. It would set the debt service-to-revenue ratio on a rapidly increasing path, in the absence of corrective policy measures. The standardized shock to other debt creating flows captures contingent liabilities that could arise from SOE or other potential claims that have not been identified. Any potential financial sector contingent liabilities would also be subsumed in such a standardized shock. This shock would shift debt ratios upwards, but not change the dynamics.
8. Further consolidation of about 2 percentage points of GDP in 2014, combined with a more ambitious medium-term adjustment, would set the debt dynamics on a more favorable path (Figure 1). The additional fiscal adjustment would set off a virtuous cycle where lower fiscal deficits and falling interest rates would create room for higher social and infrastructure spending, a reduction in tax rates, and a crowding in of private sector activity. As a result, growth would be higher, the public debt ratio would decline, and debt service would fall below 30 percent of revenue in the long run.
Table 4. Indicators of Public Debt Vulnerabilities (Baseline)
2018 2024 2033PV of debt-to-GDP ratioDSA-2013 53 56 52DSA-2014 56 54 54Benchmark 74 74 74
PV of debt-to-revenue ratioDSA-2013 240 257 243DSA-2014 235 248 270
Debt service to revenue ratioDSA-2013 29 38 40DSA-2014 35 38 45
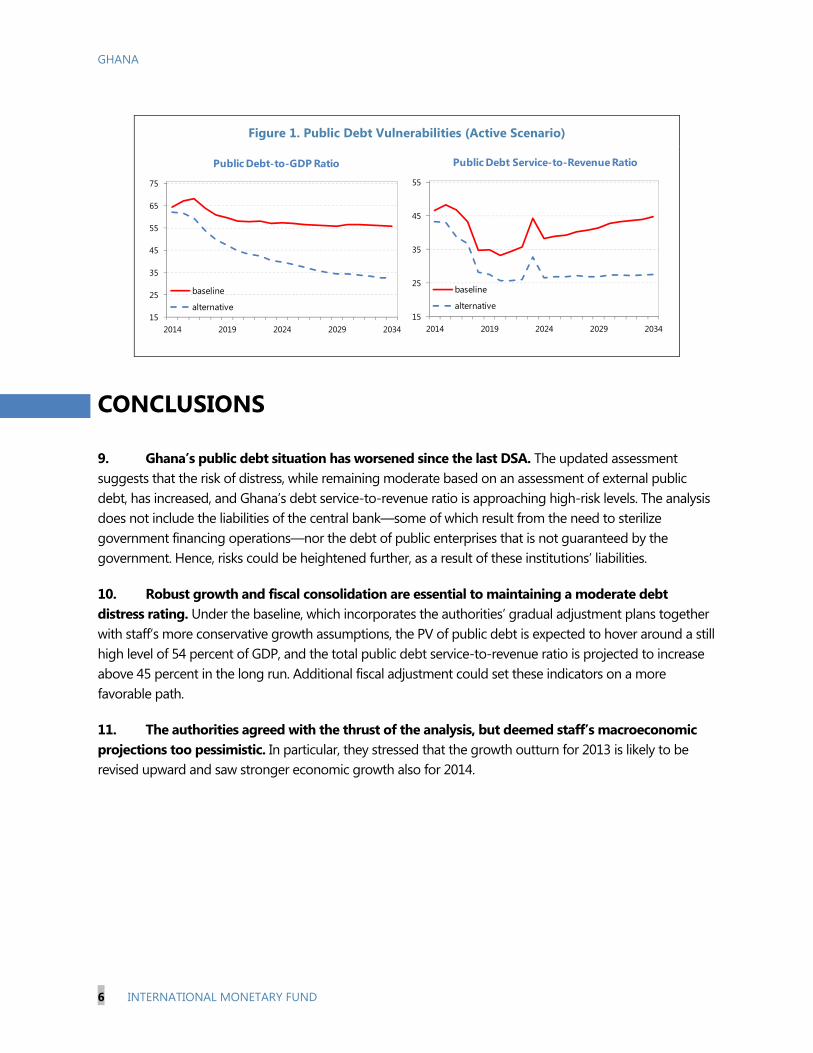
GHANA
6 INTERNATIONAL MONETARY FUND
Figure 1. Public Debt Vulnerabilities (Active Scenario)
CONCLUSIONS 9. Ghana’s public debt situation has worsened since the last DSA. The updated assessment suggests that the risk of distress, while remaining moderate based on an assessment of external public debt, has increased, and Ghana’s debt service-to-revenue ratio is approaching high-risk levels. The analysis does not include the liabilities of the central bank—some of which result from the need to sterilize government financing operations—nor the debt of public enterprises that is not guaranteed by the government. Hence, risks could be heightened further, as a result of these institutions’ liabilities.
10. Robust growth and fiscal consolidation are essential to maintaining a moderate debt distress rating. Under the baseline, which incorporates the authorities’ gradual adjustment plans together with staff’s more conservative growth assumptions, the PV of public debt is expected to hover around a still high level of 54 percent of GDP, and the total public debt service-to-revenue ratio is projected to increase above 45 percent in the long run. Additional fiscal adjustment could set these indicators on a more favorable path.
11. The authorities agreed with the thrust of the analysis, but deemed staff’s macroeconomic projections too pessimistic. In particular, they stressed that the growth outturn for 2013 is likely to be revised upward and saw stronger economic growth also for 2014.
15
25
35
45
55
2014 2019 2024 2029 2034
baseline
alternative
Public Debt Service-to-Revenue Ratio
15
25
35
45
55
65
75
2014 2019 2024 2029 2034
baseline
alternative
Public Debt-to-GDP Ratio
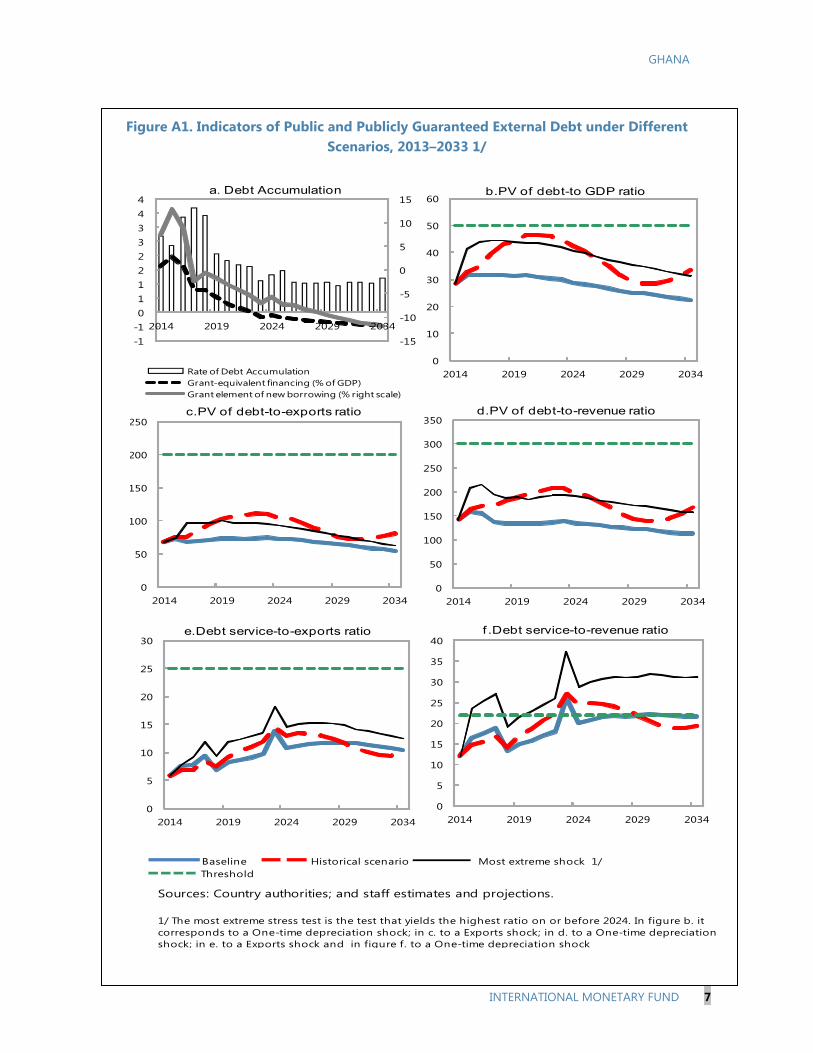
GHANA
INTERNATIONAL MONETARY FUND 7
Sources: Country authorities; and staff estimates and projections.
Baseline Historical scenario Most extreme shock 1/ Threshold
1/ The most extreme stress test is the test that yields the highest ratio on or before 2024. In figure b. it corresponds to a One-time depreciation shock; in c. to a Exports shock; in d. to a One-time depreciation shock; in e. to a Exports shock and in figure f. to a One-time depreciation shock
0
5
10
15
20
25
30
35
40
2014 2019 2024 2029 2034
f .Debt service-to-revenue ratio
-15
-10
-5
0
5
10
15
-1-1011223344
2014 2019 2024 2029 2034
Rate of Debt AccumulationGrant-equivalent financing (% of GDP)Grant element of new borrowing (% right scale)
a. Debt Accumulation
0
50
100
150
200
250
2014 2019 2024 2029 2034
c.PV of debt-to-exports ratio
0
10
20
30
40
50
60
2014 2019 2024 2029 2034
b.PV of debt-to GDP ratio
0
50
100
150
200
250
300
350
2014 2019 2024 2029 2034
d.PV of debt-to-revenue ratio
0
5
10
15
20
25
30
2014 2019 2024 2029 2034
e.Debt service-to-exports ratio
Figure A1. Indicators of Public and Publicly Guaranteed External Debt under Different
Scenarios, 2013–2033 1/
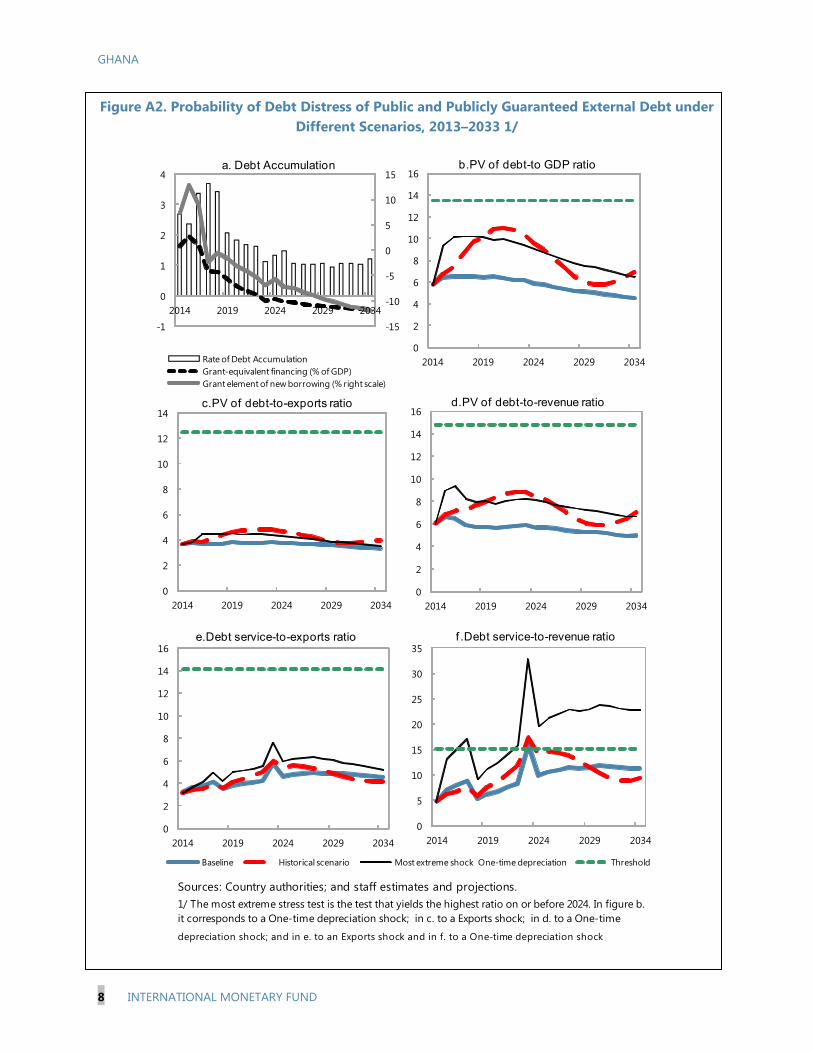
GHANA
8 INTERNATIONAL MONETARY FUND
Figure A2. Probability of Debt Distress of Public and Publicly Guaranteed External Debt under Different Scenarios, 2013–2033 1/
Sources: Country authorities; and staff estimates and projections.
depreciation shock; and in e. to an Exports shock and in f. to a One-time depreciation shock
1/ The most extreme stress test is the test that yields the highest ratio on or before 2024. In figure b. it corresponds to a One-time depreciation shock; in c. to a Exports shock; in d. to a One-time
0
5
10
15
20
25
30
35
2014 2019 2024 2029 2034
Baseline Historical scenario Most extreme shock One-time depreciation Threshold
f .Debt service-to-revenue ratio
-15
-10
-5
0
5
10
15
-1
0
1
2
3
4
2014 2019 2024 2029 2034
Rate of Debt AccumulationGrant-equivalent financing (% of GDP)Grant element of new borrowing (% right scale)
a. Debt Accumulation
0
2
4
6
8
10
12
14
16
2014 2019 2024 2029 2034
b.PV of debt-to GDP ratio
0
2
4
6
8
10
12
14
2014 2019 2024 2029 2034
c.PV of debt-to-exports ratio
0
2
4
6
8
10
12
14
16
2014 2019 2024 2029 2034
d.PV of debt-to-revenue ratio
0
2
4
6
8
10
12
14
16
2014 2019 2024 2029 2034
e.Debt service-to-exports ratio

GHANA
INTERNATIONAL MONETARY FUND 9
Figure A3. Indicators of Public Debt under Different Scenarios, 2013–2033 1/
Sources: Country authorities; and staff estimates and projections.1/ The most extreme stress test is the test that yields the highest ratio on or before 2024. 2/ Revenues are defined inclusive of grants.
BaselinePublic debt benchmark
Most extreme shock 1/Historical scenario
Fix Primary Balance
0
100
200
300
400
500
600
700
2014 2016 2018 2020 2022 2024 2026 2028 2030 2032 2034
PV of Debt-to-Revenue Ratio 2/
0
20
40
60
80
100
120
140
2014 2016 2018 2020 2022 2024 2026 2028 2030 2032 2034
PV of Debt-to-GDP Ratio
0
20
40
60
80
100
120
2014 2016 2018 2020 2022 2024 2026 2028 2030 2032 2034
Debt Service-to-Revenue Ratio
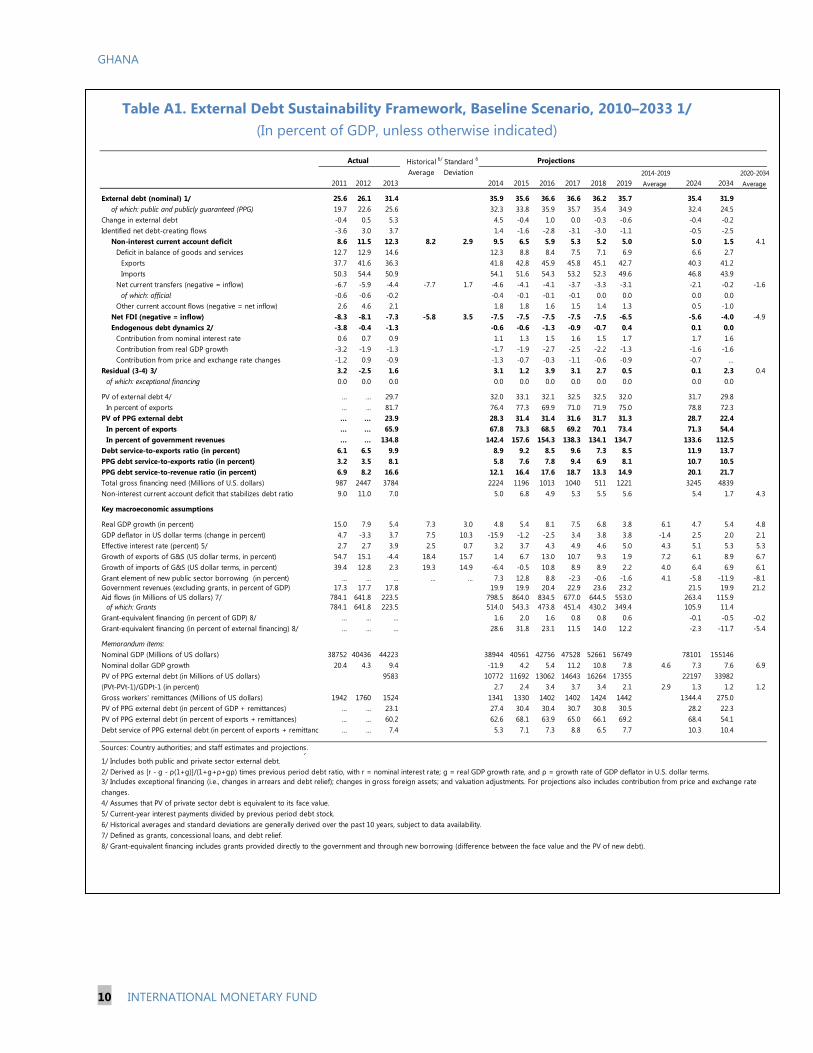
GHANA
10 INTERNATIONAL MONETARY FUND
Table A1. External Debt Sustainability Framework, Baseline Scenario, 2010–2033 1/ (In percent of GDP, unless otherwise indicated)
Historical 6/ Standard 6/
Average Deviation 2014-2019 2020-20342011 2012 2013 2014 2015 2016 2017 2018 2019 Average 2024 2034 Average
External debt (nominal) 1/ 25.6 26.1 31.4 35.9 35.6 36.6 36.6 36.2 35.7 35.4 31.9of which: public and publicly guaranteed (PPG) 19.7 22.6 25.6 32.3 33.8 35.9 35.7 35.4 34.9 32.4 24.5
Change in external debt -0.4 0.5 5.3 4.5 -0.4 1.0 0.0 -0.3 -0.6 -0.4 -0.2Identified net debt-creating flows -3.6 3.0 3.7 1.4 -1.6 -2.8 -3.1 -3.0 -1.1 -0.5 -2.5
Non-interest current account deficit 8.6 11.5 12.3 8.2 2.9 9.5 6.5 5.9 5.3 5.2 5.0 5.0 1.5 4.1Deficit in balance of goods and services 12.7 12.9 14.6 12.3 8.8 8.4 7.5 7.1 6.9 6.6 2.7
Exports 37.7 41.6 36.3 41.8 42.8 45.9 45.8 45.1 42.7 40.3 41.2Imports 50.3 54.4 50.9 54.1 51.6 54.3 53.2 52.3 49.6 46.8 43.9
Net current transfers (negative = inflow) -6.7 -5.9 -4.4 -7.7 1.7 -4.6 -4.1 -4.1 -3.7 -3.3 -3.1 -2.1 -0.2 -1.6of which: official -0.6 -0.6 -0.2 -0.4 -0.1 -0.1 -0.1 0.0 0.0 0.0 0.0
Other current account flows (negative = net inflow) 2.6 4.6 2.1 1.8 1.8 1.6 1.5 1.4 1.3 0.5 -1.0Net FDI (negative = inflow) -8.3 -8.1 -7.3 -5.8 3.5 -7.5 -7.5 -7.5 -7.5 -7.5 -6.5 -5.6 -4.0 -4.9Endogenous debt dynamics 2/ -3.8 -0.4 -1.3 -0.6 -0.6 -1.3 -0.9 -0.7 0.4 0.1 0.0
Contribution from nominal interest rate 0.6 0.7 0.9 1.1 1.3 1.5 1.6 1.5 1.7 1.7 1.6Contribution from real GDP growth -3.2 -1.9 -1.3 -1.7 -1.9 -2.7 -2.5 -2.2 -1.3 -1.6 -1.6Contribution from price and exchange rate changes -1.2 0.9 -0.9 -1.3 -0.7 -0.3 -1.1 -0.6 -0.9 -0.7 ...
Residual (3-4) 3/ 3.2 -2.5 1.6 3.1 1.2 3.9 3.1 2.7 0.5 0.1 2.3 0.4of which: exceptional financing 0.0 0.0 0.0 0.0 0.0 0.0 0.0 0.0 0.0 0.0 0.0
PV of external debt 4/ ... ... 29.7 32.0 33.1 32.1 32.5 32.5 32.0 31.7 29.8In percent of exports ... ... 81.7 76.4 77.3 69.9 71.0 71.9 75.0 78.8 72.3
PV of PPG external debt ... ... 23.9 28.3 31.4 31.4 31.6 31.7 31.3 28.7 22.4In percent of exports ... ... 65.9 67.8 73.3 68.5 69.2 70.1 73.4 71.3 54.4In percent of government revenues ... ... 134.8 142.4 157.6 154.3 138.3 134.1 134.7 133.6 112.5
Debt service-to-exports ratio (in percent) 6.1 6.5 9.9 8.9 9.2 8.5 9.6 7.3 8.5 11.9 13.7PPG debt service-to-exports ratio (in percent) 3.2 3.5 8.1 5.8 7.6 7.8 9.4 6.9 8.1 10.7 10.5PPG debt service-to-revenue ratio (in percent) 6.9 8.2 16.6 12.1 16.4 17.6 18.7 13.3 14.9 20.1 21.7Total gross financing need (Millions of U.S. dollars) 987 2447 3784 2224 1196 1013 1040 511 1221 3245 4839Non-interest current account deficit that stabilizes debt ratio 9.0 11.0 7.0 5.0 6.8 4.9 5.3 5.5 5.6 5.4 1.7 4.3
Key macroeconomic assumptions
Real GDP growth (in percent) 15.0 7.9 5.4 7.3 3.0 4.8 5.4 8.1 7.5 6.8 3.8 6.1 4.7 5.4 4.8GDP deflator in US dollar terms (change in percent) 4.7 -3.3 3.7 7.5 10.3 -15.9 -1.2 -2.5 3.4 3.8 3.8 -1.4 2.5 2.0 2.1Effective interest rate (percent) 5/ 2.7 2.7 3.9 2.5 0.7 3.2 3.7 4.3 4.9 4.6 5.0 4.3 5.1 5.3 5.3Growth of exports of G&S (US dollar terms, in percent) 54.7 15.1 -4.4 18.4 15.7 1.4 6.7 13.0 10.7 9.3 1.9 7.2 6.1 8.9 6.7Growth of imports of G&S (US dollar terms, in percent) 39.4 12.8 2.3 19.3 14.9 -6.4 -0.5 10.8 8.9 8.9 2.2 4.0 6.4 6.9 6.1Grant element of new public sector borrowing (in percent) ... ... ... ... ... 7.3 12.8 8.8 -2.3 -0.6 -1.6 4.1 -5.8 -11.9 -8.1Government revenues (excluding grants, in percent of GDP) 17.3 17.7 17.8 19.9 19.9 20.4 22.9 23.6 23.2 21.5 19.9 21.2Aid flows (in Millions of US dollars) 7/ 784.1 641.8 223.5 798.5 864.0 834.5 677.0 644.5 553.0 263.4 115.9
of which: Grants 784.1 641.8 223.5 514.0 543.3 473.8 451.4 430.2 349.4 105.9 11.4Grant-equivalent financing (in percent of GDP) 8/ ... ... ... 1.6 2.0 1.6 0.8 0.8 0.6 -0.1 -0.5 -0.2Grant-equivalent financing (in percent of external financing) 8/ ... ... ... 28.6 31.8 23.1 11.5 14.0 12.2 -2.3 -11.7 -5.4
Memorandum items:Nominal GDP (Millions of US dollars) 38752 40436 44223 38944 40561 42756 47528 52661 56749 78101 155146Nominal dollar GDP growth 20.4 4.3 9.4 -11.9 4.2 5.4 11.2 10.8 7.8 4.6 7.3 7.6 6.9PV of PPG external debt (in Millions of US dollars) 9583 10772 11692 13062 14643 16264 17355 22197 33982(PVt-PVt-1)/GDPt-1 (in percent) 2.7 2.4 3.4 3.7 3.4 2.1 2.9 1.3 1.2 1.2Gross workers' remittances (Millions of US dollars) 1942 1760 1524 1341 1330 1402 1402 1424 1442 1344.4 275.0PV of PPG external debt (in percent of GDP + remittances) ... ... 23.1 27.4 30.4 30.4 30.7 30.8 30.5 28.2 22.3PV of PPG external debt (in percent of exports + remittances) ... ... 60.2 62.6 68.1 63.9 65.0 66.1 69.2 68.4 54.1Debt service of PPG external debt (in percent of exports + remittanc ... ... 7.4 5.3 7.1 7.3 8.8 6.5 7.7 10.3 10.4
Sources: Country authorities; and staff estimates and projections.Ja ua y 001/ Includes both public and private sector external debt.
4/ Assumes that PV of private sector debt is equivalent to its face value.5/ Current-year interest payments divided by previous period debt stock. 6/ Historical averages and standard deviations are generally derived over the past 10 years, subject to data availability. 7/ Defined as grants, concessional loans, and debt relief.8/ Grant-equivalent financing includes grants provided directly to the government and through new borrowing (difference between the face value and the PV of new debt).
Actual Projections
2/ Derived as [r - g - ρ(1+g)]/(1+g+ρ+gρ) times previous period debt ratio, with r = nominal interest rate; g = real GDP growth rate, and ρ = growth rate of GDP deflator in U.S. dollar terms. 3/ Includes exceptional financing (i.e., changes in arrears and debt relief); changes in gross foreign assets; and valuation adjustments. For projections also includes contribution from price and exchange rate changes.

GHANA
INTERNATIONAL MONETARY FUND 11
Table A2. Public Sector Debt Sustainability Framework, Baseline Scenario, 2010–2033 (In percent of GDP, unless otherwise indicated)
Estimate
2011 2012 2013 Average5/ Standard
Deviation
5/
2014 2015 2016 2017 2018 20192014-19 Average 2024 2034
2020-34 Average
Public sector debt 1/ 42.5 51.2 57.4 64.2 67.2 68.1 63.9 60.9 59.6 57.3 55.9of which: foreign-currency denominated 19.7 22.6 25.6 32.3 33.8 35.9 35.7 35.4 34.9 32.4 24.5
Public sector debt, exscluding domestic arrears 39.5 48.0 54.3 63.7 67.2 68.1 63.9 60.9 59.6 57.3 55.9
Change in public sector debt -3.2 8.7 6.2 6.8 3.0 0.9 -4.2 -3.0 -1.3 0.2 -0.1Identified debt-creating flows -3.9 6.5 5.9 6.5 5.2 -1.2 -3.5 -3.2 -1.5 -0.6 -0.1
Primary deficit 1.3 8.8 5.6 4.1 2.6 3.6 2.7 1.5 -0.8 -0.9 -1.0 0.9 0.6 0.6 0.3Revenue and grants 19.3 19.3 18.3 21.2 21.3 21.5 23.8 24.4 23.9 21.6 19.9
of which: grants 2.0 1.6 0.5 1.3 1.3 1.1 0.9 0.8 0.6 0.1 0.0Primary (noninterest) expenditure 20.6 28.1 23.9 24.8 24.0 23.0 23.1 23.5 22.9 22.2 20.5
Automatic debt dynamics -6.1 -2.2 0.3 2.9 2.6 -2.7 -2.7 -2.3 -0.5 -1.2 -0.8Contribution from interest rate/growth differential -6.1 -2.8 -0.6 -0.1 -0.4 -2.3 -2.1 -1.6 0.1 -0.4 -0.8
of which: contribution from average real interest rate -0.2 0.3 2.0 2.5 2.9 2.8 2.6 2.4 2.4 2.2 2.1of which: contribution from real GDP growth -6.0 -3.1 -2.6 -2.6 -3.3 -5.0 -4.7 -4.0 -2.2 -2.6 -2.9
Contribution from real exchange rate depreciation 0.1 0.6 0.9 3.0 3.0 -0.4 -0.5 -0.6 -0.6 ... ...Other identified debt-creating flows 0.8 -0.1 0.0 -0.1 -0.1 -0.1 -0.1 -0.1 0.0 0.0 0.0
Privatization receipts (negative) 1.0 0.0 0.0 0.0 0.0 0.0 0.0 0.0 0.0 0.0 0.0Recognition of implicit or contingent liabilities 0.0 0.0 0.0 0.0 0.0 0.0 0.0 0.0 0.0 0.0 0.0Debt relief (HIPC and other) -0.2 -0.1 0.0 -0.1 -0.1 -0.1 -0.1 -0.1 0.0 0.0 0.0Other (specify, e.g. bank recapitalization) 0.0 0.0 0.0 0.0 0.0 0.0 0.0 0.0 0.0 0.0 0.0
Residual, including asset changes 0.8 2.2 0.3 0.4 -2.2 2.1 -0.7 0.3 0.2 0.8 0.0
Other Sustainability IndicatorsPV of public sector debt ... ... 55.7 60.3 64.8 63.6 59.8 57.2 56.0 53.6 53.7
of which: foreign-currency denominated ... ... 23.9 28.3 31.4 31.4 31.6 31.7 31.3 28.7 22.4of which: external ... ... 23.9 28.3 31.4 31.4 31.6 31.7 31.3 28.7 22.4
PV of contingent liabilities (not included in public sector debt) ... ... ... ... ... ... ... ... ... ... ...Gross financing need 2/ 11.3 18.9 20.8 20.2 22.5 21.5 19.1 16.0 15.2 16.3 19.2PV of public sector debt-to-revenue and grants ratio (in percent) … … 305.0 284.1 304.6 296.1 250.9 234.0 234.6 247.7 269.8PV of public sector debt-to-revenue ratio (in percent) … … 313.6 302.9 325.1 312.2 261.3 242.1 240.8 249.3 269.9
of which: external 3/ … … 134.8 142.4 157.6 154.3 138.3 134.1 134.7 133.6 112.5Debt service-to-revenue and grants ratio (in percent) 4/ 25.4 28.1 50.1 46.7 48.3 46.8 43.2 34.8 34.8 38.3 44.8Debt service-to-revenue ratio (in percent) 4/ 28.4 30.6 51.5 49.8 51.6 49.4 45.0 36.0 35.8 38.5 44.8Primary deficit that stabilizes the debt-to-GDP ratio 4.5 0.1 -0.6 -3.2 -0.3 0.7 3.5 2.0 0.3 0.4 0.8
Key macroeconomic and fiscal assumptionsReal GDP growth (in percent) 15.0 7.9 5.4 7.3 3.0 4.8 5.4 8.1 7.5 6.8 3.8 6.1 4.7 5.4 4.8Average nominal interest rate on forex debt (in percent) 3.6 2.9 4.5 1.1 1.8 3.9 4.1 4.5 4.9 4.7 5.1 4.5 5.5 6.8 6.0Average real interest rate on domestic debt (in percent) -1.9 0.5 5.2 -0.6 4.3 6.5 7.2 6.4 5.5 5.9 5.5 6.2 5.0 3.4 4.0Real exchange rate depreciation (in percent, + indicates depreciation 0.4 3.0 3.9 -3.6 7.7 12.0 9.5 -1.2 -1.6 -1.8 -1.7 2.5 -2.4 0.0 0.0Inflation rate (GDP deflator, in percent) 13.0 13.3 12.3 16.2 5.0 13.1 11.2 9.4 9.4 9.3 9.0 10.2 6.8 6.6 6.8Growth of real primary spending (deflated by GDP deflator, in percen 0.1 0.5 -0.1 0.1 0.2 0.1 0.0 0.0 0.1 0.1 0.0 0.1 0.1 0.0 0.0Grant element of new external borrowing (in percent) ... ... ... … … 7.3 12.8 8.8 -2.3 -0.6 -1.6 4.1 -5.8 -11.9 ...
Sources: Country authorities; and staff estimates and projections.1/ [Indicate coverage of public sector, e.g., general government or nonfinancial public sector. Also whether net or gross debt is used.]2/ Gross financing need is defined as the primary deficit plus debt service plus the stock of short-term debt at the end of the last period. 3/ Revenues excluding grants.4/ Debt service is defined as the sum of interest and amortization of medium and long-term debt.5/ Historical averages and standard deviations are generally derived over the past 10 years, subject to data availability.
Actual Projections

GHANA
12 INTERNATIONAL MONETARY FUND
Table A3. Sensitivity Analysis for Key Indicators of Public and Publicly Guaranteed External
Debt, 2013–2033
2014 2015 2016 2017 2018 2019 2024 2034
Baseline 28 31 31 32 32 31 29 22
A. Alternative Scenarios
A1. Key variables at their historical averages in 2014-2034 1/ 28 33 35 39 43 44 42 33A2. New public sector loans on less favorable terms in 2014-2034 /2 28 30 33 34 35 35 37 37
B. Bound Tests
B1. Real GDP growth at historical average minus one standard deviation in 2015-2016 28 29 32 32 32 32 30 23B2. Export value growth at historical average minus one standard deviation in 2015-2016 3/ 28 31 39 39 38 37 33 23B3. US dollar GDP deflator at historical average minus one standard deviation in 2015-2016 28 29 31 31 32 31 29 22B4. Net non-debt creating flows at historical average minus one standard deviation in 2015-2016 4/ 28 33 38 38 38 37 32 23B5. Combination of B1-B4 using one-half standard deviation shocks 28 26 27 27 27 27 26 20B6. One-time 30 percent nominal depreciation relative to the baseline in 2015 5/ 28 41 44 44 44 44 41 31
Baseline 68 73 68 69 70 73 71 54
A. Alternative Scenarios
A1. Key variables at their historical averages in 2014-2034 1/ 68 76 76 86 95 103 105 81A2. New public sector loans on less favorable terms in 2014-2034 /2 68 71 73 75 78 83 91 89
B. Bound Tests
B1. Real GDP growth at historical average minus one standard deviation in 2015-2016 68 67 67 67 68 72 71 53B2. Export value growth at historical average minus one standard deviation in 2015-2016 3/ 68 74 97 97 97 100 92 63B3. US dollar GDP deflator at historical average minus one standard deviation in 2015-2016 68 67 67 67 68 72 71 53B4. Net non-debt creating flows at historical average minus one standard deviation in 2015-2016 4/ 68 76 83 83 83 86 80 55B5. Combination of B1-B4 using one-half standard deviation shocks 68 62 61 62 63 67 67 52B6. One-time 30 percent nominal depreciation relative to the baseline in 2015 5/ 68 67 67 67 68 72 71 53
Baseline 142 158 154 138 134 135 134 112
A. Alternative Scenarios
A1. Key variables at their historical averages in 2014-2034 1/ 142 164 170 171 182 188 197 168A2. New public sector loans on less favorable terms in 2014-2034 /2 142 152 164 150 149 152 170 184
B. Bound Tests
B1. Real GDP growth at historical average minus one standard deviation in 2015-2016 142 146 157 141 137 138 139 115B2. Export value growth at historical average minus one standard deviation in 2015-2016 3/ 142 154 191 170 163 161 151 114B3. US dollar GDP deflator at historical average minus one standard deviation in 2015-2016 142 147 153 138 134 134 135 112B4. Net non-debt creating flows at historical average minus one standard deviation in 2015-2016 4/ 142 164 187 166 159 158 149 113B5. Combination of B1-B4 using one-half standard deviation shocks 142 132 131 118 115 117 120 102B6. One-time 30 percent nominal depreciation relative to the baseline in 2015 5/ 142 208 215 193 188 189 190 158
PV of debt-to-exports ratio
PV of debt-to-revenue ratio
PV of debt-to GDP ratio
Projections

GHANA
INTERNATIONAL MONETARY FUND 13
Table A3. Sensitivity Analysis for Key Indicators of Public and Publicly Guaranteed External Debt, 2013–2033 (continued)
Baseline 6 8 8 9 7 8 11 10
A. Alternative Scenarios
A1. Key variables at their historical averages in 2014-2034 1/ 6 7 7 8 7 9 13 9A2. New public sector loans on less favorable terms in 2014-2034 /2 6 8 7 8 6 7 11 17
B. Bound Tests
B1. Real GDP growth at historical average minus one standard deviation in 2015-2016 6 8 8 9 7 8 11 10B2. Export value growth at historical average minus one standard deviation in 2015-2016 3/ 6 8 9 12 9 12 15 12B3. US dollar GDP deflator at historical average minus one standard deviation in 2015-2016 6 8 8 9 7 8 11 10B4. Net non-debt creating flows at historical average minus one standard deviation in 2015-2016 4/ 6 8 8 10 8 10 13 11B5. Combination of B1-B4 using one-half standard deviation shocks 6 7 8 9 6 7 10 10B6. One-time 30 percent nominal depreciation relative to the baseline in 2015 5/ 6 8 8 9 7 8 11 10
Baseline 12 16 18 19 13 15 20 22
A. Alternative Scenarios
A1. Key variables at their historical averages in 2014-2034 1/ 12 15 16 17 14 17 24 19A2. New public sector loans on less favorable terms in 2014-2034 /2 12 16 16 17 11 13 20 34
B. Bound Tests
B1. Real GDP growth at historical average minus one standard deviation in 2015-2016 12 17 18 20 14 16 21 23B2. Export value growth at historical average minus one standard deviation in 2015-2016 3/ 12 16 18 21 16 19 24 23B3. US dollar GDP deflator at historical average minus one standard deviation in 2015-2016 12 17 18 19 14 15 21 22B4. Net non-debt creating flows at historical average minus one standard deviation in 2015-2016 4/ 12 16 19 21 16 19 23 22B5. Combination of B1-B4 using one-half standard deviation shocks 12 16 16 17 12 13 18 20B6. One-time 30 percent nominal depreciation relative to the baseline in 2015 5/ 12 23 25 27 19 21 29 31
Memorandum item:Grant element assumed on residual financing (i.e., financing required above baseline) 6/ -14 -14 -14 -14 -14 -14 -14 -14
Sources: Country authorities; and staff estimates and projections.
1/ Variables include real GDP growth, growth of GDP deflator (in U.S. dollar terms), non-interest current account in percent of GDP, and non-debt creating flows.
4/ Includes official and private transfers and FDI.5/ Depreciation is defined as percentage decline in dollar/local currency rate, such that it never exceeds 100 percent.6/ Applies to all stress scenarios except for A2 (less favorable financing) in which the terms on all new financing are as specified in footnote 2.
3/ Exports values are assumed to remain permanently at the lower level, but the current account as a share of GDP is assumed to return to its baseline level after
Debt service-to-revenue ratio
2/ Assumes that the interest rate on new borrowing is by 2 percentage points higher than in the baseline., while grace and maturity periods are the same as in the baseline.
Debt service-to-exports ratio
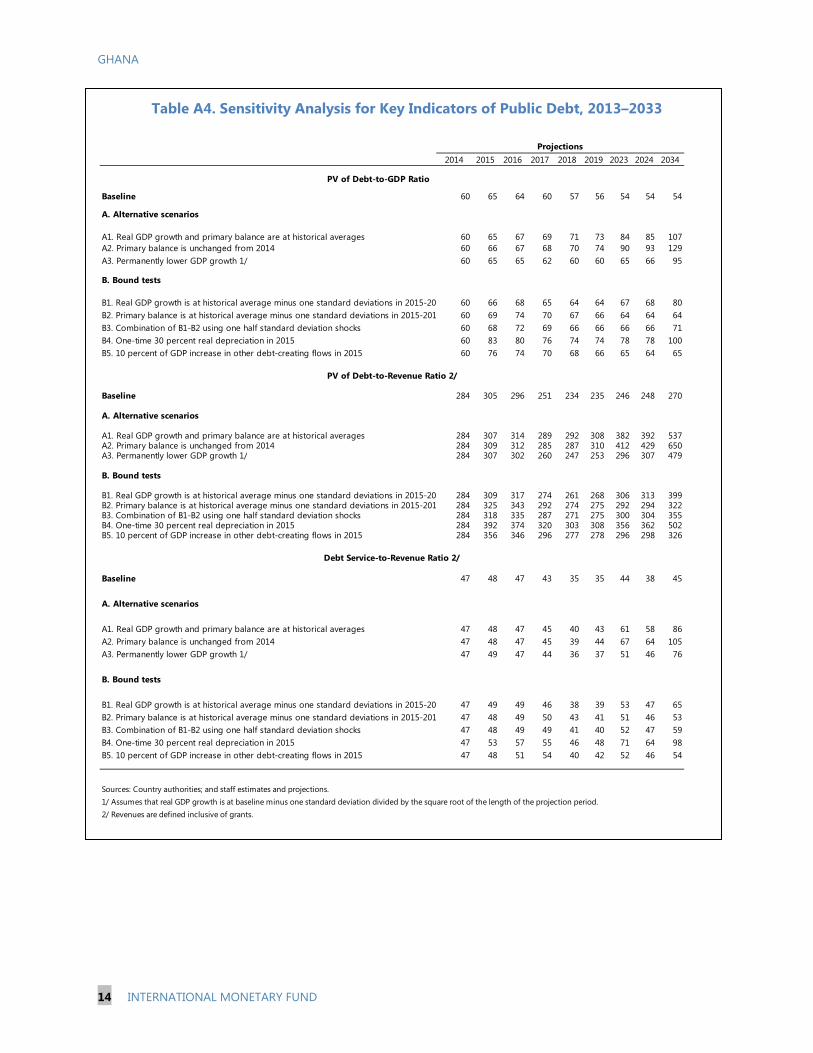
GHANA
14 INTERNATIONAL MONETARY FUND
Table A4. Sensitivity Analysis for Key Indicators of Public Debt, 2013–2033
2014 2015 2016 2017 2018 2019 2023 2024 2034
Baseline 60 65 64 60 57 56 54 54 54
A. Alternative scenarios
A1. Real GDP growth and primary balance are at historical averages 60 65 67 69 71 73 84 85 107A2. Primary balance is unchanged from 2014 60 66 67 68 70 74 90 93 129A3. Permanently lower GDP growth 1/ 60 65 65 62 60 60 65 66 95
B. Bound tests
B1. Real GDP growth is at historical average minus one standard deviations in 2015-20 60 66 68 65 64 64 67 68 80B2. Primary balance is at historical average minus one standard deviations in 2015-201 60 69 74 70 67 66 64 64 64B3. Combination of B1-B2 using one half standard deviation shocks 60 68 72 69 66 66 66 66 71B4. One-time 30 percent real depreciation in 2015 60 83 80 76 74 74 78 78 100B5. 10 percent of GDP increase in other debt-creating flows in 2015 60 76 74 70 68 66 65 64 65
Baseline 284 305 296 251 234 235 246 248 270
A. Alternative scenarios
A1. Real GDP growth and primary balance are at historical averages 284 307 314 289 292 308 382 392 537A2. Primary balance is unchanged from 2014 284 309 312 285 287 310 412 429 650A3. Permanently lower GDP growth 1/ 284 307 302 260 247 253 296 307 479
B. Bound tests
B1. Real GDP growth is at historical average minus one standard deviations in 2015-20 284 309 317 274 261 268 306 313 399B2. Primary balance is at historical average minus one standard deviations in 2015-201 284 325 343 292 274 275 292 294 322B3. Combination of B1-B2 using one half standard deviation shocks 284 318 335 287 271 275 300 304 355B4. One-time 30 percent real depreciation in 2015 284 392 374 320 303 308 356 362 502B5. 10 percent of GDP increase in other debt-creating flows in 2015 284 356 346 296 277 278 296 298 326
Baseline 47 48 47 43 35 35 44 38 45
A. Alternative scenarios
A1. Real GDP growth and primary balance are at historical averages 47 48 47 45 40 43 61 58 86A2. Primary balance is unchanged from 2014 47 48 47 45 39 44 67 64 105A3. Permanently lower GDP growth 1/ 47 49 47 44 36 37 51 46 76
B. Bound tests
B1. Real GDP growth is at historical average minus one standard deviations in 2015-20 47 49 49 46 38 39 53 47 65B2. Primary balance is at historical average minus one standard deviations in 2015-201 47 48 49 50 43 41 51 46 53B3. Combination of B1-B2 using one half standard deviation shocks 47 48 49 49 41 40 52 47 59B4. One-time 30 percent real depreciation in 2015 47 53 57 55 46 48 71 64 98B5. 10 percent of GDP increase in other debt-creating flows in 2015 47 48 51 54 40 42 52 46 54
Sources: Country authorities; and staff estimates and projections.1/ Assumes that real GDP growth is at baseline minus one standard deviation divided by the square root of the length of the projection period.2/ Revenues are defined inclusive of grants.
PV of Debt-to-GDP Ratio
Projections
PV of Debt-to-Revenue Ratio 2/
Debt Service-to-Revenue Ratio 2/

Statement by the IMF Staff Representative May 7, 2014
This statement provides information on recent economic developments in Ghana that updates information provided in the staff report issued to the Board on April 22, 2014. These developments do not change the thrust of the staff appraisal. Data released in April reveal stronger-than-anticipated growth in 2012 and 2013. The Ghanaian Statistical Service (GSS) released revised GDP data for the first three quarters of 2013 and preliminary data for the fourth quarter and the full year, implying an annual growth rate of 7.1 percent. The report also presented revisions to the 2012 GDP data, with an upward revision in growth from 7.9 to 8.8 percent. GSS attributed the revisions to more comprehensive information received from the major data collection sources (the Ministries of Agriculture and Fisheries and the Forestry and Minerals Commissions). The revisions reflect a stronger performance in the first half of the year, followed by a deceleration in the second half (albeit to a much lesser degree than suggested by the earlier estimates). Contributions to growth of the industrial sector in the first and second quarter were revised to 2.4 and 6.0 percent, respectively (against -0.2 and 0.7 percent in the previous estimates). The main contributors to the upward revisions for the first half of 2013 were mining and quarrying in Q1 and manufacturing and construction in Q2. Growth in the oil, manufacturing, and construction sectors, however, decelerated significantly in the second half of the year, driving industrial sector growth to -1.6 percent (-0.4 percent contribution to growth) in Q4, while growth in the services sector also declined. The higher 2013 GDP figure implies somewhat lower fiscal and current account deficits, as a share of GDP, in both 2013 and 2014 (Table 1). Staff maintains its GDP growth estimates for 2014 unchanged at 4.8 percent, closely aligned with the revised growth rates for the third and fourth quarters of 2013. On this basis, the 2014 overall fiscal deficit is now projected at 9.4 percent of GDP (around 0.8 percentage points below previous projections). The medium-term outlook through 2019 remains broadly unchanged. The update does not alter staff’s recommendation for additional fiscal adjustment. While the projected 2014 fiscal deficit is now closer to the government’s own target of 8.5 percent of GDP, a more ambitious and front-loaded consolidation path would generate savings on interest payments, reduce gross financing needs, and expedite the reduction of external vulnerabilities.
Year Quarter Provisional Revised
2012 1 10.3 9.42 9.1 9.93 7.0 6.74 6.0 9.5
Annual 7.9 8.82013 1 6.7 9
2 6.1 10.93 0.3 4.94 … 4.9
Annual … 7.1
GDP Growth, 2012-13(year-on-year, in percent)

2
Article IV 2014
Rev.Article IV
2014Rev.
Article IV 2014
Rev.
(Annual percentage change; unless otherwise indicated)
National account and pricesGDP at constant prices 7.9 8.8 5.4 7.1 4.8 4.8Real GDP (nonoil) 7.8 8.1 3.9 6.5 4.5 4.5Real GDP per capita 5.2 6.1 2.8 4.5 2.2 2.2GDP deflator 13.3 15.2 12.3 16.4 13.1 13.0Consumer price index (annual average) 9.2 9.2 11.7 11.7 13.0 13.0Consumer price index (end of period) 8.8 8.8 13.5 13.5 12.3 12.3Consumer price index (excl. food, annual average) 11.6 11.6 18.1 18.1 12.1 12.1
Money and creditCredit to the private sector 32.9 32.9 29.0 29.0 16.9 17.8Broad money (M2+) 24.3 24.3 19.1 19.1 20.4 21.2Velocity (non-oil GDP/M2, end of period) 3.9 4.0 3.9 4.2 3.8 4.1Base money 36.0 36.0 15.1 15.1 17.9 18.8Banks' lending rate (weighted average; percent) 25.7 25.7 25.6 25.6 … …Policy rate (in percent, end of period) 15.0 15.0 16.0 16.0 … …
National accountsGross capital formation 29.0 28.3 33.4 33.0 33.1 32.5
Government 6.8 6.6 6.4 6.0 9.1 8.5Private 22.2 21.7 27.0 27.0 24.0 24.0
National savings 26.2 28.0 20.2 20.7 22.9 22.4Government 2.9 2.8 1.5 1.4 3.6 3.5Private1 23.3 25.2 18.8 19.4 19.3 18.8
Foreign savings -12.2 -11.9 -13.2 -12.3 -10.5 -10.2
External sectorCurrent account balance -12.2 -11.9 -13.2 -12.3 -10.5 -10.2
(including official grants) -12.2 -11.9 -13.2 -12.3 -10.5 -10.2(excluding official grants) -12.8 -12.5 -13.4 -12.5 -10.9 -10.5
External public debt (including IMF) 22.6 22.1 25.6 23.8 32.3 29.9NPV of external debt outstanding 10.2 9.9 9.1 8.4 10.1 9.3
percent of exports of goods and services 24.4 24.4 25.0 25.0 24.0 24.0Gross international reserves (millions of US$) 5,349 5,349 5,632 5,632 4,706 4,738
Months of prospective imports of goods and services 2.9 2.9 3.2 3.2 2.7 2.7Total donor support (millions of US$) 1,132 1,132 940 940 1,110 1,110
percent of GDP 2.8 2.7 2.1 2.0 2.9 2.6
Central government budgetRevenue 19.1 18.6 18.0 16.7 20.8 19.5Expenditure 31.0 30.2 29.0 26.8 31.1 28.9Overall balance -12.0 -11.7 -10.9 -10.1 -10.2 -9.4Net domestic financing 9.5 9.2 7.2 6.7 7.3 6.7Central government debt (gross) 51.2 50.0 57.4 53.2 64.2 59.4
Domestic debt 28.6 27.9 31.7 29.4 31.9 29.5External debt 22.6 22.1 25.6 23.8 32.3 29.9
Central government debt (net) 49.1 47.9 54.8 48.2 61.9 57.3
Memorandum items:
Nominal GDP (millions of GHc) 73,109 74,959 86,596 93,461 102,631 110,676GDP per capita (U.S. dollars) 1,622 1,663 1,730 1,864 1,486 1,602
Sources: Ghanaian authorities; and Fund staff estimates and projections.1 Including public enterprises and errors and omissions.
(Percent of GDP)
Table 1. Ghana: Selected Economic and Financial Indicators, 2012–14
2012 2013 (Prel.) 2014 (Proj.)
(Percent of GDP)
Press Release No. 14/221 FOR IMMEDIATE RELEASE May 13, 2014
IMF Executive Board Concludes 2014 Article IV Consultation with Ghana On May 7, 2014, the Executive Board of the International Monetary Fund (IMF) concluded the Article IV consultation1 with Ghana. Ghana has experienced strong and broadly inclusive growth over the past two decades, and its medium-term prospects are supported by rising energy production. The country has outperformed regional peers in reducing poverty, with robust democratic credentials and a highly-rated business climate attracting significant foreign direct investment (FDI) and supporting economic growth. Expanding energy production over the medium term has the potential to generate new opportunities to channel resources into productive investment.
The emergence of large fiscal and external imbalances since 2012, however, has created significant challenges. A swift return to macroeconomic stability in 2013 was thwarted by weaker external and domestic conditions. Reflecting lower gold and cocoa exports, the current account deficit exceeded 12 percent of GDP. While recently revised estimates point to an only moderate slowdown in growth to about 7 percent, the fiscal deficit target of 9 percent of GDP was missed by about 1 percentage point, despite significant policy efforts. Inflation also overshot the 9 +/- 2 percent target range, prompting a further tightening of monetary policy in early 2014.
Ghana’ short-term economic outlook is subject to significant risks. Growth is projected to slow to 4¾ percent in 2014, as high interest rates and a weaker currency are compressing domestic demand. At the same time, the economy’s continued large twin deficits, and high financing needs, leave it vulnerable to a deterioration of external conditions.
1 Under Article IV of the IMF's Articles of Agreement, the IMF holds bilateral discussions with members, usually every year. A staff team visits the country, collects economic and financial information, and discusses with officials the country's economic developments and policies. On return to headquarters, the staff prepares a report, which forms the basis for discussion by the Executive Board.
International Monetary Fund 700 19th Street, NW Washington, D. C. 20431 USA
2
Executive Board Assessment2 Executive Directors commended Ghana’s strong and broadly inclusive growth and declining poverty over the past two decades, and supported the government’s transformation agenda, focused on economic diversification, social inclusion, and macroeconomic stability. Directors, however, expressed concern over the emergence of significant short-term vulnerabilities stemming from high fiscal and external current account deficits. These imbalances make the country vulnerable to a deterioration of external conditions and are creating pressure on interest rates and the exchange rate. If unaddressed, they risk weakening economic growth and public debt sustainability. Directors emphasized that macroeconomic stability will need to be restored to preserve a positive medium-term outlook. Directors commended the authorities’ policy efforts and supported the fiscal measures in the 2014 budget. They noted however that achieving the 2014 fiscal deficit target will be challenging, in light of high interest rates, a depreciating currency, and a possible growth slowdown. Directors therefore urged the authorities to take additional short-term measures to reduce the fiscal and external imbalances. Directors welcomed the government’s recent policy documents outlining its homegrown medium-term reform and consolidation measures. They supported the government’s intention to rationalize public spending, lower the wage bill, restructure the statutory funds, and enhance revenue mobilization and tax administration. They encouraged the authorities to translate their policy commitments quickly into specific and time-bound action plans to achieve significant and durable consolidation. In light of current imbalances, Directors recommended a more ambitious medium-term consolidation path to stabilize public debt and debt service at sustainable levels. While the risk of debt distress remains moderate, Directors expressed concerns about the high debt service-to-revenue ratio. A stronger medium-term adjustment could set off a virtuous cycle of lower fiscal deficits and falling interest rates, creating space for social and infrastructure spending and crowding-in of private sector activity. Directors welcomed the recent monetary policy tightening. They suggested that further tightening may be needed, in combination with fiscal consolidation, to steer inflation back into the target range. Directors stressed that the Bank of Ghana should limit its net credit to the government, strengthen liquidity management and the inflation forecasting framework, and continue to allow the exchange rate to adjust to prevent further erosion of the reserve buffer.
2 At the conclusion of the discussion, the Managing Director, as Chairman of the Board, summarizes the views of Executive Directors, and this summary is transmitted to the country's authorities. An explanation of any qualifiers used in summings up can be found here: http://www.imf.org/external/np/sec/misc/qualifiers.htm.

3
Directors emphasized that the new foreign exchange regulations will not be effective unless the underlying macroeconomic imbalances are resolved. In particular, they were concerned that the measures could have unintended adverse effects. They therefore welcomed the Bank of Ghana’s decision to review the measures with the objective of mitigating any adverse implications and removing the associated exchange restrictions. They also commended the Bank of Ghana for its steps toward adopting a unified, market-based exchange rate. Directors welcomed that the financial system is currently sound, adequately capitalized, and liquid. They stressed the need to monitor exposures closely, noting that a weaker macroeconomic outlook, rising interest rates, and currency depreciation expose the financial sector to credit and currency risks. Accordingly, Directors encouraged the authorities to strengthen their crisis prevention and management capabilities and welcomed recent actions to improve the bank supervision framework.

4
Ghana: Selected Economic and Financial Indicators, 2011-141 2011 2012 2013 2014Act. Act. Est. Proj.
(Annual percent change ; unless otherwise specified)
National account and prices GDP at constant prices 15.0 8.8 7.1 4.8Real GDP (nonoil) 9.4 8.1 6.5 4.5Real GDP per capita 12.1 6.1 4.5 2.2GDP deflator 13.0 15.2 16.4 13.0Consumer prices Consumer price index (annual average) 8.7 9.2 11.7 13.0Consumer price index (end of period) 8.6 8.8 13.5 12.3
Money and credit Credit to the private sector 29.0 32.9 29.0 17.8Broad money (M3, including foreign currency 29.3 24.3 19.1 21.2Velocity (GDP/M2, end of period) 3.9 4.0 4.2 4.1Base money 31.1 36.0 15.1 18.8Banks' lending rate (weighted average; percent) 25.9 25.7 25.6 …Policy rate (in percent, end of period) 12.5 15.0 16.0 …
(Percent of GDP)
External sector Current account balance
(including official grants) -9.1 -11.9 -12.3 -10.2(excluding official grants) -9.7 -12.5 -12.5 -10.5
External public debt (including IMF) 21.0 22.1 23.8 29.9NPV of external debt outstanding 10.9 9.9 8.4 9.3
percent of exports of goods and services 28.8 24.4 25.0 24.0Gross international reserves (mn. of US$) 5,383 5,349 5,632 4,738
Months of prospective Imp. of goods services 2.9 2.9 3.2 2.7Total donor support (millions of US$) 1,477 1,132 940 1,110
percent of GDP 2.5 2.7 2.0 2.6
Central government budget `
Revenue 19.1 18.6 16.7 19.5Expenditure 23.1 30.2 26.8 28.9Overall balance (financing basis) -4.0 -11.7 -10.1 -9.4Net domestic financing 3.3 9.2 6.7 6.7Central government debt (gross) 43.7 50.0 53.2 59.4
Domestic debt 22.8 27.9 29.4 29.5External debt 21.0 22.1 23.8 29.9
Central government debt (net) 39.9 47.9 48.2 57.3Memorandum items:
Nominal GDP (millions of GHc) 59,816 74,959 93,461 110,676GDP per capita (U.S. dollars) 1,594 1,663 1,864 1,602
Sources: Ghanaian authorities; and IMF staff estimates and projections. 1 Including deferred wage payments and discrepancies.

Statement by Jafar Mojarrad, Executive Director for Ghana
and Philip Abradu-Otoo, Advisor to Executive Director May 7, 2014
On behalf of the Ghanaian authorities, we would like to thank staff and management for their continued support to Ghana. The authorities appreciate the constructive engagement and policy dialogue with Ms. Daseking and her team during the Article IV consultation mission. They are also grateful for the recent opening of the Fund’s AFRITAC West II regional technical assistance center in Accra, which will help expand capacity building within the sub-region. Overview 1. Following the contested presidential and parliamentary elections in December 2012, the Supreme Court declared President Mahama victorious after nine months of proceedings. This has confirmed Ghana’s democratic credentials and helped dissipate uncertainty and lack of investor confidence during the period. 2. Ghana has experienced a long streak of relatively high and inclusive growth, which has helped reduce poverty and propel the country to middle-income status. This period has also seen temporary episodes of rising imbalances, resulting from both domestic and external factors, which were dealt with effectively, allowing the economy to resume growth at high and sustainable rates. The economy has entered anew into a similar episode since 2012, with widening fiscal and current account deficits, exchange rate pressures, high inflation, and high interest rates, exacerbating the fallout from unfavorable international environment and leading to a deceleration of growth in 2013. The authorities agree that these imbalances must be addressed decisively to restore stability and avoid the risk of jeopardizing Ghana’s transformation agenda. They have put forward a reform package encompassing short-term stabilization measures and pro-growth medium-term reforms to bring about a lasting improvement in macroeconomic performance.
3. To further signal their commitment to addressing the current economic challenges, and show resolve in implementing enough measures to bring the fiscal situation under control, the authorities presented a policy statement to the legislature in early April and subsequently followed it up with a more detailed report on Economic and Financial Policies for the Medium Term. This report was also submitted to the Fund and other multilateral institutions and development partners. The document brings more clarity and context to the measures that are currently being implemented to reduce imbalances, and outlines a comprehensive medium-term stabilization and reform strategy aimed at transforming the structure of the economy and improving its medium term prospects.
Recent Economic Developments 4. Based on recently revised data from Ghana’s Statistical Service, growth remained strong at 7.1 percent in 2013, against 8.8 percent in 2012, as shown in Staff Buff/14/38. The growth slowdown,
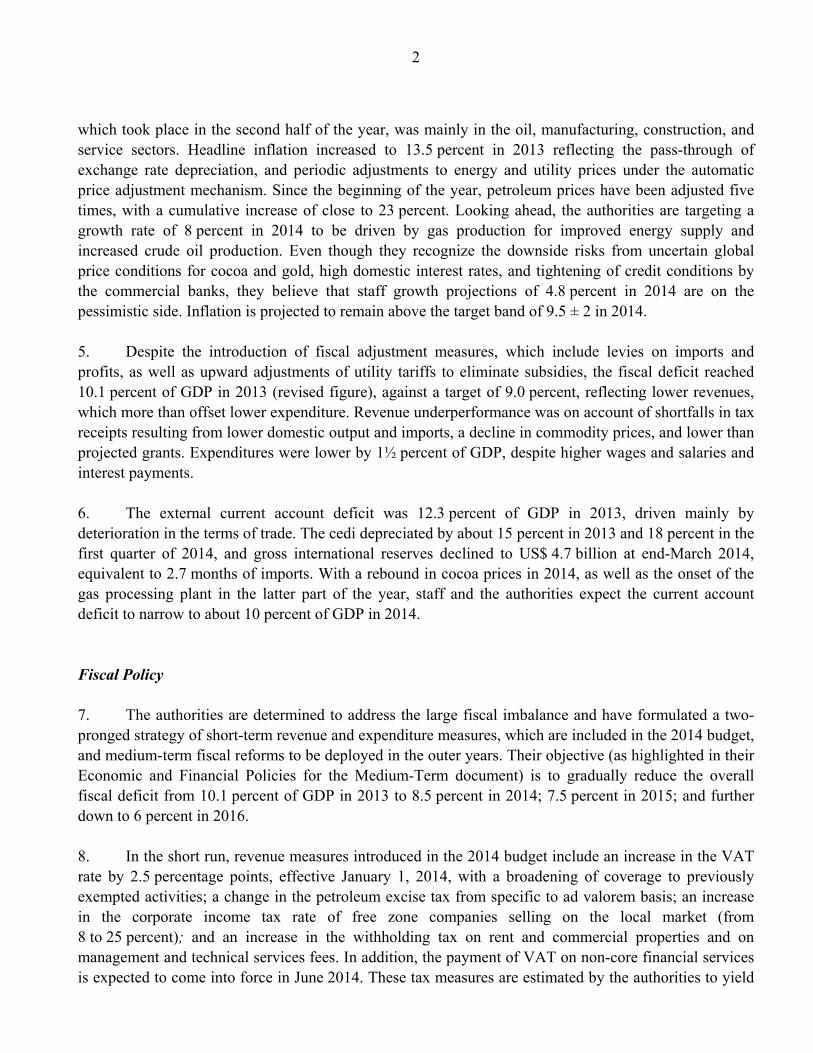
2
which took place in the second half of the year, was mainly in the oil, manufacturing, construction, and service sectors. Headline inflation increased to 13.5 percent in 2013 reflecting the pass-through of exchange rate depreciation, and periodic adjustments to energy and utility prices under the automatic price adjustment mechanism. Since the beginning of the year, petroleum prices have been adjusted five times, with a cumulative increase of close to 23 percent. Looking ahead, the authorities are targeting a growth rate of 8 percent in 2014 to be driven by gas production for improved energy supply and increased crude oil production. Even though they recognize the downside risks from uncertain global price conditions for cocoa and gold, high domestic interest rates, and tightening of credit conditions by the commercial banks, they believe that staff growth projections of 4.8 percent in 2014 are on the pessimistic side. Inflation is projected to remain above the target band of 9.5 ± 2 in 2014. 5. Despite the introduction of fiscal adjustment measures, which include levies on imports and profits, as well as upward adjustments of utility tariffs to eliminate subsidies, the fiscal deficit reached 10.1 percent of GDP in 2013 (revised figure), against a target of 9.0 percent, reflecting lower revenues, which more than offset lower expenditure. Revenue underperformance was on account of shortfalls in tax receipts resulting from lower domestic output and imports, a decline in commodity prices, and lower than projected grants. Expenditures were lower by 1½ percent of GDP, despite higher wages and salaries and interest payments.
6. The external current account deficit was 12.3 percent of GDP in 2013, driven mainly by deterioration in the terms of trade. The cedi depreciated by about 15 percent in 2013 and 18 percent in the first quarter of 2014, and gross international reserves declined to US$ 4.7 billion at end-March 2014, equivalent to 2.7 months of imports. With a rebound in cocoa prices in 2014, as well as the onset of the gas processing plant in the latter part of the year, staff and the authorities expect the current account deficit to narrow to about 10 percent of GDP in 2014. Fiscal Policy 7. The authorities are determined to address the large fiscal imbalance and have formulated a two-pronged strategy of short-term revenue and expenditure measures, which are included in the 2014 budget, and medium-term fiscal reforms to be deployed in the outer years. Their objective (as highlighted in their Economic and Financial Policies for the Medium-Term document) is to gradually reduce the overall fiscal deficit from 10.1 percent of GDP in 2013 to 8.5 percent in 2014; 7.5 percent in 2015; and further down to 6 percent in 2016. 8. In the short run, revenue measures introduced in the 2014 budget include an increase in the VAT rate by 2.5 percentage points, effective January 1, 2014, with a broadening of coverage to previously exempted activities; a change in the petroleum excise tax from specific to ad valorem basis; an increase in the corporate income tax rate of free zone companies selling on the local market (from 8 to 25 percent); and an increase in the withholding tax on rent and commercial properties and on management and technical services fees. In addition, the payment of VAT on non-core financial services is expected to come into force in June 2014. These tax measures are estimated by the authorities to yield

3
additional revenue of about 2 percent of GDP in 2014. Expenditure rationalization measures include: (i) strict adherence to the automatic price adjustment formula for petroleum and utility prices to limit subsidies, (ii) tight budget limits on the wage bill through a freeze on net hiring in most public institutions, along with a review of the current compensation scheme, and (iii) continuation of the policy on the moratorium on the award of new contracts for investment projects. Moreover, as part of the ongoing PFM reforms, all government accounts will be shifted to a new chart of accounts (COA), and government transactions will be deployed to a GIFMIS electronic platform. 9. Over the medium term, the authorities plan to carry out wide-ranging structural fiscal reforms to support their medium-term fiscal consolidation objectives. These reforms will focus on strengthening the Ghana Revenue Authority (GRA), reviewing existing tax laws; rationalizing the wage bill, pensions, gratuities, and social security payments; carrying out a broad public sector reform with a voluntary retirement plan. In addition, they will continue the policy of regular adjustment of fuel and utility prices to reduce subsidies. These measures will help create fiscal space for higher capital and social expenditure. The authorities intend to have a full quantification of these measures in due course.
Monetary and Exchange Rate Policies 10. Monetary policy has been kept tight and focused on anchoring inflation expectations and improving the working of the foreign exchange market. Mindful of the inflationary impact of earlier exchange rate depreciations and continued pass through of periodic adjustments of petroleum and utility prices; the Bank of Ghana (BOG) has since March 2013 raised its key policy rate twice; in May 2013 by 100 basis points and in February 2014 by 200 basis points to 18 percent. In April 2014, further action was taken to address problems of liquidity overhang in the economy and improve the supply of foreign exchange in the market by increasing the cash reserve ratio and revising downwards the Net Open Position (NOP) of banks. The BOG acknowledges, in its latest monetary policy committee report, that risks to inflation have risen substantially, but expects inflation to return to within the target band of 9.5± 2 percent towards the middle of 2015. The BOG remains committed to monitor closely price developments and take appropriate action, when necessary, to prevent high inflation from becoming entrenched. 11. Important steps have also been taken to unify the exchange rates in the system. In conjunction with Reuters, the authorities have developed a foreign exchange trade reporting system to enhance transparency in the pricing of foreign exchange in the interbank market, facilitate price discovery, and better gauge foreign exchange liquidity. With the system in place, the multiplicity of foreign exchange rates generated from different sources have been eliminated, and transparency has been greatly enhanced, with market participants now able to observe traded foreign exchange rates on a real time basis. This platform currently in use by the BOG and commercial banks is expected to be made available to international operators by the end of the third quarter of 2014. 12. On efforts at de-dollarizing the economy, a set of measures were announced in February 2014, aimed primarily at re-enforcing existing rules and regulations governing the foreign exchange market and promoting the use of the local currency as the legal tender. Specific measures included the enforcement
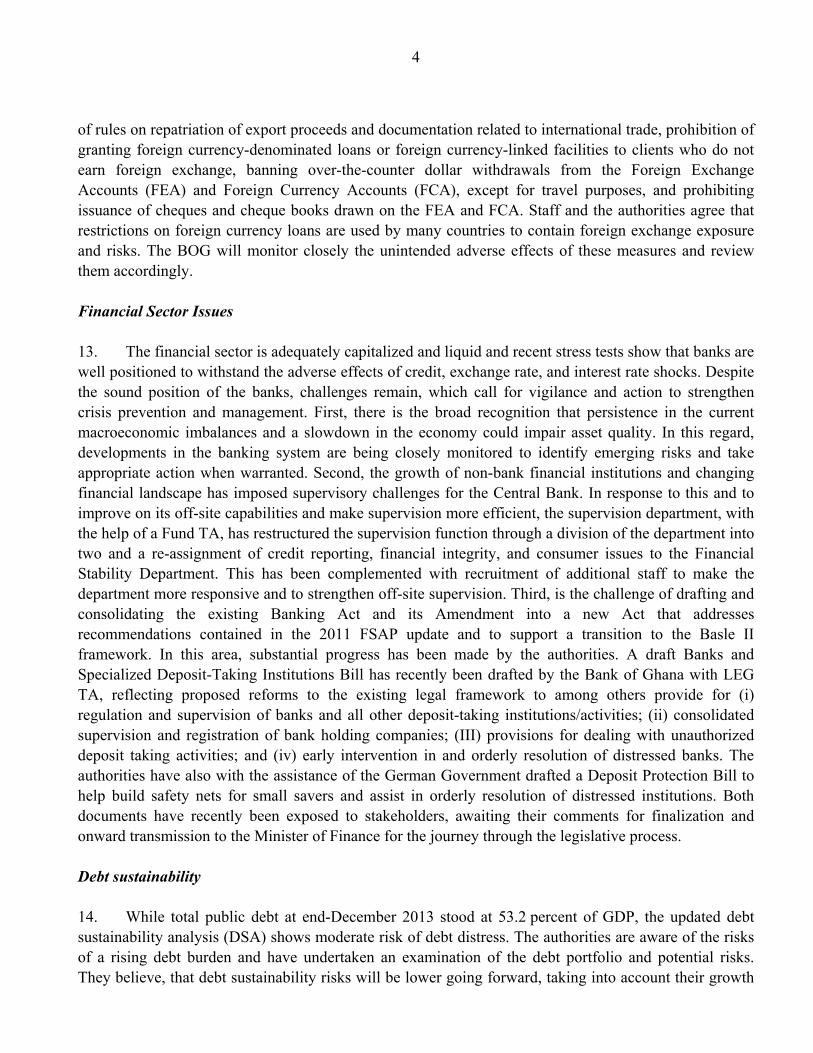
4
of rules on repatriation of export proceeds and documentation related to international trade, prohibition of granting foreign currency-denominated loans or foreign currency-linked facilities to clients who do not earn foreign exchange, banning over-the-counter dollar withdrawals from the Foreign Exchange Accounts (FEA) and Foreign Currency Accounts (FCA), except for travel purposes, and prohibiting issuance of cheques and cheque books drawn on the FEA and FCA. Staff and the authorities agree that restrictions on foreign currency loans are used by many countries to contain foreign exchange exposure and risks. The BOG will monitor closely the unintended adverse effects of these measures and review them accordingly.
Financial Sector Issues 13. The financial sector is adequately capitalized and liquid and recent stress tests show that banks are well positioned to withstand the adverse effects of credit, exchange rate, and interest rate shocks. Despite the sound position of the banks, challenges remain, which call for vigilance and action to strengthen crisis prevention and management. First, there is the broad recognition that persistence in the current macroeconomic imbalances and a slowdown in the economy could impair asset quality. In this regard, developments in the banking system are being closely monitored to identify emerging risks and take appropriate action when warranted. Second, the growth of non-bank financial institutions and changing financial landscape has imposed supervisory challenges for the Central Bank. In response to this and to improve on its off-site capabilities and make supervision more efficient, the supervision department, with the help of a Fund TA, has restructured the supervision function through a division of the department into two and a re-assignment of credit reporting, financial integrity, and consumer issues to the Financial Stability Department. This has been complemented with recruitment of additional staff to make the department more responsive and to strengthen off-site supervision. Third, is the challenge of drafting and consolidating the existing Banking Act and its Amendment into a new Act that addresses recommendations contained in the 2011 FSAP update and to support a transition to the Basle II framework. In this area, substantial progress has been made by the authorities. A draft Banks and Specialized Deposit-Taking Institutions Bill has recently been drafted by the Bank of Ghana with LEG TA, reflecting proposed reforms to the existing legal framework to among others provide for (i) regulation and supervision of banks and all other deposit-taking institutions/activities; (ii) consolidated supervision and registration of bank holding companies; (III) provisions for dealing with unauthorized deposit taking activities; and (iv) early intervention in and orderly resolution of distressed banks. The authorities have also with the assistance of the German Government drafted a Deposit Protection Bill to help build safety nets for small savers and assist in orderly resolution of distressed institutions. Both documents have recently been exposed to stakeholders, awaiting their comments for finalization and onward transmission to the Minister of Finance for the journey through the legislative process. Debt sustainability 14. While total public debt at end-December 2013 stood at 53.2 percent of GDP, the updated debt sustainability analysis (DSA) shows moderate risk of debt distress. The authorities are aware of the risks of a rising debt burden and have undertaken an examination of the debt portfolio and potential risks. They believe, that debt sustainability risks will be lower going forward, taking into account their growth
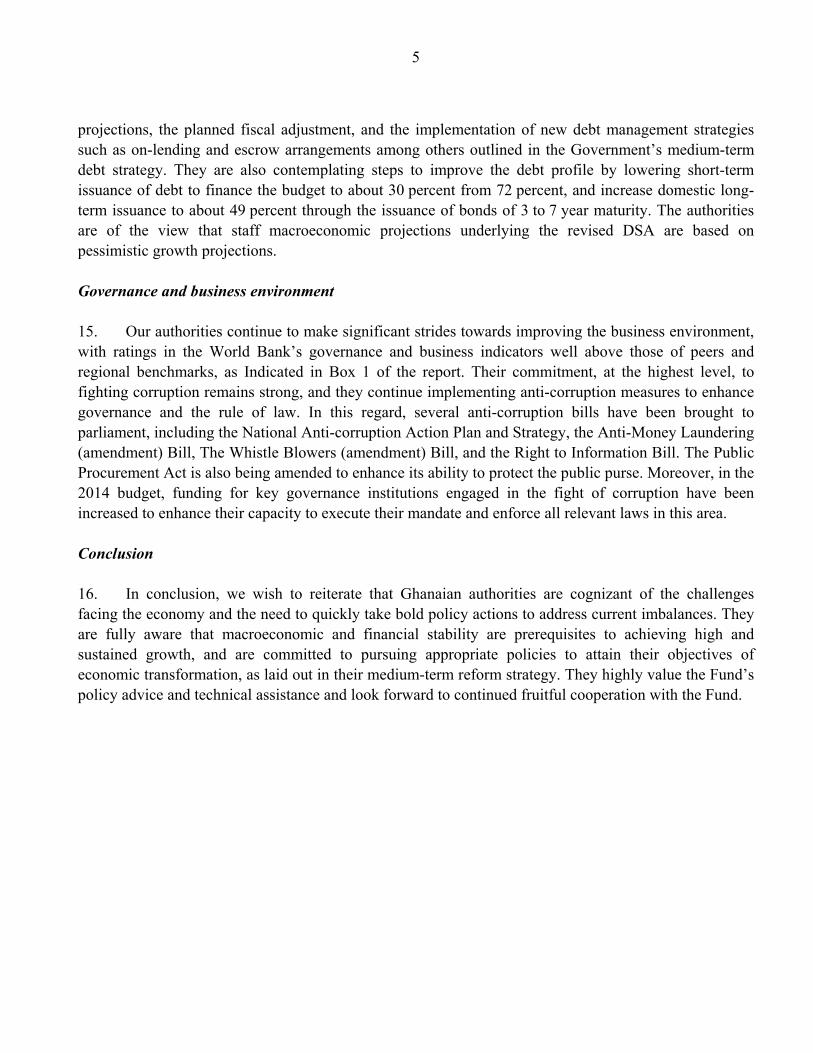
5
projections, the planned fiscal adjustment, and the implementation of new debt management strategies such as on-lending and escrow arrangements among others outlined in the Government’s medium-term debt strategy. They are also contemplating steps to improve the debt profile by lowering short-term issuance of debt to finance the budget to about 30 percent from 72 percent, and increase domestic long-term issuance to about 49 percent through the issuance of bonds of 3 to 7 year maturity. The authorities are of the view that staff macroeconomic projections underlying the revised DSA are based on pessimistic growth projections. Governance and business environment 15. Our authorities continue to make significant strides towards improving the business environment, with ratings in the World Bank’s governance and business indicators well above those of peers and regional benchmarks, as Indicated in Box 1 of the report. Their commitment, at the highest level, to fighting corruption remains strong, and they continue implementing anti-corruption measures to enhance governance and the rule of law. In this regard, several anti-corruption bills have been brought to parliament, including the National Anti-corruption Action Plan and Strategy, the Anti-Money Laundering (amendment) Bill, The Whistle Blowers (amendment) Bill, and the Right to Information Bill. The Public Procurement Act is also being amended to enhance its ability to protect the public purse. Moreover, in the 2014 budget, funding for key governance institutions engaged in the fight of corruption have been increased to enhance their capacity to execute their mandate and enforce all relevant laws in this area. Conclusion 16. In conclusion, we wish to reiterate that Ghanaian authorities are cognizant of the challenges facing the economy and the need to quickly take bold policy actions to address current imbalances. They are fully aware that macroeconomic and financial stability are prerequisites to achieving high and sustained growth, and are committed to pursuing appropriate policies to attain their objectives of economic transformation, as laid out in their medium-term reform strategy. They highly value the Fund’s policy advice and technical assistance and look forward to continued fruitful cooperation with the Fund.