Embed Size (px)
Citation preview
Geriatric Emergency Management PLUS Program - Costing Analysis 1
Geriatric Emergency Management PLUS Program Costing Analysis at the Ottawa Hospital
Regional Geriatric Program of Eastern Ontario
March 2015
Geriatric Emergency Management PLUS Program - Costing Analysis 2
Table of Contents
1. Executive Summary ................................................................................................................................................. 3
2. Introduction ............................................................................................................................................................ 5
A) Problem Statement .......................................................................................................................................................... 5
B) Geriatric Emergency Management PLUS Program........................................................................................................... 5
3. Methodology .......................................................................................................................................................... 8
A) Setting .............................................................................................................................................................................. 8
B) Scope ................................................................................................................................................................................ 8
C) Data Sources ..................................................................................................................................................................... 8
D) Matching of the Study and Comparator Groups .............................................................................................................. 8
E) Validated Measures .......................................................................................................................................................... 9
F) GEM+ Costing Process ...................................................................................................................................................... 9
G) Limitations ...................................................................................................................................................................... 10
4. Findings ................................................................................................................................................................ 11
A) Admission Rate and ALC Rate Differences ..................................................................................................................... 11
B) Per Case Differences ....................................................................................................................................................... 11
C) Total Resources Savings ................................................................................................................................................. 11
D) Total Cost Avoidance ...................................................................................................................................................... 11
5. Lessons Learned .................................................................................................................................................... 12
6. Conclusion ............................................................................................................................................................ 12
7. Recommendations ................................................................................................................................................ 12
Appendix A: Detailed Costing Methodology ............................................................................................................... 13
Appendix B: Flow Chart ............................................................................................................................................ 24
Geriatric Emergency Management PLUS Program - Costing Analysis 3
A Costing Analysis of the Geriatric Emergency Management PLUS Program
1. EXECUTIVE SUMMARY
Introduction
This report describes a costing analysis for the Geriatric Emergency Management PLUS (GEM+) Program that was designed and then tested using clinical and administrative patient data from the Ottawa Hospital (TOH) during the 2012/13 fiscal year. The methodology developed was designed to support future costing analysis of other hospitals with the GEM+ Program.
The GEM+ PLUS Program
The GEM+ Program is an evidence based approach designed to enhance age-appropriate care provided to seniors in Emergency Departments that are at high risk for unnecessary hospital utilization. GEM+ ED nurses, with special training in Geriatric Medicine, provide a targeted geriatric assessment, focusing on the geriatric giants, to support early identification and intervention of reversible and preventable medical issues. The GEM+ ED nurses then work with the multidisciplinary team within the ED, and with specialized geriatric service (SGS) and community support service (CSS) organizations to help ensure that an effective and efficient plan is in place to support a safe sustainable discharge back into the community with appropriate support and follow up. The ultimate goal is to improve the trajectory, safety, quality, and durability of ED discharges and thus improve ED flow, and reduce unnecessary hospital utilization (e.g., repeat ED visits or hospital admissions).
Goals of this Study
Limited healthcare funding drives healthcare programs to demonstrate their cost effectiveness. The goals of this study were to: Design a costing methodology for GEM+ Programs Test out this methodology at TOH and determine if the GEM+ Program resulted in bed days saved or cost avoidance If the method is durable, then expand the costing analysis to other hospitals involved with the GEM+ Program.
Analysis
The TOH GEM+ costing study was based on 7,706 TOH Emergency Department (ED) patients seen in 2012/13 fiscal year (FY) that were 75 years of age or older, living independently in the community that received a Canadian Triage and Acuity Scale (CTAS) score of 3, 4 or 5 at their index ED visit. The study group included 932 patients seen by a TOH GEM+ nurse. The comparator group included 6774 patients that accessed the ED but were not seen by a GEM+ nurse.
The following actions were conducted at TOH to develop and test the costing methodology:
1. Sampling criteria identified and the order for including and excluding data determined 2. Measurement tools selected to identify differences in co-morbidities and risk of dying 3. All terms defined and specific indicators provided with a numerator, denominator, and the required statistical
analysis 4. TOH Costing data set built 5. Analyzed data for differences in admission rates and ALC rates 6. Analyzed data for per case differences for a) ED cases, b) admitted cases, and c) admitted cases that become ALC 7. Determined impact on bed days 8. Determined impact on cost avoidance 9. GEM+ Program costs defined 10. Total impact of GEM+ on hospital resources and costs determined for the TOH GEM+ Program in the 2012/13 FY.
Geriatric Emergency Management PLUS Program - Costing Analysis 4
Data Sources
TOH data from the Med2020 DAD NACRS database and the TOH Data Warehouse were sourced through the TOH Performance Measurement Department. Data was identified for TOH patients aged 75 years of age and older that accessed the TOH Civic or General Emergency Department Campuses during the 2012- 2013 fiscal year.
Overall Findings
The costing methodology revealed the following regarding the GEM+ study group patients: A. Overall, the GEM+ study group diverted more in-patient hospitalizations than the Non-GEM+ comparator group. B. On average, admitted GEM+ patients had a shorter average length of stay (ALOS) and a lower total cost than the
Non-GEM+ comparator group. This translated into more bed days saved and greater overall cost avoidance for TOH.
The total TOH resource savings and cost avoidance due to the GEM+ study group in 2012/13 fiscal year was as follows: 1310 bed days were saved by the GEM+ study group $1,941,340.79 of costs were avoided by the GEM+ study group
Key Limitations
The biggest limitation of this costing methodology was the lack of costing data and available indicator data prior to program implementation.
Costing data was not available in 2012/13 fiscal year for several TOH departments (Mental Health, Rehabilitation cases, and the Heart Institute). Therefore, these cases were excluded from the analysis.
GEM+ cases included in this analysis were defined as those cases that were seen by a GEM+ nurse and had a full GEM+ assessment conducted. Therefore, many cases with partial GEM+ assessments were excluded.
ED patients are sourced for the GEM+ program in two ways; 1) Referral by ED Physicians and staff or by 2) the GEM+ administrative screen. The data for “percent of cases sourced by referral or admin screen” was not available. Therefore, the administrative screen exclusion rule of “a second ED visit within 6 months” was not applied consistently to all GEM+ patients and was therefore not applied to the comparator group.
The data included in this analysis was limited to patients with CTAS 3-5 levels at their ED index visit. Therefore, patients re-visiting the ED with a CTAS level of 1 or 2 were excluded. Future analysis should include these cases.
Key Lessons Learned
Ensure that the GEM+ cases and the Non-GEM+ cases are two exclusive groups over the length of the study. Take the time required for staff and data analysts to fully understand the definitions and processes of key aspects
of the GEM+ program, the costing analysis Ensure only one data analyst is selected to source data for both the study and the comparator groups. Select one program representative to liaise with the data analyst. Ensure only “clean” data is utilized. Have the analyst walk through the results of the data and explain what they did and how they did it. Utilize a process map to facilitate understanding of the program and to interpret the data provided by the
analyst.
Recommendations
Re-run this data when costing data is available for all TOH departments. Encourage TOH GEM ED to start collecting data for the number and percent of GEM+ patients referred by ED
staff or sourced through the GEM+ administrative screen. Collect this data over multiple fiscal years to ensure a large enough population for future costing analysis.
During the next run of this costing analysis only include patients referred via the administrative screen. The study group would include patients seen by a GEM+ nurse while the comparator group would include patients not seen by a GEM+ nurse (e.g., after hours, weekends etc.).
Geriatric Emergency Management PLUS Program - Costing Analysis 5
2. INTRODUCTION
This report describes the findings of a study designed to examine resource use and cost avoidance of the Geriatric Emergency Management Plus (GEM+) Program located at The Ottawa Hospital and operated by the Regional Geriatric Program of Eastern Ontario (RGPEO). Throughout this costing analysis the most conservative methods were selected to facilitate an objective analysis of the program.
A. Problem Statement
There is limited funding for health care. For a program to maintain funding it needs to show that it provides the best care at the lowest cost. The RGPEO designed this costing analysis to determine whether the GEM+ Program was cost neutral, saved or required more TOH bed days and whether more TOH costs were avoided or required.
The Goals of this study were to: Design a costing methodology that can be used by other hospitals in the Champlain region Test out the costing methodology on the TOH GEM+ Program and determine the impact of the program with
regards to TOH bed days saved and TOH cost avoidance. If methodology is durable, expand to other hospitals with the GEM+ Program
B. Geriatric Emergency Management PLUS (GEM+) Program
The Program GEM+ nurses, with special training in Geriatric Medicine, provide a targeted geriatric assessment in the Emergency Department, focusing on the geriatric giants, to support early identification and intervention of reversible and preventable medical issues. The GEM+ nurses then work with the multidisciplinary team within the ED, and with specialized geriatric service (SGS) and community support service (CSS) organizations to help ensure that an effective and efficient plan is in place to support a safe sustainable discharge back into the community with appropriate support and follow up. The ultimate goal is to improve the trajectory, safety, quality, and durability of ED discharges and thus improve ED flow, and reduce unnecessary hospital utilization (e.g., repeat ED visits or hospital admissions). The GEM+ Program in the Champlain Region In 2007, the Ministry of Health and Long Term Care implemented the Aging at Home strategy and in 2008 the GEM+ Program was established in the Champlain region with the support of the Regional Geriatric Program of Eastern Ontario (RGPEO). The GEM+ integrated regional program coordinates and incorporates evidence based GEM+ initiatives in 9 separate hospital emergency department’s with over 20 partner organizations including Specialized Geriatric Services (SGS) and Community Support Services (CSS) essential to sustain high risk seniors in the community as long as possible. Key Components of the Regional Program The PLUS (+) component is a unique feature of the GEM+ in comparison to other Provincial programs and a critical aspect of the program in the Champlain region as it brings multiple organizations and service sectors together in a coordinated effort to support high risk seniors. Urgent capacity response processes and accountability agreements with CSS and SGS, ensure an advantage to GEM+ nurses who can access services on a priority basis thus preventing unnecessary hospital admissions. This is further validated by 72% of the GEM+ budget being directed to the plus services (SGS and community services) The magnitude of collaboration with the SGS and CSS partners is significant, and results in the application of consistent care processes for high risk seniors throughout the Champlain region. This approach supports seniors to remain healthy and independent at home while enhancing the continuum of care through timely and effective transition to SGS and CSS.

Geriatric Emergency Management PLUS Program - Costing Analysis 6
Regional Governance The GEM+ Program is governed by a Project Leadership Team (PLT). The PLT has the mandate to oversee the growth, coordination and evolution for the GEM+ Program throughout its existence. The PLT sets direction and policies based on the project requirements as set out by the Champlain LHIN. The PLT has embraced a shared governance model that supports decision making through distributed and shared power to include regional coordination and local planning and service. The Integrated Program Management and a Shared Decision-Making Model of the Project Leadership Team
Renfrew County Geriatric and Community Intervention
Program
Ottawa Geriatric and Community Intervention
Eastern County Geriatric and Community Intervention
Program
Regional Program Manager
Regional Geriatric and Community Intervention Program
Regional Geriatric Program of Eastern Ontario (RGPEO)
Geriatrician
Regional Geriatric Advisory
CommitteeChamplain Local Health Integrated Network
CLIENT: Champlain LHIN High Risk Senior Population Discharged Home from the ED
Program Processes A. The Two Stage Screening Process An evidence based two-stage screening approach is implemented at the ED to identify high risk seniors who present to the ED that are likely to be discharged home and who could benefit from GEM+ services. The administrative screen and the ISAR screening tool and the administrative screen constitute the two stage targeting process.
1. The administrative screen captures patients presenting to the ED who are: ≥75 years of age; a resident in the Champlain LHIN; not currently in Long Term Care; have previous ED visit within the last 6 months; and categorized as CTAS 3, 4, or 5.
2. The Identification of Seniors at Risk (ISAR) tool developed by McCusker (2000) is a validated screening tool in both official languages (French and English). It is used in the ED for early identification of seniors at risk who could benefit from a GEM+ targeted assessment. The tool consists of six questions covering:
cognitive impairment; functional loss; polypharmacy; visual impairment; and frequent hospitalizations.
Geriatric Emergency Management PLUS Program - Costing Analysis 7
B. Targeted Geriatric Assessment Once a patient has been identified by the two screen approach, a targeted geriatric assessment is completed by the specially trained GEM+ nurses focusing on geriatric giants. They identify priority areas, assess risk and formulate recommendations, enhancing age-appropriate care for seniors in ED thus improving the care received and the safety, quality, and durability of ED discharges for seniors at high risk for a hospital admission. C. Support and Follow-up The GEM+ nurse then works with the multidisciplinary team within the ED, and with specialized geriatric service (SGS) and community support service (CSS) organizations to help ensure that an effective and efficient plan is in place to support a safe sustainable discharge back into the community with appropriate support and follow up.
Geriatric Emergency Management PLUS Program - Costing Analysis 8
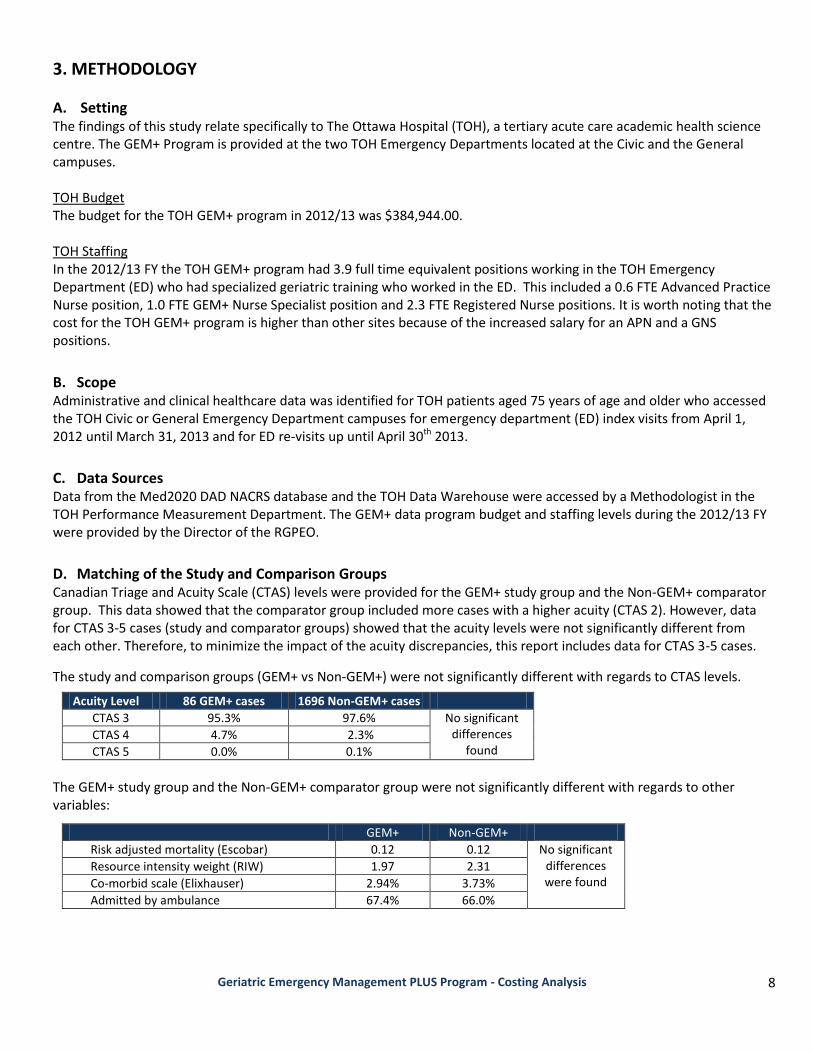
3. METHODOLOGY
A. Setting The findings of this study relate specifically to The Ottawa Hospital (TOH), a tertiary acute care academic health science centre. The GEM+ Program is provided at the two TOH Emergency Departments located at the Civic and the General campuses. TOH Budget The budget for the TOH GEM+ program in 2012/13 was $384,944.00. TOH Staffing In the 2012/13 FY the TOH GEM+ program had 3.9 full time equivalent positions working in the TOH Emergency Department (ED) who had specialized geriatric training who worked in the ED. This included a 0.6 FTE Advanced Practice Nurse position, 1.0 FTE GEM+ Nurse Specialist position and 2.3 FTE Registered Nurse positions. It is worth noting that the cost for the TOH GEM+ program is higher than other sites because of the increased salary for an APN and a GNS positions.
B. Scope Administrative and clinical healthcare data was identified for TOH patients aged 75 years of age and older who accessed the TOH Civic or General Emergency Department campuses for emergency department (ED) index visits from April 1, 2012 until March 31, 2013 and for ED re-visits up until April 30th 2013.
C. Data Sources Data from the Med2020 DAD NACRS database and the TOH Data Warehouse were accessed by a Methodologist in the TOH Performance Measurement Department. The GEM+ data program budget and staffing levels during the 2012/13 FY were provided by the Director of the RGPEO.
D. Matching of the Study and Comparison Groups Canadian Triage and Acuity Scale (CTAS) levels were provided for the GEM+ study group and the Non-GEM+ comparator group. This data showed that the comparator group included more cases with a higher acuity (CTAS 2). However, data for CTAS 3-5 cases (study and comparator groups) showed that the acuity levels were not significantly different from each other. Therefore, to minimize the impact of the acuity discrepancies, this report includes data for CTAS 3-5 cases.
The study and comparison groups (GEM+ vs Non-GEM+) were not significantly different with regards to CTAS levels.
Acuity Level 86 GEM+ cases 1696 Non-GEM+ cases
CTAS 3 95.3% 97.6% No significant differences
found CTAS 4 4.7% 2.3%
CTAS 5 0.0% 0.1%
The GEM+ study group and the Non-GEM+ comparator group were not significantly different with regards to other variables:
GEM+ Non-GEM+
Risk adjusted mortality (Escobar) 0.12 0.12 No significant differences were found
Resource intensity weight (RIW) 1.97 2.31
Co-morbid scale (Elixhauser) 2.94% 3.73%
Admitted by ambulance 67.4% 66.0%
Geriatric Emergency Management PLUS Program - Costing Analysis 9
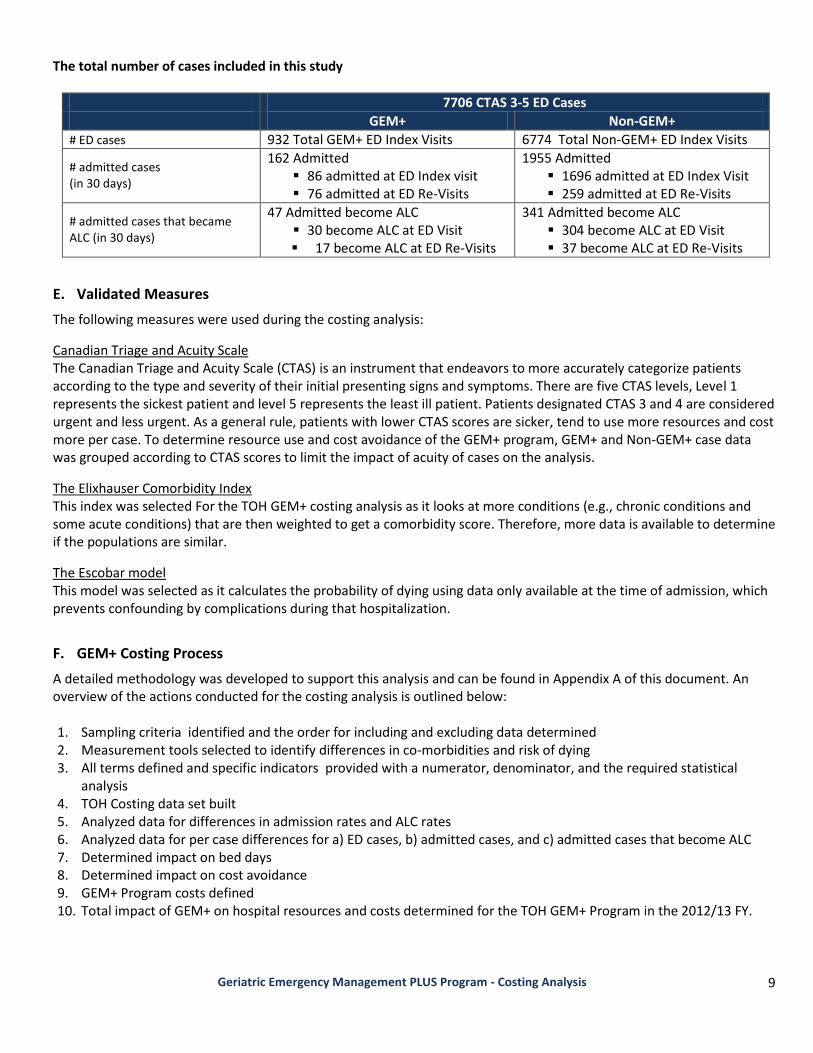
The total number of cases included in this study
7706 CTAS 3-5 ED Cases
GEM+ Non-GEM+
# ED cases l 932 Total GEM+ ED Index Visits 6774 Total Non-GEM+ ED Index Visits
# admitted cases (in 30 days)
162 Admitted 86 admitted at ED Index visit 76 admitted at ED Re-Visits
1955 Admitted 1696 admitted at ED Index Visit 259 admitted at ED Re-Visits
# admitted cases that became ALC (in 30 days)
47 Admitted become ALC 30 become ALC at ED Visit 17 become ALC at ED Re-Visits
341 Admitted become ALC 304 become ALC at ED Visit 37 become ALC at ED Re-Visits
E. Validated Measures
The following measures were used during the costing analysis:
Canadian Triage and Acuity Scale The Canadian Triage and Acuity Scale (CTAS) is an instrument that endeavors to more accurately categorize patients according to the type and severity of their initial presenting signs and symptoms. There are five CTAS levels, Level 1 represents the sickest patient and level 5 represents the least ill patient. Patients designated CTAS 3 and 4 are considered urgent and less urgent. As a general rule, patients with lower CTAS scores are sicker, tend to use more resources and cost more per case. To determine resource use and cost avoidance of the GEM+ program, GEM+ and Non-GEM+ case data was grouped according to CTAS scores to limit the impact of acuity of cases on the analysis.
The Elixhauser Comorbidity Index This index was selected For the TOH GEM+ costing analysis as it looks at more conditions (e.g., chronic conditions and some acute conditions) that are then weighted to get a comorbidity score. Therefore, more data is available to determine if the populations are similar.
The Escobar model This model was selected as it calculates the probability of dying using data only available at the time of admission, which prevents confounding by complications during that hospitalization.
F. GEM+ Costing Process
A detailed methodology was developed to support this analysis and can be found in Appendix A of this document. An overview of the actions conducted for the costing analysis is outlined below: 1. Sampling criteria identified and the order for including and excluding data determined 2. Measurement tools selected to identify differences in co-morbidities and risk of dying 3. All terms defined and specific indicators provided with a numerator, denominator, and the required statistical
analysis 4. TOH Costing data set built 5. Analyzed data for differences in admission rates and ALC rates 6. Analyzed data for per case differences for a) ED cases, b) admitted cases, and c) admitted cases that become ALC 7. Determined impact on bed days 8. Determined impact on cost avoidance 9. GEM+ Program costs defined 10. Total impact of GEM+ on hospital resources and costs determined for the TOH GEM+ Program in the 2012/13 FY.
Geriatric Emergency Management PLUS Program - Costing Analysis 10
G. Limitations of the Costing Analysis
The biggest limitation was the lack of costing data and available indicator data from before the program was implemented. In addition, there was no way to randomly select the cases for the costing analysis.
No costing data was available for 2012/13 fiscal year TOH Mental Health cases, TOH Rehabilitation cases and Heart Institute cases at the time of the study. Therefore, these cases were excluded from the analysis.
GEM+ cases included in this analysis were defined as those cases that were seen by a GEM+ nurse and had a full GEM+ assessment conducted. Therefore, many cases with partial GEM+ assessments were excluded.
There are two methods that ED patients are sourced for the GEM+ program; 1) Referral by ED Physician or ED staff or by 2) the GEM+ administrative screen. The data for “percent of cases sourced by referral or admin screen” was not available. Therefore, the administrative screen exclusion rule of “a second ED visit within 6 months” was not applied consistently to all GEM+ patients and was therefore not applied to the comparator group.
The data included in this analysis is limited to patients with CTAS 3-5 levels. Therefore, patients re-visiting the ED with a CTAS level of 1 or 2 were not included in the analysis. Future analysis should include these patients.
It was noted that factors other than acuity impact CTAS coding (e.g., patients stated pain level). Therefore a patient could have a high CTAS code without high acuity.
Palliative care patients do not qualify for the GEM+ program, but it was not possible to exclude palliative ED cases from the comparator data as the data for percent of palliative Emergency Department cases is not collected by TOH. Inpatient data for percent of patients that are palliative is collected and this percent was monitored throughout the data analysis. However, the value of this data is limited as it is not possible to determine whether the patient was palliative when accessing ED or became palliative during their stay.

Geriatric Emergency Management PLUS Program - Costing Analysis 11
4. FINDINGS
The costing analysis demonstrated that there were two potential sources of resource savings and cost avoidance for the GEM+ Program:
A. Admission Rate and ALC Rate Differences
The findings for “admission rate and ALC rate differences” were based on the differences between the GEM+ study group and the Non-GEM+ comparator group with regards to admission rates and ALC rates.
The analysis showed that the GEM+ study group had a lower ED admission rate and ALC rate. This difference resulted in cases being diverted from becoming inpatients or ALC inpatients.
The 11.5% lower admission rate and a 1.3% lower ALC rate translated into 19 diverted hospital admissions or admissions that became ALC.
B. Per Case Differences
The findings for “per case differences” were based on the differences between the GEM+ study group and the Non-GEM+ comparator group with regards to the average length of stay and the average total cost per case.
The analysis showed that the GEM+ study group had a shorter average length of stay and lower total cost per case for admitted cases.
Therefore, there was overall resource savings and cost avoidance for these cases. Those cases that were “admitted at the ED index visit” and those cases “admitted at the ED index visit that later became ALC” had the greatest resource savings and cost avoidance. Whereas, the opposite was true for cases that were admitted at the ED re-visit.
The comprehensive GEM+ ED assessment costs slightly more per case ($91.86 for cases admitted at ED visit and $75.33 for cases admitted at ED re-visit), however, this cost was easily mitigated by the overall cost avoidance for GEM+ admitted cases and GEM+ ALC cases admitted at the ED index visit.
C. Total Resource Savings
When the bed days for per case differences was subtracted from the bed days saved by the diverted cases there were: 1310.7 bed days saved by the GEM+ program in 2012/13 FY.
D. Total Cost Avoidance
When the cost avoidance for the diverted cases ($2,096,781.82) was added to the cost avoidance from the per-case differences ($229,502.97) there were $2,326,284.79 costs avoided. When the TOH costs for running the GEM+ program ($384,944.00) were subtracted from this the findings were:
$1,941,340.79 in avoided costs in the 2012/13 FY
Geriatric Emergency Management PLUS Program - Costing Analysis 12
5. CONCLUSION
A costing methodology was developed and tested on the TOH GEM+ Program. The findings showed the program saved resources and supported cost avoidance for the Ottawa Hospital in the 2012/13 fiscal year. Over a thousand bed days were saved and over 1.9 million in costs were avoided. The program successfully diverted cases from being admitted into hospital or becoming ALC in the 2012/13 FY due to
the programs 11.5% lower admission rate and 1.3% lower ALC rate. Additional resources were saved and costs avoided due to the shorter average length of stay and the overall lower
total cost per case and for cases admitted at the ED index visit. The overall cost avoidance easily mitigates the cost of running the program.
6. LESSONS LEARNED
The following lessons were learned when analyzing costing data for the TOH GEM+ Program. (Please note that “Appendix A: Detailed Methodology” includes processes developed based on these lessons learned.) Lessons Learned regarding Data Ensure that the GEM+ cases and the Non-GEM+ cases are two exclusive groups over the length of the study. For
example, a patient might visit the ED in May as a Non-GEM+ patient, re-visit in June as a GEM+ patient and then not re-visit again until the following February as a Non-GEM+ patient.
Ensure one data analyst is selected to source data for the GEM+ study group and the Non-GEM+ comparator group. This ensures the same sampling criteria and order for implementing the inclusions/exclusions are followed.
It was determined that the most valid approach for comparing the two groups was when the denominator for the calculations was the total population (N).
Only utilize “clean” GEM+ data. Utilize the visual process map to review the data and to better understand the multiple paths that GEM+ ED,
admitted and ALC patients follow when accessing care (e.g., at index ED visit, at ED re-visits) Lessons Learned regarding Communication Understand the role of each stakeholder and their different use of the GEM+ data/costing data Take the time to fully understand the definitions and processes of key aspects of the GEM+ program and the
costing analysis. Write down these definitions and processes and have all key stakeholders agree that these are accurate. Provide this written information to the data analyst.
Select one key person to liaise with the data analysis that can answer, or source answers from other stakeholders, in between full stakeholder meetings. It is helpful if this liaison person also calculates the resource savings and cost avoidance for the costing analysis if the analyst is not available to do so.
When the dataset has been built by the analyst set up a meeting to review the data and to assist with interpretation.
7. RECOMMENDATIONS
Re-run this data when costing data is available for all departments in TOH. Collect data for number and percent of GEM+ patients referred by ED staff or through the administrative screen. Consider re-running this costing analysis and only including patients referred via the administrative screen. The
study group would include patients seen by a GEM+ nurse while the comparator group would include patients not seen by a GEM+ nurse (e.g., after hours, weekends etc.). Collect data over multiple fiscal years to ensure a large enough population.
Geriatric Emergency Management PLUS Program - Costing Analysis 13
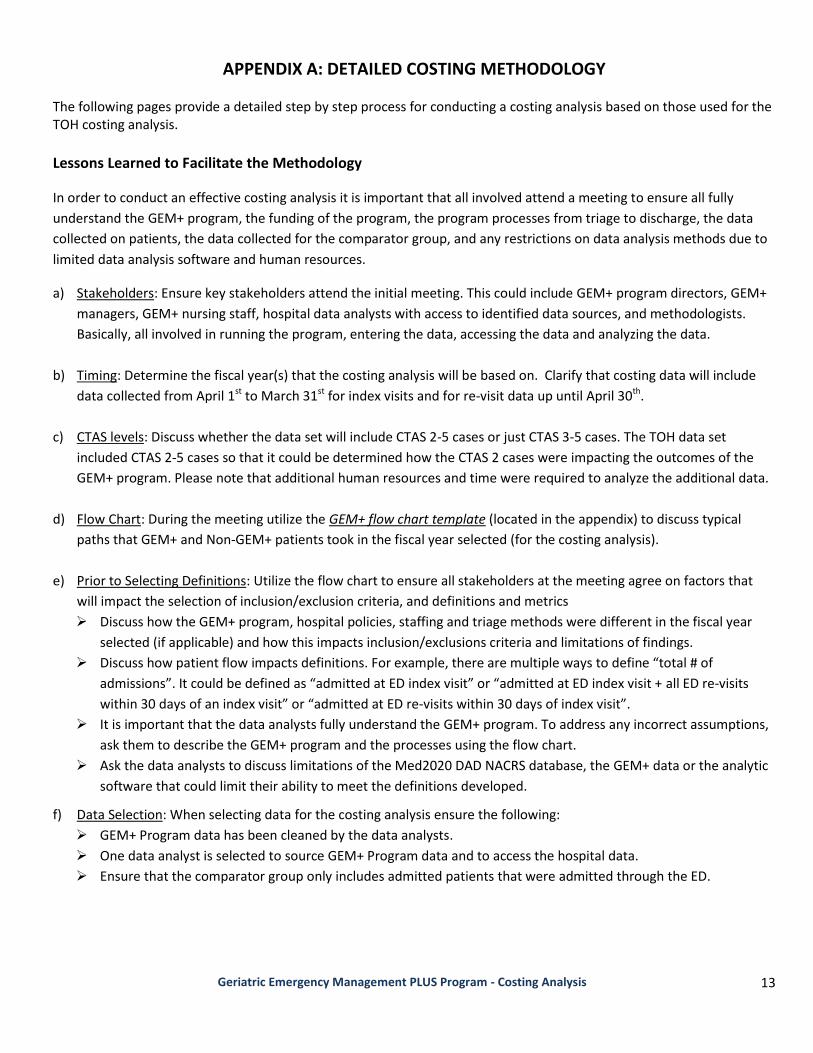
APPENDIX A: DETAILED COSTING METHODOLOGY The following pages provide a detailed step by step process for conducting a costing analysis based on those used for the TOH costing analysis.
Lessons Learned to Facilitate the Methodology
In order to conduct an effective costing analysis it is important that all involved attend a meeting to ensure all fully
understand the GEM+ program, the funding of the program, the program processes from triage to discharge, the data
collected on patients, the data collected for the comparator group, and any restrictions on data analysis methods due to
limited data analysis software and human resources.
a) Stakeholders: Ensure key stakeholders attend the initial meeting. This could include GEM+ program directors, GEM+
managers, GEM+ nursing staff, hospital data analysts with access to identified data sources, and methodologists.
Basically, all involved in running the program, entering the data, accessing the data and analyzing the data.
b) Timing: Determine the fiscal year(s) that the costing analysis will be based on. Clarify that costing data will include
data collected from April 1st to March 31st for index visits and for re-visit data up until April 30th.
c) CTAS levels: Discuss whether the data set will include CTAS 2-5 cases or just CTAS 3-5 cases. The TOH data set
included CTAS 2-5 cases so that it could be determined how the CTAS 2 cases were impacting the outcomes of the
GEM+ program. Please note that additional human resources and time were required to analyze the additional data.
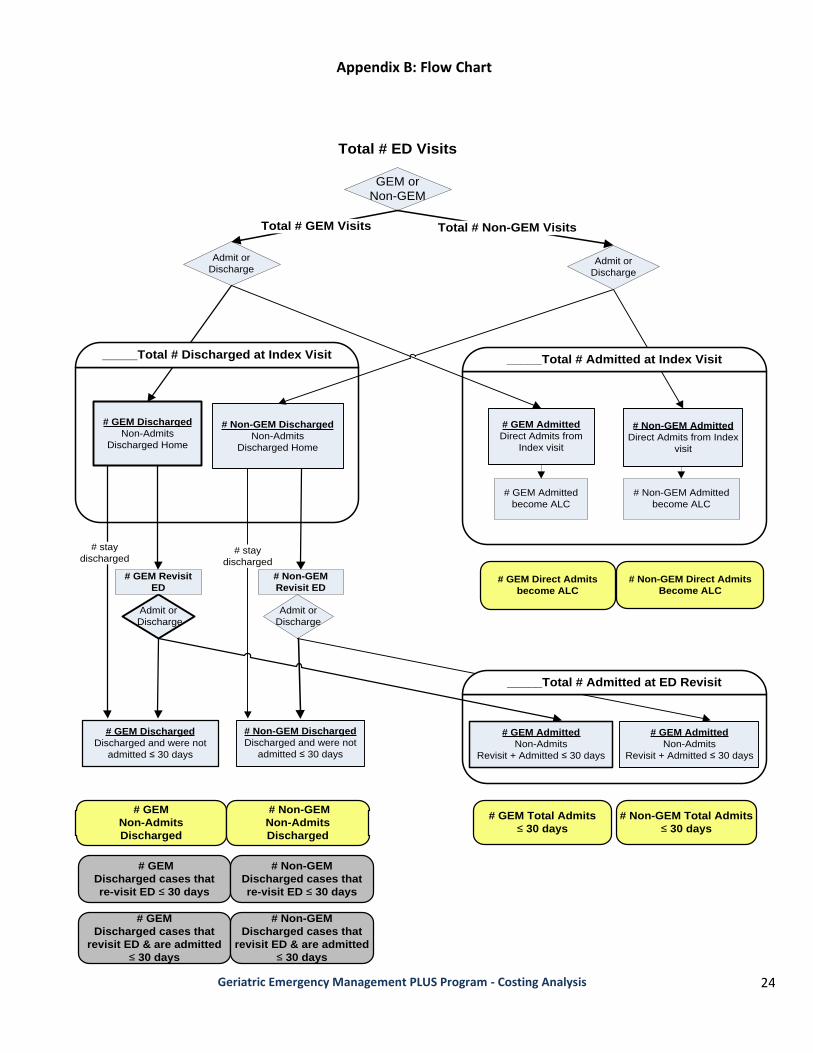
d) Flow Chart: During the meeting utilize the GEM+ flow chart template (located in the appendix) to discuss typical
paths that GEM+ and Non-GEM+ patients took in the fiscal year selected (for the costing analysis).
e) Prior to Selecting Definitions: Utilize the flow chart to ensure all stakeholders at the meeting agree on factors that
will impact the selection of inclusion/exclusion criteria, and definitions and metrics
Discuss how the GEM+ program, hospital policies, staffing and triage methods were different in the fiscal year
selected (if applicable) and how this impacts inclusion/exclusions criteria and limitations of findings.
Discuss how patient flow impacts definitions. For example, there are multiple ways to define “total # of
admissions”. It could be defined as “admitted at ED index visit” or “admitted at ED index visit + all ED re-visits
within 30 days of an index visit” or “admitted at ED re-visits within 30 days of index visit”.
It is important that the data analysts fully understand the GEM+ program. To address any incorrect assumptions,
ask them to describe the GEM+ program and the processes using the flow chart.
Ask the data analysts to discuss limitations of the Med2020 DAD NACRS database, the GEM+ data or the analytic
software that could limit their ability to meet the definitions developed.
f) Data Selection: When selecting data for the costing analysis ensure the following:
GEM+ Program data has been cleaned by the data analysts.
One data analyst is selected to source GEM+ Program data and to access the hospital data.
Ensure that the comparator group only includes admitted patients that were admitted through the ED.
Geriatric Emergency Management PLUS Program - Costing Analysis 14
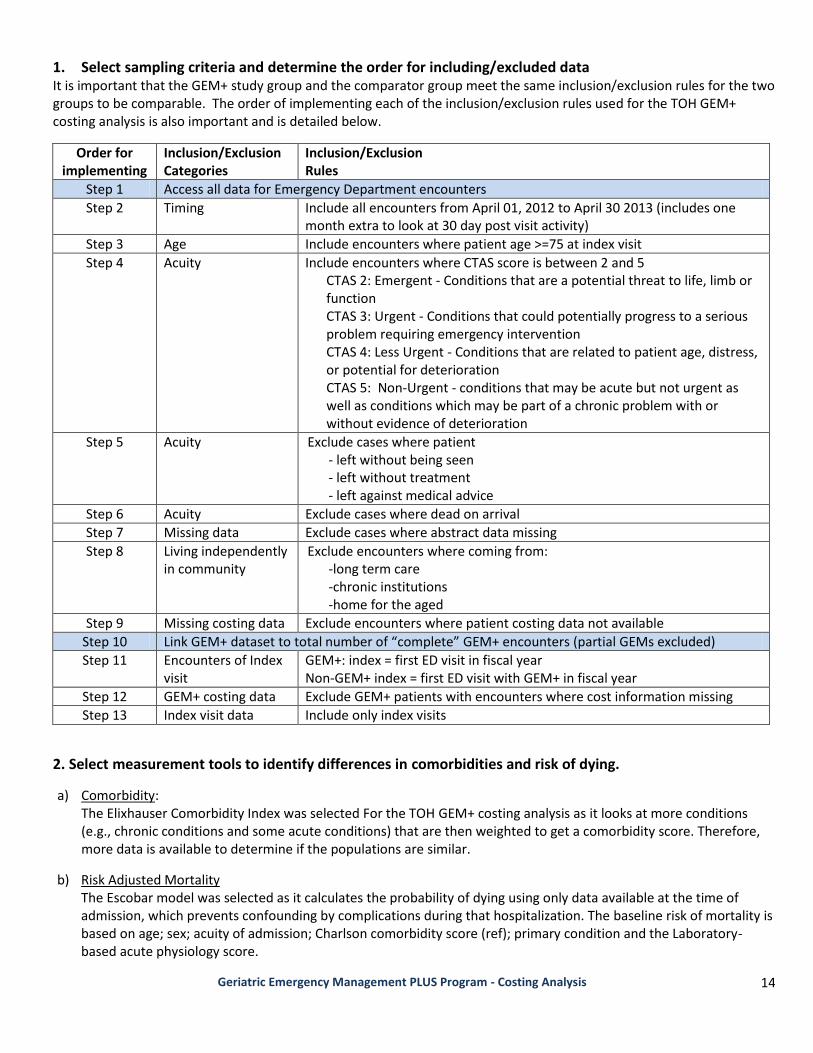
1. Select sampling criteria and determine the order for including/excluded data It is important that the GEM+ study group and the comparator group meet the same inclusion/exclusion rules for the two groups to be comparable. The order of implementing each of the inclusion/exclusion rules used for the TOH GEM+ costing analysis is also important and is detailed below.
Order for implementing
Inclusion/Exclusion Categories
Inclusion/Exclusion Rules
Step 1 Access all data for Emergency Department encounters
Step 2 Timing Include all encounters from April 01, 2012 to April 30 2013 (includes one month extra to look at 30 day post visit activity)
Step 3 Age Include encounters where patient age >=75 at index visit
Step 4 Acuity Include encounters where CTAS score is between 2 and 5 CTAS 2: Emergent - Conditions that are a potential threat to life, limb or function CTAS 3: Urgent - Conditions that could potentially progress to a serious problem requiring emergency intervention CTAS 4: Less Urgent - Conditions that are related to patient age, distress, or potential for deterioration CTAS 5: Non-Urgent - conditions that may be acute but not urgent as well as conditions which may be part of a chronic problem with or without evidence of deterioration
Step 5 Acuity Exclude cases where patient - left without being seen - left without treatment - left against medical advice
Step 6 Acuity Exclude cases where dead on arrival
Step 7 Missing data Exclude cases where abstract data missing
Step 8 Living independently in community
Exclude encounters where coming from: -long term care -chronic institutions -home for the aged
Step 9 Missing costing data Exclude encounters where patient costing data not available
Step 10 Link GEM+ dataset to total number of “complete” GEM+ encounters (partial GEMs excluded)
Step 11 Encounters of Index visit
GEM+: index = first ED visit in fiscal year Non-GEM+ index = first ED visit with GEM+ in fiscal year
Step 12 GEM+ costing data Exclude GEM+ patients with encounters where cost information missing
Step 13 Index visit data Include only index visits
2. Select measurement tools to identify differences in comorbidities and risk of dying.
a) Comorbidity: The Elixhauser Comorbidity Index was selected For the TOH GEM+ costing analysis as it looks at more conditions (e.g., chronic conditions and some acute conditions) that are then weighted to get a comorbidity score. Therefore, more data is available to determine if the populations are similar.
b) Risk Adjusted Mortality The Escobar model was selected as it calculates the probability of dying using only data available at the time of admission, which prevents confounding by complications during that hospitalization. The baseline risk of mortality is based on age; sex; acuity of admission; Charlson comorbidity score (ref); primary condition and the Laboratory-based acute physiology score.
Geriatric Emergency Management PLUS Program - Costing Analysis 15
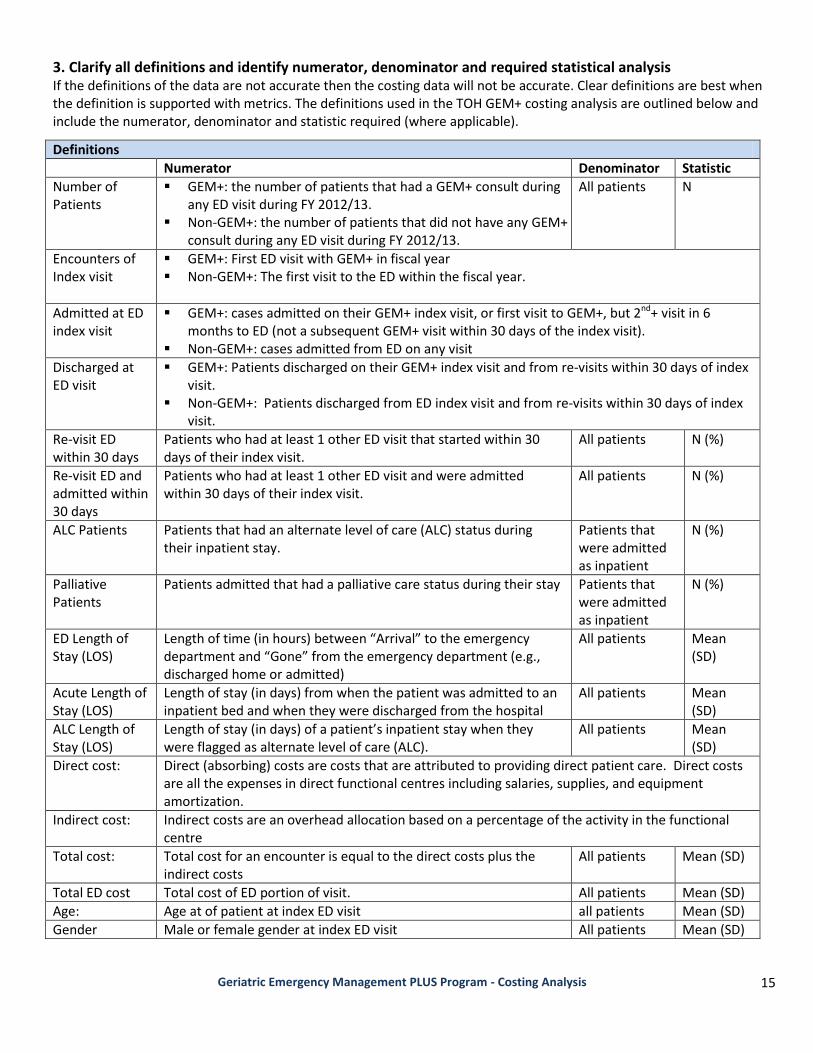
3. Clarify all definitions and identify numerator, denominator and required statistical analysis If the definitions of the data are not accurate then the costing data will not be accurate. Clear definitions are best when the definition is supported with metrics. The definitions used in the TOH GEM+ costing analysis are outlined below and include the numerator, denominator and statistic required (where applicable).
Definitions
Numerator Denominator Statistic
Number of Patients
GEM+: the number of patients that had a GEM+ consult during any ED visit during FY 2012/13.
Non-GEM+: the number of patients that did not have any GEM+ consult during any ED visit during FY 2012/13.
All patients
N
Encounters of Index visit
GEM+: First ED visit with GEM+ in fiscal year Non-GEM+: The first visit to the ED within the fiscal year.
Admitted at ED index visit
GEM+: cases admitted on their GEM+ index visit, or first visit to GEM+, but 2nd+ visit in 6 months to ED (not a subsequent GEM+ visit within 30 days of the index visit).
Non-GEM+: cases admitted from ED on any visit
Discharged at ED visit
GEM+: Patients discharged on their GEM+ index visit and from re-visits within 30 days of index visit.
Non-GEM+: Patients discharged from ED index visit and from re-visits within 30 days of index visit.
Re-visit ED within 30 days
Patients who had at least 1 other ED visit that started within 30 days of their index visit.
All patients N (%)
Re-visit ED and admitted within 30 days
Patients who had at least 1 other ED visit and were admitted within 30 days of their index visit.
All patients N (%)
ALC Patients Patients that had an alternate level of care (ALC) status during their inpatient stay.
Patients that were admitted as inpatient
N (%)
Palliative Patients
Patients admitted that had a palliative care status during their stay Patients that were admitted as inpatient
N (%)
ED Length of Stay (LOS)
Length of time (in hours) between “Arrival” to the emergency department and “Gone” from the emergency department (e.g., discharged home or admitted)
All patients Mean (SD)
Acute Length of Stay (LOS)
Length of stay (in days) from when the patient was admitted to an inpatient bed and when they were discharged from the hospital
All patients Mean (SD)
ALC Length of Stay (LOS)
Length of stay (in days) of a patient’s inpatient stay when they were flagged as alternate level of care (ALC).
All patients Mean (SD)
Direct cost: Direct (absorbing) costs are costs that are attributed to providing direct patient care. Direct costs are all the expenses in direct functional centres including salaries, supplies, and equipment amortization.
Indirect cost: Indirect costs are an overhead allocation based on a percentage of the activity in the functional centre
Total cost: Total cost for an encounter is equal to the direct costs plus the indirect costs
All patients Mean (SD)
Total ED cost Total cost of ED portion of visit. All patients Mean (SD)
Age: Age at of patient at index ED visit all patients Mean (SD)
Gender Male or female gender at index ED visit All patients Mean (SD)

Geriatric Emergency Management PLUS Program - Costing Analysis 16
Canadian Triage Acuity Scale (CTAS)
A scale assigned to categorize the patient according to the type and severity of the patient’s initial presenting signs and symptoms. The CTAS is used to determine the triage level. This scale was developed by the Canadian Association of Emergency Physicians. - CTAS 1: Resuscitation - Conditions that are threats to life or
limb (or imminent risk of deterioration) - CTAS 2: Emergent - Conditions that are a potential threat to
life, limb or function - CTAS 3: Urgent - Conditions that could potentially progress to a
serious problem requiring emergency intervention - CTAS 4: Less Urgent - Conditions that are related to patient
age, distress, or potential for deterioration - CTAS 5: Non-Urgent - conditions that may be acute but not
urgent as well as conditions which may be part of a chronic problem with or without evidence of deterioration
Comorbid Score:
Comorbidities are a patient’s pre-existing diagnoses (at the time of admission). A comorbidity score reflects burden of these comorbidities which is especially useful for risk adjustment.
All patients Mean (SD)
Risk Adjusted Mortality Score
The predicted probability of dying in hospital. All patients Mean (SD)
Admit by Ambulance
Patients that arrive at the emergency department by way of ambulance.
All patients N (%)
Resource Intensity Weighting (RIW)
A relative cost weight value derived from case-cost data submitted to CIHI’s Case Mix department. All RIW cost weights are relative to the average typical inpatient case such that the sum of the typical cases is equal to the sum of the typical weighted cases.
All patients Mean (SD)
4. Data analyst builds the data set and facilitates interpretation of the data set Provide the analyst with this detailed methodology to assist them with setting up the dataset for the costing analysis. Organize a meeting to review the costing data with the data analyst.
a) Have the analyst walk through the results of the data and explain what they did and how they did it. Take this time to make sure that the data makes sense to the program director, program manager, evaluator and analyst.
b) Compare the Non-GEM+ data from Med2020 DAD to the GEM+ Program data and determine if the two groups are similar enough to compare. Review the percentages for each variable; age, gender, CTAS scores, comorbidities, risk adjusted mortality, admit by ambulance, ALC, palliative, resource intensity weights.
Table 1: Total Study and Comparator Populations
CTAS 3-5 in ___ FY
Study Group GEM+
Comparator Group Non-GEM+
# Cases (N=total GEM+ population) (N=total non-GEM+ population

Geriatric Emergency Management PLUS Program - Costing Analysis 17
5. Part A: Analyze the Data for Differences in Admission Rates The following methods outline how to determine the potential impact of lower or higher GEM+ admission rates on bed days and cost avoidance.
Table 1
% Difference between GEM+ and Non-GEM+
admission rates
# Cases diverted
Resulting bed days Saved
Resulting hospital beds Saved
Total costs avoided
A B C D E
(Note: Place the results of each calculation in the above table)
A. Calculate % difference in GEM+ and Non-GEM+ Admission rates Compare the Non-GEM+ data from Med2020 DAD to the GEM+ Program data accessed through the TOH Warehouse data and determine any differences in admission rates or ALC rates.
a) % GEM+ cases admitted within 30 days
Total GEM cases admitted at ED index visit + Total GEM cases admitted at ED re-visit within 30 days Total N population for GEM+
b) % Non-GEM+ cases admitted within 30 days
Total Non-GEM cases admitted at ED index visit + Total Non-GEM cases admitted at ED re-visit within 30 days Total N population for Non-GEM+
c) % Difference in GEM+ vs Non-GEM+ admission rate (Note: place finding in Table __ in box #1)
% GEM cases admitted within 30 days - % Non-GEM cases admitted within 30 days = _______________
B. Calculate number of cases diverted
Rationale for calculation: If the GEM+ program was not available, then the cases regularly seen by GEM+ nurses would have been seen by Non-GEM+ ED nurses and the Non-GEM+ admission rate would apply. If the Non-GEM+ admission rate is higher, this would lead to more ED cases being admitted. The number of additional admitted cases is then interpreted as the number of cases diverted by GEM+.
Total GEM ED cases in the fiscal year (N) x % difference in GEM+ vs Non-GEM admission rates= ________
C. Calculate bed days saved Rationale for calculation: The Non-GEM+ average length of stay (ALOS) is utilized because if the GEM+ program was not available then those cases would be seen by Non-GEM+ staff and the Non-GEM+ ALOS would apply. Note: length of stay is made up of acute length of stay and the ALC length of stay and both are included in this calculation.
# cases diverted by GEM x (Non-GEM+ Acute Length of stay + Non-GEM ALC Length of Stay) = ________
D. Calculate hospital beds saved
# bed days saved = ___________ 365 hospital days a year
E. Calculate cost avoidance
Rationale: The Non-GEM+ total cost for each case is utilized because if the GEM+ program was not available then those cases would be seen by Non-GEM+ staff and the Non-GEM+ total cost would apply.
# admissions diverted by GEM x Total cost of a Non-GEM admitted case = ____________
Geriatric Emergency Management PLUS Program - Costing Analysis 18
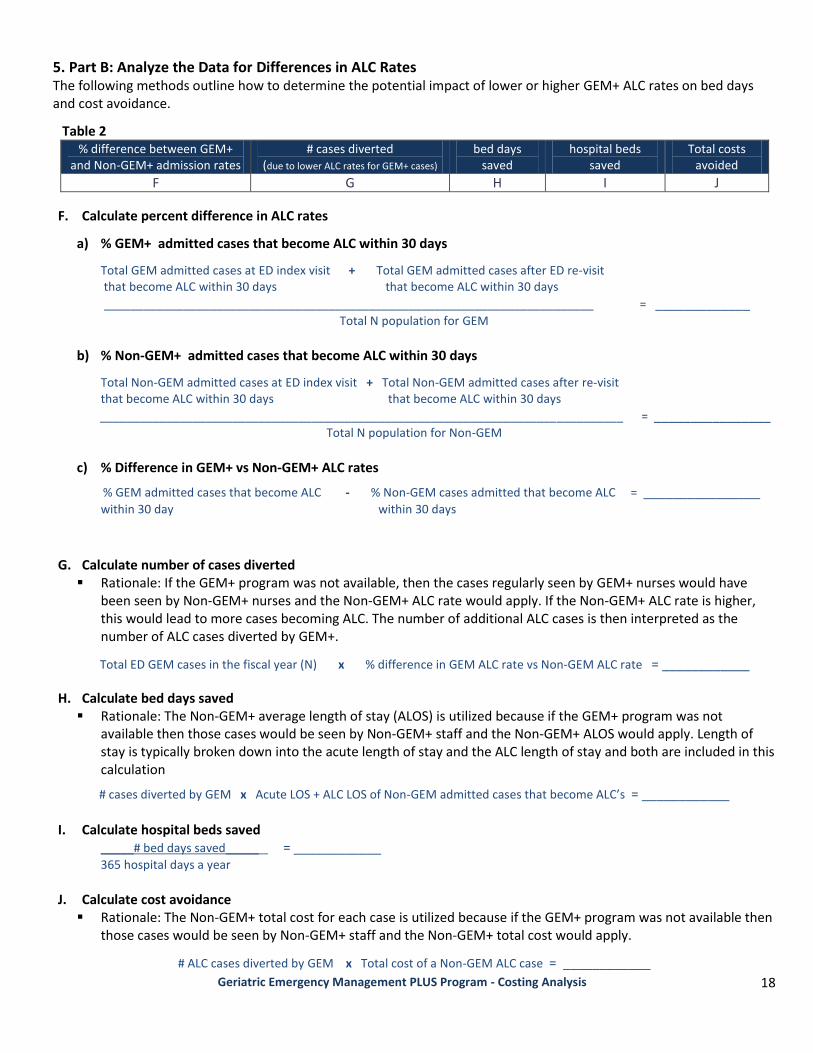
5. Part B: Analyze the Data for Differences in ALC Rates The following methods outline how to determine the potential impact of lower or higher GEM+ ALC rates on bed days and cost avoidance.
Table 2 % difference between GEM+
and Non-GEM+ admission rates # cases diverted
(due to lower ALC rates for GEM+ cases) bed days
saved hospital beds
saved Total costs
avoided
F G H I J
F. Calculate percent difference in ALC rates
a) % GEM+ admitted cases that become ALC within 30 days
Total GEM admitted cases at ED index visit + Total GEM admitted cases after ED re-visit that become ALC within 30 days that become ALC within 30 days
__________________________________________________________________________ = _____________
Total N population for GEM
b) % Non-GEM+ admitted cases that become ALC within 30 days
Total Non-GEM admitted cases at ED index visit + Total Non-GEM admitted cases after re-visit that become ALC within 30 days that become ALC within 30 days
_______________________________________________________________________________ = ________________
Total N population for Non-GEM
c) % Difference in GEM+ vs Non-GEM+ ALC rates
% GEM admitted cases that become ALC - % Non-GEM cases admitted that become ALC = ________________
within 30 day within 30 days
G. Calculate number of cases diverted Rationale: If the GEM+ program was not available, then the cases regularly seen by GEM+ nurses would have
been seen by Non-GEM+ nurses and the Non-GEM+ ALC rate would apply. If the Non-GEM+ ALC rate is higher, this would lead to more cases becoming ALC. The number of additional ALC cases is then interpreted as the number of ALC cases diverted by GEM+.
Total ED GEM cases in the fiscal year (N) x % difference in GEM ALC rate vs Non-GEM ALC rate = ____________
H. Calculate bed days saved Rationale: The Non-GEM+ average length of stay (ALOS) is utilized because if the GEM+ program was not
available then those cases would be seen by Non-GEM+ staff and the Non-GEM+ ALOS would apply. Length of stay is typically broken down into the acute length of stay and the ALC length of stay and both are included in this calculation
# cases diverted by GEM x Acute LOS + ALC LOS of Non-GEM admitted cases that become ALC’s = ____________
I. Calculate hospital beds saved
_____# bed days saved_____ = ____________
365 hospital days a year
J. Calculate cost avoidance
Rationale: The Non-GEM+ total cost for each case is utilized because if the GEM+ program was not available then those cases would be seen by Non-GEM+ staff and the Non-GEM+ total cost would apply.
# ALC cases diverted by GEM x Total cost of a Non-GEM ALC case = ____________
Geriatric Emergency Management PLUS Program - Costing Analysis 19
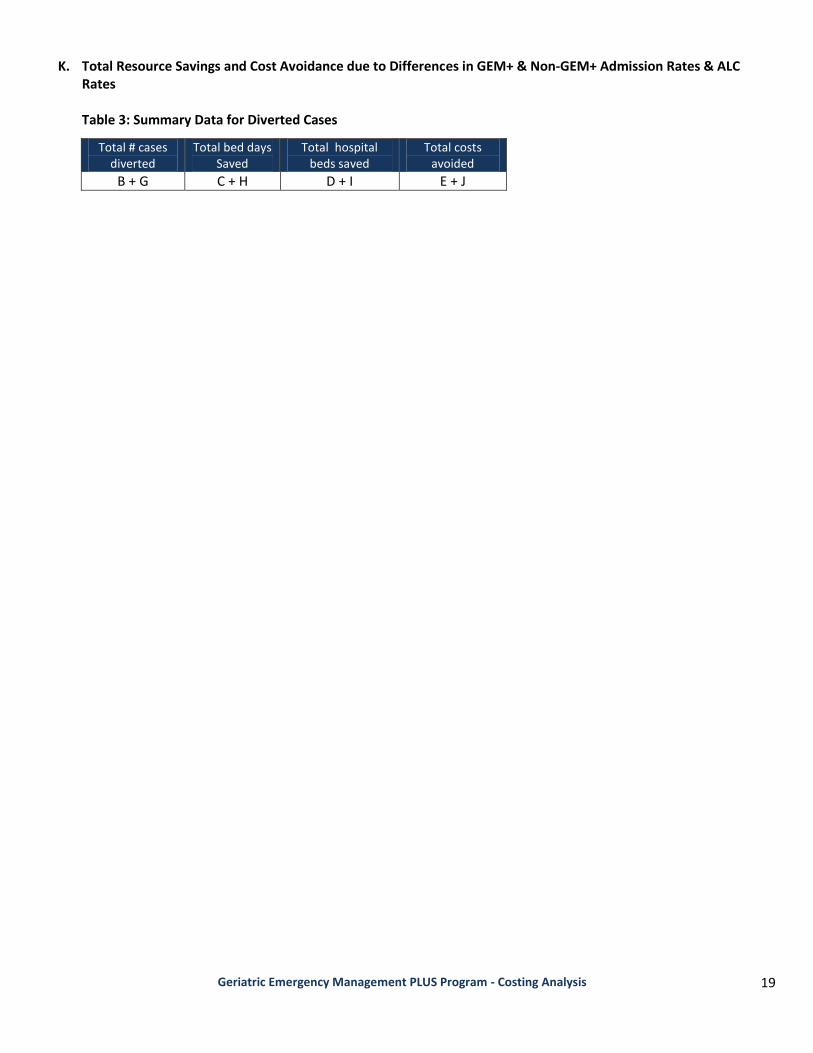
K. Total Resource Savings and Cost Avoidance due to Differences in GEM+ & Non-GEM+ Admission Rates & ALC Rates Table 3: Summary Data for Diverted Cases
Total # cases diverted
Total bed days Saved
Total hospital beds saved
Total costs avoided
B + G C + H D + I E + J

Geriatric Emergency Management PLUS Program - Costing Analysis 20
6. Part A: Analyze Per Case Differences for Admitted Cases Table 4
# cases admitted at ED index visit
Difference between GEM+ and Non-GEM+ LOS per case
Bed days
Hospital Beds
Cost per case
Cost avoidance for all admitted cases for FY
A B C D E F
A. Calculations for # of cases admitted at ED index visit
Total # GEM cases admitted at ED index visit = ____________
B. Calculate the difference between GEM+ and Non-GEM+ Length of Stay per case for cases admitted at ED index visit
Difference between (GEM Acute LOS) and + Difference between (GEM ALC LOS) and = ____________
(Non-GEM Acute LOS) Admitted at Index ED visit (Non-GEM ALC LOS) Admitted at Index ED visit
C. Calculate the # of bed days saved per case for cases admitted at ED index visit
Total GEM cases admitted at ED Index visit x Difference between GEM and Non GEM+ LOS (acute and ALC) = __________
D. Hospital beds saved per case for cases admitted at ED index visit
# Bed days saved per case for cases admitted at ED index visit = ____________
365 hospital days in a fiscal year
E. Cost avoidance per case for each case admitted at index visit
Total cost for a GEM ED index visit – Total cost for a Non-GEM ED index visit = ____________
F. Total cost avoidance for all cases admitted at index visit
# GEM admitted cases x Total cost avoidance for an ED index visits = ____________
Table 5
# cases admitted at re-visit
Difference between GEM++ and Non-GEM+ LOS per case
Bed days
Hospital Beds
Cost per case
Cost avoidance for all admitted cases for FY
G H I J K L
G. # of cases admitted at ED re-visit
Total GEM cases admitted at ED re-visit = ____________
H. Difference between GEM+ and Non-GEM+ Length of Stay per case for cases admitted at ED re-visit
Difference between (GEM Acute LOS) and + Difference between (GEM ALC LOS) and = ____________
(Non-GEM Acute LOS) Admitted at ED re- visit (Non-GEM ALC LOS) Admitted at ED re-visit
I. Bed days saved per case for cases admitted at ED re-visit
Total GEM cases admitted at ED re-visit x Difference between GEM and Non GEM+ LOS (acute and ALC) = ____________
J. Hospital beds saved per case for cases admitted at ED re-visit
Bed days saved per case for cases admitted at ED re-visit = ____________
365 hospital days in a fiscal year
Geriatric Emergency Management PLUS Program - Costing Analysis 21
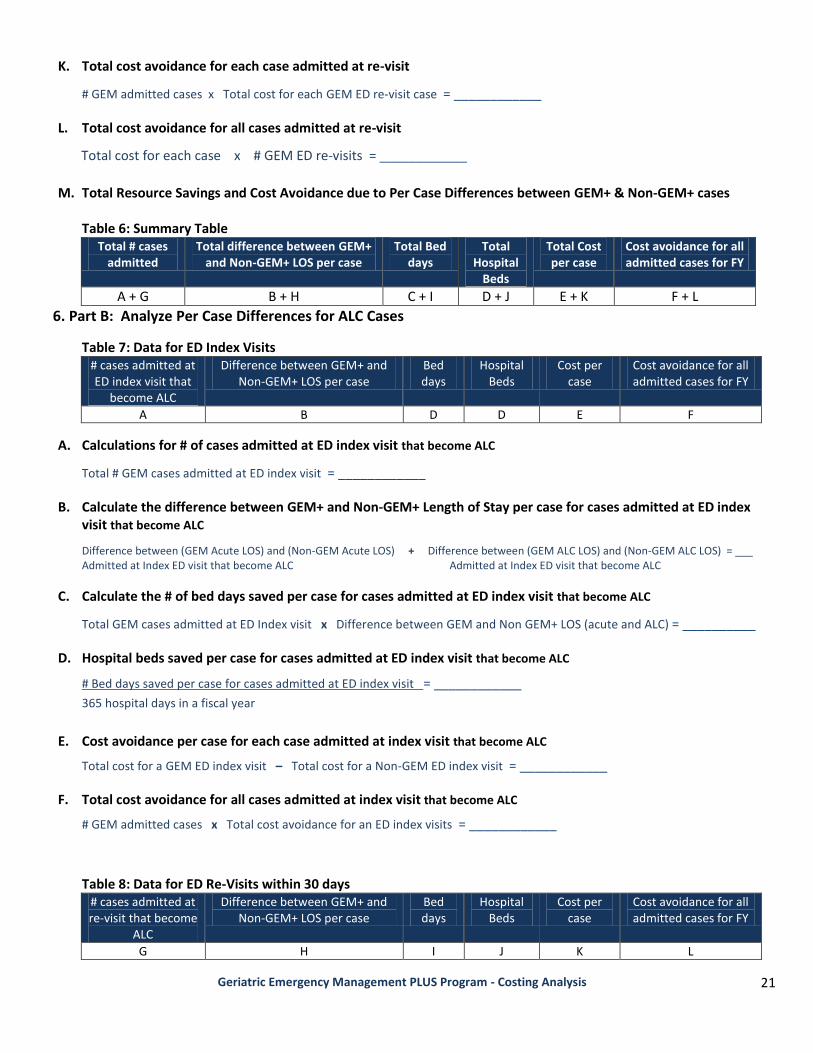
K. Total cost avoidance for each case admitted at re-visit
# GEM admitted cases x Total cost for each GEM ED re-visit case = ____________
L. Total cost avoidance for all cases admitted at re-visit
Total cost for each case x # GEM ED re-visits = ____________
M. Total Resource Savings and Cost Avoidance due to Per Case Differences between GEM+ & Non-GEM+ cases
Table 6: Summary Table
Total # cases admitted
Total difference between GEM+ and Non-GEM+ LOS per case
Total Bed days
Total Hospital
Beds
Total Cost per case
Cost avoidance for all admitted cases for FY
A + G B + H C + I D + J E + K F + L
6. Part B: Analyze Per Case Differences for ALC Cases
Table 7: Data for ED Index Visits # cases admitted at ED index visit that
become ALC
Difference between GEM+ and Non-GEM+ LOS per case
Bed days
Hospital Beds
Cost per case
Cost avoidance for all admitted cases for FY
A B D D E F
A. Calculations for # of cases admitted at ED index visit that become ALC
Total # GEM cases admitted at ED index visit = ____________
B. Calculate the difference between GEM+ and Non-GEM+ Length of Stay per case for cases admitted at ED index visit that become ALC
Difference between (GEM Acute LOS) and (Non-GEM Acute LOS) + Difference between (GEM ALC LOS) and (Non-GEM ALC LOS) = ___ Admitted at Index ED visit that become ALC Admitted at Index ED visit that become ALC
C. Calculate the # of bed days saved per case for cases admitted at ED index visit that become ALC
Total GEM cases admitted at ED Index visit x Difference between GEM and Non GEM+ LOS (acute and ALC) = __________
D. Hospital beds saved per case for cases admitted at ED index visit that become ALC
# Bed days saved per case for cases admitted at ED index visit = ____________
365 hospital days in a fiscal year
E. Cost avoidance per case for each case admitted at index visit that become ALC
Total cost for a GEM ED index visit – Total cost for a Non-GEM ED index visit = ____________
F. Total cost avoidance for all cases admitted at index visit that become ALC
# GEM admitted cases x Total cost avoidance for an ED index visits = ____________
Table 8: Data for ED Re-Visits within 30 days # cases admitted at re-visit that become
ALC
Difference between GEM+ and Non-GEM+ LOS per case
Bed days
Hospital Beds
Cost per case
Cost avoidance for all admitted cases for FY
G H I J K L

Geriatric Emergency Management PLUS Program - Costing Analysis 22
G. # of cases admitted at ED re-visit that become ALC
Total # GEM+ cases admitted at ED re-visit = ____________
H. Difference between GEM+ and Non-GEM+ Length of Stay per case for cases admitted at ED re-visit that become ALC
Difference between (GEM Acute LOS) and (Non-GEM Acute LOS) + Difference between (GEM ALC LOS) and (Non-GEM ALC LOS) = ______ Admitted at ED re- visit Admitted at ED re-visit
I. Bed days saved per case for cases admitted at ED re-visit that become ALC
Total # GEM cases admitted at ED re-visit x Difference between GEM and Non GEM+ LOS (acute and ALC) = ____________
J. Hospital beds saved per case for cases admitted at ED re-visit that become ALC
# Bed days saved per case for cases admitted at ED re-visit = ____________
365 hospital days in a fiscal year
K. Total cost avoidance for each case admitted at re-visit that become ALC
# GEM admitted cases x Total cost for each GEM+ ED re-visit = ____________
L. Total cost avoidance for all cases admitted at re-visit that become ALC
Total cost for each case x # GEM ED re-visits = ____________
M. Total Resource Savings and Cost Avoidance due to Per Case Differences for ALC Cases
Table 9: Summary Data for Non-Diverted Cases Total # cases
admitted Total difference between GEM+
and Non-GEM+ LOS per case Total Bed
days Total
Hospital Beds
Total Cost per case
Cost avoidance for all admitted cases for FY
A + G B + H C + I D + J E + K F + L
b.) Total Cost Avoidance for all per case differences in ED visits, Admitted Cases and ALC cases
2012/13 FY CTAS 3-5
ED cost per case
Admission cost per case
ALC cost per case Per Case Costs
admitted at index visit
admitted at re-visit
c.) Cost Avoidance for all per case differences for GEM+ cases in 2012/13 Fiscal Year
2012/13 FY CTAS 3-5
932/232 ED cases
in 2012/13 FY
86/76 admitted cases in
2012/13 FY
30/17 ALC cases in FY
2012/13
Total Costs Avoided for all cases in
2012/13 FY
admitted at index visit
admitted at re-visit
Geriatric Emergency Management PLUS Program - Costing Analysis 23
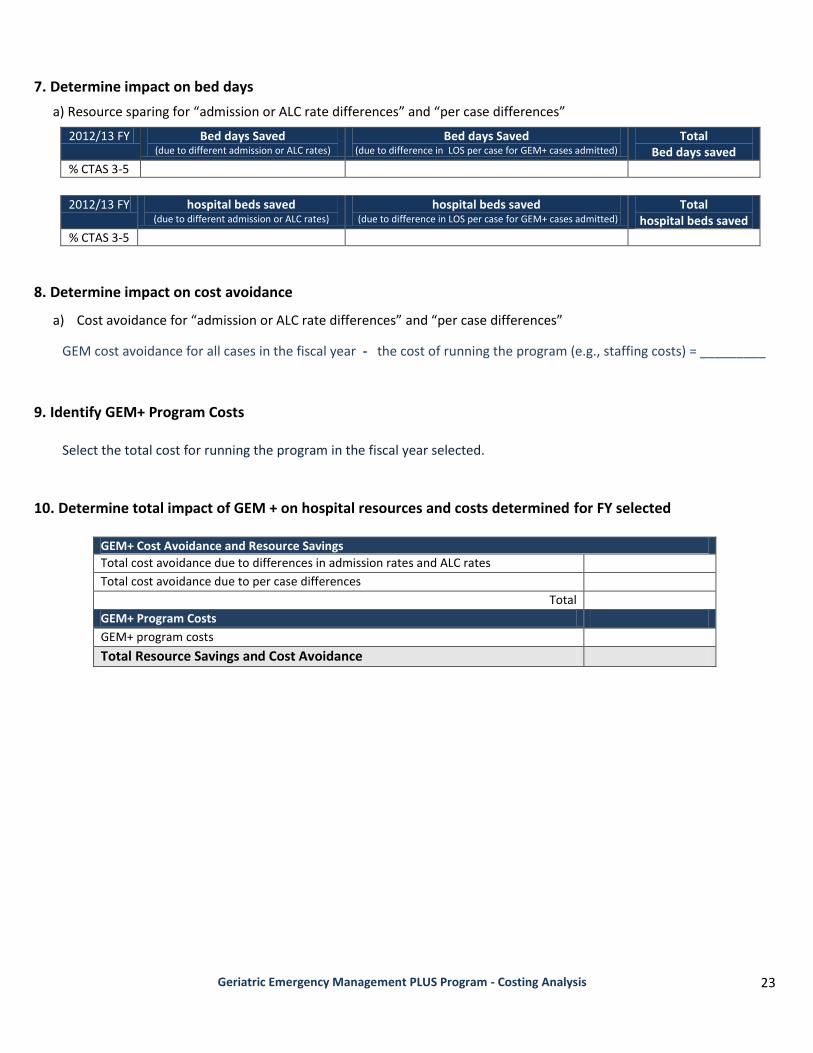
7. Determine impact on bed days
a) Resource sparing for “admission or ALC rate differences” and “per case differences”
2012/13 FY Bed days Saved (due to different admission or ALC rates)
Bed days Saved (due to difference in LOS per case for GEM+ cases admitted)
Total Bed days saved
% CTAS 3-5
2012/13 FY hospital beds saved
(due to different admission or ALC rates) hospital beds saved
(due to difference in LOS per case for GEM+ cases admitted) Total
hospital beds saved
% CTAS 3-5
8. Determine impact on cost avoidance
a) Cost avoidance for “admission or ALC rate differences” and “per case differences”
GEM cost avoidance for all cases in the fiscal year - the cost of running the program (e.g., staffing costs) = _________
9. Identify GEM+ Program Costs
Select the total cost for running the program in the fiscal year selected.
10. Determine total impact of GEM + on hospital resources and costs determined for FY selected
GEM+ Cost Avoidance and Resource Savings
Total cost avoidance due to differences in admission rates and ALC rates Total cost avoidance due to per case differences
Total GEM+ Program Costs GEM+ program costs
Total Resource Savings and Cost Avoidance
Geriatric Emergency Management PLUS Program - Costing Analysis 24
Appendix B: Flow Chart
# Non-GEM Discharged
Non-Admits
Discharged Home
# GEM Admitted
Direct Admits from
Index visit
# Non-GEM Admitted
Direct Admits from Index
visit
# GEM Admitted
Non-Admits
Revisit + Admitted ≤ 30 days
# GEM Admitted
Non-Admits
Revisit + Admitted ≤ 30 days
_____Total # Discharged at Index Visit _____Total # Admitted at Index Visit
# GEM Total Admits
≤ 30 days
# Non-GEM Total Admits
≤ 30 days
# Non-GEM Discharged
Discharged and were not
admitted ≤ 30 days
# GEM Discharged
Discharged and were not
admitted ≤ 30 days
# GEM
Non-Admits
Discharged
# Non-GEM
Non-Admits
Discharged
GEM or
Non-GEM
Admit or
DischargeAdmit or
Discharge
Total # Non-GEM Visits Total # GEM Visits
# GEM Discharged
Non-Admits
Discharged Home
Admit or
Discharge
Admit or
Discharge
Total # ED Visits
# stay
discharged# stay
discharged
# GEM Admitted
become ALC
# Non-GEM Admitted
become ALC
# GEM Direct Admits
become ALC
# Non-GEM Direct Admits
Become ALC
# GEM
Discharged cases that
re-visit ED ≤ 30 days
# Non-GEM
Discharged cases that
re-visit ED ≤ 30 days
# GEM Revisit
ED
# Non-GEM
Revisit ED
# GEM
Discharged cases that
revisit ED & are admitted
≤ 30 days
# Non-GEM
Discharged cases that
revisit ED & are admitted
≤ 30 days
_____Total # Admitted at ED Revisit