Embed Size (px)
Citation preview

Geographic Variation of Adaptive Characters in Rana pipiens SchreberAuthor(s): John A. MooreSource: Evolution, Vol. 3, No. 1 (Mar., 1949), pp. 1-24Published by: Society for the Study of EvolutionStable URL: http://www.jstor.org/stable/2405448 .
Accessed: 18/09/2013 14:54
Your use of the JSTOR archive indicates your acceptance of the Terms & Conditions of Use, available at .http://www.jstor.org/page/info/about/policies/terms.jsp
.JSTOR is a not-for-profit service that helps scholars, researchers, and students discover, use, and build upon a wide range ofcontent in a trusted digital archive. We use information technology and tools to increase productivity and facilitate new formsof scholarship. For more information about JSTOR, please contact [email protected].
.
Society for the Study of Evolution is collaborating with JSTOR to digitize, preserve and extend access toEvolution.
http://www.jstor.org
This content downloaded from 129.93.16.3 on Wed, 18 Sep 2013 14:54:29 PMAll use subject to JSTOR Terms and Conditions
EVOLUTION INTERNATIONAL JOURNAL OF ORGANIC EVOLUTION
PUBLISHED BY
THE SOCIETY FOR THE STUDY OF EVOLUTION
Vol. III MARCH, 1949 No. 1
GEOGRAPHIC VARIATION OF ADAPTIVE CHARACTERS IN RANA PIPIENS SCHREBER1
JOH N A. MOORE
Barnard College, Columbia University, and The American Museum of Natural History, New York
Received August 2, 1948
As currently understood the origin of a new species in terrestrial vertebrates ap- pears to depend on three processes. The first consists of the appearance of a va- riety of genotypes through recombination and to a much lesser extent through muta- tion. The second process, which usually occurs in a limited portion of the species' range, involves the increase in frequency of genotypes that better adapt the indi- viduals possessing them to the conditions of the local environment. This increase in frequency is due to natural selection. The third process, which may be a special case of the second, consists of the development of mechanisms that can prevent gene ex- change between the regionally adapted population and the remainder of the spe- cies. The first process results in an in- creased variability within the population. The second process, which involves the regional differentiation of the population, may lead to the division of the species into subspecies. The third process, leading to the development of isolating mechanisms, is the final step in the formation of new species. This outline is obviously a sim- plification of the extremely complex phe- nomenon of speciation and represents but one of the many methods by which a new species may orizinate.
1 These studies were aided by a grant from the Penrose Fund of the American Philosophi- cal Society.
The present paper is part of a series de- voted to accumulating data pertinent to the problems of speciation in the frog Rana pipiens. Accounts of geographic varia- tion (Moore, 1944) and of interracial hybridization (1946) have already been presented. The data that will now be given are concerned with the possible oc- currence of regionally adapted populations in this species (the "second process" de- scribed in the preceding paragraph). Adaptation is of course universal in or- ganisms. The very existence of a species is an indication of a close harmony be- tween it and its environment, yet any study of the origin and nature of adap- tive characters is beset with many difficul- ties. In the first place th-e environment acts on the whole organism and not on its particulate morphological and physio- logical characteristics. In the second place, it is frequently difficult to appreci- ate the adaptive significance of a given structure or process. These and other difficulties have led some investigators to deny that the differences distinguishing species and varieties have any adaptive sigificance. To be sure neutral or slightly deleterious characters may increase in fre- quency under some conditions. However it is probable that many or most of the characters differentiating related forms
EVOLUTION 3: 1-24. March, 1949.
This content downloaded from 129.93.16.3 on Wed, 18 Sep 2013 14:54:29 PMAll use subject to JSTOR Terms and Conditions

2 JOHN A. MOORE
have arisen directly or indirectly as a result of natural selection. By implication they must have some adaptive value or be associated with characters that have adap- tive significance.
A possible way to circumvent some of the4se difficulties involves- the selection for study of those characters that are shared in common by different species oc- cupying similar environments. When it is found, for example, that many unrelated homothermic animals have northern races which are larger than southern races, we can be reasoiiably sure that the increased body size of the northern individuals has an adaptive significance. This is essen- tially the manner in wIich adaptive char- acters were selected for study in Rana pipiens. First, northern and southern species were compared to find those char- acters that showed a correlation with dis- tribution and therefore probably repre- sented adaptations to temperature (Moore, 1939, 1940, 1942a, 1942c). This investi- gation revealed that a number of embry- onic characters such as temperature tol- erance, rate of development, temperature coefficient of development, type of egg mass, and size of egg were closely cor- related with geographic distribution. The nature of the differences between northern and southern species can be brought out in a comparison of Rana sylvatica and Racn catesbeidna. The former may be thought of as the most northern and the latter as the most southern of the frogs found in the New York region.
Northern limit Lower limiting embry-
onic temperature Upper limiting embry-
onic temperature Interval between first
cleavage and gill cir- culation at 200 C.
Temperature coeffi- cient b
Type of egg mass
Egg diameter
Rana sylvatica
670 30' N. 2.50 C.
240 C.
72 hours
1.98
compact and
submerged 1.9 mm.
Rana catesbeiana
470 N. 150 C.
320 C.
134 hours
2.88.
loose surface film
1.3 mm.
There is little doubt that these embryonic features that distinguish the two spe- cies have an adaptive significance. After this preliminary study on different spe- cies a single species was investigated. The -da-ta toz be presented in this paper are concerned with the geographic variation of the above mentioned embryonic char- acters in Rana pipiens.
Rana pipiens has the greatest distribu- tion of any American frog. It occupies most of our continent from northern Can- ada to Panama. There is considerable variation in the appearance of the indi- viduals from different geographic regions. This has led some investigators to split Rcancn pipiens into a number of subspecies or even into different species. The lack of any generally accepted opinion on the "pipiens problem" led to a re-examination of its taxonomy (Moore,, 1944). After studying much material from eastern North America it became apparent that the characters generally employed in dividing the populations into different species or subspecies were not reliable. It was thought best to regard all eastern Ameri- can meadow frogs as belonging to one. species which cannot be divided into a con- venient number of readily defined subspe- cies, unless a tremendous number of races are regarded as valid subspecies.
MATERIALS AND METHODS
In the experiments to be reported in this paper material from the following localities was used: Montreal, Quebec; Alburg, Vermont; western Wisconsin; Mt. Ephraim, New Jersey; Chalmette, Louisiana; Ocala, Florida; Engle- wood, Florida; Pyote, Texas; and Axila, Mexico.
Fertilized eggs were obtained by the now: standard pituitary injection method. Ovulation was induced by injections of frog anterior pituitary glands. The eggs were fertilized with a sperm suspension made by cutting up the testes of one or more males in spring water, 0.1 Ringer's or 0.1 Holtfreter's Solution. About 15 minutes before first cleavage the embryos were separated into small groups, placed in cov- ered containers with either spring water, 0.1 Ringer's, or 0.1 Holtfreter's Solution, and then distributed to the constant temperature baths, incubators, and cold rooms that were used in
This content downloaded from 129.93.16.3 on Wed, 18 Sep 2013 14:54:29 PMAll use subject to JSTOR Terms and Conditions

ADAPTIVE CHARACTERS IN RANA PIPIENS 3
controlling the temperature. In most of the experiments constant temperature baths were used exclusively. Frequent measurements were made of the temperature in the dishes where the embryos were developing. In those cases where the standard error of the mean was 0.10 C. or less only the mean temperature will be given. If the standard error was 0.2? or greater both the mean and standard error are given.
The embryos were examined at frequent in- tervals and the degree of development ex- pressed in terms of Pollister's Stages (Pollister and Moore, 1937). In some instances the let- ter E, M, or I is added to signify early, middle, or late. The embryos were said to be in a given stage if 50 per cent of them showed the characteristics for the stage in question. In most experiments embryos from two or more localities were fertilized simultaneously. When parallel experiments were run in this manner, minor differences in rate of development are readily apparent. This method has the great advantage of making it unnecessary to note the exact time- when the embryos enter a given stage, which would be necessary if the experi- ments were conducted at different times.
Temperature tolerance was determined by the per cent normal development observed over a range of temperatures. If 50 per cent, or more, of the embryos were normal the tem- perature at which they were kept was said to be in the normal range.
It was customary to examine the embryos when they were in Stage 19 or 20 to determine the per cent that were defective. It should be realized that the embryos not developing nor- mally might be doing so for reasons not asso- ciated with temperature (such as failure of fertilization or through the possession of ab- normal genotypes). This difficulty was par- tially overcome in the following manner. The highest percentage normal development ob- served was taken as 100 per cent. The data for the remaining temperatures were then ad- justed, to this base. When this procedure was followed the data are designated as "adjusted." When not so specified the data are in the form actually recorded. In the majority of cases this resulted in little or no adjustment of the data because the highest per cent normal develop- ment was between 95 and 100. An additional indication of temperature tolerance comes from observations on the morphological features of. the embryos themselves. Heat and cold injury is not an all-or-none phenomenon and definite indications of injury can be observed even though the embryos continue their development. Observations of this nature will be given in the description of the various experiments.
1. EMBRYONIC -TE-MPERATURE TOLER- ANCE AND RATE OF DEVELOPMENT
a. Vermont and Wisconsin The vast majority of Rana pipiens used
in biological laboratories are secured di- rectly or indirectly from the Lake Cham- plain district of Vermont or from Wis- consin. Individuals from these two lo- calities resemble one another closely in structural features and appear to be identi- cal in the embryological characters that I have studied. In nearly all the experi- ments in which the temperature tolerance and rate of development of different local populations- of Rana pipiens was studied it was possible to run a parallel experiment with either Vermont or Wisconsin ma- terial. Thus embryos from these two lo- calities served as a standard or basis of comparison. Rate data for these two lo- calities need not be given separately since most of the succeeding experiments will have observations on one or the other.
It might be mentioned that the variation observed in rate of' development among different groups of embryos from the same locality ranges about 2 per cent on either side of the mean. This value is based upon a large amount of data collected over a period of 12 years from Vermont em- bryos.
The lower limiting temperature for Vermont embryos is about 50 (Fig. 1). Previously I have reported this value to be 60 (Moore, 1942a) but additional ex- periments have led to the conclusion that the lower value more closely approximates the average for 50 per cent normal devel- opment. I have not observed normal de- velopment at 40 or below. At 50 the per cent normality has varied from 20 to 100. The average upper limiting temperature for 50 per cent normal development is 28?. At 300 the per cent normality is usually 0 but in one experiment' it was 100. The lowest temperature at which some evi- dence of heat injury can be expected is 27.50:
The lower limiting temperature for Wisconsin embryos has not been deter-
This content downloaded from 129.93.16.3 on Wed, 18 Sep 2013 14:54:29 PMAll use subject to JSTOR Terms and Conditions

JOHN A. MOORE
100 0 CD 8
I ~ ~~~ o o o2 0~~~~~~~~~
-j75
a: 0 0 z 1-50 1x %,\ z
CL 25
A
A
0 ~~~~~~~~~~~~~~~~~0 10 15 20 25 30*
OS VT TEMPERATURE x WIS.
FIG. 1. Per cent normal development of Vermont (circles) and Wis- consin embryos (crosses) at various temperatures. The data are "adjusted" (see Materials and Methods). The curve represents an attempt to express not only the data shown on the graph but also to estimate the morphological indication of heat injury. Thus the curve is drawn at 100 per cent between 6.5 and 260, because there is no indication of heat or cold injury in this tem- perature region. It is believed that failure to observe 100 per cent normal development in this range is due to factors not concerned with temperature tolerance. Data from 14 Vermont and 8 Wisconsin females.
mined. In two cases development was normal at 8.60. The upper limiting tem- perature is the same as in Vermont em- bryos. Considerable data on Wisconsin material have already been presented (Moore; 1942b). In the paper referred to a comparison was made--of the tempera- ture tolerance' of Wisconsin pipiens and its burnsi mutant (the burnsi mutant dif- fers from wild type in possessing a single dominant gene which suppresses the dorsal spots). The burnsi gene does not affect embryonic temperature tolerance, so ob- servations on individuals carrying this gene can be included. The data on Wis- consin pipiens and Wisconsin burnsi, but not their "hybrids," are given in Figure 1 after they were adjusted in the manner described previously (see "Materials and Methods").
The mean percentage normal develop- ment for Wisconsin embryos at 27.50 was 58 + 11 and at 29.70 it was 20 + 9 (Table 4). The mean percentage for 10 groups
of Vermont embryos developing at tem- peratures within 0.20 of 27.50 was 85 + 4. The mean percentage for 9 groups of Vermont embryos developing. at tem- peratures within 0.10 of 29.70 was 47+ 14.
b. New Jersey Porter (1941) compared the rates of
development at 19.40 of Vermont pipiens with individuals collected along the 'Dela- ware River near Philadelphia and found them to be the same. I have studied ma- terial from the same general region and can confirm his observations.
A direct comparison of New Jersey aCnd Vermont embryos has been made on four occasions. Data for one of these experi- ments, begun November 8, 1940, will be given (Tables '1 and 2). At 11.4? no differences were detected between the two groups of embryos. At 15.5? the New Jersey embiyos were slightly ad- vanced at 64.3 hours but at 70 hours and
This content downloaded from 129.93.16.3 on Wed, 18 Sep 2013 14:54:29 PMAll use subject to JSTOR Terms and Conditions

ADAPTIVE CHARACTERS IN RANA PIPIENS S
TABLE 1. Comparison of rate of development in New Jersey and Vermont pipiens. Experiment1 of November 8, 1940
Age in Vermont New Age in Vermont New Age in Vermont I New
Hours Jersey Hours Jersey Hours Jersey
11.4? 15.50 18.50
0.0 3 3 0.0. 3 3 0.0 3 3 108.0 12 12 14.0 8E 8E 14.0 8 8 284.0 17L 1,L 36.0 IOL IOL 22.7 10 10 406.3 20 20 47.0 12M 12M 36.0 12L 12L
64.3 13 14E 42.0 13E 13E Z3 5? 70.0 14E 14E 60.3 16E 16E
*______ ________ ____90.8 16 16 70.3 17 17 117.0' 17 17 90.3 18 18 0.0 3 3 166.3 20E 20E 117.0 20E 20E
-13.5 IOE IOE' _ _ _ _ _ _ _ _ _ _ _ __ _ _ _ _ _ _ _
15.0 10 10 - _ _ _ _ _ _ _ _ - _ _ _ _
17.0 11?E 101E 27.60 29.8? 22.3 12M 12M 36.0 15E 16E 0.0 3 3 0.0 3 3 42.0 17E 16 13.5 tom 1oM 13.3 10 10 47.5 17 17 16.0 12E 12E 15.8 11 IlL 60.0 18 18 22.0 13L 14E 22.0 14 14 64.3 19E 19E 36.0 17 17 35.7 17 17 67.3 20 20E 42.0 18L 18L 41.5 18 18
47.0 19L 19L 47.3 20 20 48.0 20 20
1 In this and in the succeeding tables the embryos are described in terms of Pollister's Stages.
subsequently the two groups were identi- cal. At 18.50 the Vermont embryos ap- peared to be slightly more advanced at 60.3 hours. No difference was detected at any other time. At 23.5 + 0.2 the New Jersey embryos were slightly advanced at 36 hours but at 42.0, 42.7, and perhaps 67.3 hours the Vermont embryos were slightly ahead. At '27.6? it was again noticed that the New Jersey embryos formed neural folds (Stage 14) slightly earlier. At later times the degree of development was identical in the two groups. At 29.80 the percentage normal
TABLE 2. Percentage normal development of New Jersey and Vermont pipiens embryos in
parallel experiments. Experiment of Nov. 8, 1940. Raw data
15.550 J.50 23.50 27.60 29.80 32.00 33.50
N. J. 95 96 92 92 17 0 0 Vt. 100 96 96 88 4 0 0
development was very low, 4% in Ver- mont and 17%o in New Jersey material. Comparison of the normal embryos showed the two groups to be identical in growth rate, except for a possible difference at 15.8 hours. At the two highest tempera- tures used, namely 32.00 and 33.5?, all of the embryos were killed early in develop- ment.
In a second experiment comparisons of Vermnont and New Jersey embryos were made at 15.30, 18.50, and 23.80. Once again the New Jersey embryos seemed to undergo gastrulation and form neural folds slightly ahead of Vermont but thereafter the rate of development was identical.
In a third experiment observations on rate were made at 16.1??+ 0.20, 19.30, 21.80, 27.60 and 31.30. At the highest temperature 4 per cent of the New Jersey embryos formed fairly normal tadpoles but all of the Vermont ones were killed. At the remaining temDeratures the New
This content downloaded from 129.93.16.3 on Wed, 18 Sep 2013 14:54:29 PMAll use subject to JSTOR Terms and Conditions

6 JOHN A. MOORE
Jersey embryos developed slightly more rapidly than those from Vermont. The magnitude of the difference was equal to that which can be expected among embryos from different females of the same locality.
In a fourth experiment observations' were made at 19.20, 27.5 0, and 31.30. There was no survival at the 'highest tem- perature but at 19.20 and 27.50 develop- ment was normal. The New Jersey em- bryos exhibited their customary slight acceleration in gastrula stages but subse- quently the rates were identical.
In addition to these four parallel experi- ments with Vermont, New Jersey em- bryos have been compared with Quebec. (6 experiments)', Louisiana (1 experi- melt.), Ocala, Florida (3 experiments), and Texas (1 experiment). These will be referred to later.
The data on temperature tolerance gathered from the various experiments involving eggs of New Jersey females have been adjusted and plotted in Figure 2.' Some of the raw data from which this graph is constructed are given in Tables 2 and 3. The data are not sufficient to
establish the lower limiting temperature but those available indicate that New Jer- sey embryos- resemble those from Ver- mont and Wisconsin in this respect. Suffi- cient data are available to indicate that the behavior of New Jersey embryos at high temperatures is the same as for Vermont and Wisconsin (Fig. 2 and Table 4).
The general conclusion to be derived from observations on New Jersey embryos is that the upper limiting temperature, rate of development (except for a slight difference during gastrulation), and per- haps the lower, limiting temperature, are identical with these same features of Ver- mont embryos.
c. Quebec
The Quebec material was secured in the vicinity of Montreal. In general appear- ance the individuals from Quebec and Ver- mont are essentially the same. The devel- opment of six groups of embryos has been studied. Parallel experiments with New Jersey material, which we have seen is the same as Vermont, served as the basis of comparison.
10o 0 6 0
(9
75
0:
z0 ,50?
5 10 05 o 5 0
w
0~~~~~~~~~~~~~~~
00
0~~~~~~~~~~~~~~~~ 10'lo 150 20 25' 30'
o= N.J. TEMPERATURE X QUE.
FIG. 2. Per cent normal development of New Jersey (circles) and Quebec embryos (crosses) at various temperatures. The curve is the same as in Figure 1. Data from 8 New Jersey and 4 Quebec females.
This content downloaded from 129.93.16.3 on Wed, 18 Sep 2013 14:54:29 PMAll use subject to JSTOR Terms and Conditions

ADAPTIVE CHARACTERS IN RANA PIPIENS 7
TABLE 3. Per cent normal development of Quebec and New Jersey embryos in parallel experiments. Raw data
Source 15.40 18.60 23.60 25.40 27.60 29.70 31.80
12/7/40 Quebec 97 93 95 77 30 12/7/40 N. J. 70 64 55 12 2 _
12/7/40 Quebec 67 78 60 23 0 12/7/40 N. J. 96 94 99 75 54 -
12/21/40 Quebec 98 95 95 88 33 0 12/21/40 Quebec 96 96 76 56 2 0 12/21/40 N. J. 94 87 90 73 34 0
In the first experiment the rate of de- velopment of Quebec and New Jersey embryos was identical, except during gas- trulation. Once again the New Jersey embryos reached the neural fold stage slightly earlier (see section on New Jer- sey). Observations were made at 15.40, 18.70, 23.7 + 0.20, 27.60, and 29.70.
In the second experiment the same tem- peratures were used. The Quebec em- bryos were killed at 29.70 so no compari- son could be made with New Jersey. The rate of development, except for the differ- ence during gastrulation noted before, was identical with New Jersey embryos at 18.60, 23.6 -+- 0.20, and 27.50. At 15.40 the New Jersey embryos developed slightly more rapidly. The magnitude of the dif- ference was estimated as 2 per cent.
In the third experiment two different groups of Quebec and two different groups of New Jersey embryos were observed at 15.40 and 18.60. At 18.60 the four groups developed synchronously. At 15.40 one group of Quebec and one group of New Jersey developing at the same rate reached Stage 20 slightly ahead of the other Que- bec and New Jersey embry9s.
In the fourth experiment two groups of Quebec embryos were run with one group of New Jersey embryos at 15.60, 18.70, 25.40, 27.60, 29.70, and 31.80. At the two highest temperatures development was not sufficiently normal to measure rate of development. At 27'60 and 25.40 the two Quebec groups differed very slightly in rate and the New Jersey emnbryos were intermediate. At 18.70 the New Jersey
embryos appeared to develop slightly more rapidly than either Quebec group. At 15.60 one group from Quebec developed synchronously with the New Jersey em- bryos but slightly more rapidly than the other Quebec group.
Apart from the difference in gastrula- tion no significance is attached to these minor variations in the rate of develop- ment. The magnitude is never greater than is to be expected among different groups of embryos from the same locality-.
TABLE 4. Mean per cent normal development for Vermont, Wisconsin, New Jersey, and Quebec
embryos developing at 27.5-27.7' and 29.7-29.8?. Adjusted data
Number Number of Per cent of Per cent
experi- normal experi- normal ments ments
27.5-27.70 29.7-29.80
Vermont 10 85? 4 a14 9 47?14 a43 Wisconsin 8 584?11 a32 8 20 4? 9 a25 New Jersey 7 684t10 c26 4 28?t10 a19 Quebec 4 64?:12 c23 4 4 1 22 ?: 7 a13
The percentage normal development re- corded in these experiments is given in Table 3. The data of Table 3 were then adjusted and entered on the graph of Figure 2. In Table 4 a comparison is made of the percentage normal develop- ment in Vermont, Wisconsin, New Jersey, and Quebec embryos. The differences are not significant. It would appear that the response to high temperatures is the same in material from these four localities. No
This content downloaded from 129.93.16.3 on Wed, 18 Sep 2013 14:54:29 PMAll use subject to JSTOR Terms and Conditions

8 JOHN A. MOORE
TABLE 5. Per cent normal development of Louisiana and Vermont embryos. Raw data
Experiment | Locality | 663- |8.220 19.3 | 218-| 23.&8q 275 | 33Oq 331 30 | 33.26 Experient LoalIty 6.40 21.90 24.00 Z7.70 30.20 31.60 33.60
11/5/42 La. 54 _ _ 91 95 95 89 72 a 11/5/42 Vt. 54 _ 84 76 74 0 0 0
11/6/42 La. 96 - - 97 99 93 32 0
11/11/42 La. 68 83 77 75 73 _ 81 - 11/11/42 La. 33 - 1OO! 97 93 92 _ 91 0
12/15/41 La. ' 88 _ _ - - 64 2 12/15/41 La. - 78 - _ _ 92 11 12/15/41 La. _ 82 _ 96 52
observations have been made on Quebec embryos developing below 150 so the lower limiting temperature is not known. It is thought to be'identical to that for Vermont embryos, namely 5?.
The general conclusion to be derived from these experiments is that Rana pipiens embryos from Quebec, Vermont, Wisconsin, and New Jersey have the'same temperature characteristics. There is no evidence of geographic variation in the adaptive characters which are under in- vestigation.
d. Louisiana Observations have been made on em-
bryos from eight Louisiana females. In two cases parallel experiments were made using Vermont embryos. In another case embryos from New Jersey andc Ocala, Florida were available for comparison.. In the remaining five experiments only Louisia'na embryos were studied.
In the first experiment begun Novem- ber, 5, 1942 comparing Louisiana and Vermont embryos observations were made at 6.4 -+? 0.40, 21.90, 24.00, 27.70, 30.20, 31.60, and 33.60. The percentage normal development is given in Table 5. Both groups showed more than 50 per cent nor- mal 'development at 6.4 + 0.4 ? but at the higher temperatures there was a marked difference between the Louisiana and Ver- mont embryos. The former are clearly adapted to higher temper-atures. The rate of development was studied at two
temperatures only (Table 6). At 21.90 the Louisiana embryos developed more rapidly and at Stage 20 showed a 9 per cent acceleration.2 At 24.0 the Louisiana embryos also developed more rapidly. This time they showed a 6 per cent ac- celeration at Stage 20.
In the experiment of November 6, 1942 embryos from a Vermont female were placed at 21.90 and at 24.00 while Loutisi- ana embryos were placed at 6.4 iO- 0.40, 21.90, 24.00, 27.50, 30.10, 31.50, and, 33.80. The percentage normal develop- ment of the Louisiana embryos is given in Table 5. There was -no indication of defects due to temperature below 31.60. At 31.60 there were irregularities in gastrulation and at 33.80 the embryos showed no sign of development. At 21.90 the Vermont embryos reached Stage 20
2 The -degree of retardation or acceleration is given in comparison with the rate of Vermont (or New Jersey or Wisconsin, both of which are identical to Vermont). Acceleration is determined as follows:
TsTtX 100, Tvt
Retardation is determined as follows:
Tvt -T X 100 Tvt
Tvt is the time required by Vermont, Wis- consin, or New Jersey embryos to reach a given morphological stage. T. is the time re- quired by embryos of the locality being studied to reach the same stage.
This content downloaded from 129.93.16.3 on Wed, 18 Sep 2013 14:54:29 PMAll use subject to JSTOR Terms and Conditions
ADAPTIVE CHARACTERS IN RANA PIPIENS 9
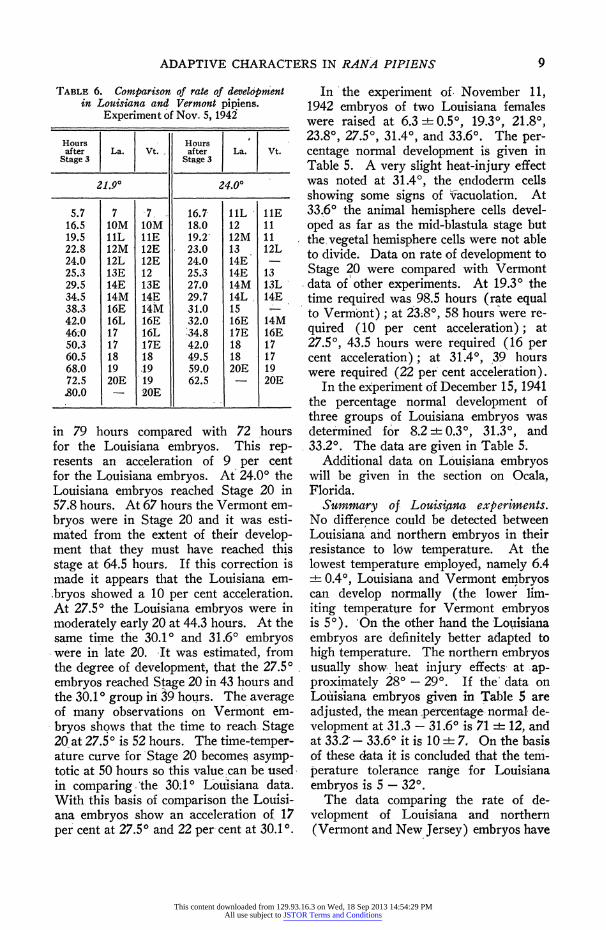
TABLE 6. Comparison of rate of development in Louisiana and Vermont pipiens.
Experiment of Nov. 5, 1942
Hours Hours after La. Vt. after La. Vt.
Stage 3 Stage 3
21.90 24.00
5.7 7 '7, 16.7' IlL lIE 16.5 lOM lOM 18.0 12 11 19.5 IlL IIE 19.2- 12M 11 22.8 12M 12E 23.0 13 12L 24.0 12L 12E 24.0 14E -
25.3 13E 12 25.3 14E 13 29.5 14E 13E 27.0 14M 13L 34.5 14M 14E 29.7 14L 14E 38.3 16E 14M 31.0 15 -
42.0 16L 16E 32.0 16E 14M 46.0 17 16L 34.8 17E 16E 50.3 17 17E 42.0 18 17 60.5 18 18 49.5 18 17 68.0 19 19 59.0 20E 19 72.5 20E 19 62.5 _ 20E ?0.0 20E
in 79 hours compared with 72 hours for the Louisiana embryos. This rep- resents an acceleration of 9 per cent for the Louisiana embryos. At 24.00 the Louisiana embryos reached Stage 20 in 57.8 hours. At 67 hours the Vermont em- bryos were in Stage 20 and it was esti- mated from the extent of their develop- ment that they must have reached this stage at 64.5 hours. If this correction is made it appears that the Louisiana em- .bryos showed a 10 per cent acceleration. At 27.50 the Louisiana embryos were in moderately early 20 at 44.3 hours. At the same time the 30.10 and 31.60 embryos were in late 20. 'It was estimated, from the degree of development, that the 27.50 embryos reached Stage 20 in 43 hours and the 30.10 group in 39 hours. The average of many observations on Vermont em- bryos shows that the time to reach Stage 20 at 27.50 is 52 hours. The time-temper- ature curve for Stage 20 becomes asymp- totic at 50 hours so this value can be used, in comparing-'the 30.10 Lotuisiana data. With this basis of comparison the Louisi- ana embryos show an acceleration of 17 per cent at 27.50 and 22 per' cent at 30.10.
In 'the experiment of November 11, 1942 embryos of two Louisiana females were raised at 6.3 +4- 0.50, 19.30, 21.80, 23.80, 27.50, 31.40, and 33.60. The per- centage normal development is given in Table 5. A very slight heat-injury effect was noted at 31.40, the endoderm cells showing some signs of vacuolation. At 33.60 the animal hemisphere cells devel- oped as far as the mid-blastula stage but the vegetal hemisphere cells were not able to divide. Data on rate of development to Stage 20 were compared with Vermont data of other experiments. At 19.3? the time required was 98.5 hours (rate equal to Vermont); at 23.80, 58 hours were re- quired (10 per cent acceleration); at 27.50, 43.5 hours were required (16 per cent acceleration); at 31.40, 39 hours were required (22 per' cent acceleration).
In the experiment of December 15, 1941 the percentage normal development of three groups of Louisiana embryos was determined for 8.2 + 0.30, 31.30, and 33.20. The data are given in Table 5;
Additional data on Louisiana embryos will be given in the section on Ocala, Florida. ISummary of Louiszana experiments.
No difference could be detected between Louisiana and northern embryos in their resistance to low temperature. At the lowest temperature employed, namely 6.4 + 0.40, Louisiana and Vermont embryos can develop normally (the lower lim- iting temperature for Vermont embryos is 50). 'On the other hand the Louisiana embryos are definitely better adapted to high temperature. The northern embryos usually show heat injury effects' at ap- proximately 280 - 290. If the' data on Lou'isiana embryos given in Table 5 are adjusted, the mean-peroentage- normal' de- velopment at 31.3 - 31.60 is 71 =!= 12, and at 33.2- 33.60 it is 10 -+ 7, On the basis of these data it is concluded that the tem- perature tolerance range for Louisiana embryos is 5 - 320.
The data comparing the rate of de- velopment of Louisiana and northern (Vermont and New Jersey) embryos have
This content downloaded from 129.93.16.3 on Wed, 18 Sep 2013 14:54:29 PMAll use subject to JSTOR Terms and Conditions

10 JOHN.A. MOORE
been summarized in Figure 3. This graph was constructed as follows. The rate of development of Vermont or New Jersey embryos is taken as 0. The degree of ac- celeration, or retardation observed in the Louisiania embryos is then plotted. There is a paucity of data below 200 but the gen- eral trend can be ascertained. At the higher temperatures the Louisiana em- bryos develop about 20 per cent more rap- idly than the northern embryos. As the temperature is decreased the difference in rate becomes less. If the curve describing
*40 w
Li
Z 0 e_VT.
cr U.V
-,20-
5 10 5- 20 25 30 35 C. TEMPERATURE
FIG. 3. Comparison of rate of development of Louisiana and northern embryos (Vermont and New Jersey). The interval studied was the time between Stages 3 and 20. Values for the northern embryos, labelled at "Vt.," are taken as 0. Data for Louisiana are expressed as per cent retardation or acceleration. Data from 5 Louisiana females are represented by black dots.
these data represents the average condi- tion we would expect the rate of the two types of embryos to be identical at 170 and the Vermont embryos to be more rapid at lower temperatures. This assumption can- not be corroborated by the -data presented since so few observations were made be- low 200. However, other southern em- bryos, for which data will be presented, do have the type of development shown by the line of the graph so it is probable that the conclusion is essentially correct.
It is clear that Louisiana embryos are adapted differently to temperature than are the northern races already described.
e. Ocala, Florida Eggs from nine Ocala, Florida females
have been studied. In one case eggs from New Jersey were compared with those from Florida. In three cases both New Jersey and Vermont material was avail- able for comparison. In still another ex- periment embryos from Ocala, Texas, and Vermont were compared. In the remain- ing four experiments only Ocala material was available.
The experiment of November 26, -1942 was carried out using material from Ocala, Louisiana, and New-Jersey. Data on rate of development are given in Table 8. At 14.60 the Louisiana embryos
TABLE 7. Per cent normal development of Florida (Ocala), Louisiana, New Jersey and Vermont embryos. Raw data
8.3
Experiment Locality 5.47L 8.3 2i| 14.70 16.1d 19J10| 21 .80 Z3.80 27.40| 29.80| 31.10| 33.00 0.20 0.20 0.20 19.40 27.60 30.20 31J50 33.70
12/17/41 Ocala 90 93 66 18 12/17/41 Ocala 0 88 96 94 69
12/26/42 Ocala _ - 66 72 84 90 _ 90 0 12/26/42 La. . _ 100 - 83 - 84 18 _ 0 0 12/26/42 N. J. . 94 - 94 - 96 41 . 0 0
12/10/42 Ocala _ _ 62 86 63 73 - 56 4 12/10/42 Vt. . - < 100 90 92 _ 88 - 0 0 12/10/42 N. J. _ _ _ 89 92 82 74 - 4 -
12/23/42 Ocala 0 - 92 80 _ 71 12/23/42 Ocala 0 - 494 - 90 - 76 12/23/42 N. J. 33 - 83 - 74 - 0 12/23/42 Vt. 24 - 68 - 71 - 0
This content downloaded from 129.93.16.3 on Wed, 18 Sep 2013 14:54:29 PMAll use subject to JSTOR Terms and Conditions

ADAPTIVE CHARACTERS IN RANA PIPIENS 11
TABLE 8. Comparison of rate of development in Florida (Ocala), Louisiana and New Jersey pipiens. Experiment of November 26, 1942
Hours after | Ocala La. N. J. Ocala La. N. J. Stage 3 Stage 3
14.60 19.10
18.5 8 8 8 14.5 9 28.3 9 9 9 17.0 9 9 9 37.5 10E 10E 10E 19.3 10E 10E 10E 47.4 12E 12E 12E 22.0 10L toM 10 59.0 13 13 12L 24.5 12E 12E 11 69.0 13L 13L 13L 27.0 12' 12 12E 74.3 14E 14E 14E 32.3 13 13 12L 94.5 14L 14L 14L 35.7 13L 13L 13E
100.5 14L 16E 16E 38.0 14E 14E 14E 107.7 16E 16 16 40.5 14E 14E 117.8 17E 17 17 45.5 14M 14M 14M 139.0 17 18E 17 48.0 14L 14L 14L 141.0 17 18E 18E 50.3 16E 16E 14L 145.0 18E _ 52.5 16E 16E 16-E 162.7 18 18 18 55.7 16L 16L 16 172.3 18 19 18 58.3 17E 17 16L 186.5 19L 19L 64.0 17 190.0 _ 20E 19 68.0 17 18 17 192.0 20E 73.8 18 18 202.0 20E _ 83.0 18L 19 18
-92.7 19 19L 19 27.60 95.3 19 20E 19
98.3 20E 19
1-1.0 11 10E 10E 100.0 _ 20 13.D 12 12E 11 14.0 . 13 12 12E 23.80 16.7 13L 13 12M 19.0 14E 13L 13E 11.0 10E 9 9 21.3 14L 14M 14E 13.3 1OE 10E 10E 23.0 16E 14L 14M 17.0 12E 12E' 11L 24.0 16 15 14L 19.0 12L 12M 12E 26.5 17E 16E 16E 21.5 13L 13L 12L 28.7 17 17. 16 23.0 14E 13L 13 32.0 18 18E 17 24.0 14E 14E 13 35.0 18 18 17 26.8 14M' 14 14E 37.7 19 18L 18 29.6 14L 14L 14E 40.0 19 19 18 32.0 16M 16E 14L 42.0 20E 19L 18 35.5 17E 16L 16E 45.0 20M 20 19 38.0 17 17 16L 49.6 20 40.3 17 17 17
42.5 18 18 17 31.50 45:3 18 18 17
___________ _________ - _________________4 8 .0 18 18 18 50.0 19E 19E 18
10.5 12M 29 .9 50 19 19 18 11.3 1 2 dead dead 55.5 20E 19 19 14.0 13L 57.7 20E 19L 16.5 14M 58.7 20E 19 18.7 16E 63.5 20E 22.7 17 26.3 128 31.7 1 9 36.0 20E
This content downloaded from 129.93.16.3 on Wed, 18 Sep 2013 14:54:29 PMAll use subject to JSTOR Terms and Conditions
12 JOHN A.- MOORE
developed at essentially the same rate as New Jersey. Both were more rapid than Ocala. At 19.10 the Louisiana embryos showed a 5 per cent a'cceleration and the Ocala embryos a 2 per cent acceleration compared to New Jersey in the interval between Stages 3 and 20. At 23.80 the Ocala embryos are the most rapid in their developement. They show a 13 per cent acceleration and the Louisiana material 8 per cent compared to New Jersey. The highest temperature at which all groups developed was 27.50. At this point the per cent acceleration in Ocala and Louisi- ana material was 15 and 9 respectively. At 31.5 hours the Ocala embryos reached Stage 20 in 36 hours. The New Jersey embryos were killed, so it is not possible to make a direct comparison of rate. How- ever, since the time-temperature curve for New Jersey embryos becomes asymp- totic at 50 hours we can use this value as the minimum time required between Stages 3 and 20 for the New jersey em- bryos. Compared with this value, the Ocala embryos show a 27 per cent acceler- ation. The per cent6 normal development for these embryos is given in Table 7.
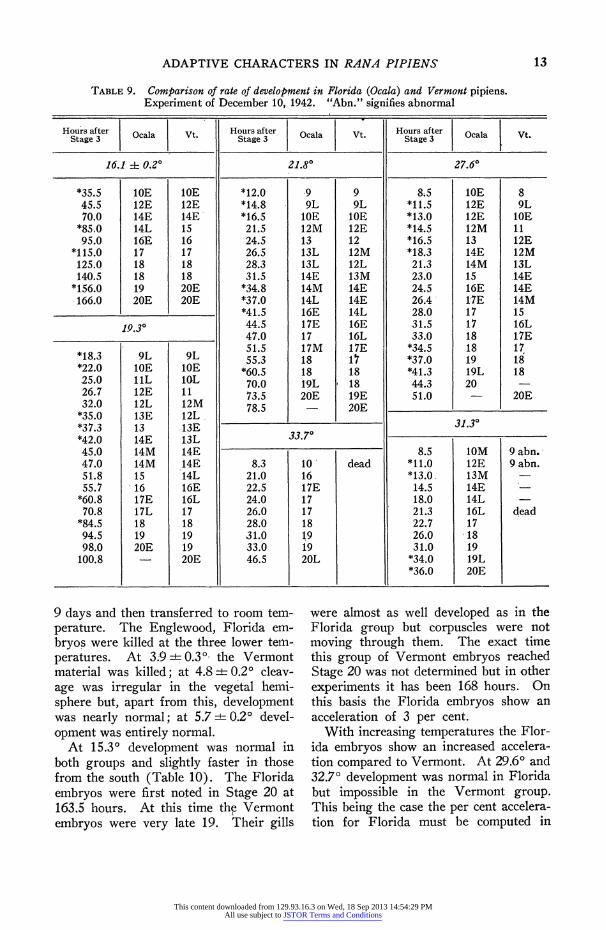
In an experiment begun December 10, 1942 embryos from Ocala, New Jersey, and Vermont were compared. To econo- mize on space the New Jersey data will not be given. Eggs of the Ocala and Ver- mont females were fertilized twice. The second fertilizations were made ten hours after the first. This device allows one to secure more complete data. Data secured from the second group are marked by an asterisk in Table 9. The results confirm those of the previous experiment. At 16.10 the Vermont embryos develop more rapidly. At 19.30 the two groups are about the same. With increasing tem- peratures the Ocala embryos show a pro- gressive acceleration. - Summary of Ocala, Florida experi- ments. From the data of Tables 7 and from ot-her experiments it is concluded that the normal temperature range is 9 - 33?. At 5.4 +4- 0.20 (two experiments), 6.8 + 0.20, and 8.3 + 0.20 the embryos
were not able to gastrulate. At 9.90 there was no evidence of cold injury dur- ing the first 171 hours of development (ex- periment terminated at this time). At the higher tempera:tures normal d'evelop- ment occurs at 31.30 (three experiments), 31.40, 31.50, and 31.60. In two experi- ments at 33.00 the per cent normality was 18 and 69. At 33.70 and 33.50 the per cent normality was 4 and 0 respectively.
w #40
Z +20- .S
z 0. ? VT.
C-20-
5 10 IS 20 25 30 35C. TEMPERATURE
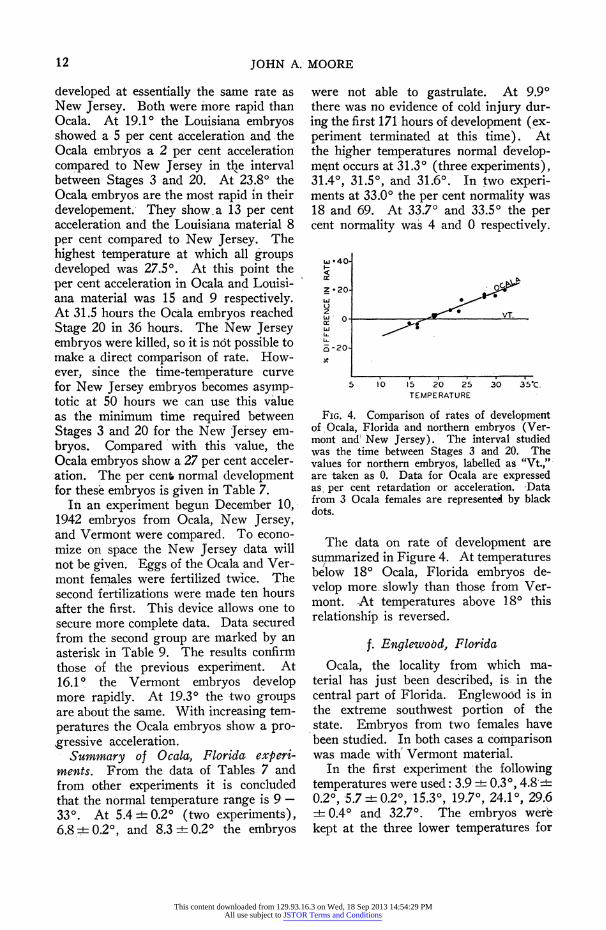
FIG. 4. Comparison of rates of development of Ocala, Florida and northern embryos (Ver- mont and' New Jersey). The interval studied was the time between Stages 3 and 20. The values for northern embryos, labelled as "Vt.,"- are taken as 0. Data for Ocala are expressed as per cent retardation or acceleration. Data from 3 Ocala females are represented by black dots.
The data on rate of development are summarized in Figure 4. At temperatures beflow 180 Ocala, Florida embryos de- velop more. slowly than those from Ver- mont. At temperatures above 18? this relationship is reversed.
f. Englewood, Florida
Ocala, the locality from which ma- terial' has just been described, is' in the central part of Florida. Englewood is in the extreme southwest portion of the state. Embryos from two females have been studied. In both cases a comparison was made with' Vermont material.
In the first experiment the following temperatures were used: 3.9 -+ 0.30, 4.8-4 0.20, 5.7 + 0.20, 15.30, 19.70, 24.10, 29.6 +i- 0.40 and 32.70. The embryos were kept at the three lower temperatures for
This content downloaded from 129.93.16.3 on Wed, 18 Sep 2013 14:54:29 PMAll use subject to JSTOR Terms and Conditions
ADAPTIVE CHARACTERS IN RANA PIPIENS 13
TABLE 9. Comparison of rate of development in Florida (Ocala) and Vermont pipiens. Experiment of December 10, 1942. "Abn." signifies abnormal
Hours after Ocala Vt. Hours after Ocala Vt. Hours after |Ocala Vt Stage 3 Stage 3 Stage 3 Oaa Vt
16.1 =1 0.20 21.80 27.60
*35.5 1OE 1E *12.0 9 9 8.5 OE 8 45.5 12E 12E *14.8 9L 9L *11.5 12E 9L 70.0 14E 14E *16.5 1OE 1OE *13.0 12E lOE
*85.0 14L 15 21.5 12M 12E *14.5 12M 11 95.0 16E 16 24.5 13 12 *16.5 13 12E
*115.0 17 17 26.5 13L 12M *18.3 14E 12M 125.0 18 18 28.3 13L 12L 21.3 14M 13L 140.5 18 18 31.5 14E 13M 23.0 15 14E
*156.0 19 20E *34.8 14M 14E 24.5 16E 14E 166.0 20E 20E *37.0 14L 14E 26.4 17E 14M
*41.5 16E 14L 28.0 17 15 19.30 44.5 17E 16E 31.5 17 16L
47.0 17 16L 33.0 18 17E 51.5 17M 17E *34.5 18 17
*18.3 9L 9L 55.3 18 17 *37.0 19 18 *22.0 1OE IOE *60.5 18 18 *41.3 19L 18 25.0 1lL laL 70.0 19L 18 44.3 20 26.7 12E 11 73.5 20E 19E 51.0 - 20E 32.0 12L 12M 78.5 20E _
*35.0 13E 12L I__ _ _ _ ___
_31__30_
*37.3 13 13E 031.3 *42.0 14E 13L 337? 45.0 14M 14E 8.5 tOM 9 abn. 47.0 14M 14E 8.3 10' dead *11.0 12E 9 abn. 51.8 15 14L 21.0 16 *13.0 13M -
55.7 16 16E 22.5 17E 14.5 14E *60.8 17E 16L 24.0 17 18.0 14L -
70.8 17L 17 26.0 17 21.3 16L dead *84.5 18 18 28.0 18 22.7 17 94.5 19 19 31.0 19 26.0 18 98.0 20E 19 33.0 19 31.0 19 100.8 20E 46.5 20L *34.0 19L
*36.0 20E
9 days and then transferred to room tem- perature. The Englewood, Florida em- bryos were killed at the three lower tem- peratures. At 3.9 - 0.30 the Vermont material was killed; at 4.8 +r 0.20 cleav- age was irregular in the vegetal hemi- sphere but, apart from this, development was nearly normal; at 5.7 + 0.20 devel- opment was entirely normal.
At 15.30 development was normal in both groups and slightly faster in those from the south (Table 10). The Florida embryos were first noted in Stage 20 at 163.5 hours. At this time the Vermont embryos were very late 19. Their gills
were almost as well developed as in the Florida group but corpuscles were not moving through them. The exact time this group of Vermont embryos reached Stage 20 was not determined but in other experiments it has been 168 hours. On this basis the Florida embryos show an acceleration of 3 per cent.
With increasing temperatures the Flor- ida embryos show an increased accelera- tion compared to Vermont. At 29.60 and 32.7? development was normal in Florida but impossible in the Vermont group. This being the case the per cent accelera- tion for Florida must be computed in
This content downloaded from 129.93.16.3 on Wed, 18 Sep 2013 14:54:29 PMAll use subject to JSTOR Terms and Conditions

14 JOHN A. MOORE
TABLE 10. Comparison of rate of development in Florida (Englewood) and Vermont embryos. Experiment of January 20, 1939.. Figures in parentheses are from other
experiments and are included for comparison
Hours after Fla. Vt. Hours after Fla. Vt. Hours after Fla Vt. Stage 3 Stage 3 Stage 3
15.30 19.70' 24.10
20.0 8 8 17.3 10 9 17.3 12 10 28.3 9 9 20.0 11 9L 20.0 13 11 37.3 11 10 21.0 11 9 24.0 14E 12 44.0 12 10L 24.0 12 10 28.3 14 13 54.3 13E 12 26.0 12 10 30.5 16E 13L 68.5 14E 13E 28.3 13E IIL 44.0 18 17 76.5 14 14E 30.5 13 12 48.3 18 17 79.0 14 14 37.0 14E 12 54.0 19L 18 89.0 15 15 44.3 14 14E 56.5 20 97.8 16 16 48.3 16 14 (62.0) (20)
103.0 17 17 54.5 16 16 116.3 17 17 66.5 17 17 32.70 126.0 18 18 76.5 18 18 1639.8 18 18 I 9.0 20 18 17.3 14 dead 150.5 18 18 102.5 - 20 2.' 1 163.5 20E 19L _ _ _ _ _ _ _ _ __-24.0 17
(168.0) (20E) 2960 S 0.4 25.5 17
28.0 18 17.3 14 10 30.6 18L 20.0 16 11 37.0 20M 24.0 16L 12 25.8 17 dead 28.0 18 30.3 18 37.0 20
terms of a value of 50 hours for Vermont. As explained before, the time-temperature curve for Vermont becomes asymptotic to this time. The percentage acceleration at 29.60 is 26. At 32.70 the percentage is slightly greater.
In the second experiment a comparison was again made of Englewood, Florida and Vermont embryos. The temperatures employed were 10.30, 12.10, 15.20, 19.40, 24.1?, 30.0?, and 34.50. At 10.30 more than half of the Florida embryos were so injured by the low temperature that they died as neurulae. The few that developed normally showed a 23 per cent retardation (Table 11). At 12.10 development was normal in both groups. Again the Florida embryos developed more slowly. At 15.20 the rate in the Vermont and Florida olrnnouwns wadentircal At a.1l hbioer tem-
peratures the latter developed more rap- idly. At 30.00 neither group was ad- versely affected (an unusually high temperature for normal development in Vermont material). At 34.5 0 the Vermont embryos died after several cleavages but the Florida embryos were normal. This is the highest temperature at which I have obtained normal development in Rana pipiens or in any other species of am- phibian.
Summary of Englewood, Florida data. Normal development does not occur at 3.90, 4.80, 5.70 and 10.30, but develop- ment is normal at 12.10 and up to and in- cluding 34.50. Higher temperatures have not been employed so the limit cannot be definitely stated. Tentatively the normal temperature range can be placed as-11- 35 ?. A comparison of rate of development
This content downloaded from 129.93.16.3 on Wed, 18 Sep 2013 14:54:29 PMAll use subject to JSTOR Terms and Conditions

ADAPTIVE CHARACTERS IN RANA PIPIENS 15
of Englewood, Florida and Vermont em- bryos is given in Figure 5. , At tempera- tures below 150 the Vermont embryos de- velop more rapidly than those from ,Flor- ida. Above 150 this relation is reversed.
g. Texas
Experiments have been conducted with four females from western Texas. In two cases a comparison was made between Texas and Wisconsin embryos, in an-
other case between Texas and New Jersey, and in the last experiment - Vermont, Ocala, and Texas were tlsed. The results will be given in some detail for one of the Wisconsin with Texas experiments and also for the Vermont, Florida, and Texas experiment. The results of the other will be mentioned - briefly.
In the first experiment comparing Texas and Wisconsin (embryos from two Wis- consin females were used) the following
TABLE 11. Comparison of rate of development in Florida (Englewood) and Vermont embryos. - Experiment of February 10, 1939. Figures in parentheses are from other experiments and are included for comparison
Houirs after Hours after Fla. Vt Hours after Fla Vt. Stage 3 1fla. Vt. Stage 3 Fl. V. Stage 3 Fa t
10.30 12.10 15.20
71.0 9 9L 21.8 7 7 21.8 8 8 92.5 lOM lOM 31.5 8 8 26.3 9L 8
106.5 1iM liE 49.0 9 9 32.0 10 10 120.0 12L 12M 57.5 1OE 1OE 49.0 12L 12E 129.0 12 12 69.8 l1L lIE 57.0 13 12M 140.5 13E 12 75.3 12 11 69.5 14E 14E 154.0 13 13E- 81.8 12L 12E 81.7 14L 14M 178.8 13 13L 92.0 12L 12M 92.0 16M 16E 190.5 14 99.0 13 12 99.0 17E 16L 215.0 14L 15 106.5 13 12L 106.7 17 17 237.8 15 16 120.0 14E 14E 119.7 17 18 273.5 16 17 153.8 14L 14L 125.0 18 18 292.5 17 17E 165.3 16 16 153.5 18 18 321.5 17 18 178.2 16 17 165.5 19 19 394.0 18 18L 190.8 17E 17 178.5 20 20 417.0 18 18L 215.0 17 f7 441.0 18 18L 224.5 17 18 30.00 465.0 18 19 237.5 18 18 489.5 18 19 274.0 18 18 513.5 - 20E 287.5 18 19 21.5 16 14E 600 19 316.0 18 19 26.0 18 16 634 20E - 321.0 18 20E 32.0 19 17
______ ____ -_____ _ - __ ___ . 335.0 19 34.0 19 -
J94O ~~~~346.0 19L 35.3 20 -
______ ____ 19
__40 __ _ 5 . 0-(50.0) - (20)
21.7 12E 10241345 27.0 12L liE . 32.0 13 12
21.5___16L _dead_
49.0 16E 14 21.5 14E 12 21.5 6L dead 57.0 17 16L 26.0 14 1325.0 17L 69.8 18 17 32.0 16 14 217. 18 75.0 18 18 49.0 19 18 31.7 1 81.5 18L 18 57.6 20 19 34.0 19L 92.0 19L 19 (63.0) - (20) 35.3 20 96.5 20 19L 99.0 - 20E
This content downloaded from 129.93.16.3 on Wed, 18 Sep 2013 14:54:29 PMAll use subject to JSTOR Terms and Conditions

16 JOHN A. MOORE
*40
n 20/ Z . ,
0 VT.
L.-20 /
5 10 15 20 25 30 35'C. TEMPE RATURE
FIG. 5. Comparison of rates of development of Englewood (Florida) and Vermont embryos. The interval studied was the time between Stages 3 and 20. The values for the Vermont embryos are taken as 0. Data for Englewood, Florida are expressed- as per cent retardation or acceleration. Two Englewood females were used (black dots).
temperatures were used: 8.60, 10.10, 19.20, 22.60, 27.20 and 31.60. At 8.60 the Texas eggs developed as far as neuru-
lae and died. Both groups of Wisconsin embryos developed fairly normally. The usual low temperature effects such as small gills, long narrow body, and tend- ency to edema were observed. At 10.1.0 both Wisconsin groups were entirely nor- mal. Rate data are given in Table 12. Development in the Texas embryos was slower than in Wisconsin but nearly nor- mal until Stage 14. At this point the em- bryos appeared to be blocked in their differentiation. They remained in Stage 14 for 103 hours, which is about three times as long as the Wisconsin embryos. Fifty-two per cent of the Texas embryos cytolized in Stage 14. Subsequent to this critical stage development improved and cytolysis was less frequent. The per cent retardation at Stage 18 was 39 and at Stage 19 it was 64. The increased re-
TABLE 12. Comparison of rate of development in Texas and Wisconsin embryos. Experiment of October 11, 1944
Hours after Texas Wis. Hours after Texas Wis. Hours after Texas Wis. Stage 3 Stage 3 Stage 3
10.10 19.20 22.60
15.5 7E 7 16.0 9 9 16.0 10E 10E 41.0 8 8 18.5 9L 9L 18.3 ilL liE 71.7 9 9 20.0 1OE 1OE 20.0 1ZE ilL 90.5 9 10 23.0 1OM tOM 22.5 12L 12L 103.0 tOE liE 27.5 IlL IlL 27.0 13 13L 118.5 IOL 12E 40.5 13 13 40.0 16E 16E 171.0 12M 13L 42.7 14E 14E 45.3 17 17 196.0 13 14E 44.7 14E 14E 50.5 17 17 209.0 14E 14M 47.0 14 14M 64.3 19 19 219.0 14E 14L 51.0 14M 16E 70.0 19L 20E 234.0 14E 15 52.8 14L 16E 72.0 20E 257.3 14E 16L 65.0 17E 17 268.7 17 71.3 17 18 31.60 287.7 14M 17 78.0 18 312.0 14L 17 90.0 18 19E . 336.3 16E 17 99.5 19 20E 15.3 13 12 384.0 17 18 105.3 20E - 3 1 8.0 14M 12 407.7 17 18 _____ - 22.0' 164 14 454.0 17 19E 27.20 27.0 17 16M 474.3 - 19 27________ - ___ 40.0 19 18 485.3 - 20E400 1L 8
533.3 18 - ~~~~~15.3 13 12E 42.5 20 -
744.3 19 18.0' 13L 13E 50.0 - 20E 744.5 19 ~~20.0 14E 13 23.0 14M 14E 27.0 16E 16E 40.0 18 18 50.5 20M 20E
This content downloaded from 129.93.16.3 on Wed, 18 Sep 2013 14:54:29 PMAll use subject to JSTOR Terms and Conditions

ADAPTIVE CHARACTERS IN RANA PIPIENS 17
tardation is associated with increased ab- normality of development. Thirty-six per cent of the embryos survived to Stage 18. The gill plate remained' poorly de- veloped and gills never formed (hence Stage 20 was not reached). In spite of this the operculum showed partial de- velopment. One embryo survived 104 days but it never developed gills. The eyes were very small. At 19.20 and 22.60, which were normal temperatures for all groups, the Wisconsin embryos reached Stage 20 somewhat sooner than those from Florida. At 27.20 one of the Wisconsin groups exhibited a slight tem- perature injury but the other embryos were normal. At this temperature the Texas embryos showed an acceleration, amounting to approximately 13 per cent. At'31.60 development was entirely normal in Texas. In one of the Wisconsin groups the vegetal hemisphere exhibited heat in- jury in cleavage and blastula stages. In spite of this 11 per cent formed surpris- ingly good larvae and a single embryo (1 per cent) even reached Stage 20. If the rate of this embryo is taken as the rate 'of Wisconsin embryos, those from Texa,s showed an'acceleration of 18 per cent. The other group of Wisconsin em- bryos died before gastrulation-the re- sult to be expected' in northern embryos developing above 300.
In the second experiment Texas em- bryos were placed at 8.50, 10.10, 19.20, 22.50, 27.20, and 32.30. At 8.50 the Texas embryos died in the neurula stage. At 10.10 they began dying in Stage 17. The ectoderm was wrinkled and cytolysis was frequent in the region of the yolk plug. -Sixty-four per cent were dead by the end of Stage 18. Seven per cent of the embryos lived until they were pre- served on the 85th day. They never de- veloped gills, the mouth failed to form and they showed severe edema. Devel- opment was normal at all higher tempera- tures except 32.30. Here the vegetal hemisphere cells exhibited injury in cleav- age and blastula stages. N'o0 normal em- brvos were Droduced.
In the third experiment Texas (one group) and New Jersey (2 groups) em- bryos were compared. The temperatures employed were 6.60, 9.80, 14.20, 19.00, 27.3?, and 32.50. At 6.60 the Texas em- bryos died before gastrulation. One of the New Jersey, groups developed nor- mally but the other cytolized in Stages 18 and 19. At all higher temperatures up to and including 27.3? development was normal in the three groups of embryos. At 32.50 cleavage was impossible in the New Jersey material. There was no evi- dence of abnormality in the Texas em- bryos.
In the fourth experiment material from Texas, ilFlorida (Ocala) (2 groups), and Vermont was compared. The following temperatures were employed: 6.8 + 0.20, 9.90, 14.30, 19.00, 23.20, 29.70, and 31.60. At 6.8 + 0.20 development was normal in the Vermont embryos but those from Texas and Florida died as gastrulae. At 9.90 the embryos'were observed for 171 hours after first cleavage. At this point mechanical failure of the constant tempera- ture bath terminated the experiment. There was no evidence of cold injury in any group during the limited period of observation. Some indication of the rela- tive rates of development can be gained from the following observation. At 92.5 hours the Vermont embryos were in Stage 1GM, Florida 10E, and Texas 9. At 171 hours the Vermont embryos were 13L, Florida 13, and Texas 12. From these limited data it was estimated that the Florida embryos were retarded 14 per cent and those from Texas 30 per cent. At 14.30 development was normal in all groups and those from Vermont developed most rapidly, those from Florida were next and Texas was the' most retarded (Table 13). At higher temperatures the southern embryos increased' their rate relative to Vermont. At 19.b0 and above Florida surpassed Vermont. At 29J70 the Texas embryos developed m,ore rapidly, than Vermont. This latter temperature is unusually high for Vermont' material yet the embryos from all grouips were
This content downloaded from 129.93.16.3 on Wed, 18 Sep 2013 14:54:29 PMAll use subject to JSTOR Terms and Conditions

18 JOHN A. MOORE
TABLE 13. Comparison of rate of development in Texas, Florida (Ocala), and Vermont pipiens. Experiment of October 27, 1945
Hours after Vt. Texas Ocala Hours after Vt. Texas Ocala Stage 3 Stage 3
14.30 19.00
51.3 12E 12E 12E 20.3 10E 10E 10E 67.5 13 13 13 25.7 litE lE 12E 79.6 14E 13 14E 27.6 l1L 1lL -
96.0 14L 14E 14L 29.0 12E 12E -
127.0 17M 16E 17E 44.7 14E 13L 14E 150.0 18 17 18 49.0 14M 14E 14M 171.0 18 18 18 67.3 17M 17E 17M 195.3 19 18 18 73.3 18E - 18 212.3 20E 19E 19L 98.0 19L 19 20E 219.5 19 20E 101.0 20E 242.0 - 20E 115.0 20E
23.20 29.70
8.0 7 7 7 7.7 8 8 8 20.0 12E 12 13E 20.0 13 13 16E 26.3 13L 13L 14E 25.0 15 16 17 44.0 17M 17M 17M 31.0 17E 17 18 51.0 18 18 18 44.0 19L 19L 20L 56.0. 18 18 19 46.5 20E 20 67.0 20 19 20M 69.7 20E
normal. At 31.60 the Texas and one group of Florida embryos were- normal (the other Florida group was killed).
+20
w ~~~~~~~~0VT.
Z */~~~~~~~S z ,,,-2o- ;
r 0 z ti
wW-40- U'.
X-60-
5 0 O 5 20 25 30 - 35'C TEMPE RATURE
FIG. 6. Comparison of rates of development of Texas and northern embryos (Wisconsin, Vermont, and New Jersey). The interval stud- ied was the time between Stages 3 and 20. The values for the northern embryos, labelled as "Vt.," 'are taken as 0. Data for Texas are ex- pressed as per cent retardation or acceleration. Embryos from 4 Texas females were used (black dots).
No Vermont material was placed at this temperature.
Summary of Texas experiments. At 6.60 and 6.80 the embryos, do not develop beyond the gastrula stage. At 8.50 they develop only as far as neurulae. At 9.80 development was normal but in another experiment at' 10.10 it was abnormal. Therefore the lower limiting temperature is about 100 C. The upper limiting tem- perature is in the neighbo,rhood of 320. Normal development has been observed at 31.60 (2 experimen'ts) and at 32.50. In another experiment at 32.30 no normal embryos were secured. With respect to developmental rate the Vermont embryos are more rapid below 260 and those from Texas more rapid above this tempera- ture (Fig. 6}.
h. Axtlca, Mexico
Embryos from a single female, col- lected along the Rio Axtla near the town of Axtla in San Luis Potosi, were com-
This content downloaded from 129.93.16.3 on Wed, 18 Sep 2013 14:54:29 PMAll use subject to JSTOR Terms and Conditions

ADAPTIVE CHARACTERS IN RANA PIPIENS 19
pared with Vermont material. The tem- peratures employed were: 9.90, 12.0?, 14.20, 19.20, 27.50, 29.80, and 33.30. At 9.90 the Axtla embryos cytolized during gastrulation but those from Vermont were normal. At 12.00 observations were made during the first 99 hours. At this time mechanical failure of the constant tem- perature bath terminated the experiment. There was no evidence of cold injury dur- ing the period of observation. The Axtla embryos showed a retardation of 24 per cent. Data on rate of development at higher temperatures are given in Table 14. At 14.20 and 19.20 the embryos were normal and those from Vermont devel- oped more rapidly. At 27.50 there was some heat injury in Vermont but none in the Axtla material. The Axtla embryos were more rapid in their development. At 29.8" about half the Vermont embryos were killed and at 33.30 no development took place. The Axtla embryos were nor- mal at 29.80 but at 33.30 only 9 per cent reached Stage 20.
On the basis of this one experiment the normal temperature range for Axtla, Mexico embryos is placed at 12 - 330. In Figure 7 a comparison is made between the rate of development of the Axtla and Vermont embryos.
wf4o
-Z0 VT. z 0
E-20 z
S 10 15 20 2.5 30 3.5'C. TEMPE RATURE
FIG. 7. Comparison of rate- of development of Mexico (Axtla) and Vermont embryos. The interval studied was the time between Stages 3 and 20. The values for the Vermont embryos are taken as 0. Data for Mexico (black dots) are expressed as per cent retarda- tion or acceleration. Embryos from a single Mexican female were used.
TABLE 14. Comparison of rate of development in Mexico (Axtila) and Vermont pipiens. Experiment of October 3, 1946
Hours after |Vt Mex. Hours after 3 Vt Mex. Hours after Vt Mex. Stage 3 Stage 3 Stage 3
14.20 19.20 27.50
32.2 9 9 19.5 IOE 1OE 10.0 9 10E 46.0 11 10E 23.0 IOL 10E 19.5 13 14E 50.3 11L 11E 25.0 11 toM 23.0 14E 14L 70.0 13 12 31.5 12L 12M 24.7 14M 16 80.0 14E 13 '45.0 14M 14 28.5 16L 17E 99.0 14L 14E 50.0 14L 14M 31.0 16L 17
117.0 17 14L 57.5 16L 16E 43.3 18 19L 141.5 18 17E 69.5 17 17 46.5 19 20 169.5 18 18E 79.0 18 18 54.0 20E _ 189.3 19 18 93.5 19 19 _ 218.0 20 19E 98.5 20E 19L 33.30 225.0 20E 102.0 20E
2.0 - 6 29.80 4.3 dead 8
9.8 10 10.0 9 10E 19.3 14 19.5 13 14M 28.0 17 28.3 16 17E 31.0 17 31.0 17 17 43.5 20M 43.0 19 20L 49.0 20
This content downloaded from 129.93.16.3 on Wed, 18 Sep 2013 14:54:29 PMAll use subject to JSTOR Terms and Conditions

20 JOHN A. MOORE
i. Summary of data on temiperature tolerance
The normal temperature tolerance ranges for Rana pipiens embryos from different parts of North America are given in Figure 8. The four northern lo- calities, lying between 400 and 460 north latitude, are identical in their upper lim- iting temperatures and probably in the lower limit as well. Embryos from Flor- ida, Texas, and Mexico have very differ- ent temperature requirements. The range over which normal development is possible has been shifted upwards about 50 C. Louisiana embryos are interesting in be- ing able to tolerate temperatures as low as the northern group and as high as those from Florida, Texas, and Mexico. The general conclusion to be drawn from the data is that the southern populations of Rana pipiesis differ from northern pop- ulations in the same way that southern species differ from northern species. Adaptation to different environments has obviously occurred.
j. Summary of data on rate of development When the rates of development of north-
*ern and southern species of frogs are com- pared (Moore, '42a, p. 382, Fig. 2) it is
found that the former develop more rap- idly at low temperatures. With increas- ing temperature the differences become less until at the higher temperatures the southern species may develop more rap- idly.
No differences were detected in the rate of development- among pipiens from Quebec, Vermont, Wisconsin, and New Jersey. However the developmental rate of southern pipiens was different from the northern pipiens. At low temperatures the former were slower. In every case, however, those from the south developed- more rapidly at high temperatures. These facts are brought out in Table 15 where a
TABLE 15. Hours required to reach Stage 20 by Rana pipiens embryos from different localities at 120 and 280 C. The values for Vermont are averages from many experiments. The values for the other localities are computed from the curves of figures 3-7.
120 280
Vermont 325 50 Louisiana 348 41 Florida (Ocala) 354 42 Florida (Englewood) 364 38 Texas 429 47 Me-xico 396 42
LATITUDE LOCALITY
46?N. QUEBEC
45 VERMONT 44 ---- WISCONSIN
40 NEW jERSEY 30 LOUIS lIANA
29 OCALA,FLA. 27 ENGL. FLA. 32 TEXAS 22 MEXICO
O 5 1 0 I5 20 25 30 35 40?C. EMBRYONIC TEMPERATURE RANGE
FIG. 8. Temperature range for normal development of Rana pipiens from different localities. The lower limit for Quebec and Wisconsin has not been determined but it is believed to be identical with Vermont.
This content downloaded from 129.93.16.3 on Wed, 18 Sep 2013 14:54:29 PMAll use subject to JSTOR Terms and Conditions

ADAPTIVE CHARACTERS IN RANA PIPIENS 21
comparison is made of the time to reach Stage 20 at 120 and 280. The lower tem- perature may be taken as the average en- vironmental temperature when pipiens eggs are laid in the New England region. The higher temperature, namely 280, is the average upper limit for normal devel- opment in northern embryos. Thus we find southern populations of Rcana pipiens behaving like southern species when their rate of development is conlsidered.
2. TEMPERATURE COEFFICIENT OF DEVELOPMENT
A further difference between northern and southern species is seen in the ex- tent to which an increase or decrease in temperature modifies the rate of develop- ment. Thus, if we study the rate of de- velopment at 120 and then at 220 we find that this increase of 100 results in a greater increase in rate for southern spe- cies than for northern species (Moore, 1939, 1942c). In 'short the tempera- ture coefficient for development is greater in the former. In previous papers I have used Belehradek's temperature co- efficient b in comparing species. Neither this nor any other temperature coefficient that I have employed has proved entirely satisfactory. At this time I do not wish to compare northern and southern pipiens in terms of any particular temperature co- efficient. The slopes of the lines in Fig- ures 3-7 are sufficient to provide informa- tion of the sort needed. In these-figures the rate of development for northern em- bryo's is represented by a horizontal line. It can readily be seen that the temperature coefficient is greater in the southern pop- ulations than in northern because the line expressing their development has a posi- tive slope (if this line for southern popu- lations had a negative slope it would indi- cate a smaller temperature coefficient; if the lines were parallel the temperature coefficient would be the same). There is' some indicatiop of differences in slope for the southern populations. The angles formed.with the Vermont base are as fol-
lows: Louisiana, 21?; Ocala, Florida, 216; Englewood, Florida, 300; Texas, 300; Mexico, 300. It would appear that the Louisiana and Ocala, Florida populations are less adapted to high temperatures with respect to their temperature coefficient than are those from Englewood, Florida, Texas, and Mexico.
With respect to temperature coefficient of development we may draw the general conclusion that southern populations of Rana pipiens differ from northern popu- lations of this species in the same way that southern species differ from northern species.
3. EGG SIZE
In respect to egg size, southern species differ from northern species in having smaller eggs (Moore 1942a). This char- acter was investigated in the Ranca pipiens populations and a summary of the data is given in Table 16. There is not com- plete correspondence to what might have been predicted from a comparison of dif- ferent species. Egg diameter in the four northern populations is large (1.76-1.80 mm.) compared to material from Louisi- ana, Florida, and Texas (1.32-1.61 mm.). However the mean for the two Mexican samples is the highest so far observed for pipiens. If the value for Mexico is reli- able, it would be of great interest to know the selective forces promoting large egg size in this locality that apparently counter- act the selective action of high environ- mental temperature.
4. TYPE OF EGG MASS
The last character that will be consid- ered is the type of egg mass. In the New York region Rana pipiens, Rana sylvatica, and Rana palustris are early breeding, northern species and have a globular sub- merged egg mass. Rana clamitans and cRana catesbeiana, which are late breeding species with a more southern type of dis- tribution, lay their eggs in a single layer on the surface of the water (Moore, 1940).
I have only limited data on geographic
This content downloaded from 129.93.16.3 on Wed, 18 Sep 2013 14:54:29 PMAll use subject to JSTOR Terms and Conditions

22 JOHN A. MOORE
TABLE 16. Variation in egg size. The diameter of ten uncleaved. fertilized eggs from each female was measured. Measurements in millimeters
Locality | Number of Mean of sample means Range of samples ~~~~~~~~sample,means
Quebec 4 1.80 4+ .05 uO.10 1.62-1.86 Vermont 11 1.77 4 .03 oO.10 1.55-1.95 Wisconsin 2 1.76 4 .04 u0.05 1.70-1.81 New Jersey 9 1.77 ?t .04 uO.12 1.63-1.97 Louisiana 13 1.60 4? .02 o0.06 1.51-1.68 Florida (Ocala) 10 1.43 4? .02 o0.07 1.33-1.58 Florida (Englewood) 2 1.32 4 .02 u0.08 1.24-1.40 Texas 4 1.61 4 .04 u0.08 1.52-1.72 Mexico 2 2.00 4? .03 o0.04 1.96-2.04
variation of egg mass in Rana pipiens.3 In the New York area it has a submerged globular mass.. The only other locality where I have observed the spawn of this species is near San Pedro, Coahuila, Mex- ico. In this instance the eggs were de- posited in a very different manner from those in the north. Instead of a single large mass, there were many small masses with a few embryos in each. This con- dition would be an obvious advantage in gaseous exchange at high temperatures (the water surrounding the eggs was 300 C.). This single observation, though in- teresting, is of little value. Some observa- tions reported by others will now be cited.
Bragg (1944) observes "that the com- mon leopard frog of Oklahoma sometimes produces small masses of eggs in what appears to be a normal procedure. ' Of something over 200 egg masses observed at natural breeding sites during the past six years, approximately ten per cent have been small (200 eggs or fewer in each mass) ."
If we compare the descriptions given by Wright and Wright (1942) of the egg mass of Rana pipiens with that of Rana sphenocephala (the name given by some to southern populations of Rana pipiens) we find that the egg mass of the
3I have not attempted to compare egg masses in the experiments reported in this paper. In all cases the eggs were stripped from the female and fertilized artificially. It was nrot felt that reliable data on type of egg mass could be obtained- with this p-rocedure.
southern form is flattened. A flattened egg mass would be better adapted to high temperatures because it would allow for better diffusion of respiratory gases to and from the developing embryos.
It does not seem wise with these limited data to make any statement about geo- graphic variation in the form of the pipiens- egg mass.
DISCUSSION 4
In my original studies on different spe- cies of the New York region it was clear that Rana pipiens had the embryological characteristics of a northern species. One might have predicted a southern boundary for it at 330 North latitude. It was diffi- cult, therefore, to understand how it was able to inhabit nearly all of America aN far south as Panama. Rana catesbeiana. was the most southern of the local frogs in embryological characteristics and con- sequently we might have expected it to have ranged farthest to the south. How- ever, it extends only as far as north- eastern Mexico. The answer to this para- dox is given by the data presented in this paper which indicate that Rana pipiens is not a homogeneous species with respect to
Some of the problems raised by the data are discussed in a paper that was prepared for the Princeton Bicentennial Celebration entitled "Patterns of Evolution in the Genus Rana." This will appear in a volume, "Genetics, Pale- ontolQgy, and Evolution," to be published in the near future by the Princeton University Press.
This content downloaded from 129.93.16.3 on Wed, 18 Sep 2013 14:54:29 PMAll use subject to JSTOR Terms and Conditions

ADAPTIVE CHARACTERS IN RANA PIPIENS 23
those embryological characteristics that have an adaptive significance. Populations south of the boundary, which was pre- dicted on the basis of the behavior of New England populations, are very different from those in the north. The differences are similar to those that separate northern and. southern species.
In two other species, Rana clamitans and Rana catesbeiana, observations have been made on individuals from different parts of the species' range (Moore, 1942a, 1942c). No indication was found of geo- graphic variation in adaptive embryologi- cal characters. It is conceivable that these two species are limited in space through an inability to produce races adapted to conditions beyond the boundary of their present range. -On the other hand Rana pipiens has apparently produced a wealth of genotypes that are adapted to nearly every general region of the North Ameri- can continent.
It is not surprising to find geographic variation in physiological characteristics such as temperature tolerance and rate of development. In fact, one would expect it to occur more frequently in physiologi- cal than in morphological characters. (The reason for this assumption is the fact that every morphological character is the result of physiological processes and in addition there are many physiological processes with no morphological expres- sion.) However, data on geographic vari- ation consist almost entirely of the mor- phological sort. This is due to the ease of measuring structure as compared with the usual difficulty in measuring physio- logical processes. It is disturbing to find that the data on geographic variation, which play such an important part in discussions of evolution, are usually based on characters having no discernible adap- tive significance.
In the New York region Ranca pipiens supplies a northern environment for its embryos by spawning early in the spring. It is of interest to learn when spawning occurs in other areas, especially. where the populations adapted to high tempera-
ture conditions are- found. In northern Canada Rana pipiens probably breeds in June. In the southern provinces May is the principal month. At Ithaca, New York, Wright (1914) finds April 11 the average spawning date. In the New York City region April 1 may be taken as an average. Brimley (1940) reports that leopard frogs breed during February and March at Raleigh, North Carolina. Far- ther south the marked correlation between temperature and breeding time vanishes. Wright (1931) believes the population in the southern Georgia area breeds every month in the year. The same appears to be true of Florida. The adaptive changes that have occurred in these southern pop- ulations have freed them from the necessity of providing a "northern environment" for their embryos. It is probable that rain- fall has replaced temperature as the pri- mary stimulus to breeding in the southern populations.
It is not my purpose to discuss the ad- visability of recognizing subspecies in Rana pipiens but two points might be men- tioned. First, the populations of Florida, Texas, and Mexico, which are somewhat similar in temperature adaptation, are very different in adult characters. Sec- ond, the sharp difference between the northern and southern populations is prob- ably due in part to the absence of data from localities between 320 and 40? N. latitude (see Fig. 8).
SUMMARY
Previous experiments have revealed that northern and southern species of am- phibians differ in a number of characters such as embryonic temperature tolerance, rate of development, temperature coeffi- cient, egg size, and form of egg mass.
In the experiments reported in this paper the geographic variations of the above listed characters are described for a single species, Rana pipiens. The north- ern populations of this species are found to differ from southern populations in the same way that northern species differ from southern species.
This content downloaded from 129.93.16.3 on Wed, 18 Sep 2013 14:54:29 PMAll use subject to JSTOR Terms and Conditions
24 JOHN A. MOORE
The formation of intraspecific tempera- ture races in, Rana pipiens is correlated with an unusually great range of geo- graphic distribution.
LITERATURE CITED
BRAGG, A. N. 1944. Egg laying in leopard frogs. Proc. Oklahoma 4cad. Sci., 24: 13- 14.
BRIMLEY, C. S. 1940. Reptiles and amphibians of North Carolina. Carolina Tips. 3.
MOORE, JOHN A. 1939. Temperature toler-. ance and rate of .development in the eggs of amphibia. Ecology, 20: 459-478.
1940. Adaptative differences in the egg membranes of frogs. Amer. Nat., 74: 89-93.
1942a. The role of temperature in speciation of frogs. Biol. Symp. 6: 189-213. . 1942b. An embryological and genetical
study of Rana burnsi Weed. Genetics, 27: 408-416. . 1942c. Embryonic temperature tolerance
and rate of development in Rana catesbeiana. Biol. Bull., 83: 375-388.
- . 1944. Geographic variation in Rana pipiens Schreber of eastern North America. Bull. Amer. Mus. Nat. Hist., 82: 345-370.
1946. Incipient intraspecific isolating mechanisms in Rana pipiens. 'Genetics, 31: '304-326.
POLLISTER, A. W., AND J. A. MOORE. 1937. Tables for the normal development of Ranna sylvatica. Anat., Rec., 68: 489-496..
PORTER, K. R. 1941. Diploid and androgenetic haploid hybridization between two forms of Rana pipiens Schreber. Biol. Bull., 80: 238- 264.
WRIGHT, A. A., AND A. H. WRIGHT. 1942. Handbook of frogs and toads. Comstock Publishing Co., Ithaca, New York.'
WRIGHT, A. H. 1914. Life-histories of the Anura of Ithaca, New York. Carnegie Inst. Wash. Pub. 197.
WRIGHT, A. H. 1931. Life-histories of the frogs of the Okefinokee Swamp, Georgia. Macmillan.
This content downloaded from 129.93.16.3 on Wed, 18 Sep 2013 14:54:29 PMAll use subject to JSTOR Terms and Conditions