Embed Size (px)
Citation preview

GeoGebra Introduction for Middle and High School Teachers
GeoGebra Workshop Handout
Judith and Markus Hohenwarter
www.geogebra.org

GeoGebra Workshop Handout
2
Table of Contents
1. Introduction and Installation of GeoGebra 3
2. Basic Use of GeoGebra 4
3. Drawings, Constructions, and Drag Test 7
4. Rectangle Construction 8
5. Navigation Bar and Construction Protocol 9
6. Equilateral Triangle Construction 10
7. GeoGebra’s Properties Dialog 11
8. Parameters of a Linear Equation 11
9. Library of Functions 13
10. Introducing Derivatives – The Slope Function 15
11. Exploring Polynomials 16
12. Exporting a Picture to the Clipboard 17
13. Inserting Pictures into a Text Processing Document 18
14. Resizing, Reflecting, and Distorting a Picture 19
15. Exploring Properties of Reflection 21
16. Translating Pictures 22
17. Rotating Polygons 24
18. Inserting Text into the Graphics View 25
19. Visualizing the Angle Sum in a Triangle 27
20. Customizing the Toolbar 28
21. Visualizing Integer Addition on the Number Line 29
22. Conditional Formatting – Inserting Checkboxes 31
23. Introducing Sequences 33
24. String Art Based on Bézier Curves 34
25. Useful Web Links 35

GeoGebra Workshop Handout
3
1. Introduction and Installation of GeoGebra
Background Information about GeoGebra
GeoGebra is dynamic mathematics software for schools that joins geometry, algebra, and calculus. On the one hand, GeoGebra is an interactive geometry system. You can do constructions with points, vectors, segments, lines, conic sections as well as functions while changing them dynamically afterwards. On the other hand, equations and coordinates can be entered directly. Thus, GeoGebra has the ability to deal with variables for numbers, vectors, and points. It finds derivatives and integrals of functions and offers commands like Root or Vertex. These two views are characteristic of GeoGebra: an expression in the Algebra View corresponds to an object in the Graphics View and vice versa.
GeoGebra’s User Interface
GeoGebra‟s user interface consists of a Graphics View and an Algebra View. On the one hand, you can operate the provided geometry tools with the mouse in order to create geometric constructions in the Graphics View. On the other hand, you can directly enter algebraic input, commands, and functions into the Input Bar by using the keyboard. While the graphical representation of an object is displayed in the Graphics View, its algebraic numeric representation is shown in the Algebra View. The user interface of GeoGebra is flexible and can be adapted to the needs of your students. If you want to use GeoGebra in elementary or early middle school, you might want to hide the Algebra View, Input Bar, and coordinate axes and just work with the Graphics view and geometry tools. Later on, you might want to introduce the coordinate system using a grid to facilitate working with integer coordinates. In high school, you might want to use algebraic input in order to guide your students through algebra on into calculus.
Installing GeoGebra
Preparations
Create a new folder called GeoGebra_Introduction on your desktop. Hint: During the workshop, save all files into this folder so they are easy to find later on.

GeoGebra Workshop Handout
4
WITH Internet Access
Install GeoGebra WebStart on your computer. Open your Internet browser and go to www.geogebra.org/webstart. Click on the button called GeoGebra WebStart. Note: The software is automatically installed on your computer. You need to confirm all messages that might appear with OK or YES. Hint: Using GeoGebra WebStart has several advantages for you provided that you have an Internet connection available for the initial installation:
You don‟t have to deal with different files because GeoGebra is installed automatically on your computer.
You don‟t need to have special user permissions in order to use GeoGebra WebStart, which is especially useful for computer labs and laptop computers in schools.
Once GeoGebra WebStart was installed you can use the software off-line as well.
Provided you have Internet connection after the initial installation, GeoGebra WebStart frequently checks for available updates and installs them automatically. Thus, you are always working with the newest version of GeoGebra.
WITHOUT Internet Access
Your workshop presenter will provide the GeoGebra installer files via USB drives or CDs. Copy the installer file from the storage device into the created GeoGebra_Introduction folder on your computer. To install the software, double-click the GeoGebra installer file and follow the instructions of the installer assistant. Hint: Make sure you have the correct version for your operating system, e.g. GeoGebra_3_0_0_0.exe (MS Windows) or GeoGebra_3_0_0_0.zip (MacOS).
2. Basic Use of GeoGebra
How to Operate GeoGebra’s Geometry Tools
Activate a tool by clicking on the button showing the corresponding icon.
Toolboxes contain similar tools or tools that generate the same type of new object. Open a toolbox by clicking on the lower part of a button and select another tool from this toolbox. Hint: You don‟t have to open the toolbox every time you want to select a tool. If the icon of the desired tool is already shown on the button it can be activated directly.
Check the toolbar help to the right of the toolbar buttons in order to find out which tool is currently activated and how to operate it.

GeoGebra Workshop Handout
5
Tips and Tricks for Geometric Constructions
Summarize the properties of the geometric figure you want to create.
Try to find out which GeoGebra tools can be used in order to construct the figure using some of these properties (e.g. right angle – tool Perpendicular line).
Make sure, you know how to use each tool before you begin the construction. If you don‟t know how to operate a certain tool, activate it and read the toolbar help.
Don‟t forget about the Undo and Redo buttons in the upper right corner of the GeoGebra window.
Frequently use the Move tool in order to check your construction (e.g. are objects really connected, did you create any unnecessary objects).
If you have questions, please ask a colleague before you address the presenter or assistant(s).
How to Save and Open GeoGebra Files
Saving GeoGebra Files
Open the File menu and select Save.
Select the folder GeoGebra_Introduction in the appearing dialog window.
Type in a name for your GeoGebra file.
Click Save in order to finish this process. Hint: A file with the extension „.ggb‟ is created. This extension identifies GeoGebra files and indicates that they can only be opened with GeoGebra. Hint: Name your files properly: Avoid using spaces or special symbols in a file name since they can cause unnecessary problems when transferred to other computers. Instead you can use underscores or upper case letters within the file name (e.g. First_Drawing.ggb).
Opening GeoGebra Files
Open a new GeoGebra window (menu File – New window)
Open a blank GeoGebra interface within the same window (menu File – New)
Open an already existing GeoGebra file (menu File – Open) o Navigate through the folder structure in the appearing window o Select a GeoGebra file (extension „.ggb‟) and click Open.
Hint: If you didn‟t save the existing construction yet GeoGebra will ask you to do so before the new file is opened.

GeoGebra Workshop Handout
6
Tips and Tricks for Algebraic Input and Commands
Name a new object by typing in name = in front of its algebraic
representation. Example: P = (3, 2) creates point P.
Multiplication needs to be entered using an asterisk or space between
the factors. Example: a*x or a x
GeoGebra is case sensitive! Thus, upper and lower case letters must not be mixed up. Note:
o Points are named with upper case letters (e.g., A = (1, 2)).
o Segments, lines, circles, functions… are always named with lower
case letters (e.g., circle c: (x – 2)^2 + (y – 1)^2 = 16)
o The variable x within a function and the variables x and y in the equation of a conic section always need to be lower case. (e.g.,
f(x) = 3*x + 2 or g: y = 2*x + 4)
If you want to use an object within an algebraic expression or command you need to create the object prior to using its name in the Input Bar. Examples:
o y = m x + b creates a line whose parameters are already
existing values m and b (e.g. numbers / sliders).
o Line[A, B] creates a line through existing points A and B.
Confirm an expression you entered into the Input Bar by pressing the Enter key.
Open the help window for using the Input Bar and commands by clicking
the question mark to the left of the Input Bar.
Error messages: Always read the messages – they could possibly help to fix the problem!
Commands can be typed in or selected from the list next to the Input Bar. Hint: If you don‟t know which parameters are required within the brackets of a certain command, type in the full command name and press key F1. A pop-up window appears explaining the syntax and necessary parameters of the command.
Automatic completion of commands: After typing in the first two letters of a command into the Input Bar, GeoGebra tries to complete the command.
o If GeoGebra suggests the desired command, hit the Enter key in order to place the cursor within the brackets.
o If the suggested command is not the one you wanted to enter, just keep typing until the suggestion matches your desired command.
GeoGebra Workshop Handout
7
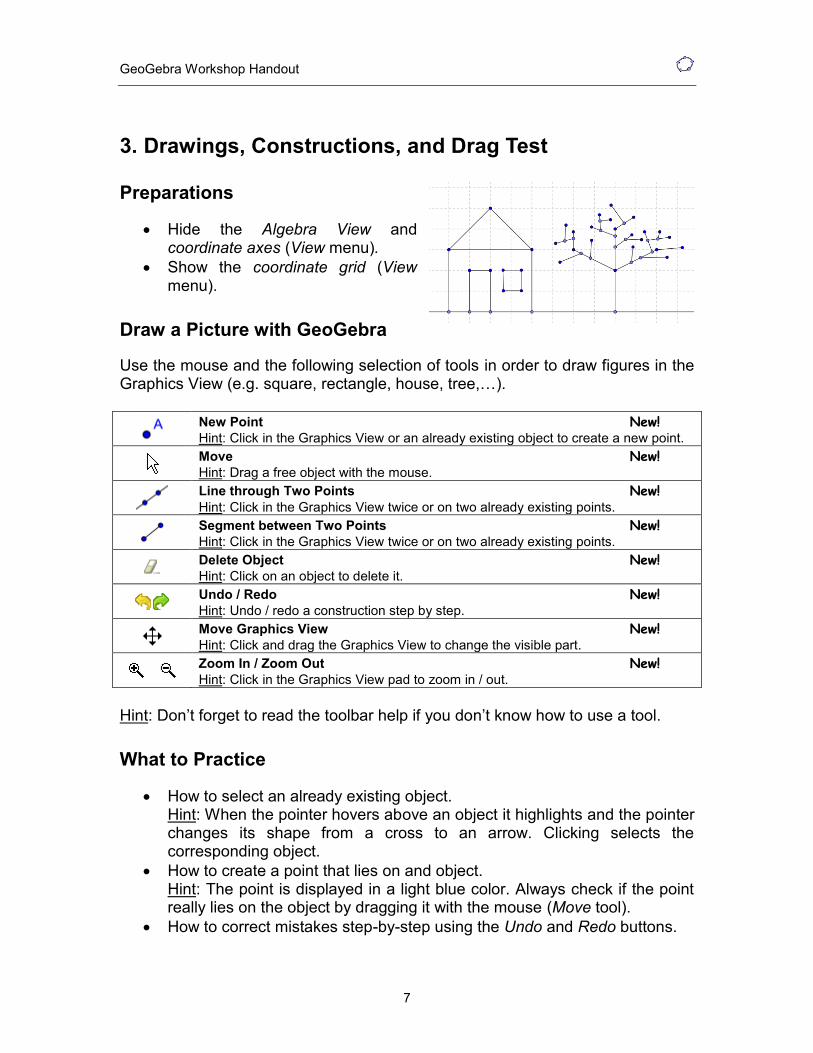
3. Drawings, Constructions, and Drag Test
Preparations
Hide the Algebra View and coordinate axes (View menu).
Show the coordinate grid (View menu).
Draw a Picture with GeoGebra
Use the mouse and the following selection of tools in order to draw figures in the Graphics View (e.g. square, rectangle, house, tree,…).
New Point New! Hint: Click in the Graphics View or an already existing object to create a new point.
Move New! Hint: Drag a free object with the mouse.
Line through Two Points New! Hint: Click in the Graphics View twice or on two already existing points.
Segment between Two Points New! Hint: Click in the Graphics View twice or on two already existing points.
Delete Object New! Hint: Click on an object to delete it.
Undo / Redo New! Hint: Undo / redo a construction step by step.
Move Graphics View New! Hint: Click and drag the Graphics View to change the visible part.
Zoom In / Zoom Out New! Hint: Click in the Graphics View pad to zoom in / out.
Hint: Don‟t forget to read the toolbar help if you don‟t know how to use a tool.
What to Practice
How to select an already existing object. Hint: When the pointer hovers above an object it highlights and the pointer changes its shape from a cross to an arrow. Clicking selects the corresponding object.
How to create a point that lies on and object. Hint: The point is displayed in a light blue color. Always check if the point really lies on the object by dragging it with the mouse (Move tool).
How to correct mistakes step-by-step using the Undo and Redo buttons.

GeoGebra Workshop Handout
8
Note: Several tools allow the creation of points “on the fly”. This means that no existing objects are required in order to use the tool. Example: The tool Segment between Two Points can be applied to two already existing points or to the empty Graphics View. By clicking in the Graphics View the corresponding points are created and a segment is drawn in between them.
Back to School…
Open the dynamic worksheet 01_Drawing_Construction_Squares.html. Explore this dynamic worksheet as your students would do in class. The dynamic figure shows several squares constructed in different ways. Follow the instructions on the dynamic worksheets to find out which of theses squares are „real‟ squares and which of them just happen to look like squares.
4. Rectangle Construction
Preparations
Open new GeoGebra file.
Hide Algebra View, Input Bar and coordinate axes (View menu).
Change the labeling setting to New Points Only (menu Options – Labeling).
Introduction of New Tools
Perpendicular Line New! Hint: Click on an already existing line and a point in order to create a perpendicular line through this point.
Parallel Line New! Hint: Click on an already existing line and a point in order to create a parallel line through this point.
Intersect Two Objects New! Hint: Click on the intersection point of two objects to get this one intersection point. Successively click on both objects to get all intersection points.

GeoGebra Workshop Handout
9
Polygon New! Hints: Click in the Graphics View or on already existing points in order to create the vertices of a polygon. Connect the last and first vertex to close the polygon! Always connect vertices counterclockwise!
Hints: Don‟t forget to read the toolbar help if you don‟t know how to use a tool. Try out all new tools before you start the construction.
Instructions
1
Segment AB
2
Perpendicular line to segment AB through point B
3
New point C on perpendicular line
4
Parallel line to segment AB through point C
5
Perpendicular line to segment AB through point A
6
Intersection point D
7
Polygon ABCD
Hint: To close the polygon click on the first vertex again.
8 Save the construction
9
Apply the drag test to check if the construction is correct
5. Navigation Bar and Construction Protocol
Show the Navigation Bar (View menu) to review your construction step-by-step using the buttons. Show the Construction Protocol (View menu) and use it to review your rectangle construction step-by-step.
What to practice
Try to change the order of some construction steps by dragging a line with the mouse. Why does this NOT always work?
Group several constructions steps by setting breakpoints: o Show the column Breakpoint (View menu of the Construction
Protocol window).

GeoGebra Workshop Handout
10
o Group construction steps by checking the Breakpoint box of the last one of the group.
o Change setting to Show Only Breakpoints (View menu of the Construction Protocol window).
o Use the Navigation Bar to review the construction step-by-step. Did you set the breakpoints correctly?
6. Equilateral Triangle Construction
Preparations
Open new GeoGebra file.
Hide Algebra View, Input Bar and coordinate axes (View menu).
Change the labeling setting to New Points Only (menu Options – Labeling).
Introduction of New Tools
Circle with Center through Point New! Hint: First click creates center, second click determines radius of the circle.
Show / Hide Object New! Hints: Highlight all objects that should be hidden, then switch to another tool in order to apply the visibility changes!
Angle New! Hint: Click on the points in counterclockwise direction! GeoGebra always creates angles with mathematically positive orientation (= counterclockwise).
Hints: Don‟t forget to read the toolbar help if you don‟t know how to use a tool. Try out all new tools before you start the construction.
Instructions
1
Segment AB
2
Circle with center A through B
Hint: Drag points A and B to check if circle is connected to them.
3
Circle with center B through A
4
Intersect both circles to get point C
5
Polygon ABC in counterclockwise direction

GeoGebra Workshop Handout
11
6
Hide circles
7
Show interior angles of triangle
Hint: Clockwise creation of the polygon gives you the exterior angles!
8 Save the construction
9
Apply the drag test to check if the construction is correct.
7. GeoGebra’s Properties Dialog
How to Access the Properties Dialog
Right-click (MacOS: Ctrl-click) an object OR
Select Properties… from the Edit menu OR
Double click an object in Move mode and click on button „Properties…‟ in the appearing Redefine dialog window.
What to Practice
Select different objects from the list on the left hand side and explore the available properties tabs for different types of objects.
Select several objects in order to change a certain property for all of them at the same time. Hint: Hold the Ctrl-key pressed and select all desired objects.
Select all objects of one type by clicking on the corresponding heading.
Show the value of different objects and try out different label styles.
Change the properties of certain objects (e.g. color, style,…).
8. Parameters of a Linear Equation
Preparations
Open new GeoGebra file.
Show the Algebra View, Input Bar, and coordinate axes (View menu).

GeoGebra Workshop Handout
12
Instructions 1
Enter: line: y = 0.8 x + 3.2
Tasks:
Move the line in the Algebra View using the arrow keys. Which parameter are you able to change in this way?
Move the line in the Graphics View with the mouse. Which transformation can you apply to the line in this way?
Introduction of New Tool
Slope New! Hint: Click on an already existing line to create the slope and draw a slope triangle.
Hints: Don‟t forget to read the toolbar help if you don‟t know how to use the tool. Try out the new tool before you start the construction.
Instructions 2
1 Delete the line created in activity 1.
2
Create sliders m and b using the default settings of sliders.
3 Enter line: y = m * x + b
Hint: Don‟t forget to use an asterisk or space to indicate multiplication!
4
Intersection point A between the line and the y-axis
Hint: You may also use the command Intersect[line, yAxis].
5
Point B at the origin
6
Segment between points A and B
Hint: You might want to increase the line thickness in order to make the segment visible on top of the y-axis.
7
Slope (triangle) of the line
8
Hide unnecessary objects
9 Enhance the appearance of the file using the Properties Dialog.

GeoGebra Workshop Handout
13
Task
Write down instructions for your students that guide them through examining the influence of the equation‟s parameters on the line by using the sliders. These instructions could be provided on paper along with the GeoGebra file.
9. Library of Functions
Visualizing Absolute Values
Apart from polynomials there are other types of functions available in GeoGebra (e.g. trigonometric functions, absolute value function, exponential function). Functions are treated as objects and can be used in combination with geometric constructions. Note: Some of the functions available can be selected from the menu next to the Input Bar. Please find a complete list of functions supported by GeoGebra in the GeoGebra online help document (http://www.geogebra.org/help/docuen ).
Preparations
Open a new GeoGebra file.
Show the Algebra View, Input Bar, and coordinate axes.
Instructions
1 Enter the absolute value function f(x) = abs(x)
2 Enter the constant function g(x) = 3
3
Intersect both functions

GeoGebra Workshop Handout
14
Hint: You might want to close the Algebra View and show the names and values as labels of the objects.
Back to School…
(a) Move the constant function with the mouse or using the arrow keys. What is the relation between the y-coordinate and the x-coordinate of each intersection point? (b) Move the absolute value function up and down either using the mouse or the arrow keys. In which way does the function‟s equation change? (c) How could this construction be used in order to familiarize students with the concept of absolute value? Hint: The symmetry of the function graph indicates that there are usually two solutions for an absolute value problem.
Library of Functions – Superposition of Sine Waves
Excursion into Physics
Sound waves can be mathematically represented as a combination of sine functions. Every musical tone is composed of several sine waves of the form
)tsine( a y(t) .
The amplitude a influences the volume of the tone while the angular frequency ω determines the pitch of the tone. The parameter φ is called phase and indicates if the sound wave is shifted in time. If two sine waves interfere, superposition occurs. This means that the sine waves amplify or diminish each other. We can simulate this phenomenon with GeoGebra in order to examine special cases that also occur in nature.
Preparations
Open a new GeoGebra file.
Show the Algebra View, Input Bar, and coordinate axes (View menu).
Instructions
1
Create three sliders a_1, ω_1, and φ_1
Hints: a_1 produces an index. You can select the Greek letters from
the menu next to the text field name in the Slider dialog window.
2 Enter the sine function g(x)= a_1 sin(ω_1 x + φ_1)

GeoGebra Workshop Handout
15
Hint: Again, you can select the Greek letters from a menu next to the Input Bar.
3
Create three sliders a_2, ω_2, and φ_2
4 Enter another sine function h(x)= a_2 sin(ω_2 x + φ_2)
5 Create the sum of both functions sum(x) = g(x) + h(x)
6 Change the color of the three functions so they are easier to identify.
Back to School…
(a) Examine the impact of the parameters on the graph of the sine functions by changing the values of the sliders. (b) Set a1 = 1, ω1 = 1, and φ1 = 0. For which values of a2, ω2, and φ2 does the sum have maximal amplitude? Note: In this case the resulting tone has the maximal volume. (c) For which values of a2, ω2, and φ2 do the two functions cancel each other? Note: In this case no tone can be heard any more.
10. Introducing Derivatives – The Slope Function
Preparations
Open a new GeoGebra file.
Show the Algebra View, Input Bar, and coordinate axes.
Introduction of new tool
Tangents New! Hint: Click on a point on a function and then on the function itself.
Hints: Don‟t forget to read the toolbar help if you don‟t know how to use the tool. Try out the new tool before you start the construction.

GeoGebra Workshop Handout
16
Instructions
1 Enter the polynomial f(x) = x^2/2 + 1
2
Create new point A on function f.
Hint: Move point A to check if it is really restricted to the function graph.
3
Create tangent t to function f through point A.
4 Create the slope of tangent t using: slope = Slope[t]
5 Define point S: S = (x(A), slope)
Hint: x(A) gives you the x-coordinate of point A.
6
Connect points A and S using a segment.
Back to School…
(a) Move point A along the function graph and make a conjecture about the shape of its path, which corresponds to the slope function.
(b) Find the equation of the slope function. Turn on the trace of point S. Move point A to check your conjecture. Hint: Right click point S (MacOS: Ctrl-
click) and select Trace On. (c) Find the equation of the resulting slope
function. Enter the function and move point A. If it is correct the trace of point S will match the graph.
(d) Change the equation of the initial polynomial f to produce a new problem.
11. Exploring Polynomials
Preparations
Open a new GeoGebra document.
Show the Algebra View, Input Bar, and coordinate axes.

GeoGebra Workshop Handout
17
Instructions
1 Enter the cubic polynomial f(x) = 0.5x3 + 2x2 + 0.2x - 1
2 Create the roots of polynomial f: R = Root[ f ]
Hint: If there are more than one roots, GeoGebra will produce
indices for their names if you type in R = (e.g., R1, R2, R3).
3 Create the extrema of polynomial f: E = Extremum[ f ]
4
Create tangents to f in E1 and E2
5 Create the inflection point of polynomial f: I = InflectionPoint[ f ]
Hint: You might want to change properties of objects (e.g. color of points, style of the tangents, show name and value of the function).
12. Exporting a Picture to the Clipboard
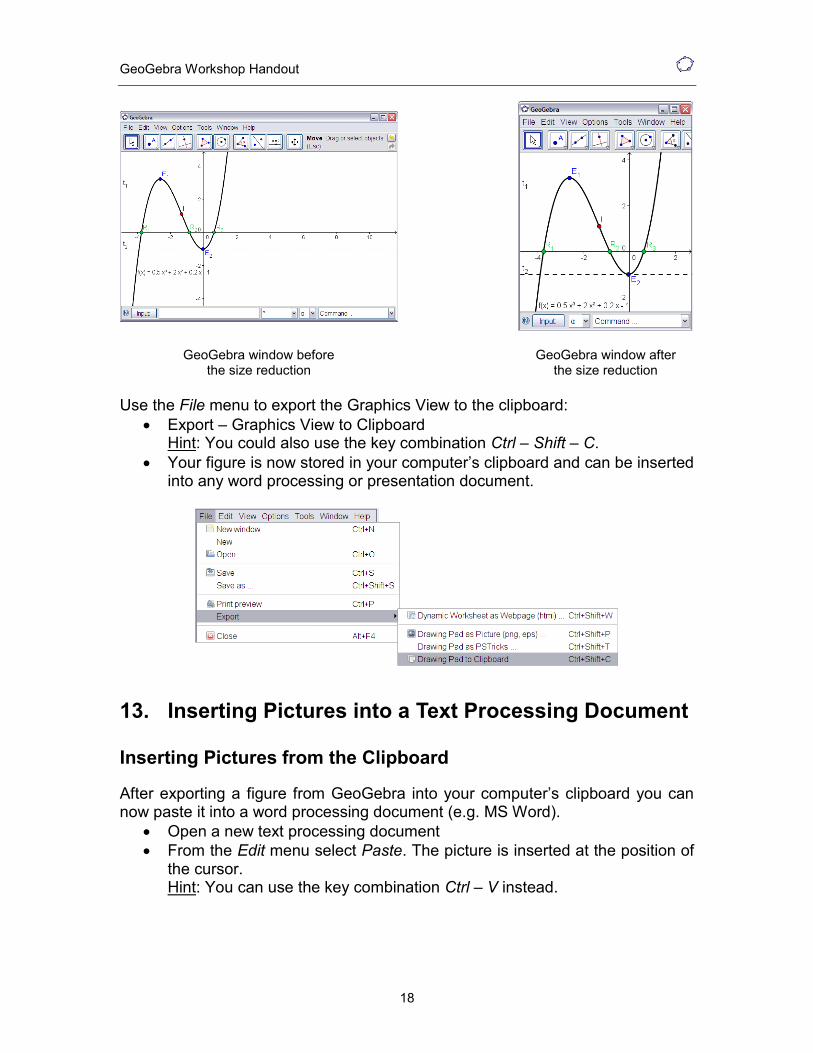
GeoGebra‟s Graphics View can be exported as a picture to your computer‟s clipboard. Thus, it can be easily inserted into text processing or presentation documents allowing you to create appealing sketches for tests, quizzes, notes, or mathematical games. GeoGebra will export the whole Graphics View into the clipboard. Thus, you need to make the GeoGebra window smaller in order to reduce unnecessary space in the Graphics View:
Move your figure (or the relevant section) to the upper left corner of the
Graphics View using the Move Graphics View tool (see left figure below).
Hint: You might want to use tools Zoom in and Zoom out in order to prepare your figure for the export process.
Reduce the size of the GeoGebra window by dragging its lower right corner with the mouse (see right figure below). Hint: The pointer will change its shape when hovering above an edge or corner of the GeoGebra window.
GeoGebra Workshop Handout
18
GeoGebra window before the size reduction
GeoGebra window after the size reduction
Use the File menu to export the Graphics View to the clipboard:
Export – Graphics View to Clipboard Hint: You could also use the key combination Ctrl – Shift – C.
Your figure is now stored in your computer‟s clipboard and can be inserted into any word processing or presentation document.
13. Inserting Pictures into a Text Processing Document
Inserting Pictures from the Clipboard
After exporting a figure from GeoGebra into your computer‟s clipboard you can now paste it into a word processing document (e.g. MS Word).
Open a new text processing document
From the Edit menu select Paste. The picture is inserted at the position of the cursor. Hint: You can use the key combination Ctrl – V instead.
GeoGebra Workshop Handout
19
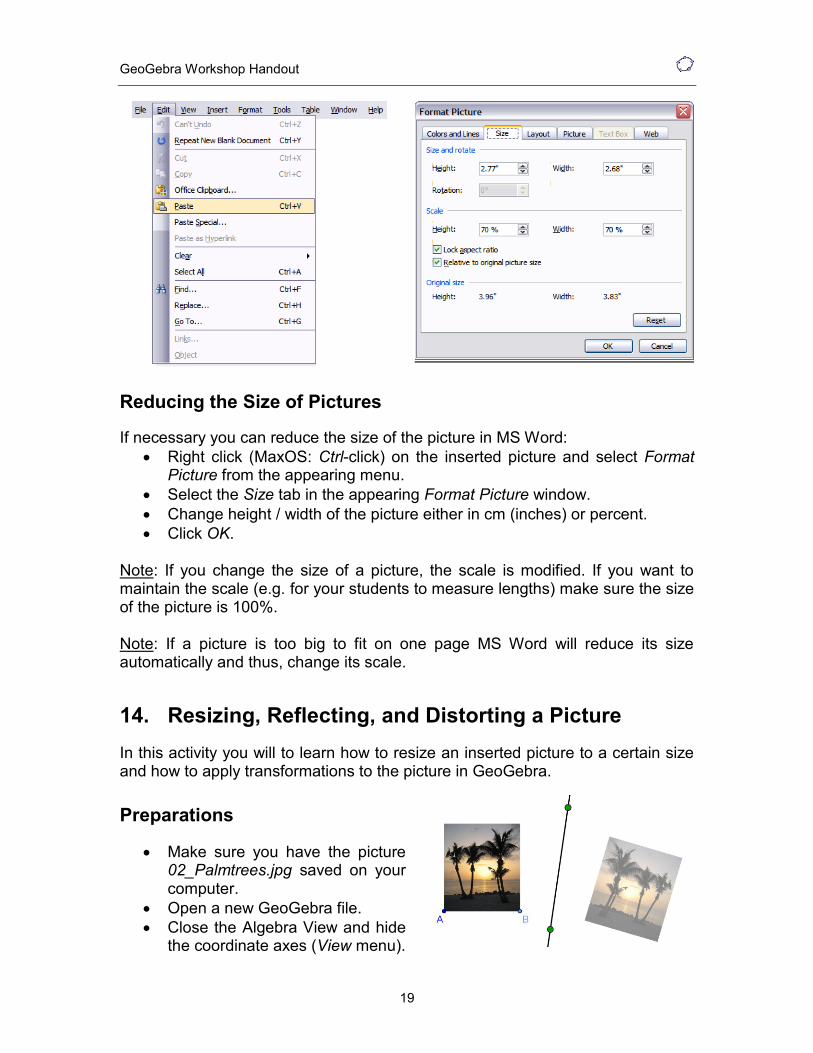
Reducing the Size of Pictures
If necessary you can reduce the size of the picture in MS Word:
Right click (MaxOS: Ctrl-click) on the inserted picture and select Format Picture from the appearing menu.
Select the Size tab in the appearing Format Picture window.
Change height / width of the picture either in cm (inches) or percent.
Click OK. Note: If you change the size of a picture, the scale is modified. If you want to maintain the scale (e.g. for your students to measure lengths) make sure the size of the picture is 100%. Note: If a picture is too big to fit on one page MS Word will reduce its size automatically and thus, change its scale.
14. Resizing, Reflecting, and Distorting a Picture
In this activity you will to learn how to resize an inserted picture to a certain size and how to apply transformations to the picture in GeoGebra.
Preparations
Make sure you have the picture 02_Palmtrees.jpg saved on your computer.
Open a new GeoGebra file.
Close the Algebra View and hide the coordinate axes (View menu).

GeoGebra Workshop Handout
20
Introduction of New Tool
Reflect Object about Line New! Hint: Click the object to be reflected and then click the line of reflection.
Insert Image New! Hint: Click in the Graphics View to insert the picture at this position.
Hints: Don‟t forget to read the toolbar help if you don‟t know how to use these tools. Try out the new tools before you start the construction.
Instructions for Reflecting and Resizing a picture
1
Insert picture 02_Palmtrees.jpg into the left part of the Graphics View.
2
Point A at the lower left corner of the picture
3 Set point A as the FIRST corner point of your picture.
Hint: Open the Properties Dialog and select the picture in the list of objects. Click on tab „Position‟ and select point A from the drop-down list next to Corner 1.
4 Point B = A + (3, 0)
5 Set point B as the SECOND corner point of the picture.
Hint: You just changed the width of the picture to 3 cm.
6
Line through two points in the middle of the Graphics View.
7
Reflect the picture at the line
Hint: You might want to reduce the filling of the image in order to be able to better distinguish it from the original (Properties Dialog).
Back to school…
(a) Move point A with the mouse. How does this affect the picture? (b) Move the picture with the mouse and observe how this affects its image. (c) Move the line of reflection by dragging the two points with the mouse. How does this affect the image?
GeoGebra Workshop Handout
21
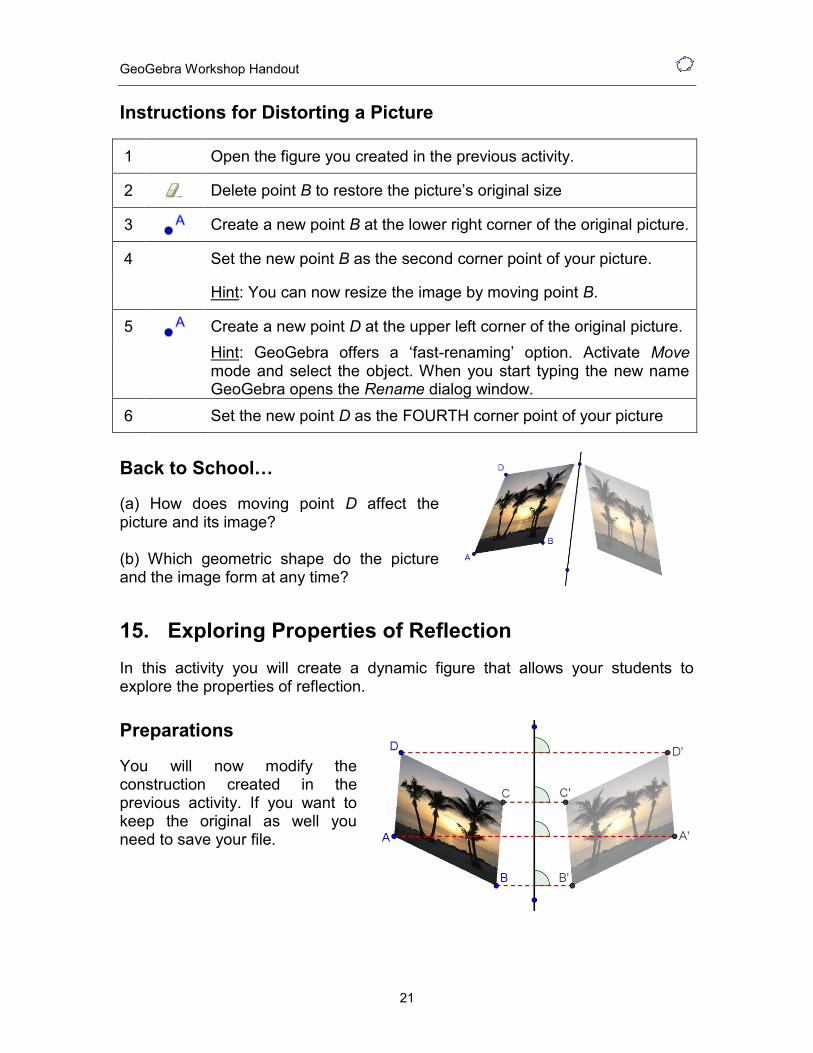
Instructions for Distorting a Picture
1 Open the figure you created in the previous activity.
2
Delete point B to restore the picture‟s original size
3
Create a new point B at the lower right corner of the original picture.
4 Set the new point B as the second corner point of your picture.
Hint: You can now resize the image by moving point B.
5
Create a new point D at the upper left corner of the original picture.
Hint: GeoGebra offers a „fast-renaming‟ option. Activate Move mode and select the object. When you start typing the new name GeoGebra opens the Rename dialog window.
6 Set the new point D as the FOURTH corner point of your picture
Back to School…
(a) How does moving point D affect the picture and its image? (b) Which geometric shape do the picture and the image form at any time?
15. Exploring Properties of Reflection
In this activity you will create a dynamic figure that allows your students to explore the properties of reflection.
Preparations
You will now modify the construction created in the previous activity. If you want to keep the original as well you need to save your file.

GeoGebra Workshop Handout
22
Instructions
1 Open the file you created in the previous activity which contains the distorted picture of the palm trees and its reflection at a line.
2
Segment between points A and B
3
Segment between points A and D
4
Parallel line to segment AB through point D
5
Parallel line to segment AD through point B
6
Intersect the two lines to get intersection point C
7
Hide unnecessary objects
8
Reflect all four corner points A, B, C, and D at the line to get their images A’, B’, C’, and D’.
9
Connect corresponding points with segments (e.g. points A and A’)
10
Create angles between the line of reflection and the segments
Back to chool…
(a) Move the corner points A, B, C, and D of the original picture. Are you able to drag all these points with the mouse? If no, which one can‟t be dragged and why? (b) Move the line of reflection. What do you notice about the angles between the segments connecting the corresponding corner points and the line of reflection?
16. Translating Pictures
Preparations
Make sure you have the picture 03_Bart.png saved on your computer.
Open a new GeoGebra file.
Show the Algebra View, Input Bar, coordinate axes, and grid (View menu).
GeoGebra Workshop Handout
23
In the Options menu set the point capturing to On (Grid).
Introduction of New Tools
Vector between Two Points New! Hint: First click determines the starting point and second click sets the vector‟s endpoint.
Translate Object by Vector New! Hint: Click the object to be translated and then click the translation vector.
Hints: Don‟t forget to read the toolbar help if you don‟t know how to use these tools. Try out the new tools before you start the construction.
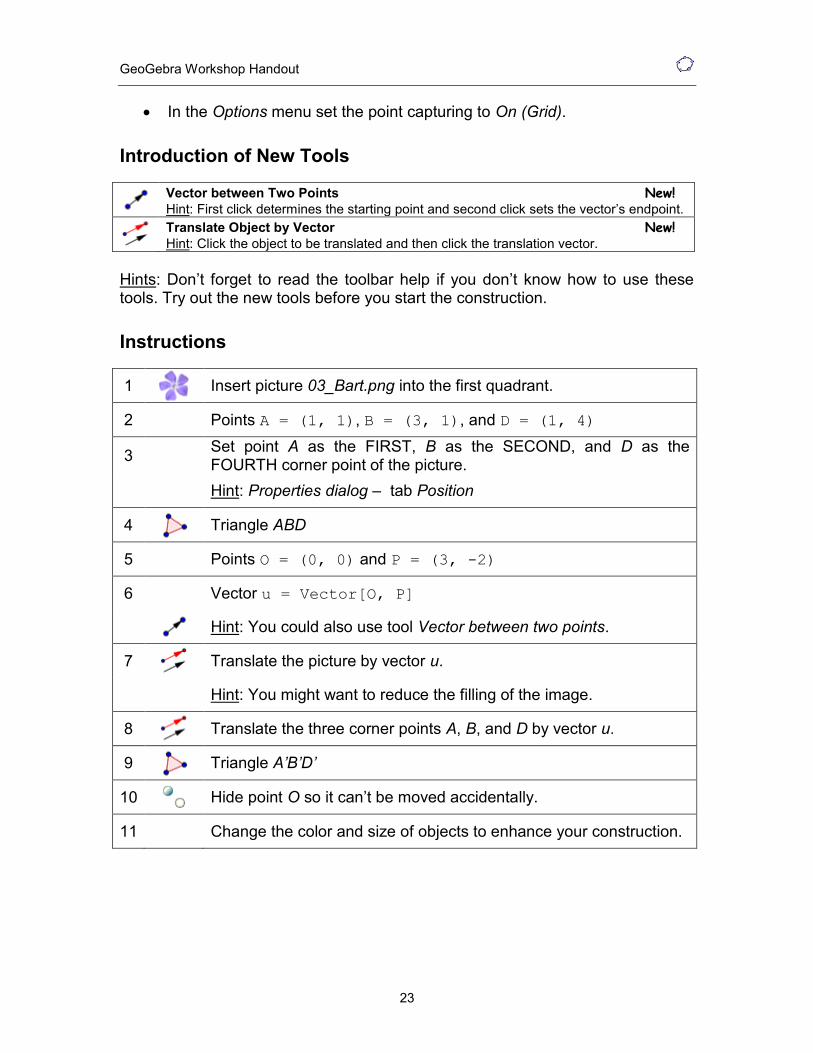
Instructions
1
Insert picture 03_Bart.png into the first quadrant.
2 Points A = (1, 1), B = (3, 1), and D = (1, 4)
3 Set point A as the FIRST, B as the SECOND, and D as the FOURTH corner point of the picture.
Hint: Properties dialog – tab Position
4
Triangle ABD
5 Points O = (0, 0) and P = (3, -2)
6 Vector u = Vector[O, P]
Hint: You could also use tool Vector between two points.
7
Translate the picture by vector u.
Hint: You might want to reduce the filling of the image.
8
Translate the three corner points A, B, and D by vector u.
9
Triangle A’B’D’
10
Hide point O so it can‟t be moved accidentally.
11 Change the color and size of objects to enhance your construction.

GeoGebra Workshop Handout
24
17. Rotating Polygons
Preparations
Open a new GeoGebra file.
Hide Algebra View and Input Bar (View menu).
Show the coordinate axes and the grid (View menu).
Open the Properties Dialog for Graphics View by right clicking the Graphics View (MacOS: Ctrl – click).
o On tab Axes – xAxis change the Distance for x-Axis to 1 o On tab Axes – yAxis change the Distance for y-Axis to 1
Introduction of New Tool
Rotate Object around Point by Angle New! Hint: Click the object to be rotated, the center of rotation, and enter the angle in the appearing dialog window.
Hints: Don‟t forget to read the toolbar help if you don‟t know how to use the tool. Try out the new tool before you start the construction.
Instructions
1
Create an arbitrary triangle ABC in the second quadrant placing the vertices on grid points.
2
New point D at the origin of the coordinate system
3 Rename the new point to O
Hint: GeoGebra offers a „fast-renaming‟ option. Activate Move mode and select the object. When you start typing the new name GeoGebra opens the Rename dialog window.
4
Slider for angle α
Hint: In the slider dialog window check Angle and set the increment to 90˚. Make sure you don‟t delete the ˚ symbol.
5
Rotate triangle ABC around point O by angle α
Hint: Check counter clockwise rotation.
7
Segments AO and A’O
8
Angle AOA’
Hint: Select the points in counter clockwise order. Hide the label of this angle.

GeoGebra Workshop Handout
25
Enhancing the Construction
You will now learn how to „tidy up‟ the Algebra View by defining some objects as „Auxiliary objects‟ and hiding their algebraic representation from view.
Show the Algebra View.
Open the Properties Dialog.
Select all segments in the Properties Dialog and check Auxiliary object on tab „Basic‟. Hint: Click on the heading „Segment‟ in order to select all segments.
Repeat this step for the triangles, angles, and point O at the origin. Hint: The Algebra View now only contains points A, B, and C as well as their images A’, B’, and C’.
Make sure the item Auxiliary objects is unchecked in the View menu. Note: Your students can now check out the coordinates of the initial points and their images in the Algebra View without being distracted by the algebraic representation of the other objects used in this construction.
18. Inserting Text into the Graphics View
Introduction of new tools
Insert Text New! Hint: Click in the Graphics View to specify the location of your text. Enter the desired text into the appearing window and click Apply.
Hints: Don‟t forget to read the toolbar help if you don‟t know how to use a tool. Try out new tools before you start the construction.

GeoGebra Workshop Handout
26
Inserting Static Text
Insert a heading into the Graphics View of GeoGebra so your students know what the dynamic figure in the prior section is about:
Activate the Text tool and click in the upper part of the Graphics View.
Type the following text into the appearing window: Rotating a Triangle about the Origin of the Coordinate
System
You can change the properties of the text in the Properties dialog (e.g. wording, font style, font size, formatting).
Click Apply.
Adjust the position of the text using the Move tool.
Fix the position of the text so it can‟t be moved accidentally (Properties dialog – tab Basic – Fix object).
Inserting Dynamic Text
Dynamic text refers to existing objects and adapts automatically to modifications, for example in A = (3, 1) the coordinates change whenever point A is moved.
Activate the Text tool and click in the Graphics View.
Type A = into the appearing window.
Hint: This will be the static part of the text and won‟t change if point A is moved.
Insert the dynamic part of this text by clicking on point A either in the Algebra or the Graphics View.
o GeoGebra will insert the name of the point into the text field and add quotation marks around the already existing (static) text.
o Additionally, GeoGebra adds a + symbol to connect the static and dynamic part of the text.
o Note: The new syntax of the text is "A = " + A
Click Apply.
Fix the position of the text so it can‟t be moved accidentally (Properties Dialog – tab Basic – Fix object).
Note: The text shows the coordinates of point A and adapts automatically to modifications of its position.
GeoGebra Workshop Handout
27
Task
Come up with instructions to guide your students towards discovering the relation between the coordinates of the original and the reflected points which could be provided along with the dynamic figure.
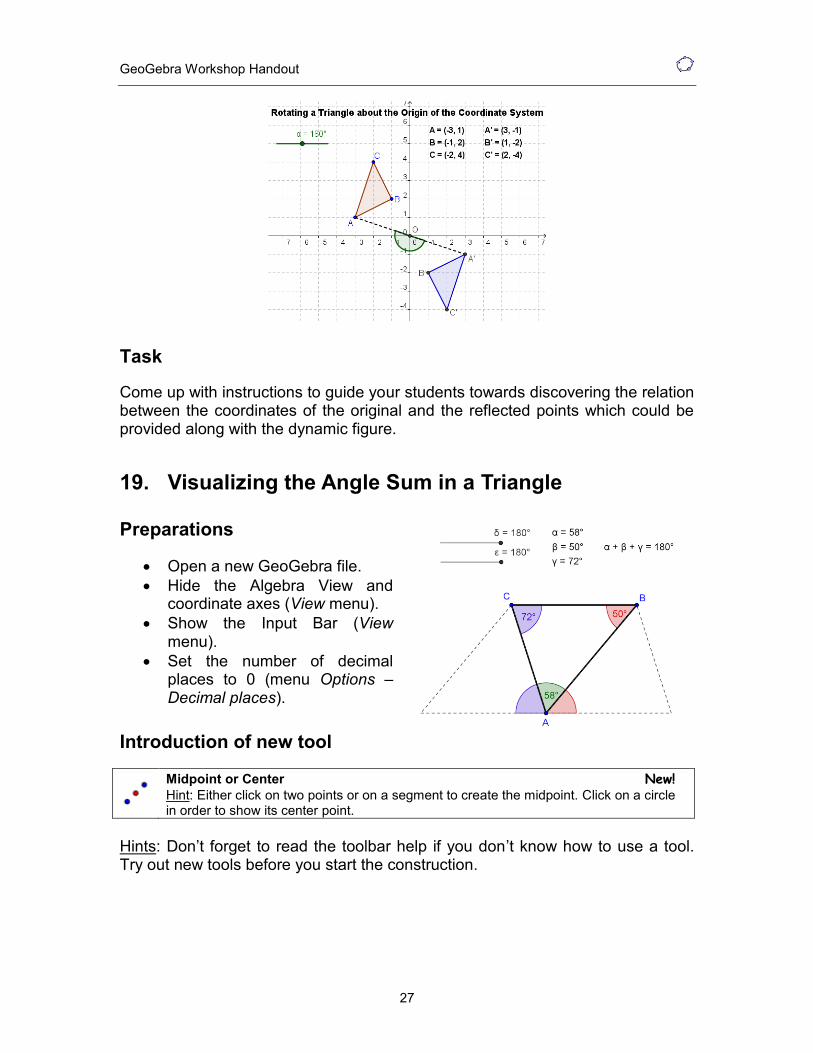
19. Visualizing the Angle Sum in a Triangle
Preparations
Open a new GeoGebra file.
Hide the Algebra View and coordinate axes (View menu).
Show the Input Bar (View menu).
Set the number of decimal places to 0 (menu Options – Decimal places).
Introduction of new tool
Midpoint or Center New! Hint: Either click on two points or on a segment to create the midpoint. Click on a circle in order to show its center point.
Hints: Don‟t forget to read the toolbar help if you don‟t know how to use a tool. Try out new tools before you start the construction.

GeoGebra Workshop Handout
28
Instructions
1
Triangle ABC with counter clockwise orientation
2
Angles α, β, and γ of triangle ABC.
3
Slider for angle δ with interval 0˚ to 180˚ and increment 10˚
4
Slider for angle ε with interval 0˚ to 180˚ and increment 10˚
5
Midpoint D of segment AC and midpoint E of segment AB
6
Rotate the triangle around point D by angle δ (setting clockwise).
7
Rotate the triangle around point E by angle ε (setting counterclockwise).
8
Move both sliders δ and ε to show 180˚.
9
Create angle δ using the points A’C’B’
10
Create angle ε using the points C'1B'1A'1
11 Enhance your construction using the Properties Dialog.
Hint: Congruent angles should have the same color.
12
Create dynamic text displaying the interior angles and their values
(e.g. "α = " + α).
13 Calculate the angle sum by entering sum = α + β + γ into the
Input Bar and hitting the Enter-key.
14
Insert the angle sum as a dynamic text: "α + β + γ = " + sum
15 Match colors of corresponding angles and text. Fix text that is not supposed to be moved.
20. Customizing the Toolbar
You will now learn how to customize GeoGebra‟s toolbar so you can limit the number of available tools for your students.
1. In the Tools menu click on Customize
toolbar… 2. The list on the left hand side displays
all GeoGebra tools that are part of the
GeoGebra Workshop Handout
29
default toolbar. If you click on one of the + symbols in front of the tool names the corresponding toolbox is opened. The list on the right hand side contains all available GeoGebra tools.
3. In the left hand side list select the word Separator. Click button Remove> several times until all list entries apart from Move are deleted.
4. In the left hand side list click on the + symbol in front of the Move tool to
open the toolbox. Select tool Rotate around point and click the
Remove> button again. The Move tool should now be the only tool left in the list on the left hand side.
5. Close the Move toolbox in the left hand side list by clicking on the – symbol.
6. In the right hand side list select, for example, tool Intersect two Objects and click button Insert <.
7. Repeat step 6 for all other tools you would like to include into your custom toolbar.
8. Use the Up and Down buttons to change the order of the tools in the left hand side list.
9. Click Apply once you are done. 10. Your GeoGebra window should now
show the customized toolbar.
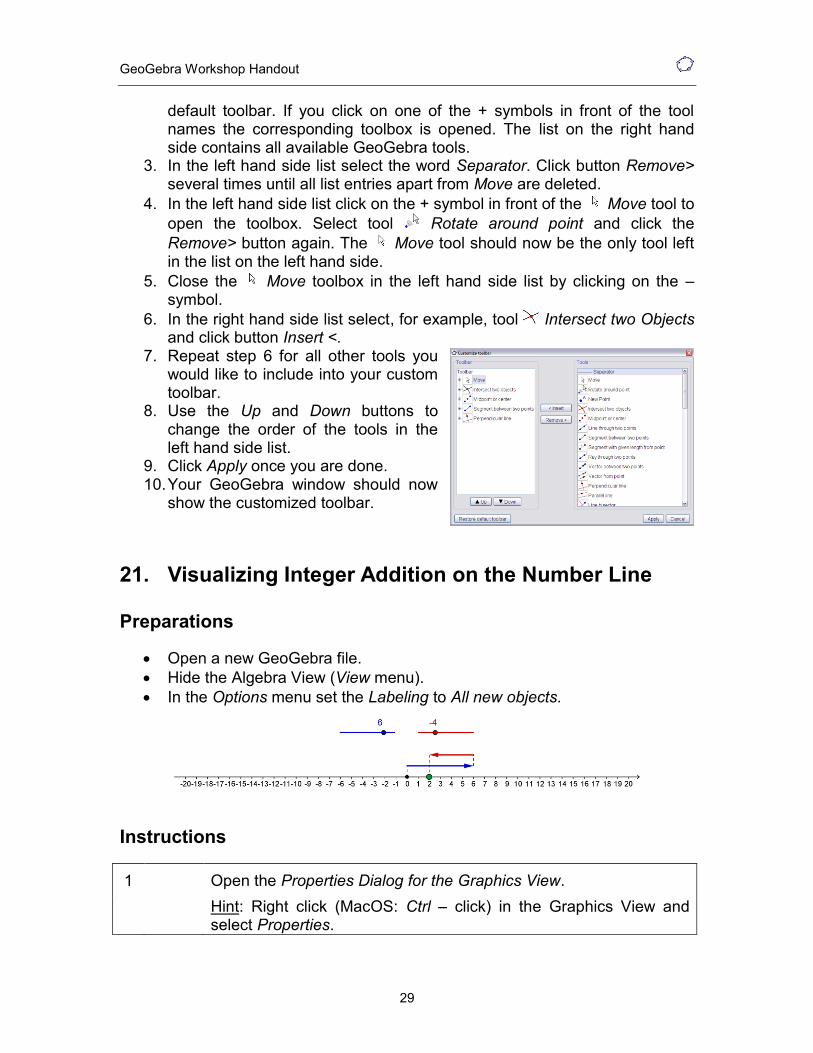
21. Visualizing Integer Addition on the Number Line
Preparations
Open a new GeoGebra file.
Hide the Algebra View (View menu).
In the Options menu set the Labeling to All new objects.
Instructions
1 Open the Properties Dialog for the Graphics View.
Hint: Right click (MacOS: Ctrl – click) in the Graphics View and select Properties.

GeoGebra Workshop Handout
30
2 On tab xAxis set the distance of tick marks to 1 by checking the box Distance and entering 1 into the text field.
3 Set the minimum of the x-Axis to -21 and the maximum to 21.
4 On tab yAxis uncheck Show yAxis.
5 Close the Properties Dialog for the Graphics View.
6
Slider for number a with interval -10 to 10 and increment 1.
7
Slider for number b with interval -10 to 10 and increment 1.
8 Show the value of the sliders instead of their names.
Hint: Properties Dialog – tab Basic – Show label
9
Point A = (0 , 1)
10 Point B = A + (a , 0)
Hint: The distance of point B to point A is determined by slider a.
11
Vector u = Vector[A, B] which has the length a.
12 Point C = B + (0 , 1)
13 Point D = C + (b , 0)
14
Vector v = Vector[C , D] which has the length b.
15 Point R = (x(D) , 0).
Hint: x(D) gives you the x-coordinate of point D. Thus, point R
shows the result of the addition on the number line.
16
Point Z = (0, 0)
17
Segment g = Segment[Z, A]
18
Segment h = Segment[B, C]
19
Segment i = Segment[D, R]
20 Use the Properties Dialog to enhance your construction (e.g. match the color of sliders and vectors, line style, fix sliders, hide labels).

GeoGebra Workshop Handout
31
Insert Dynamic Text
Enhance your interactive figure by inserting dynamic text that displays the corresponding addition problem. In order to display the parts of the addition problem in different colors you need to insert the dynamic text step by step.
1 Calculate the result of the addition problem: r = a + b
2
Insert dynamic text1: a
3
Insert static text2: "+"
4
Insert dynamic text3: b
5
Insert static text4: "="
6
Insert dynamic text5: r
7 Match the color of text1, text3, and text5 with the color of the corresponding sliders, vectors, and point R.
8
Line up the text in the Graphics View.
9 Hide the labels of the sliders and fix the text (Properties dialog).
22. Conditional Formatting – Inserting Checkboxes
Introduction of New Tool
Checkbox to Show / Hide Objects New! Hint: Click in the Graphics View to open the checkbox dialog window. Enter a caption and select the objects you want to show / hide using the checkbox from the drop down menu.
Instructions
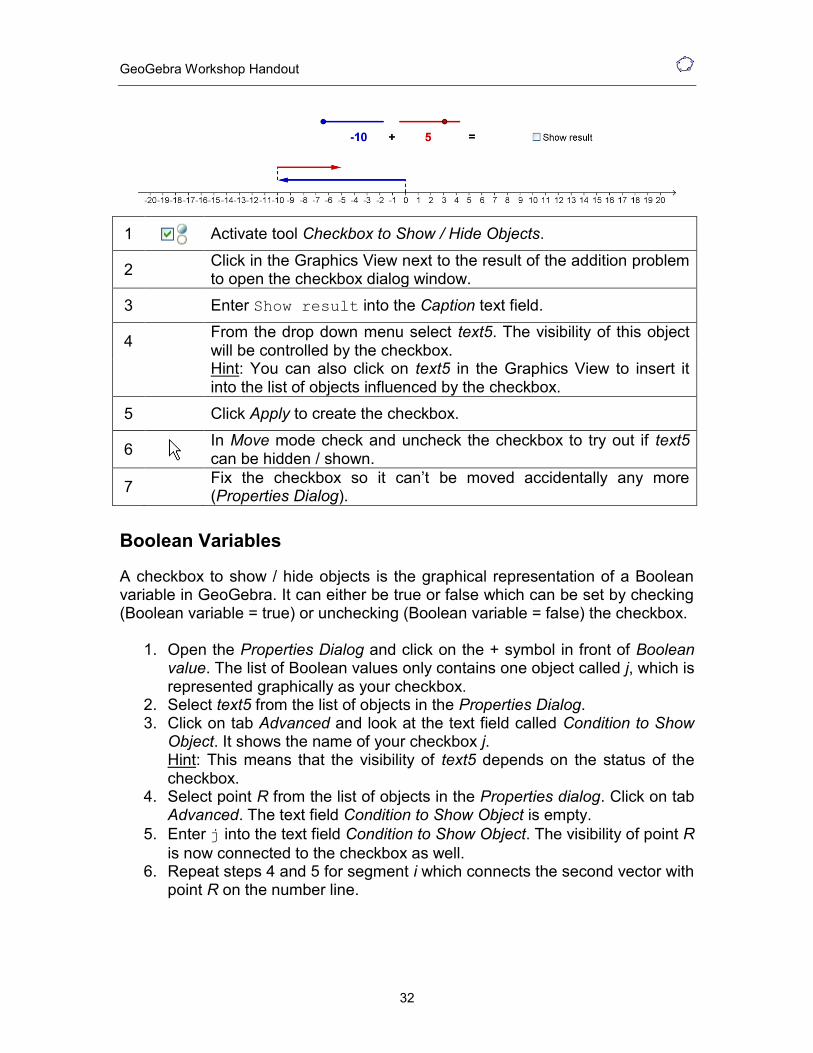
Insert a checkbox into the Graphics View that allows you to show or hide the result of the addition problem.
GeoGebra Workshop Handout
32
1
Activate tool Checkbox to Show / Hide Objects.
2 Click in the Graphics View next to the result of the addition problem to open the checkbox dialog window.
3 Enter Show result into the Caption text field.
4 From the drop down menu select text5. The visibility of this object will be controlled by the checkbox.
Hint: You can also click on text5 in the Graphics View to insert it into the list of objects influenced by the checkbox.
5 Click Apply to create the checkbox.
6
In Move mode check and uncheck the checkbox to try out if text5 can be hidden / shown.
7 Fix the checkbox so it can‟t be moved accidentally any more (Properties Dialog).
Boolean Variables
A checkbox to show / hide objects is the graphical representation of a Boolean variable in GeoGebra. It can either be true or false which can be set by checking (Boolean variable = true) or unchecking (Boolean variable = false) the checkbox.
1. Open the Properties Dialog and click on the + symbol in front of Boolean value. The list of Boolean values only contains one object called j, which is represented graphically as your checkbox.
2. Select text5 from the list of objects in the Properties Dialog. 3. Click on tab Advanced and look at the text field called Condition to Show
Object. It shows the name of your checkbox j. Hint: This means that the visibility of text5 depends on the status of the checkbox.
4. Select point R from the list of objects in the Properties dialog. Click on tab Advanced. The text field Condition to Show Object is empty.
5. Enter j into the text field Condition to Show Object. The visibility of point R
is now connected to the checkbox as well. 6. Repeat steps 4 and 5 for segment i which connects the second vector with
point R on the number line.

GeoGebra Workshop Handout
33
Hint: Now the checkbox controls three objects of your dynamic figure: text5 (which shows the result of the addition), point R, and segment i (which show the result on the number line).
23. Introducing Sequences
GeoGebra offers the command Sequence which produces a list of objects. Thereby, the type of object, the length of the sequence (that‟s the number of objects created), and the step width (e.g. distance between the objects) can be set using the following command syntax: Sequence[<expression>, <variable>, <from>, <to>, <step>]
Explanations:
<expression>:
determines the type of objects created. The expression needs to contain a
variable (e.g. (i, 0) with variable i).
<variable>:
tells GeoGebra the name of the variable used
<from>, <to>:
determine the interval for the variable used (e.g. from 1 to 10)
<step>:
is optional and determines the step width for the variable used (e.g. 0.5)
Examples for sequences
Sequence[(n, 0), n, 0, 10]
o creates a list of 11 points along the x-axis o points have coordinates (0, 0), (1, 0), (2, 0), …, (10, 0)
Sequence[Segment[(a, 0), (0, a)], a, 1, 10, 0.5]
o creates a list of segments with distance 0.5 o each segment connects a point on the x-axis with a point on the y-
axis (e.g. points (1, 0) and (0, 1); points (2, 0) and (0, 2)

GeoGebra Workshop Handout
34
If s is a slider with interval from 1 to 10 and increment 1, then command Sequence[(i, i), i, 0, s]
o creates a list of s + 1 points whose length can be changed dynamically by dragging slider s
o points have coordinates (0, 0), (1, 1), …, (10, 10)
24. String Art Based on Bézier Curves
Bézier curves are parametric curves used in computer graphics. For example, they are used in order to create smooth lines of vector fonts. Let‟s create some „string art‟ based on Bézier curves.
Preparations
Open a new GeoGebra file.
Show the Input Bar (View menu).
Hide the Algebra View and coordinate axes (View menu).
In the Options menu set the Labeling to All New Objects.
Instructions
1
Segment a with endpoints AB
2
Segment b with endpoints AC
3
Slider for number n with interval 0 to 50, increment 1, and width 200

GeoGebra Workshop Handout
35
4 Create Sequence[A + i/n (B - A), i, 1, n]
Hint: This sequence creates a list of n points along segment AB with a distance of one nth of the length of segment a.
5 Create Sequence[A + i/n (C - A), i, 1, n]
Hint: This sequence creates a list of n points along segment AC with a distance of one nth of the length of segment b.
6
Hide both lists of points.
7 Create a list of segments Sequence[Segment[Element[list1,i],Element[list2,n-i]],i,1,n]
Hint: These segments connect the first and last, second and last but one,…, last and first point of list1 and list2.
8 Enhance your construction using the Properties Dialog.
9
Move points A, B, and C to change the shape of your Bézier curve.
10
Drag slider n to change the number of segments that create the Bézier curve.
Note: The segments you just created are tangents to a quadratic Bézier curve.
Task
Create more „string art‟ with GeoGebra using sequences of points and segments.
25. Useful Web Links
GeoGebra Homepage: http://www.geogebra.org Get the software as well as information about the GeoGebra project GeoGebraWiki: http://www.geogebra.org/wiki Pool of free instructional materials created with GeoGebra GeoGebra User Forum: http://www.geogebra.org/forum Search for answers or post your own questions. Teachers from all over the world will try to help you. GeoGebra Documentation: http://www.geogebra.org/help (GeoGebra Help document, GeoGebra Introductory Book, GeoGebra Quickstart)