Embed Size (px)
Citation preview

285 J. Chin. Soc. Anim. Sci. 45(4): 285~299, 2016
Genome-wide association study of body composition traits in chicken
Ching-Yi Lien(1)(2)(3), Michèle Tixier-Boichard(1), Shih-Wen Wu(4), Fa-Jui Tan(2) and Chih-Feng Chen(2)(5)(6)
ABSTRACT
Meat yield is an important economic trait for poultry production. The present study aims at the iden-
tification of significant single nucleotide polymorphism (SNP) effect associated with body composition
traits in chickens. An F2 population was produced by crossing the Taiwan Country Chicken L2 line (se-
lected for body weight, size of comb area and egg production) with the experimental line of Rhode Island
Red layer R- (selected for low residual feed consumption). A total of 157 F2 males were genotyped with
the 60K Illumina iSelect SNP chip. Genome-wide association study (GWAS) was performed for 21 body
composition traits measured at 23 weeks of age. Furthermore, functional annotation of causative genes was
used to identify relevant genes and corresponding SNPs within chromosomal regions. Whole genome link-
age analysis led to identifying 23 SNP effects for 7 carcass traits (abdominal fat, feather, feet, gizzard, in-
testine, breast skin, and testis weight) with 5% Bonferroni genome-wide significance (P < 6.20×10⁻⁶), and
a total of 225 SNP effects reached suggestive significance (P < 1.24×10⁻⁴). Possible candidate genes such
as SOX10 for body composition traits were identified. Genome-wide association study made it possible to
identify amounts of SNPs associated with relevant genes for recorded traits. Quantitative trait locus (QTL)
mapping should be applied for following analysis to confirm the association between QTLs and measured
traits in chicken.
(Key Words: Body composition, Chicken, Genome-wide association study, Single nucleotide
polymorphism)
(1) GABI, INRA, AgroParisTech, Université Paris-Saclay, 78350 Jouy-en-Josas, France.(2) Department of Animal Science, National Chung Hsing University, 145 Xingda Rd., South Dist., 40227 Taichung,
Taiwan.(3) Livestock Research Institute, Council of Agriculture, Executive Yuan, 112 Muchang, Xinhua Dist., 71246 Tainan,
Taiwan.(4) Fonghuanggu Bird and Ecology Park, National Museum of Natural Science, 1-9 Renyi Rd., Lugu Township,
55841 Nantou County, Taiwan. (5) Center for the Integrative and Evolutionary Galliformes Genomics, National Chung Hsing University , No. 250,
Guoguang Rd., South Dist., 40227 Taichung, Taiwan.(6) Corresponding author, E-mail: [email protected]

286 中國畜牧學會會誌 第四十五卷 第四期
INTRODUCTION
Traditional selection for phenotype had made large improvement in poultry growth and meat yield be-
cause of the high heritabilities of growth and body composition traits (Jego et al., 1995; Le Bihan-Duval et
al., 1998). Negative correlations between chicken production and fitness traits challenged the selection for
rapid growth (Martin et al., 1990; Pinard-van der Laan et al., 1998), which resulted in physiological disor-
ders such as obesity, ascites, and a reduction in immunocompetence (Dunnington and Siegel, 1996; Deeb
and Lamont, 2002). Previous study demonstrated that chicken growth and fitness traits are controlled by
multiple genes (Deeb and Lamont, 2002), so that understanding the genetic variation of growth in chickens
is another solution to provide the opportunity for genetic enhancement of production performance. Genetic
markers linked with chromosomal regions allow for direct selection on genotype (Lamont et al., 1996) and
suggest to involve in breeding program.
Genome-wide association study (GWAS) is a powerful approach for investigating the genetic archi-
tecture of quantitative trait, which focuses on many genetic variants such as SNPs in different individuals
to see if any variants are associated with the traits across a set of individuals. GWAS was made possible by
the availability of array technology for assaying SNPs, which are typically used as genetic markers of a ge-
nomic region and are by far the most abundant form of genetic variation in chicken genome. GWAS using
the SNP array covering whole genome improves to a great mapping accuracy. The SNPs which were used
for GWAS strategy to identify the effects with important traits could be further predicted for the functions
of relevant gene by bioinformatics tools in order to prepare further studies of functional genomics (Tranch-
event et al., 2011 and Patnala et al., 2013).
In the present study, an F2 population was generated by crossing the Taiwan Country chicken L2 line
(selected for body weight, the size of comb area, and egg production) to the experimental line of Rhode
Island Red layer R- (selected for low residual feed consumption). GWAS was conducted on the body com-
position traits in an F2 population of birds at 23 weeks old to document the associated genomic loci and
relevant genes that might contribute to the phenotype. Therefore, functional annotation was applied in the
study to identify relevant genes and corresponding SNPs.
MATERIALS AND METHODS
1. Experimental population
An F2 cross design was produced by crossing the two parental lines L2 and R- at the experimental
farm of National Chung Hsing University (NCHU). The L2 line is a meat-type Taiwan Country chicken
selected for the body weight at 12 and 14 weeks of age, the size of comb area and egg production at 40
weeks of age (Chen et al., 1994; Lee et al., 1997). The R- line is a line of Rhode Island Red layer selected
for low value of residual feed consumption (RFC) at National Institute of Agricultural Research (INRA)
(Bordas and Mérat, 1984). Because the body composition traits of two parental lines were not available,
the variance analysis of L2 and R- for growth related traits were done before producing the F2 population.
Highly significant differences (P < 0.01) were found between L2 and R- lines for body weight at 0, 4, 8,

287Genome-wide association study of body composition traits in chicken
12, 16 weeks of age, and the size of comb area at 16 weeks of age. The results showed that the R- line was
lighter than the L2 line with a much smaller comb area. The 24th and 34th generation of the L2 and R-
lines were respectively used to set up an F2 population. Two F1 mating types, i.e. LR (L2 male mated to R-
female) and RL (R- male mated to L2 female), were produced from a total of 46 F0 parents by reciprocal
cross (6 L2 males mated to 15 R- females and 7 R- males mated to 18 L2 females). Then, the same mating
procedure was applied to create two F2 mating types XL (4 LR males mated to 32 RL females) and XR
(2 RL males mated to 19 LR females). A total of 157 F2 males were produced in 2 batches with the birth
dates: 31 Jan. 2011 and 18 Feb. 2011 were used in the study.
2. Husbandry
All chickens were reared on the floor in an open-sided building, with a temporary fence to close the
rooms and additional heating (24 hour/day) for the first two weeks. Fences were removed at three weeks
of age. Chicks were fed according to recommended nutrition standards, with a starter diet (metabolizable
energy: 2,830 kcal ME/kg and crude protein: 19.14%) from hatch to 4 weeks of age, a grower diet (me-
tabolizable energy: 2,818 kcal ME/kg and crude protein: 16.11%) from 5 weeks to 16 weeks of age, and
a breeder diet (metabolizable energy: 2,747 kcal ME/kg and crude protein: 18.18%) from 17 weeks to
23 weeks of age. Natural light was supplied during the rearing period. The vaccination plan set up by the
experimental farm of NCHU was applied to all birds. All the animals used in this study were processed
following the approved protocol of Institutional Animal Care and Use Committees of NCHU (Taichung,
Taiwan; IACUC No. 97-99).
3. Phenotypic measurements
The F2 chickens were fasted overnight, and were weighed before slaughtering. Then killed by manual
neck cut at the 23 weeks of age. After slaughtering, the birds were bled for 90 seconds, scalded at 55 to
60 °C for 50 seconds then put in a rotary drum picker to pluck feathers. The weight of carcass (CW), head
and neck, tenderloin, wing, back, feet, blood, feather, leg, abdominal fat (ABFat), viscera (liver, gizzard,
spleen, intestine, heart, and testis), and leg length (LegL) were measured and recorded (Lee and Chen.,
1984; Chen and Liu., 1992). The following parameters were taken:
(1)Head and neck obtained by cutting off the head to the last cervical vertebrae.
(2)Tenderloin obtained from the sternum, the pectoral major muscle and the pectoral minor muscle.
(3)Wing obtained by cutting through the humerus to the phalanx of front wings.
(4) Back: obtained by cutting from the part within scapula and the coracoid to the part within the rib-
bon and sternum.
(5)Leg obtained by cutting from the femur to the fibula (along the tibia).
(6)Foot obtained by cutting off the metatarsus and the phalanx.

288 中國畜牧學會會誌 第四十五卷 第四期
4. Statistical analysis
The distributions of measured traits were checked by the SAS® UNIVARIATE procedure (Statistical
Analysis System, Version 9.3, SAS, Institute Inc., Cary, NC, USA). Box-Cox transformation was applied
when the recorded traits were not in normal distribution. Variance analysis was performed with the SAS®
GLM procedure to estimate the fixed effects of dam and batch, taking into account CW as a covariate for
all recorded variables (exclude CW).
5. Genotyping and quality control
Genomic DNA was extracted from the venous blood using a commercial DNA extraction kit (DNeasy®
Blood kit) and diluted to 50 ng/µl. After DNA quality check, each chicken was genotyped using Illumina
60 K Chicken iSelect SNP chip. The SNP set used in present study consisted in 57,636 SNP markers. Ap-
proximately 38.3% (22,059) SNPs were removed for failing to meet at least one of the following require-
ments: low call rate of the sample or SNP (< 95%), low minor allele frequency (< 0.05), Hardy-Weinberg
equilibrium test P <1×10⁻⁶, or SNP located at unknown chromosome. Finally, marker data were validated
for 157 F2 individuals and 35,577 SNP markers distributed on 28 autosomes and Z chromosome were used
in the study. The marker information on each chromosome is summarized in Table 1.
6. Genome-wide association study
The F2 population stratification was assessed by multidimensional scaling (MDS) analysis available
from PLINK (Version 1.0.7) (Purcell et. al., 2007). The indep-pairwise option with a window size 25
SNPs, a step of 5 SNPs, and r2 threshold of 0.2 which represents the pairwise SNP-SNP metric based on
the genotypic correlation was used to obtain the independent SNPs. Pairwise identity-by-state (IBS) dis-
tances were calculated between all the individuals using 2,813 independent SNPs, and MDS components
were estimated by the mds-plot option based on the IBS matrix. Linkage disequilibrium (LD) blocks were
defined as a set of contiguous SNPs with pairwise r2 values exceeding 0.4, resulting in 5,246 LD blocks for
body composition traits. GWAS was carried out between phenotypic variables and SNP markers with the
linear regression analysis available from PLINK. A linear model was applied for each autosome, with batch
and the first MDS component for fixed effects, and CW as a covariate (excluded CW). While the statisti-
cal model for CW included the first MDS component and batch as fixed effects. Measures of SNP effects
were calculated by the GCTA package (Yang et al., 2011). The P-value threshold of the 5% Bonferroni
genome-wide significance and the significance of suggestive linkage were computed based on the number
of independent SNPs and LD blocks (Nicodemus et al., 2005; Lander and Kruglyak, 1995). Therefore, the
P-value threshold of 5% Bonferroni was set at 6.20×10⁻⁶ (0.05/8059) for genome-wide significance, and at
1.24×10⁻⁴ (1/8059) for suggestive significance. In addition, empirical genome-wide P-values were obtained
by the maxT option with 25,000 permutations. Manhattan plots of GWAS results for each trait were pro-
duced with qqman package available from R (Version 3.1.2).

289
Table 1 Basic information of SNP markers on physical map in chicken in this study
Chromosome Physical Map (Mb) No. of SNP Marker Density (Kb/SNP)
1 199.4 5,395 37.0
2 154.4 4,248 36.3
3 113.6 3,490 32.6
4 94.0 2,636 35.7
5 62.0 1,554 39.9
6 37.4 1,275 29.3
7 38.4 1,313 29.2
8 30.5 1,083 28.2
9 25.4 992 25.6
10 22.4 1,031 21.7
11 21.9 963 22.7
12 20.4 1,111 18.4
13 18.4 904 20.4
14 15.8 748 21.1
15 13.0 847 15.3
16 0.43 17 25.3
17 11.2 693 16.2
18 10.9 689 15.8
19 9.8 639 15.3
20 13.9 1,123 12.4
21 6.7 584 11.5
22 3.8 230 16.5
23 6.0 473 12.7
24 2.0 572 3.5
25 6.4 127 50.4
26 5.1 464 11.0
27 4.6 419 11.0
28 4.4 472 9.3
E22C19W28_E50C23 0.89 71 12.5
E64 0.049 3 16.3
Z 74.6 1,411 52.9
Total 1,027.8 35,577 22.8
Genome-wide association study of body composition traits in chicken
290 中國畜牧學會會誌 第四十五卷 第四期
7. Gene annotation
A SNP set (included the information of SNP ID and position) which reached the significant level and
showed the association with measured traits were automatically used for searching the information of
potential candidate genes in NCBI and Ensembl database (Pruitt et al., 2014; Yates et al., 2016) by an in-
house Perl script. Several public databases, i.e. PANTHER and DAVID databases, which provide the com-
prehensive set of functional annotation to understand biological meaning behind a list of given genes were
widely used for gene annotation and integrated discovery. Investigation of PANTHER and DAVID databas-
es for those possible candidate genes associated with significant SNPs was performed to make hypothesis
about the biological processes and molecular functions likely to influence the trait of interest (Thomas et
al., 2003; Huang et al., 2009).
RESULTS AND DISCUSSION
The distribution of each variables were checked. Three measured traits (abdominal fat, gizzard, and
spleen weight) did not comply with normal distribution were transformed by Box-Cox transformation (Box
and Cox, 1964). Means and standard deviations for F2 crosses are showed in Table 2. The fixed effects
(batch) were significant for each traits (except feather and liver weight). Highly significant differences
were found between 2 mating types (XL and XR) and 6 half-sib families for carcass, back, head and neck,
breast skin, spleen, and wing weight. All traits were not available in F0.
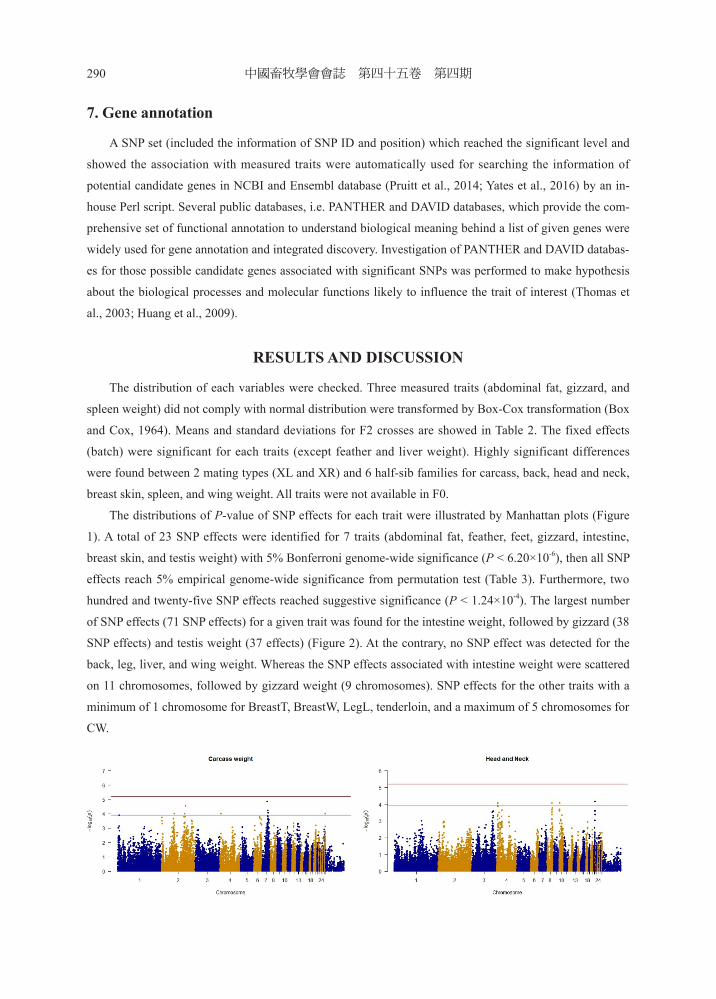
The distributions of P-value of SNP effects for each trait were illustrated by Manhattan plots (Figure
1). A total of 23 SNP effects were identified for 7 traits (abdominal fat, feather, feet, gizzard, intestine,
breast skin, and testis weight) with 5% Bonferroni genome-wide significance (P < 6.20×10⁻⁶), then all SNP
effects reach 5% empirical genome-wide significance from permutation test (Table 3). Furthermore, two
hundred and twenty-five SNP effects reached suggestive significance (P < 1.24×10⁻⁴). The largest number
of SNP effects (71 SNP effects) for a given trait was found for the intestine weight, followed by gizzard (38
SNP effects) and testis weight (37 effects) (Figure 2). At the contrary, no SNP effect was detected for the
back, leg, liver, and wing weight. Whereas the SNP effects associated with intestine weight were scattered
on 11 chromosomes, followed by gizzard weight (9 chromosomes). SNP effects for the other traits with a
minimum of 1 chromosome for BreastT, BreastW, LegL, tenderloin, and a maximum of 5 chromosomes for
CW.

291 Genome-wide association study of body composition traits in chicken

292 中國畜牧學會會誌 第四十五卷 第四期
Figure 1 Manhattan plot of GWAS for the recorded traits. The red line indicates the threshold for a 5%
Bonferroni genome-wide significance with a P-value of 6.20×10⁻⁶, and the blue line indicates the
threshold for a suggestive linkage association (P < 1.24×10⁻⁴)

293
Table 2 Body composition traits in F2 male progeny at 23 weeks of age
TraitXL XR Variance analysis
Mean SDa Mean SDa Mating type Batch Sireb
Abdominal Fat, g 26.56 19.99 33.98 25.45 NS * **
Back, g 365.52 70.78 393.74 66.00 ** ** **
Blood, g 72.18 20.47 73.75 19.69 NS ** NS
Breast length, cm 18.09 1.29 18.13 1.28 NS ** NS
Breast thickness, cm 1.35 0.30 1.47 0.35 * ** NS
Breast width, cm 14.76 1.39 15.19 1.45 * ** NS
Carcass, g 2279.80 348.76 2449.55 342.38 ** ** **
Feather, g 158.84 26.73 154.34 23.51 NS NS NS
Feet, g 90.57 11.67 93.31 12.53 NS ** NS
Gizzard, g 32.93 6.07 31.65 3.77 NS ** NS
Heart, g 67.53 14.26 63.19 9.09 * ** NS
Head and neck, g 227.15 44.11 248.14 44.08 ** ** **
Intestine, g 28.38 6.41 30.70 7.97 * ** **
Leg length, cm 17.38 0.91 17.38 1.07 NS ** NS
Leg, g 566.93 101.95 626.02 101.84 ** ** NS
Liver, g 1.29 0.91 1.59 1.18 NS NS *
Breast skin, g 33.18 12.75 37.15 11.70 ** ** **
Spleen, g 12.91 2.80 14.88 2.91 ** ** **
Tenderloin, g 32.80 8.50 35.18 9.03 * ** **
Testis, g 4.34 1.99 4.00 1.42 NS ** NS
Wing, g 199.93 28.39 211.78 31.48 ** ** **a standard deviationb sire family*P < 0.05, ** P< 0.01, NS: no significance
Figure 2 Number of SNPs reaching significant level (P < 1.24×10⁻⁴) for recorded traits.
Genome-wide association study of body composition traits in chicken

294 中國畜牧學會會誌 第四十五卷 第四期
Tabl
e 3
R
esul
ts o
f th
e G
WA
S: t
he li
st o
f S
NP
s sh
owin
g 5%
Bon
ferr
oni g
enom
e-w
ide
sign
ific
ance
for
the
reco
rded
trai
ts
Tra
itG
GA
aP
os (
bp)b
SN
PP
oly-
Type
cF
un-C
onse
qdP
-val
ueE
mp
Pe
Eff
ectf
Nea
rest
gen
eA
bdom
inal
Fat
281
4913
14rs
1421
0568
T/C
Inte
rgen
ic2.
94×
10-6
0.00
0017
140.
37
-2
8150
8121
rs16
0490
18A
/GIn
terg
enic
2.94
×10
-60.
0000
1714
0.37
LO
C10
1750
238
281
5569
22rs
1512
0844
A/G
Inte
rgen
ic1.
60×
10-7
0.00
0022
860.
40
-2
8158
7375
rs16
0490
96C
/TIn
terg
enic
2.94
×10
-60.
0000
1714
0.37
-
281
8614
60rs
1512
0968
G/A
Inte
rgen
ic5.
95×
10-6
0.00
0071
430.
44
LOC
1017
5038
82
8266
8398
rs13
6361
31G
/AIn
terg
enic
5.95
×10
-60.
0000
8857
0.44
-
283
0308
66rs
1512
1188
G/A
Inte
rgen
ic1.
60×
10-7
0.00
0011
430.
40
-2
8314
6274
rs14
2109
66C
/TIn
tron
1.60
×10
-70.
0000
1143
0.40
FH
OD
32
8317
7655
rs16
0497
10T
/CIn
tron
5.28
×10
-60.
0000
1429
0.61
FH
OD
32
8324
0377
rs14
2110
53C
/AIn
tron
1.60
×10
-70.
0000
1143
0.40
FH
OD
32
8367
4546
GG
aluG
A15
5388
G/A
Inte
rgen
ic2.
94×
10-6
0.00
0017
140.
37
LOC
1017
5019
12
8529
4913
GG
aluG
A15
5558
G/A
Inte
rgen
ic5.
28×
10-6
0.00
0014
290.
61
-2
1078
8412
4rs
1423
2014
C/A
Inte
rgen
ic3.
05×
10-6
0.00
0014
290.
31
LOC
1017
5180
13
9614
7570
rs16
3280
43T
/GIn
terg
enic
5.68
×10
-60.
0000
8857
0.82
-
399
6339
07G
Gal
uGA
2355
46C
/AIn
tron
5.68
×10
-60.
0000
8857
0.82
H
PCAL
120
1199
2058
rs16
1741
56G
/AU
pstr
eam
5.
64×
10-6
0.00
0074
290.
41
SPO
1120
1199
8949
rs15
1788
14A
/GIn
terg
enic
5.64
×10
-60.
0000
7429
0.41
SP
O11
Fea
ther
2821
2013
rs16
2087
61C
/TIn
terg
enic
3.20
×10
-60.
0000
2286
12.6
8 -
Fee
t2
1056
4569
0rs
1423
0847
T/C
Intr
on5.
16×
10-6
0.00
0002
863.
27
DSC
227
3487
476
GG
aluG
A20
0038
A/G
3 pr
ime
UT
R3.
31×
10-8
0.00
0005
715.
15
CAL
CO
CO
2G
izza
rd5
5105
1744
rs14
5484
29G
/AIn
terg
enic
1.70
×10
-70.
0000
0571
-2.2
8 -
551
1065
34rs
1454
8491
G/A
Inte
rgen
ic1.
70×
10-7
0.00
0005
71-2
.28
LOC
1017
4963
55
5163
3449
rs14
5490
24T
/CU
pstr
eam
1.15
×10
-60.
0000
1714
-2.2
4 -
553
6661
96G
Gal
uGA
2885
82C
/TIn
terg
enic
1.70
×10
-70.
0000
0571
-2.2
8 -
735
2713
06rs
1463
1311
A/G
Inte
rgen
ic3.
09×
10-6
0.00
0005
711.
64
-8
2284
1223
rs14
6529
66C
/TU
pstr
eam
3.
55×
10-6
0.00
0068
57-2
.66
CD
KN
2C21
3888
799
rs16
1807
65G
/AIn
terg
enic
4.69
×10
-60.
0000
0571
2.96
C
AS
Z1
Inte
stin
e2
1020
1498
1G
Gal
uGA
1599
39C
/TIn
tron
1.07
×10
-60.
0001
057
-5.0
0 LO
C42
1049
310
1066
570
GG
aluG
A23
6044
G/A
Inte
rgen
ic4.
04×
10-6
0.00
028
8.19
-
310
1733
765
GG
aluG
A23
6152
C/T
Intr
on3.
69×
10-6
0.00
0148
68.
17
NBA
S11
8063
547
rs14
0224
00C
/TIn
terg
enic
1.22
×10
-60.
0001
8.06
-
1195
0575
4rs
1379
2518
C/T
Intr
on1.
02×
10-6
0.00
0057
18.
42
GPA
TCH
111
9798
840
rs15
6159
44C
/T5
prim
e U
TR
3.35
×10
-60.
0002
28.
09
-11
1046
7812
rs14
9644
27T
/CIn
tron
5.28
×10
-60.
0000
87.
62
GPI
1110
4730
78G
Gal
uGA
0770
51G
/Ain
tron
3.02
×10
-60.
0001
657
10.3
7 D
PY19
L311
1047
3079
GG
aluG
A07
7052
C/T
intr
on3.
02×
10-6
0.00
0165
710
.37
DPY
19L3
Bre
ast s
kin
111
7814
913
rs13
9283
34G
/TIn
terg
enic
4.11
×10
-60.
0001
343
3.30
LO
C10
1750
943
111
8787
981
rs13
9293
83A
/GIn
tron
5.57
×10
-60.
0000
229
2.78
C
NK
SR2
Test
is8
2575
2251
GG
aluG
A33
1264
C/T
intr
on6.
00×
10-6
0.01
285
-2.6
7 G
LIS1
825
8126
86G
Gal
uGA
3312
91T
/GIn
terg
enic
5.60
×10
-60.
0125
1-2
.69
-a G
GA
: gal
lus
gall
us c
hrom
osom
eb P
os (
bp):
SN
P po
siti
on (
base
pai
r)c P
oly-
Type
: pol
ymor
phis
m ty
pe, f
irst
all
ele
is f
avor
able
all
ele
d Fun
-Con
seq:
fun
ctio
nal c
onse
quen
cee E
mp
P: e
mpi
rica
l gen
ome-
wid
e P-
valu
ef E
ffec
t: S
NP
effe
ct
295
Seven chromosomes (GGA 15, 16, 18, 19, 22, 24, and 26) did not harbor any significant SNP. The
chromosomes that were carrying genome-wide significant SNP effects for at least 2 traits were GGA 2 and
GGA 8. The strongest association across all chromosomes was found on GGA 27 where a region span-
ning 0.4 Mb (3.1 Mb – 3.5 Mb) harbored 1 genome-wide and 2 suggestive significant SNPs associated
with the feet weight. This region harbored 2 genes (FAM117A and CALCOCO2), 1 uncharacterized gene
(LOC101751129), and also the published QTL region associated with shank weight was located at this
chromosomal region (Park et al., 2006). There is no functional analysis of body composition trait for these
genes in chicken, even in mouse. Among these, the highest significance (P < 3.31×10⁻⁸) was obtained for
the calcium binding and coiled-coil domain 2 gene (CALCOCO2).
A chromosomal region located on GGA 1 where spanning 2.1 Mb (50.9 Mb – 53.0 Mb) harbored
3 suggestive SNPs (rs13865791, GGaluGA017598, and GGaluGA017646) and 2 genes (SOX10 and
PLA2G6) was associated with LegL. The SRY (sex determining region Y)-box 10 gene (SOX10) signifi-
cantly decreased body weight was observed in mouse research (Eppig et al., 2015). This gene also func-
tions to regulate chondrogenesis during limb development of the chicken embryo (Chimal-Monroy et al.,
2003). Moreover, this region on GGA 1 has also been previously associated with the QTLs for chicken
skeletal related traits, such as body slope length (Gao et al., 2011), femur and tibia weight (Sharman et al.,
2007), drumstick percentage (Li et al., 2005), shank growth (Gao et al., 2010), and insulin-like growth fac-
tor level (Park et al., 2006). The PLA2G6 gene was found the relation with the weight loss in mouse, so far,
there is no body composition related research in chicken (Eppig et al., 2015).
Previously researches showed that there were several published QTLs overlapped with the chromo-
somal regions identified in present study, and some of them harbored interesting relevant genes correspond-
ing to chicken body composition related traits. A region spanning 5.5 Mb (49.2 Mb – 54.7 Mb) on GGA
5 which covered by 12 SNPs (4 genome-wide and 8 suggestive SNPs), harbored 4 genes, and 2 uncharac-
terized genes showed the association with gizzard weight. This regions also overlapped with the published
QTL corresponded to chicken gizzard weight (Navarro et al., 2005). The TNF receptor associated factor
3 gene (TRAF3) is one of the genes harbored in this region and was showed the functional annotation for
spleen hyperplasia, decreasing body size, and body weight in mouse (Eppig et al., 2015). Another chromo-
somal region was identified on GGA 7 region (24.0 Mb – 28.2 Mb) which was detected the suggestive as-
sociation with CW. Several body weight related QTLs overlapped with this region included a genome-wide
significant QTL corresponding to CW (Nassar et al., 2012). Three genes (TTLL4, MYLK, and SEMA5B)
harbored in the region and 2 of 3 were involved in the function of body weight, body mass, fat amount, and
food intake decreasing (Eppig et al., 2015).
In conclusion, the present study has identified several SNP effects associated with body composition
traits for specific chicken male population in tropical climate condition. These results may be considered
for the future management of the L2 and R- lines. First, the segregation of SNPs for relevant genes remains
to be investigated in the F2 cross in order to confirm their effects on poultry male production performance.
Then, the frequency and the phenotypic consequence of the candidate SNPs need to be determined in both
parental lines, in order to decide whether these SNPs may be used for future breeding programs and selec-
tion process. Finally, QTL mapping should be applied for the next step in order to make the further confir-
mation for the relation between QTLs and measured traits.
Genome-wide association study of body composition traits in chicken
Tabl
e 3
R
esul
ts o
f th
e G
WA
S: t
he li
st o
f S
NP
s sh
owin
g 5%
Bon
ferr
oni g
enom
e-w
ide
sign
ific
ance
for
the
reco
rded
trai
ts
Tra
itG
GA
aP
os (
bp)b
SN
PP
oly-
Type
cF
un-C
onse
qdP
-val
ueE
mp
Pe
Eff
ectf
Nea
rest
gen
eA
bdom
inal
Fat
281
4913
14rs
1421
0568
T/C
Inte
rgen
ic2.
94×
10-6
0.00
0017
140.
37
-2
8150
8121
rs16
0490
18A
/GIn
terg
enic
2.94
×10
-60.
0000
1714
0.37
LO
C10
1750
238
281
5569
22rs
1512
0844
A/G
Inte
rgen
ic1.
60×
10-7
0.00
0022
860.
40
-2
8158
7375
rs16
0490
96C
/TIn
terg
enic
2.94
×10
-60.
0000
1714
0.37
-
281
8614
60rs
1512
0968
G/A
Inte
rgen
ic5.
95×
10-6
0.00
0071
430.
44
LOC
1017
5038
82
8266
8398
rs13
6361
31G
/AIn
terg
enic
5.95
×10
-60.
0000
8857
0.44
-
283
0308
66rs
1512
1188
G/A
Inte
rgen
ic1.
60×
10-7
0.00
0011
430.
40
-2
8314
6274
rs14
2109
66C
/TIn
tron
1.60
×10
-70.
0000
1143
0.40
FH
OD
32
8317
7655
rs16
0497
10T
/CIn
tron
5.28
×10
-60.
0000
1429
0.61
FH
OD
32
8324
0377
rs14
2110
53C
/AIn
tron
1.60
×10
-70.
0000
1143
0.40
FH
OD
32
8367
4546
GG
aluG
A15
5388
G/A
Inte
rgen
ic2.
94×
10-6
0.00
0017
140.
37
LOC
1017
5019
12
8529
4913
GG
aluG
A15
5558
G/A
Inte
rgen
ic5.
28×
10-6
0.00
0014
290.
61
-2
1078
8412
4rs
1423
2014
C/A
Inte
rgen
ic3.
05×
10-6
0.00
0014
290.
31
LOC
1017
5180
13
9614
7570
rs16
3280
43T
/GIn
terg
enic
5.68
×10
-60.
0000
8857
0.82
-
399
6339
07G
Gal
uGA
2355
46C
/AIn
tron
5.68
×10
-60.
0000
8857
0.82
H
PCAL
120
1199
2058
rs16
1741
56G
/AU
pstr
eam
5.
64×
10-6
0.00
0074
290.
41
SPO
1120
1199
8949
rs15
1788
14A
/GIn
terg
enic
5.64
×10
-60.
0000
7429
0.41
SP
O11
Fea
ther
2821
2013
rs16
2087
61C
/TIn
terg
enic
3.20
×10
-60.
0000
2286
12.6
8 -
Fee
t2
1056
4569
0rs
1423
0847
T/C
Intr
on5.
16×
10-6
0.00
0002
863.
27
DSC
227
3487
476
GG
aluG
A20
0038
A/G
3 pr
ime
UT
R3.
31×
10-8
0.00
0005
715.
15
CAL
CO
CO
2G
izza
rd5
5105
1744
rs14
5484
29G
/AIn
terg
enic
1.70
×10
-70.
0000
0571
-2.2
8 -
551
1065
34rs
1454
8491
G/A
Inte
rgen
ic1.
70×
10-7
0.00
0005
71-2
.28
LOC
1017
4963
55
5163
3449
rs14
5490
24T
/CU
pstr
eam
1.15
×10
-60.
0000
1714
-2.2
4 -
553
6661
96G
Gal
uGA
2885
82C
/TIn
terg
enic
1.70
×10
-70.
0000
0571
-2.2
8 -
735
2713
06rs
1463
1311
A/G
Inte
rgen
ic3.
09×
10-6
0.00
0005
711.
64
-8
2284
1223
rs14
6529
66C
/TU
pstr
eam
3.
55×
10-6
0.00
0068
57-2
.66
CD
KN
2C21
3888
799
rs16
1807
65G
/AIn
terg
enic
4.69
×10
-60.
0000
0571
2.96
C
AS
Z1
Inte
stin
e2
1020
1498
1G
Gal
uGA
1599
39C
/TIn
tron
1.07
×10
-60.
0001
057
-5.0
0 LO
C42
1049
310
1066
570
GG
aluG
A23
6044
G/A
Inte
rgen
ic4.
04×
10-6
0.00
028
8.19
-
310
1733
765
GG
aluG
A23
6152
C/T
Intr
on3.
69×
10-6
0.00
0148
68.
17
NBA
S11
8063
547
rs14
0224
00C
/TIn
terg
enic
1.22
×10
-60.
0001
8.06
-
1195
0575
4rs
1379
2518
C/T
Intr
on1.
02×
10-6
0.00
0057
18.
42
GPA
TCH
111
9798
840
rs15
6159
44C
/T5
prim
e U
TR
3.35
×10
-60.
0002
28.
09
-11
1046
7812
rs14
9644
27T
/CIn
tron
5.28
×10
-60.
0000
87.
62
GPI
1110
4730
78G
Gal
uGA
0770
51G
/Ain
tron
3.02
×10
-60.
0001
657
10.3
7 D
PY19
L311
1047
3079
GG
aluG
A07
7052
C/T
intr
on3.
02×
10-6
0.00
0165
710
.37
DPY
19L3
Bre
ast s
kin
111
7814
913
rs13
9283
34G
/TIn
terg
enic
4.11
×10
-60.
0001
343
3.30
LO
C10
1750
943
111
8787
981
rs13
9293
83A
/GIn
tron
5.57
×10
-60.
0000
229
2.78
C
NK
SR2
Test
is8
2575
2251
GG
aluG
A33
1264
C/T
intr
on6.
00×
10-6
0.01
285
-2.6
7 G
LIS1
825
8126
86G
Gal
uGA
3312
91T
/GIn
terg
enic
5.60
×10
-60.
0125
1-2
.69
-a G
GA
: gal
lus
gall
us c
hrom
osom
eb P
os (
bp):
SN
P po
siti
on (
base
pai
r)c P
oly-
Type
: pol
ymor
phis
m ty
pe, f
irst
all
ele
is f
avor
able
all
ele
d Fun
-Con
seq:
fun
ctio
nal c
onse
quen
cee E
mp
P: e
mpi
rica
l gen
ome-
wid
e P-
valu
ef E
ffec
t: S
NP
effe
ct

296 中國畜牧學會會誌 第四十五卷 第四期
ACKNOWLEDGEMENTS
This study was supported by a grant of the Ministry of Science and Technology, Taiwan (grant number
NSC 99-2321-B-005-009-MY3), the fellowship from the French Institute of Taipei, the Ministry of Edu-
cation, and the Ministry of Science and Technology in Taiwan. The staff of the experimental farm of the
NCHU is gratefully acknowledged. This work was dedicated to André Bordas, INRA, who selected the R-
line and organized the shipment of a subset of the line to NCHU in 2003, Yen-Pai Lee, who preserved and
maintained the L2 line in NCHU, and Bing-Yen, Tsai, who made an in-house Perl script to combine the
database information between SNPs and relevant genes.
REFERENCES
Blagojević, M., Z. Pavlovski, Z. Škrbić, M. Lukić, N. Milosević, and L. Perić. 2009. The effect of genoptype of
broiler chicken on carcass quality in extensive rearing system. Acta. Vet-Beograd. 59:91-97.
Bordas, A., and P. Mérat. 1984. Correlated responses in a selection experiment on residual feed intake of adult
Rhode-Island Red cocks and hens. Ann. Agric. Fenn. 23:233-237.
Box, G. E., P. and D. R. Cox. 1964. An analysis of transformation. J. R. Stat. Soc. 26:211-252.
Chen, C. F., Y. P. Lee, Y. K. Fan, S. Y. Huang, and H. H. Huang. 1994. The conservation of Taiwan’s Local
chickens. J. Chin. Soc. Anim. Sci. 23:339-346.
Chen, M. T., and D. C. Liu. 1992. Poultry specifications manual.
Chimal-Monroy, J., J. Rodriguez-Leon, J. A. Montero, Y. Ganan, D. Macias, R. Merino, and J. M. Hurle. 2003.
Analysis of the molecular cascade responsible for mesodermal limb chondrogenesis: Sox genes and BMP
signaling. Dev. Biol. 257:292-301.
Deeb, N., and S. J. Lamont. 2002. Genetic architecture of growth and body composition in unique chicken pop-
ulations. J. Hered. 93:107-118.
Dunnington, E. A., and P. B. Siegel. 1996. Long-term divergent selection for eight-week body weight in White
Plymouth rock chickens. Poult. Sci. 75:1168-1179.
Eppig, J. T., J. A. Blake, C. J. Bult, J. A. Kadin, and J. E. Richardson. 2015. The Mouse Genome Database
Group. The Mouse Genome Database (MGD): facilitating mouse as a model for human biology and dis-
ease. Nucleic Acids Res. 43:D726-736.
Gao, Y., C. G. Feng, C. Song, Z. Q. Du, X. M. Deng, N. Li, and X.-X. Hu. 2011. Mapping quantitative trait loci
affecting chicken body size traits via genome scanning. Anim. Genet. 42:670-674.
Gao, Y., Z. Q. Du, C. G. Feng, X. M. Deng, N. Li, Y. Da, and X. X. Hu. 2010. Identification of quantitative trait
loci for shank length and growth at different development stages in chicken. Anim. Genet. 41:101-104.
Hu, Z. L., C. A. Park, and J. M. Reecy. 2016. Developmental progress and current status of the Animal QTLdb.
Nucleic Acids Res. 44:D827-833.
Huang, D. W., B. T. Sherman, and R. A. Lempicki. 2009. Systematic and integrative analysis of large gene lists
using DAVID Bioinformatics Resources. Nature Protoc. 4:44-57.
Jego, Y., B. Besbes, and J. L. Donal. 1995. Analyse de la variabilité génétique et de la réponse à la sélection

297
dans deux lignées commerciales de poulets de chair. Page 125-127 in Proceedings of the 1e`res Journées de
la Recherche Avicole, Angers, France. ITAVI, Paris, France.
Lamont, S. J., N. Lakshmanan, Y. Plotsky, M. G. Kaiser, M. Kuhn, J. A. Arthur, N. J. Beck, and N. P. O’Sullivan.
1996. Genetic markers linked to quantitative traits in poultry. Anim. Genet. 27:1-8.
Lander, E., and L. Kruglyak. 1995. Genetic dissection of complex traits: guidelines for interpreting and report-
ing linkage results. Nat. Genet. 11:241-247.
Le Bihan-Duval, E., S. Mignon-Grasteau, N. Millet, and C. Beaumont. 1998. Genetic analysis of a selection
experiment on increased body weight and breast muscle weight as well as on limited abdominal fat weight.
Br. Poult. Sci. 39:346-353.
Lee, Y. P., and M. T. Chen. 1984. Growth and carcass part proportions of the three main varieties of meat-type
chickens in Taiwan. J. Chin. Soc. Anim. Sci. 13:17-21.
Lee, Y. P., L. T. Yeh, and H. H. Huang. 1997. A study on the production system of Taiwan Country chicken:
growth traits of three-strain cross country chickens. J. Chin. Soc. Anim. Sci. 26:271-284.
Li, H., N. Deeb, H. Zhou, C. M. Ashwell, and S. J. Lamont. 2005. Chicken quantitative trait loci for growth and
body composition associated with the very low density apolipoprotein-II gene. Poult. Sci. 84:697-703.
Martin, A., E. A. Dunnington, W. B. Gross, W. E. Briles, R. W. Briles, and P. B. Siegel. 1990. Production traits
and alloantigen systems in lines of chickens selected for high or low antibody responses to sheep erythro-
cytes. Poult. Sci. 69:871-878.
Nassar, M. K., Z. S. Goraga, and G. A. Brockmann. 2012. Quantitative trait loci segregating in crosses between
New Hampshire and White Leghorn chicken lines: II. Muscle weight and carcass composition. Anim. Gen-
et. 43:739-745.
Navarro, P. 1., P. M. Visscher, S. A. Knott, D. W. Burt, P. M. Hocking, and C. S. Haley. 2005. Mapping of
quantitative trait loci affecting organ weights and blood variables in a broiler layer cross. Br. Poult. Sci.
46:430-442.
Nicodemus, K. K., W. Liu, G. A. Chase, Y. Y. Tsai, and M. D. Fallin. 2005. Comparison of type I error for mul-
tiple test corrections in large single-nucleotide polymorphism studies using principal components versus
haplotype blocking algorithms. BMC Genet. 6 (Suppl. 1):S78.
Park, H. B., L. Jacobsson, P. Wahlberg, P. B. Siegel, and L. Andersson. 2006. QTL analysis of body composition
and metabolic traits in an intercross between chicken lines divergently selected for growth. Physiol. Ge-
nomics. 25:216-223.
Patnala, R., J. Clements, and J. Batra. 2013. Candidate gene association studies: a comprehensive guide to use-
ful in silico tools. BMC Genet. 14:39.
Pinard-van der Laan, M. H., P. B. Siegel, and S. J. Lamont. 1998. Lessons from selection experiments on im-
mune response in the chicken. Poult. Avian Biol. Rev. 9:125-141.
Pruitt, K. D., G. R. Brown, S. M. Hiatt, F. Thibaud-Nissen, A. Astashyn, O. Ermolaeva, C. M. Farrell, J. Hart,
M. J. Landrum, K. M. McGarvey, M. R. Murphy, N. A. O’Leary, S. Pujar, B. Rajput, S. H. Rangwala, L.
D. Riddick, A. Shkeda, H. Sun, P. Tamez, R. E. Tully, C. Wallin, D. Webb, J. Weber, W. Wu, M. DiCuccio,
P. Kitts, D. R. Maglott, T. D. Murphy, and J. M. Ostell. 2014. RefSeq: an update on mammalian reference
Genome-wide association study of body composition traits in chicken

298 中國畜牧學會會誌 第四十五卷 第四期
sequences. Nucleic Acids Res. 42:D756-763.
Purcell, S., B. Neale, K. Todd-Brown, L. Thomas, M. A. Ferreira, D. Bender, and J. Maller, P. Sklar, P. I. de
Bakker, M. J. Daly, and P. C. Sham. 2007. PLINK: a tool set for whole-genome association and popula-
tion-based linkage analyses. Am. J. Hum. Genet. 81:559-575.
Sharman. P. W. A., D. R. Morrice, A. S. Law, D. W. Burt, and P. M. Hocking. 2007. Quantitative trait loci for
bone traits segregating independently of those for growth in an F2 broiler × layer cross. Cytogenet. Ge-
nome Res. 117:296-304.
Thomas, P. D., M. J. Campbell, A. Kejariwal, H. Mi, B. Karlak, R. Daverman, K. Diemer, A. Muruganujan, and A.
Narechania. 2003. PANTHER: a library of protein families and subfamilies indexed by function. Genome
Res. 13:2129-2141.
Tranchevent, L.-C., F. B. Capdevila, D. Nitsch, B. De Moor, P. De Causmaecker, and Y. Moreau. 2011. A guide
to web tools to prioritize candidate genes. Brief Bioinform. 12:22-32.
Yang, J., S. H. Lee, M. E. Goddard, and P. M. Visscher. 2011. GCTA: a tool for genome-wide complex trait
analysis. Am. J. Hum. Genet. 88:76-82.
Yates, A., W. Akanni, M. R. Amode, D. Barrell, K. Billis, D. Carvalho-Silva, C. Cummins, P. Clapham, S. Fitz-
gerald, L. Gil, C. G. Girón, L. Gordon, T. Hourlier, S. E. Hunt, S. H. Janacek, N. Johnson, T. Juettemann,
S. Keenan, I. Lavidas, F. J. Martin, T. Maurel, W. McLaren, D. N. Murphy, R. Nag, M. Nuhn, A. Parker, M.
Patricio, M. Pignatelli, M. Rahtz, H. S. Riat, D. Sheppard, K. Taylor, A. Thormann, A. Vullo, S. P. Wilder, A.
Zadissa, E. Birney, J. Harrow, M. Muffato, E. Perry, M. Ruffier, G. Spudich, S. J. Trevanion, F. Cunning-
ham, B. L. Aken, D. R. Zerbino, and P. Flicek. 2016. Ensembl 2016. Nucleic Acids Res. 44:D710-716.

299
雞體組成性狀全基因組關聯性分析
練慶儀(1)(2)(3) Michèle Tixier-Boichard(1) 吳詩雯(4)
譚發瑞(2) 陳志峰 (2)(5)(6)
摘要:產肉量為家禽產業的重要經濟性狀。本研究旨在於尋找與雞隻體組成性狀
顯著相關之單一核甘酸多型性(signal nuclide polymorphism, SNP)效應。動物族
群採用台灣土雞 L2 品系(選拔第 12、14 週齡雞冠面積及第 40 週齡產蛋量)與
洛島紅 R-試驗品系(選拔低飼料採實殘差)進行雜交之子二代進行試驗。157 隻
F2 代公雞於 23 週齡時屠宰,收集 21 個體組成表型性狀與由 Illumina 60K iSelect
SNP 晶片鑑定取得之 SNP 基因型資料後,利用全基因組關聯性分析(genome-wide
association study, GWAS)找尋性狀與 SNP 效應間的關聯性。此外,候選基因的
功能性解析運用於定義染色體區間內相關基因與其對應之 SNP的功能。全基因組
關聯性分析結果顯示,有 23 個 SNP 效應達 5% Bonferroni 基因組顯著水準(P <
6.2×10⁻⁶),其與腹脂、羽毛、腳、砂囊、腸、胸皮、及睪丸重量等體組成性狀具
關連性,另亦有 225 個 SNP 效應達建議顯著水準(P < 1.24×10⁻⁴)。此外,本研
究亦找出許多與雞隻體組成相關之潛在候選基因,如:SOX10。利用基因組關聯性
分析可尋找與性狀相關聯的 SNP 效應及候選基因。未來可利用數量性狀基因座定
位(quantitative trait locus mapping, QTL mapping)分析,以精確定義與雞隻體組成
性狀相關的 QTLs。
(關鍵語:體組成、雞、基因組關聯性分析、單一核苷酸多型性)
(1)法國國家農業科學研究院,巴黎農業學院,巴黎薩克雷大學,78350 法國茹伊昂若薩斯。(2)國立中興大學動物科學系,40227 臺中市興大路 145 號。(3)行政院農業委員會畜產試驗所 , 71246 臺南市新化區牧場 112 號。(4)國立自然科學博物館鳳凰谷鳥園生態園區,55841 南投縣鹿谷鄉鳳凰村仁義路 1-9 號。(5)國立中興大學鳥禽類演化與基因體研究中心,40227 臺中市南區國光路 250 號。(6)通訊作者,E-mail: [email protected]
中國畜牧學會會誌 45(4):285~299, 2016