Embed Size (px)
Citation preview

S1
SUPPORTING INFORMATION
Genome Mining of a Prenylated Immunosuppresive Polyketide from Pathogenic Fungi
Yit-Heng Chooi†, Jinxu Fang§, Hong Liu‖ , Scott G. Filler‖ ┴, Pin Wang§, Yi Tang*†‡
†Department of Chemical and Biomolecular Engineering, and
‡Department of Chemistry and
Biochemistry, University of California, Los Angeles, CA 90066, United States, §Department of Chemical
Engineering and Materials Science, University of Southern California, Los Angeles, CA 90089, United
States, ‖Los Angeles Biomedical Research Institute at Harbor-UCLA Medical Center, Torrance, CA
90502, United States, ┴David Geffen School of Medicine at UCLA, Los Angeles, CA 90095,United States.
Corresponding Author: [email protected]
Table of Contents
Pages Supplementary Methods Strains and culture conditions S2 General molecular biology methods S2 Construction of pBARGPE-LIC and overexpression plasmids S2 Transformation of N. fischeri and A. fumigatus S2 Compound extraction and purification S2 NMR characterizations S2 X-ray Crystallographic data collection S3 Antimicrobial assays S3 Immunosuppressive assays. S3 51Cr damage assays S3 Supplementary Tables Table S1. List of Primers used in study S5 Table S2 Protein sequence identity comparison between orthologous genes S6 Table S3. 1H, 13C and 2D NMR data of 3 in DMSO-d6 S7 Table S4. Tentative assignment of 1H-NMR of 7 in DMSO-d6 and LCMS analysis S8 Supplementary Figures Figure S1. Expression analysis of the nsc biosynthetic genes S9 Figure S2. LCMS analysis of N. fischeri T2 overexpressing nscR S10 Figure S3. Comparative LCMS analysis of A. fumigatus T1 overexpressing nscR S11 Figure S4. In vitro prenyltransferase assays of NscD (Nf-pcPTase) S12 Figure S5. 1H-NMR spectrum of compound 3 in DMSO-d6 S13 Figure S6. 13C-NMR spectrum of compound 3 in DMSO-d6 S14 Figure S7. 1H-13C HSQC spectrum of compound 3 in DMSO-d6 S15 Figure S8. 1H-13C HMBC spectrum of compound 3 in DMSO-d6 S16 Figure S9. Cytotoxicity of 3 against HeLa and HFF cell lines S17 Figure S10. 51Cr damage assays S18 Supplementary Discussion S19 Supplementary References S19

S2
Supplementary Methods
Strains and cell culture conditions. N. fischeri NRRL 181 was obtained from ARS (NRRL) culture collection (Peoria, Illinois) and maintained on potato dextrose agar (Difco). A. fumigatus Af293 was obtained from Fungal Genetics Stock Center (FGSC), MO and maintained on Sabouraud agar (BD Biosciences). The E. coli strains XL-1 Blue (Stratagene) and TOP10 (Invitrogen) were used for DNA manipulation.
General molecular biology methods. Genomic DNA from N. fisheri and A. fumigatus was prepared using the CTAB isolation buffer as described elsewhere or using ZYMO ZR fungal/bacterial DNA kit (Zymo Research) according to the manufacturer’s protocol. PCR reactions were performed with Phusion high-fidelity DNA polymerase (New England Biolabs, NEB) or Platinum Pfx DNA polymerase (Invitrogen). PCR products were cloned into pCR-Blunt vector (Invitrogen) and confirmed by DNA sequencing. Primers used for molecular cloning were synthesized by Integrated DNA Technologies and are listed in Table S1.
Construction of pBARGPE-LIC and overexpression plasmids. The pBARGPE1 plasmid obtained
from Fungal Genetics Stock Center (FGSC) contains a cloning site between PgpdA promoter and TtrpC terminator for gene expression in filamentous fungi using bar gene as selection for glufosinate resistance. The plasmid was converted into a ligation-independent cloning (LIC) compatible vector (pBARGPE-LIC) by ligating a LIC adapter with compatible overhangs (obtained from annealing two 35 bp complementary oligos LIC-BHI and LIC-XI, Table S1) into a BamHI/XhoI cut pBARGPE1 plasmid. The LIC cloning protocol is as described elsewhere.
1 Briefly, to prepare the vector for LIC cloning, 1-3 μg of pBARGPE-
LIC is cut with SmaI and gel purified for T4 DNA polymerase (10U) treatment (20 μL reaction) in the presence of 2.5 mM dATP for 30 min at room temperature followed by heat inactivation for 20min at 75°C. For cloning of nscR from N. fischeri (NFIA_112260) and A. fumigatus (Afu7G00130), forward and reverse primers with LIC overhangs are used to amplify the two genes including introns (Table S1). The PCR products are prepared in the same manner as the vector except in the presence of 2.5 mM of dTTP instead of dATP. 2 μL of the inserts and 1 μL of the vector were combined, heated to 75°C briefly and reannealed at room temperature, before transformation into E. coli XL-1 Blue cells for propagation of the expression plasmids. The two constructs pBGP-Nf112260 and pBGP-Af0130 are verified by sequencing. However, due to the lower sensitivity of A. fumigatus toward glufosinate, the PgpdA::Af0130::TtrpC cassette from pGP-Af0130 was subcloned to the NotI site of p402 plasmid (p402-Af0130), which contains a resistant marker phleo
R for phleomycin selection.
2
Transformation of N. fischeri and A. fumigatus. For N. fisheri NRRL181, conidia were harvested
from 3-4 day culture grown on potato dextrose agar with 1M sucrose. Protoplasting and transformation of N. fischeri with pBGP-Nf112260 was carried out using the polyethyelene-glycol method as described previously.
3 For transformation of A. fumigatus Af293 with p402-Af0130, a similar protoplasting and
transformation method was employed.4
Compound extraction and purification. Compound 3 and 7 was purified from N. fisheri T2
overexpressing nscR grown in stationary liquid YG culture for 3 days. The compound were extracted from the cultures using equal volume of EtOAc/MeOH/AcOH (89:10:1) twice followed by solvent partitioning using CHCl3/H2O (CHCl3 fraction was retained and dried) and 90% MeOH/hexanes (90% MeOH fraction was retained and dried). This is followed by a chromatographic separation on a Sephadex LH-20 column using MeOH/CHCl3 (1:1) as the mobile phase. Fractions collected were checked by TLC. Additional rounds of chromatographic separation using Sephadex LH-20 column was performed using a hexane/MeOH/CHCl3 solvent system with decreasing ratio of hexane from 3:1:1 to 1:1:1. Further purification was carried out by reverse-phase HPLC using a Beckman Coulter System Gold LC coupled to a Phenomenex Luna 250 x 10mm 5 micron C18 column and a UV-Vis detector. The compounds were separated on a solvent gradient of 40-80% solvent B (acetonitrile with 0.1% TFA) at a flow rate of 3 ml/min over 30 mins. The HPLC fractions containing pure compounds were pooled and dried completely under vacuum to give 35 mg of compound 3 and >1mg of compound 7. Compound 3 gives a m/z of 485
[M+H]+ in LC-ESI/MS and showed [α]22
D −99 (c 1.0, CHCl3).
NMR characterizations. All
1H,
13C and 2D (HSQC and HMBC) NMR were performed on a Bruker
DRX-500 spectrometer. DMSO-d6 was used as the solvent for all compounds. The NMR assignments of the compounds are listed in Table S3 and S4, while the spectra are in Figure S5-S8.

S3
X-ray crystallographic data collection. An orange platelet-like crystal of 3, approximate dimensions .40mm x .20mm x .15 mm, was used for intensity data. The diffraction data were measured at 100K on a Bruker SMART Apex II CCD-based X-ray diffractometer system equipped with a Mo-Kα radiation (λ= 0.71073 Å). The detector was placed at a distance of 6.00 cm from the crystal. A total of 2158 frames were collected with a scan width of 0.5° in ω, with an exposure time of 10 sec/frame. The frames were integrated with the Bruker SAINT software package using a narrow-frame integration algorithm.
5 The integration of the data using a orthorhomic unit cell yielded a total of 23005 reflections to
a maximum 2Ө angle of 58.5°, of which 7404 were independent (Rint = 2.76%). The final cell constants of a = 5.3516 (9) Å, b = 19.434(3) Å, c = 13.261(2) Å, V = 1372.8(4) Å3, are based upon the refinement of the XYZ centroids of 9905 reflections. The structure was solved and refined using the Bruker SHELXTL (Version 6.14) Software Package,
6 in the space group P21. Based on the close homology of AdaC to
NscC, the stereochemistry at position C2 and C3 in 3 is expected to be identical to C4a and C12a in 1. The heavy sulfur atom in DMSO (3 co-crystalized with residual DMSO-d6 from previous NMR analysis) resulted in anomolous scattering of the X-rays, which allowed the confirmation of the absolute configuration of 3. The stereochemistry of all atoms was refined anisotropically and hydrogen atoms were placed at the calculated positions. The final anisotropic full-matrix least-squares refinement on F2 converged at R1 = 5.63%, wR2= 13.56% and a goodness-of-fit of 1.047. The Crystallographic Information File (CIF) for the crystal structure of 3 are deposited at the Cambridge Crystallographic Data Centre and allocated the deposition number CCDC 866028.
Antimicrobial assays. For testing the anti-bacterial activities of the compounds, Gram positive S.
aureus and B. subtilis, and Gram negative S. enterica serovar Cerro 87 and E. coli DH10B were used. The S. aureus, B. subtillis and S. enterica strains were obtained from Shangai Jiao Tong University, China. The minimal inhibitory concentration (MIC) assays were performed in 96-well plates in quadruplicates with the bacterial strains inoculated in LB broth at a starting OD600 of 0.00025 (diluted from cultures with OD600 of 0.4-1.0) and a series of 1:2 dilutions of the test compounds starting at 64 ug/mL to 0.03 ug/mL. The plates were incubated 24 hrs at 37 °C and visually inspected for growth inhibition. For anti-yeast assays, S. cerevisiae BY4741 and C. albicans ATCC 36082 were used. The anti-yeast assays followed the broth microdilution method recommended by the Clinical and Laboratory Standards Institute. The 96-well plates were incubated 48 hrs at 30 °C for S. cerevisiae and at 37 °C for C. albicans.
Immunosuppressive assays Spleen cells (5×10
5 cells/well) isolated from C57BL/6 mice (The Jackson
Laboratory, Bar Harbor, Maine) were cultured in 96-well round-bottom plates supplemented with 10% FBS, 0.1 µM 2-ME, 100 IU/mL penicillin, 100 µg/mL streptomycin. Plates were incubated with anti-CD3 (Clone 145-2C11, 2 µg/mL, Biolegend, San Diego, CA) and anti-CD28 (Clone E18, 2 µg/mL, Biolegend) antibodies for 2 hrs at 37 °C and washed with PBS before seeded with the spleen cells. Various compounds were dissolved in 1 mg/mL DMSO, further diluted in culture medium (1, 2, 4, 7, 8, 10 µM; 3, 0.5 µM-50 µM; CsA, 10 µM; Emodin, 10 µM), and added to wells before cells were plated. After 48 hr of culturing, 50 µL media were taken out from each well for the measurement of IL-2 production by ELISA. Fresh medium containing [
3H]-thymidine (1 µCi/well; Perkin Elmer Life Science, Waltham, MA) were
added and [3H]-thymidine incorporation was measured 12 hr later using a Wallac Microbeta Trilux
scintillation counter (Perkin Elmer Life Science). For the analysis of IL-2 production, supernatant from the 48 hr culture were assayed for IL-2 by ELISA according to manufacturer’s protocol from BD Biosciences (San Jose, CA).
51
Cr damage assays. The capacity of damage to the human pulmonary epithelial A549 cells and mouse leukaemic monocyte macrophage RAW cells caused by compound 3 and the A. fumigatus T1 nsc pathway overexpressing strain was determined with a
51Cr release assay as described previously.
7 The
A549 type II pneumocyte cell line was obtained from the American Type Culture Collection and grown in F-12K medium containing 10% fetal bovine serum (Gemini Bio-Products), penicillin, and streptomycin. The mouse leukaemic monocyte macrophage RAW 264.7 cell line from ATCC was grown in Gibco DMEM supplemented with 10% FBS, 100 ug/mL vancomycin and streptomycin. Briefly, A549 epithelial cells or RAW cells were grown to 95% confluence in 24-well tissue culture plates and loaded with
51Cr
overnight. The unincorporated 51
Cr was removed by HBSS rinsing, the epithelial cells were treated with 3 (at 0.01, 0.1, 1, 5 and 10 μM) or infected with 5×10
5 conidia per well. After infection by Aspergillus or
treated with 3, the cells were grown in F-12K medium without fatal bovine serum. After 24 hour of incubation the extent of cell damage caused by each strain or treatment was determined in duplicate and repeated three times independently.

S4
Supplementary Tables
Table S1: List of primers used in this study.
Primer Name Sequence (5’ to 3’) Remarks
LIC-BHI GATCactcgtcgtgtcgcccgggcgacgacgacgt LIC adapter for pBARGPE-LIC
LIC-XI TCGAacgtcgtcgtcgcccgggcgacacgacgagt LIC adapter for pBARGPE-LIC
LIC-NfReg-F ctcgtcgtgtcgcccATGgagaaaagtaatcggcggaa For cloning of pGP-Nf112260 (Nf-nscR)
LIC-NfReg-R cgtcgtcgtcgcccaCTAaggaagaagcttgttcgact For cloning of pGP-Nf112260 (Nf-nscR)
LIC-AfReg-F ctcgtcgtgtcgcccATGgagaaaagtaatcggcgga For cloning of pGP-Af0130 (Af-nscR)
LIC-AfReg-R cgtcgtcgtcgcccaCTAaggaagaagctggttcgac For cloning of pGP-Af0130 (Af-nscR)
NotI-PgpdA-F attGCGGCCGCatgcggagagacggacggt Subcloning Afu7G00130 to p402
NotI-TtrpC-R ttaGCGGCCGCatgcattgcagatgagctgt Subcloning Afu7G00130 to p402
PgpdA-F ttcctgctctccccaccagct For screening fungal transformants for
integration of NFIA_112260 and
Afu7G00130 (along with reverse nscR
primer)

S5
Table S2: Protein sequence identity comparison between orthologous genes.
Organism Non-reducing
Polyketide Synthase
(NRPKS)
metallo β-
lactamase-type
thioesterase
(MβL-TE)
Flavin-dependent
monooxygenase
(FMO)
Naphthacenedione
prenyltransferase
(pcPT)
Zn(II)2Cys6
transcription factor
N. fischeri NFIA_112240(NscA)
(100)
NFIA_112270(NscB)
(100)
NFIA_112250
(NscC) (100)
NFIA_112230 (NscD)
(100)
NFIA_112260 (NscR)
(31/100)
A. fumigatus* Afu7G00160(NscA)
(96)
Afu7G00120(NscB)
(NscB)(95)
Afu7G00150
(NscC) (94)
Afu7G00170 (NscD)
(96)
Afu7G00130(NscR) (31)
M. canis MCYG_03598 (80) MCYG_03601 (54) MCYG_03600 (59) [Mc]MCYG_03599 (44) MCYG_03602 (30)
M. gypseum MGYG_06588 (77) MGYG_06591 (57) MGYG_06590 (57) [Ag]MGYG_06589 (44) MGYG_06592 (30)
T. tonsurans TESG_06702 (77) TESG_06705 (54) TESG_06704 (56) [Tt]TESG_06703 (43) TESG_06706 (30)
T. equinum TEQG_05346 (76) TEQG_05349 (54) TEQG_05348 (27) [Te]TEQG_05347 (43) TEQG_05350 (30)
T. rubrum TERG_08357 (77) TERG_08360 (55) TERG_08359 (57) [Tr]TERG_08358 (43) TERG_08361 (30)
A. benhamiae ARB_00538 (77) ARB_00535 (55/66) ARB_00536 (56) [Ab]ARB_00537 (44) ARB_00534 (30)
T. verrucosom TRV_00386 (76) TRV_00389 (47/66) TRV_00388 (56) [Tv]TRV_00387 (43) TRV_00390 (30)
A. niger AdaA/An11g07310 (66) AdaB/An11g07320
(58)
AdaC/An11g07330
(60)
- AdaR/An11g07350 (32)
A. nidulans AptA/ANIA_6000.2
(66)
AptA/ANIA_6001.2
(59)
Aptc/ANIA_6002.2
(52)
- -
The numbers in parentheses indicate percentage protein sequence identity.
*All the clustered homologous genes cluster in A. fumigatus are highly conserved (>85% protein identities) and syntenic with the N. fischeri nsc pathway; therefore, it is
likely that both pathways produced identical compounds.
** TEQG_05348 coding region is shorter than other FMO homologs, maybe truncated or misannotated.

S6
Table S3: NMR data of 3 in DMSO-d6 (measured on 500 MHz Bruker NMR spectrometer)
3
C26H28O9
NO. 13
C δ(ppm)
a/b*
1H δ(ppm) (m, JHH(Hz))
a/b* HMBC
1 197.1 2-H
2 77.5/77.0 5.73 (s) /5.87 (s) 4-H2, 11-H2, 3-OH
3 72.4/73.3 2-H, 4-H2, 11-H2, 3-OH
4 37.55 3.21 (1H, m),
3.30 (1H, m) 11-H2, 3-OH
4a 123.84 6-H, 16-H2
5 131.1 4-H2, 16-H2
5a 106.27 4-H2, 16-H2
6 99.63 6.64 (d, 1.6 )/6.66 (d, 1.6) 8-H,7-OH
7 161.6 6-H, 8-H, 7-OH
8 101.43 6.39 (1H, d, 1.6) 6-H, 7-OH, 9-OH
9 159.8 8-H, 9-OH
9a 106.3 6-H, 8-H, 9-OH
10 162.38 10-OH
10a 106.96/107.99 4-H2, 10-OH
11 46.3/50.6 2.71 (brs)/2.95 (m)
12 189.8/203.9 11-H2, 13-H 1a,2b
13 102.5/58.3 5.79 (s)/3.79 (s) 11-H2a, 15-H3a,
14 192.1/203.5 11-H2, 13-H1a,2b,15-H3
15 24.8/30.7 2.06 (s)/2.15 (s) (3H)
16 26.8 3.35 (1H, m)
3.37 (1H, m)
17 122 4.97 (1H, m) 16-H2, 19-H3, 20-H3
18 131.6 19-H3, 20-H3
19 18.6 1.81 (3H, s) 17-H, 19-H3
20 25.9 1.66 (3H, s) 17-H, 20-H3
21 169.6 2-H, 22-H3
22 20.45 2.22 (s)/2.20 (s) (3H)
3-OH 5.54 (s)/5.55 (s)
7-OH 10.3 (1H, s)
9-OH 9.88 (1H, s)
10-OH 15.0 (1H, s)
14-OH(a) 15.6 (1H, brs)
*The ratio of tautomer a to b observed in 1H-NMR is approximately 66:34
** The 1H signals cannot be assigned clearly to tautomer a or tautomer b but all correlate to C4 on HSQC.
S7
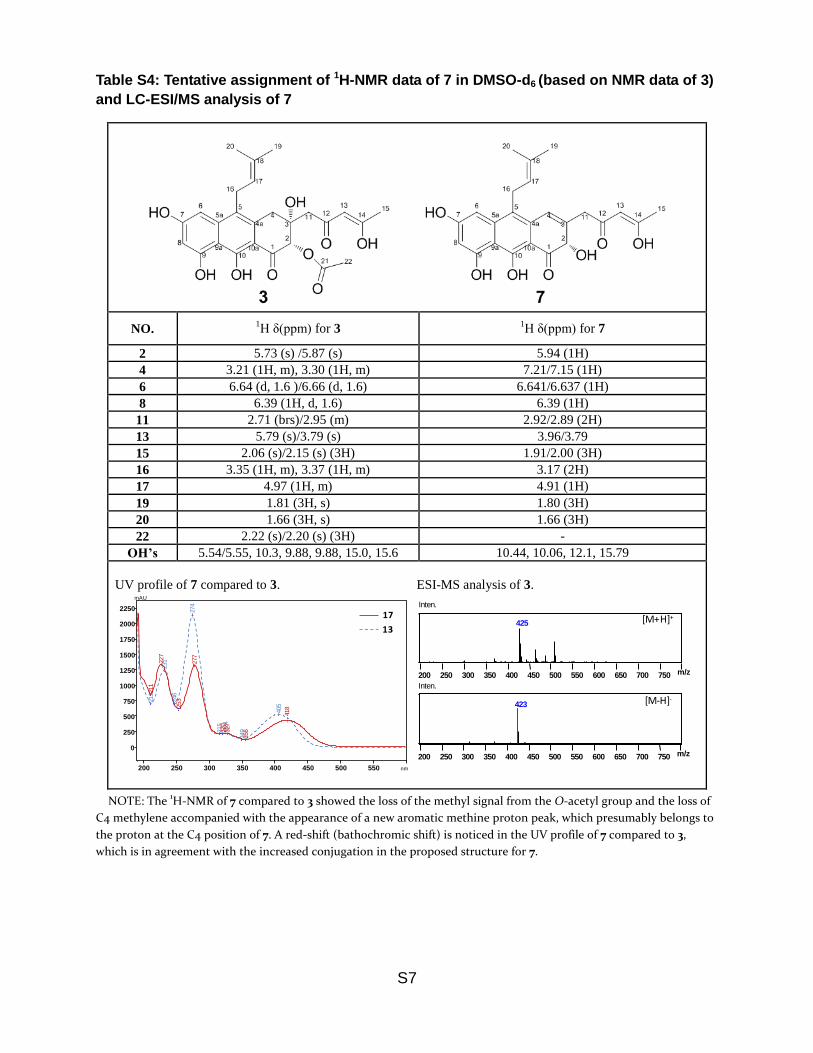
Table S4: Tentative assignment of 1H-NMR data of 7 in DMSO-d6 (based on NMR data of 3)
and LC-ESI/MS analysis of 7
NO. 1H δ(ppm) for 3
1H δ(ppm) for 7
2 5.73 (s) /5.87 (s) 5.94 (1H)
4 3.21 (1H, m), 3.30 (1H, m) 7.21/7.15 (1H)
6 6.64 (d, 1.6 )/6.66 (d, 1.6) 6.641/6.637 (1H)
8 6.39 (1H, d, 1.6) 6.39 (1H)
11 2.71 (brs)/2.95 (m) 2.92/2.89 (2H)
13 5.79 (s)/3.79 (s) 3.96/3.79
15 2.06 (s)/2.15 (s) (3H) 1.91/2.00 (3H)
16 3.35 (1H, m), 3.37 (1H, m) 3.17 (2H)
17 4.97 (1H, m) 4.91 (1H)
19 1.81 (3H, s) 1.80 (3H)
20 1.66 (3H, s) 1.66 (3H)
22 2.22 (s)/2.20 (s) (3H) -
OH’s 5.54/5.55, 10.3, 9.88, 9.88, 15.0, 15.6 10.44, 10.06, 12.1, 15.79
UV profile of 7 compared to 3. ESI-MS analysis of 3.
200 250 300 350 400 450 500 550 nm
0
250
500
750
1000
1250
1500
1750
2000
2250
mAU
246
211
315
349
274
231
405
324
211
253
320
356
227
277
418
327
17
13
200 250 300 350 400 450 500 550 600 650 700 750 m/z
Inten.
423
200 250 300 350 400 450 500 550 600 650 700 750 m/z
Inten.
425 [M+H]+
[M-H]-
NOTE: The 1H-NMR of 7 compared to 3 showed the loss of the methyl signal from the O-acetyl group and the loss of
C4 methylene accompanied with the appearance of a new aromatic methine proton peak, which presumably belongs to
the proton at the C4 position of 7. A red-shift (bathochromic shift) is noticed in the UV profile of 7 compared to 3,
which is in agreement with the increased conjugation in the proposed structure for 7.

S8
Supplementary Figures
A
B
Figure S1. Expression analysis of the nsc biosynthetic genes in N. fischeri WT and T2 (nscR overexpression strain) (A) Reverse transcriptase-PCR. The RNA was extracted from 2 days cultures of N. fischeri grown in YG medium. PCR products corresponding to ~700 bp of nscA-E was analysed by gene electrophoresis – lane 1, genomic DNA; lane 2, WT cDNA, lane 3, transformant T2 cDNA. (B) Comparison of the reverse side of N. fisheri WT and T2 grown on glucose minimal agar medium.
nscA nscB nscC nscD nscE
1 2 3 1 2 3 1 2 3 1 2 3 1 2 3

S9
Figure S2. LCMS analysis of N. fischeri overexpressing nscR. Extracted ion chromatogram [M+H]+ of the
corresponding compounds were shown. Compounds shown in blue box were also detected in S. cerevisiae BJ5464-NpgA co-expressing AdaA/AptA and AdaB/AptB, in the absence of AdaC/AptC (structures characterized by NMR).
8 Compounds in red dashed box were not detected at all in N. fischeri
T2 cultures sampled at different time points by selective ion monitoring.

S10
Figure S3. Comparative LC-MS analysis of A. fumigatus T1 nscR overexpression strain. The metabolic
profile of the culture extract of A. fumigatus T1 is almost identical to that of N. fischeri T2 with compound 3,
4, 8 as the major metabolites (selective ion monitoring by LCMS).

S11
Figure S4. In vitro prenyltransferase assays of NscD (Nf-pcPTase) with the anthracenone intermediates
in the nsc pathway. LCMS analysis of the NscD in vitro reactions with DMAPP and (A) compound 4 or (B)
compound 5. Extracted ion chromatogram (m/z [M+H]+) of the corresponding substrate and product are
shown. Both reactions are carried out in 50 mM Tris-HCl (pH 7.5), 0.5 mM DMAPP, 0.5 mM substrate (4
or 5) and 0.5 μM enzyme in a total volume of 50 μL. The reactions were quenched/extracted with 100 μL
of EtOAc/MeOH/AcOH (89:10:1) after one hour, vacuum dried and dissolved in MeOH for LC-MS analysis.
S12
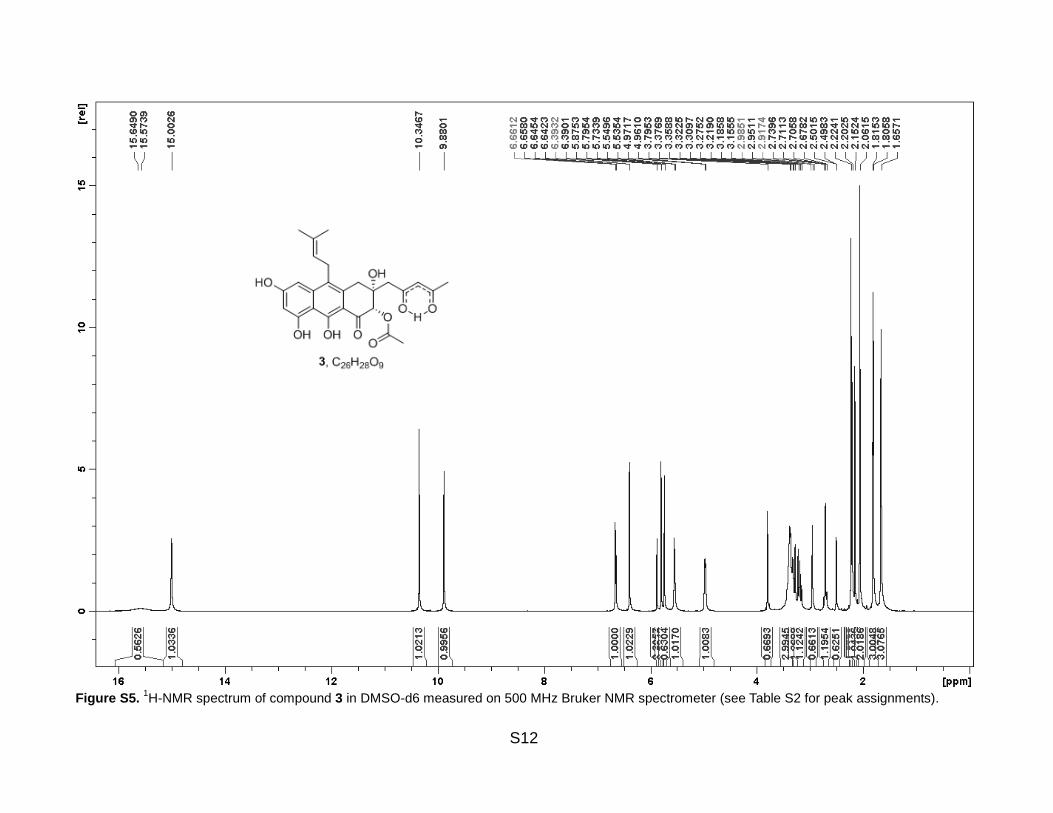
Figure S5. 1H-NMR spectrum of compound 3 in DMSO-d6 measured on 500 MHz Bruker NMR spectrometer (see Table S2 for peak assignments).

S13
Figure S6. 13
C-NMR spectrum of compound 3 in DMSO-d6 measured on 500 MHz Bruker NMR spectrometer (see Table S2 for peak assignments).

S14
Figure S7. 1H-
13C HSQC spectrum of compound 3 in DMSO-d6 measured on 500 MHz Bruker NMR spectrometer (see Table S2 for peak assignments).

S15
Figure S8. 1H-
13C HMBC spectrum of compound 3 in DMSO-d6 measured on 500 MHz Bruker NMR spectrometer (see Table S2 for peak assignments).

S16
0
20
40
60
80
100
120
0.01 0.1 1 10 100
Ce
ll V
iab
ility
(%
)
Concentration (uM)
Cell viability: 48 h HeLa cell treatment
Compound 1
Compound 2
Compound 3
Figure S9. Cytoxicity of 3 against HeLa and HFF (human foreskin fibroblast) cell lines were compared
with compound 1 and 2 (and cyclosporine A (CsA) for HFF cells). The cells (5000 cells per well) were
cultured in 96 well plates in DMEM medium with 10% bovine growth serum, 100 IU/mL penicillin and 100
µg/mL streptomycin. Compounds at various concentrations in DMSO were added in triplicates with each
well containing a final concentration of 0.5% DMSO. The cell viability was measured using MTS reagent
(Promega) following manufacturer’s protocol after 48 hours in 37 ˚C. The percentage cell viability values
are normalized with the control wells containing 0.5% DMSO.
S17
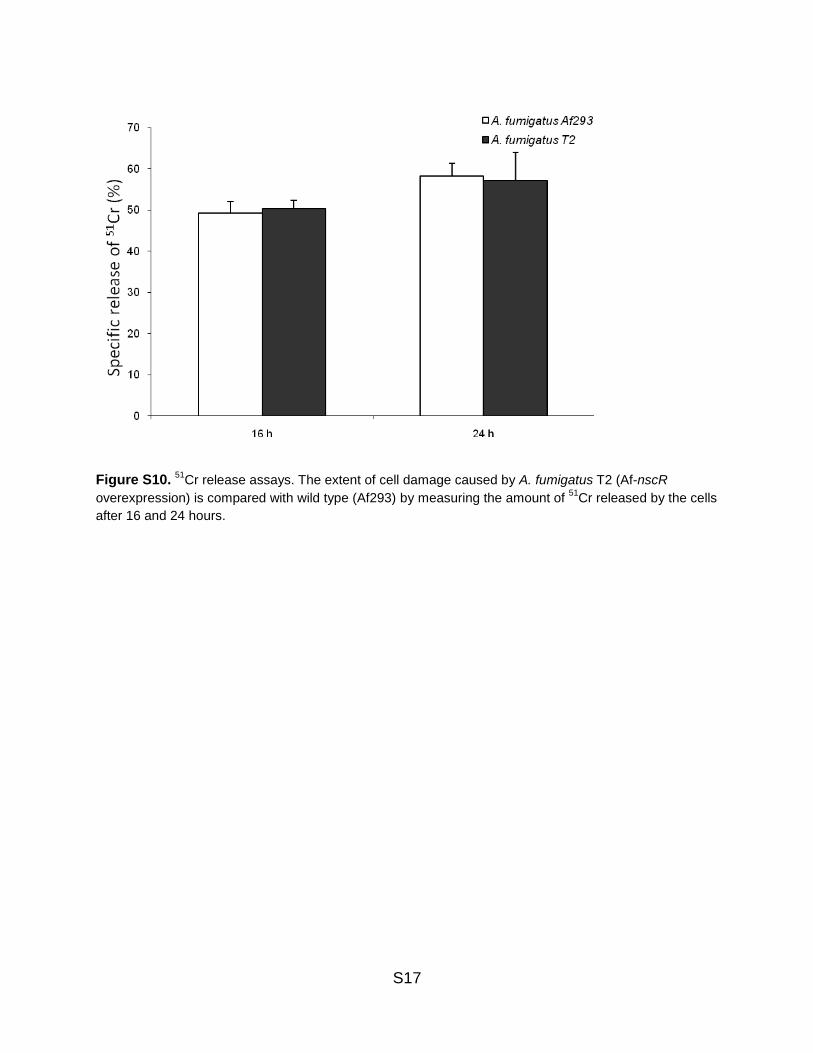
Figure S10. 51
Cr release assays. The extent of cell damage caused by A. fumigatus T2 (Af-nscR
overexpression) is compared with wild type (Af293) by measuring the amount of 51
Cr released by the cells
after 16 and 24 hours.

S18
Supplementary Discussion
The absence of tetracyclic naphthacenedione products but the production of decaketide-derived tricyclic anthracenone 3 in N. fischeri T2 is surprising. The A. niger NRPKS AdaA and the associated MβL-TE AdaB and FMO AdaC have been shown to synthesize the 1 in a concerted manner.
8 The
hydroxylation of the carbon alpha to C1 (corresponds to position 12a in 1) by AdaC is important for the fourth ring (ring A) cyclization catalyzed by the AdaB.
8 In the absence of AdaC, AdaB will hydrolyse the
polyketide product followed by decarboxylation to form 4. Careful analysis of the LC/MS traces of the N. fischeri T2 extracts could identify the peak with m/z value corresponded to non-prenylated intermediate 4 but not the non-prenylated intermediates with hydroxyl group or oxygen substitution at C2 (Scheme 2 and Figure S2). Peaks corresponded to m/z values of intermediates with hydroxyl or O-acetyl at C2 are all prenylated (Figure S2). This suggests that the FMO in nsc pathway (NscC) may catalyze the hydroxylation post-PKS release and post-prenylation, which is in contrast to AdaC/AptC where the hydroxylation takes place while the nascent polyketide intermediate is still tethered on the ACP.
8 This
possible difference in the timing of hydroxylation could explain the failure of NscB in performing the fourth ring cyclization but catalyzes the hydrolytic release of the polyketide product to afford 4. Further characterization of the nsc pathway enzymes to understand the divergence of nsc and ada pathway is warranted. It is worth noting that the core polyketide backbone of 3 and the non-prenylated intermediate 4 is structurally similar to the aglycon of the auroleolic acid family of antibiotics, which include the anti-cancer drug mithramycins from Streptomyces bacteria.
9 Like 3, mithramycin and other aureolic acid
analogs is derived from a decaketide chain. In the mithramycin pathway, the A-ring of the tetracyclic premithramycinone intermediate is cleaved open via a Baeyer-Villiger oxidation to form the tricyclic mithramycin aglycon.
10 Although formation of 4 via a similar Baeyer-Villiger cleavage of the A-ring on 1 (at
1,2 bond or 12a,1 bond) followed by decarboxylation and alcohol reduction cannot completely ruled in this present study, it is likely that the “A-ring” for 3 simply never cyclized in the nsc pathway. The structural similarity between 3 and aureolic acid family of compounds, suggest that perhaps the prenyltransferase NscD can be utilized to generate new prenylated aureolic acid analogs that may have altered target specificities and pharmacological properties.
Supplementary References
(1) Aslanidis, C.; de Jong, P. J. Nucleic Acids Res. 1990, 18, 6069. (2) Richie, D. L.; Miley, M. D.; Bhabhra, R.; Robson, G. D.; Rhodes, J. C.; Askew, D. S. Mol. Microbiol. 2007, 63, 591. (3) Chooi, Y. H.; Cacho, R.; Tang, Y. Chem. Biol. 2010, 17, 483. (4) Bhabhra, R.; Miley, M. D.; Mylonakis, E.; Boettner, D.; Fortwendel, J.; Panepinto, J. C.; Postow, M.; Rhodes, J. C.; Askew, D. S. Infect. Immun. 2004, 72, 4731. (5) Saint version 7.68; Bruker AXS Inc.: Madison, WI (USA), 2009. (6) Sheldrick, G. M. Shelxtl version 6.14; Bruker AXS Inc.: Madison, WI (USA), 2000. (7) Ejzykowicz, D. E.; Cunha, M. M.; Rozental, S.; Solis, N. V.; Gravelat, F. N.; Sheppard, D. C.; Filler, S. G. Mol. Microbiol. 2009, 72, 155. (8) Li, Y.; Chooi, Y.-H.; Sheng, Y.; Valentine, J. S.; Tang, Y. J. Am. Chem. Soc. 2011, 133, 15773. (9) Blanco, G.; Fu, H.; Mendez, C.; Khosla, C.; Salas, J. A. Chem. Biol. 1996, 3, 193. (10) Gibson, M.; Mohammad Nur-e-alam; Lipata, F.; Oliveira, M. A.; Rohr, J. J. Am. Chem. Soc. 2005, 127, 17594.


![Helminthostachys zeylanica alleviates hepatic steatosis and ......contains prenylated flavonoids and quercetin, which have inhibitory effects on human neutrophils [10]. In addition,](https://img.dokumen.tips/doc/110x75/60ae3b62b3e68071674504c3/helminthostachys-zeylanica-alleviates-hepatic-steatosis-and-contains-prenylated.jpg)


![Taichunamides: Unprecedented Prenylated Indole Alkaloids from … · A (13) into (+)-Versicolamide B (14), but not for (−)-13. The characteristic and unique bicyclo[2.2.2]diazaoctane](https://img.dokumen.tips/doc/110x75/6138853a0ad5d20676494db9/taichunamides-unprecedented-prenylated-indole-alkaloids-from-a-13-into-versicolamide.jpg)