Embed Size (px)
DESCRIPTION
Genome Alignment. Alignment Methods. Needleman-Wunsch (global) and Smith-Waterman (local) use dynamic programming Guaranteed to find an optimal alignment given a particular scoring function Too computationally intensive for genome alignment, especially multiple genomes. Genome Alignment. - PowerPoint PPT Presentation
Citation preview

Genome Alignment

Alignment Methods
• Needleman-Wunsch (global) and Smith-Waterman (local) use dynamic programming
• Guaranteed to find an optimal alignment given a particular scoring function
• Too computationally intensive for genome alignment, especially multiple genomes

Genome Alignment
• Depending on level of similarity, genome alignments may need to contend with rearrangements and large-scale duplications and deletions
• Draft or partial genomes can both benefit from and confound alignment
• Need to visualize results in summary form

Genome Alignment• Pair-wise
– Align two genomes– Example: MUMmer
• Multiple or complex samples and a reference genome– All of one genome plus whatever parts match from the other
genome(s)– Example: PIPs
• Multiple alignment– All of all the genomes– Example: Mauve
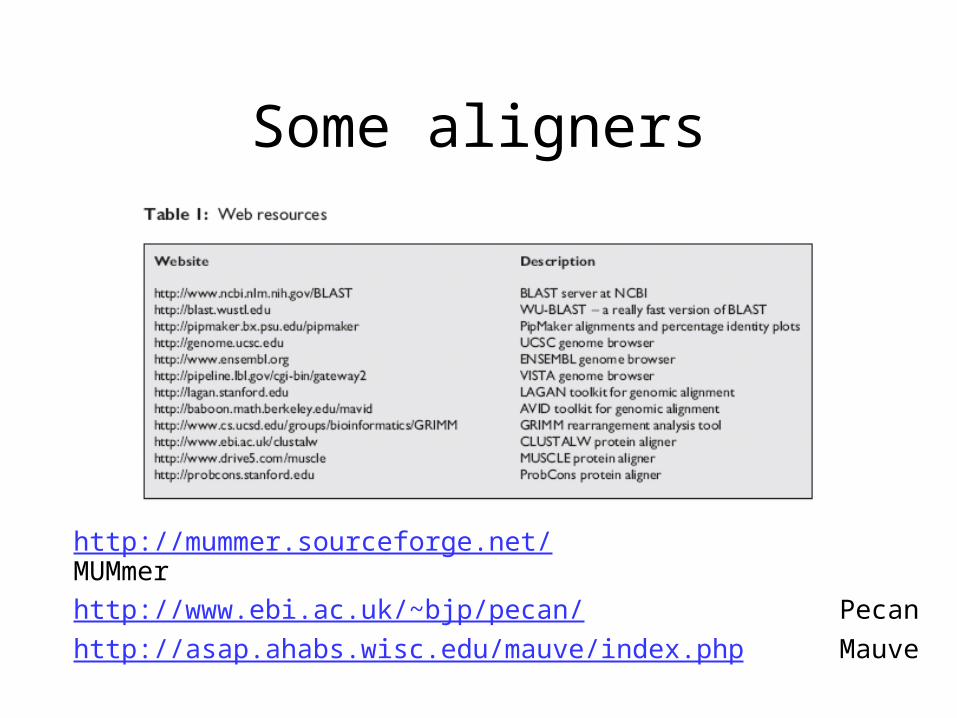
Some aligners
http://mummer.sourceforge.net/ MUMmerhttp://www.ebi.ac.uk/~bjp/pecan/ Pecanhttp://asap.ahabs.wisc.edu/mauve/index.php Mauve

MUMmer (Maximal Unique Match)http://mummer.sourceforge.net/
• Fast pair-wise comparison of draft or complete genomes using nucleotide or 6-frame translated sequences
• MUMmer 3.0 can find all 20-basepair or longer exact matches between a pair of 5-megabase genomes in 13.7 seconds, using 78 MB of memory, on a 2.4 GHz Linux desktop computer

Suffix Tree
Delcher et al. Fast algorithms for large-scale genome alignment and comparison. Nucleic Acids Res. 2002 Jun 1;30(11):2478-83.

MUMMER plot
Genome 1
Ge
nom
e 2

5 Campylobacter PROmer analysisFouts et al. Major structural differences and novel potential virulence mechanisms from the genomes of multiple campylobacter species. PLoS Biol. 2005 Jan;3(1):e15.
• One genome is used as the x-axis for all four pair-wise comparisons
• X-shape characteristic of collinearity interrupted by inversions around the origin or terminus of replication
• Loss of collinearity in more distant comparisons

Human Gut metagenome
Percent Identity Plot (PIP) of random shotgun reads to a complete Bifidobacterium genome and a good quality draft Methanobrevibacter genome
Gill et al. Metagenomic analysis of the human distal gut microbiome. Science. 2006 Jun 2; 312(5778): 1355-9.

Mauve Multiple Genome Aligner
• Able to identify and align collinear regions of multiple genomes even in the presence of rearrangements
• Find and extend seed matches
• Group into locally collinear blocks
• Align intervening regions
Darling et al. Genome Res. 2004 Jul;14(7):1394-403.

Progressive Mauve alignment of 12 E. coli genome
Aaron Darling
2006 Ph.D. thesis, http://gel.ahabs.wisc.edu/~darling/darling_thesis.pdf

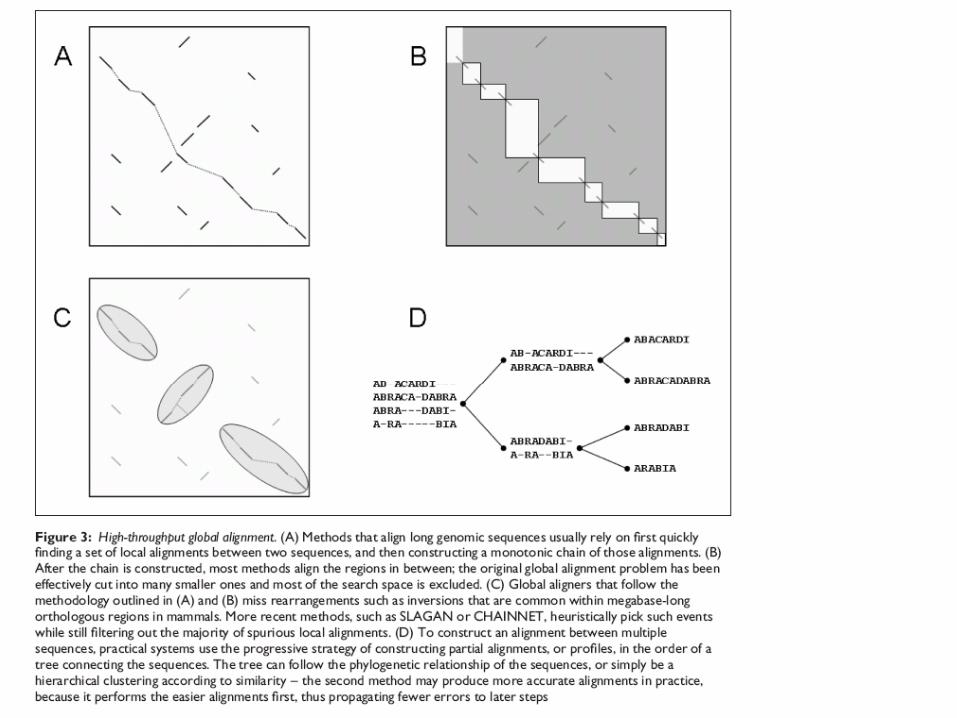
Figure 1. The difference between positional homology alignment and glocal alignment. Three example linear genomes are broken into genes labeled A,B,C,D, and R. R is a multi-copy (repetitive) gene, with different copies labeled using numeric subscripts. Each copy of R is assumed to be identical in sequence, so that orthology/paralogy is unknowable from nucleotide substitution (as is often the case with mobile DNA repeat elements). Genes shifted downward in a given genome are inverted (reverse complement) relative to the reference genome. The positional homology alignment would ideally create two local alignment blocks where each block has exactly one alignment row for each genome. Only positionally-conserved copies of the repetitive gene family R become aligned to each other. The glocal alignment would ideally create four local alignment blocks wherein all copies of the repetitive gene family become aligned to each other.

Progressive Genome Alignment similar to CLUSTAL (next week)
with integrated synteny mapping and positional homology
and anchored alignment


Performance Metrics
actual \ predicted
negative positive
NegativeTN FP
PositiveFN TP
Accuracy – Proportion correct
TN+TP/total
TPR (Recall) – Proportion of predicted positives that are correct
TP/FP+TP
Sensitivity – Proportion of positives correctly predicted
TP/FN+TP
Specificity – Proportion of negatives correctly predicted
TN/TN+FP

Sensitivity
Positive Predictive Value (PPV)
For nucleotide pairs, a TP is a pair aligned in both the calculated and correct alignments. A FP is a nucleotide pair in the calculated alignment that is absent from the correct alignment. Likewise, a FN is a pair in the correct alignment not present in the calculated alignment.
We do not quantify True Negative (TN) alignments as the number of TN possibilities is extremely large, growing with the product of sequence lengths.


ENCODE project
• Goal = to identify all functional elements in the human genome
• Margulies et al. 2007 reports results of the pilot project to analyze 1% of the genome using genome alignment to detect which regions of the sequence are evolutionarily constrained.

• 4 aligners– MAVID– MLAGAN– TBA– PECAN
• 23 mammalian species
• 30 Mb; 44 regions
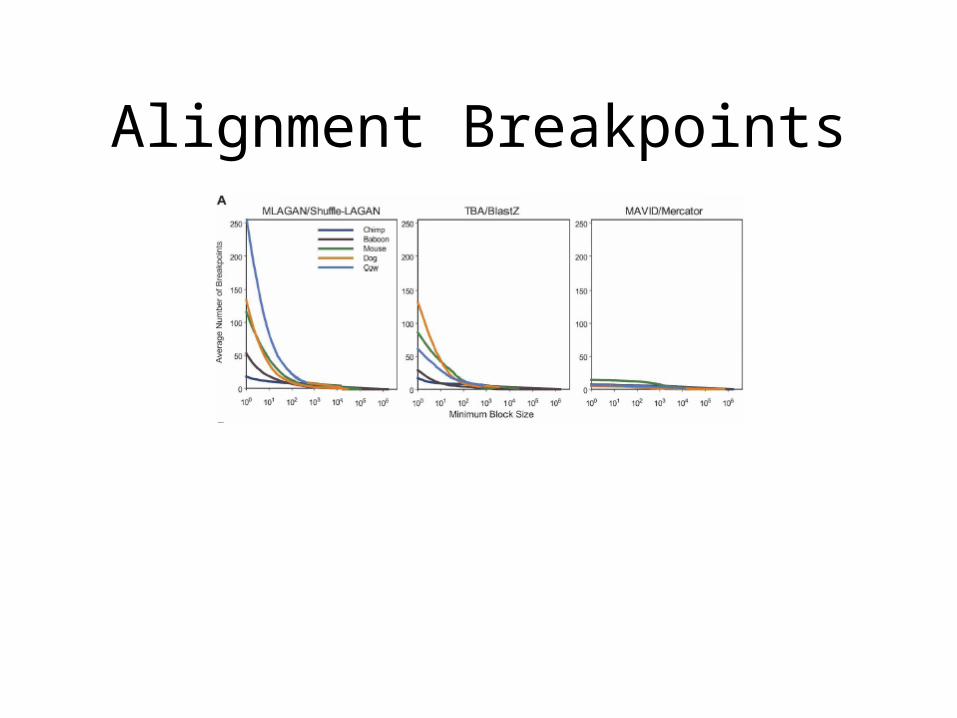
Alignment Breakpoints

Alignment Coverage
• For example, vs. armadillo:• MAVID 27.4%• MLAGAN 42.4%• TBA 41.2%• PECAN 40.1%
• 17.4% covered by all 4 aligners• Of which 66.1% are aligned identically

Performance Metrics
• Sensitivity –• coverage of protein coding regions and
ancestral repeats
• Specificity – • primate specific repeats (Alu) and periodicity
of substitutions in protein coding regions