Embed Size (px)
Citation preview

J Sci Food Agric 1994,65, 125- 132
Genetic Imdications of Kernel NIR Hardness A
on Milling and Flour Quality in Bread Wheat Brett F Carver Department of Agronomy, Oklahoma State University, Stillwater, Oklahoma 74078, USA
(Received 10 May 1993; revised version received 29 November 1993; accepted 24 December 1993)
Abstract: While quantitative measurements of wheat (Triticum aestivum L) kernel hardness are important for market classification of cultivars, their genetic relationship to end-use quality in breeding populations is not well established. After verifying that divergent selection for hardness score (HS) based on near- infrared reflectance (NIR) spectroscopy was effective, the objective was to deter- mine correlated selection responses in milling and flour quality of two hard red winter populations differing widely in parental origin. Selection was applied in the F , generation using replicated field plots at two locations. Selection response was evaluated in the F , generation at the same locations the following year. Selection for high HS (harder kernels) increased kernel protein concentration in both populations, while low HS selection decreased it. Selection for HS had no consistent and detectable impact on flour yield or physical dough properties (mixograph absorption, mixing time, and mixograph rating or tolerance). Selec- tion for high HS decreased SDS sedimentation volume adjusted for flour protein concentration in both populations, but the magnitude of the response was small ( - 1.7 ml in actual units; -0.3 ml after adjustment). Because correlative effects of NIR hardness were primarily expressed in protein quantity and not protein quality, milling and flour quality must be considered independently of NIR hard- ness if genetic improvement in those traits is desired.
Key words: wheat, hardness, selection, milling quality, breadmaking quality, NIR.
INTRODUCTION Justification for the determination of kernel hardness is predicated on its relationship to end-use quality.
Kernel hardness may be defined as the resistance to Starch granules of harder wheat kernels suffer more fracture upon grinding, crushing, slicing, abrasion, or damage from milling and, thus, form a granular flour indentation of single kernels or bulk samples (Anjum more suitable for breadmaking. Wheat cultivars with and Walker 1991). Among the various methods of mea- harder kernel texture possess higher milling or bread- surement, near-infrared reflectance (NIR) spectroscopy making quality, although exceptions of ‘soft’ wheat cul- has been widely used in wheat breeding programs since tivars with acceptable quality occur (Yamazaki and improved methods were approved by the American Donelson 1983; Downey et a1 1986; Laughland and Association of Cereal Chemists (AACC 1983), and vali- Wilson 1987). dated by Norris et a1 (1989). Measurement of NIR Cultivar comparisons do not necessarily establish a hardness is especially convenient because the instru- casual relationship between hardness and end-use mentation is already in place in many breeding pro- quality, but may reflect simultaneous selection pressures grams for measuring moisture and protein content. The in cultivar development. Symes (1969) used near- consensus among breeders is that NIR spectroscopy is isogenic lines to demonstrate a casual relationship suitable for evaluating kernel hardness of bulk samples between increased hardness (lower particle size index) in early segregating generations. Its value in commercial and improved flour yield, loaf texture, and dough hand- classification is limited because it is not amenable to ling score. Loaf volume, however, was reduced in the detecting mixtures of hard and soft kernels. hard wheat near-isolines compared to the soft near-
J Sci Food Agric 0022-5142/94/$09.00 0 1994 SCI. Printed in Great Britain 125

126 B F Carver
isolines. Baker and Dyck (1975) classified segregating single-cross progeny into soft and hard classes based on particle size index, and found increases in flour yield, farinograph absorption, and loaf volume in the hard lines, but no change in sedimentation volume or mixing time. In both studies, the two hardness classes were pri- marily differentiated by a major gene controlling hard- ness, and possibly modifying genes with minor effects. While major genes may account for inter-class variation in hardness, genetic variability in typical intra-class breeding populations is probably controlled by genes with smaller effects.
This study was designed for application to hardness selection within a specific hardness class. Selection was applied at various selection intensities for low and high NIR hardness in two hard red winter (HRW) wheat populations. After verifying that selection was effective for hardness, the objective was to determine the corre- lated responses in milling quality (as determined by flour yield) and functional dough properties. Although high NIR hardness has practical value in HRW wheat improvement, selection responses were assessed in both directions to monitor chance associations. Hence, a genetic association between hardness and quality parameters was evidenced not only by a significant dif- ference between means of the selected progeny and the entire population, but also a divergence in responses between the low- and high-hardness selections.
EXPERIMENTAL
Field experiments
Experiments were conducted during the 1989-1990 and 1990-1991 growing seasons in HRW wheatland areas of the southern Great Plains near Stillwater and Lahoma (OK, USA). Population I had a wide genetic base and was derived from > lo0 elite experimental lines and cultivars from HRW breeding programs. These parents were intermated several generations with the aid of a chemical hybridizing agent. Population I1 had a relatively narrow genetic base and was derived from a single cross of two common HRW cultivars (Chisholm x Vona). Approximately 170 So (population I) or 170 F , (population 11) plants were randomly har- vested. To simplify notation hereafter, filial generation will be used in place of selfing generation, whereby the So generation of population I is comparable to the F , generation of population 11.
For each population, 141 randomly chosen F , lines were evaluated in a replicates-in-sets design, comprised of three sets with two replicates per set. Each set of 47 lines was placed contiguously in the field; genotypic composition of the sets was conserved across locations. Each set contained two check cultivars, Chisholm and 2180. An experimental unit consisted of a single row
1.2 m long by 0.3 m wide, with a single border row of cv TAM 105 between each plot. Plots were sown in early October at a rate of 240 seeds m-’. The plots were fertilized according to soil-test recommendations for a grain yield goal of 3360 kg ha-’. An interior 0.6 m section of each single-row plot was harvested at ground level with a hand-sickle and threshed with a sta- tionary thresher. Based on kernel hardness scores described below, the seven highest and seven lowest lines within each set of 47 lines were identified by averaging across locations (15% of the population, either direction). Likewise, the three highest and three lowest lines within each set were identified (6% of the population). The different levels of truncation (6% versus 15%) will be referred to as ‘selection intensities’, where a lower value represents higher selection inten- sity. Lines selected in opposite directions constitute ‘selection groups’.
All lines (selected and unselected), including the two check cultivars, were evaluated the following year in the F , generation using seed harvested from plots the pre- vious year. The same experimental design was used at the same two locations as before, except that plot size was increased to allow quality analysis of seed samples. An experimental unit was 4.3 m long by 0.6 m wide and consisted of two unbordered rows. Plots were sown and managed as described above. At harvest maturity, an interior 3.0 m section of each row was machine- harvested at ground level and threshed with a station- ary thresher.
Quality analysis
Kernel hardness, protein, and moisture values were determined in the F , generation by NIR spectroscopy, using a Technicon InfraAlyzer, Model 400 (Tarrytown, NY, USA). Whole wheat samples (9 g) were cleaned and allowed to equilibrate under room conditions for 1 week. The samples were ground on a Udy Cyclone Sample Mill (1 mm screen) with a Udy Sample Mill Feed Controller (Fort Collins, CO, USA), after the mill warmed for 1 hr. Calibration for protein and moisture was achieved by Kjeldahl N determination and air-oven moisture assays of every twentieth sample. Kernel protein concentration was adjusted to a moisture basis of 140 g kg-’. Calibration for hardness was based on a standard set of 10 wheat samples from soft and hard red market classes. Reflectance data were collected at two wavelengths (1680 and 2230 nm), and logarithmically transformed with slope/bias adjustment based on the standard samples according to method 39-70 (AACC 1983). Final hardness scores (HS) were reported on an index of 0 (extremely soft) to 100 (extremely hard).
In the F , generation, kernel protein content and HS were measured as described above on samples from all plots. Milling and flour quality were evaluated on a
Milling and flour quality of wheat hardness selections 127
125 g sample from each plot of the hardness selections and of the check cultivars. This reduced the number of samples for detailed quality evaluation to a more man- ageable number. The overall quality of each population (control treatment) was determined by combining grain (10 g) from all plots, excluding checks, for a given repli- cate in each set. From each of these replicated compos- ites, milling and flour quality was determined in a 125 g sample. The samples were cleaned and tempered to a moisture basis of 155 g kg-', and milled on a Braben- der Quadramat senior mill (C W Brabender Instru- ments, South Hackensack, NJ, USA). Flour yield was determined as the combined weight of three flour streams (140 g kg-' moisture basis) per kg tempered wheat. Protein concentration in the flour was deter- mined by NIR analysis as described above, and also adjusted to a moisture basis of 140 g kg-'.
Mixograph characteristics were determined with a National Manufacturing Co mixograph (Lincoln, NE, USA), requiring approximately 10 g flour depending on moisture content (method 54-40, AACC 1983). The amount of added water (absorption) varied slightly according to protein content of the flour. Mixing time equaled the number of minutes for peak development of the dough, ie where the mixograph curve showed minimum mobility. Mixing time was corrected for samples with flour protein < 120 g kg-'. Undesirably short or long mixing times were considered G3.0 or B 6.25 min, respectively. The mixograph curve was sub-
jectively rated as a measure of tolerance to overmixing, using a scale of 1 to 10: 6 2 , weak; 3-6, acceptable; 7-10, highly tolerant. Width of the curve after peak development and descending curve angle were both considered in this rating. Mixing tolerance was also measured as the actual width of the curve at 2 min past peak dough development. Potential loaf volume was measured by the sodium dodecyl sulphate (SDS) sedi- mentation test, as recommended by Lorenzo and Kron- stad (1987) to maximize separation of flours with contrasting loaf volumes. A 4.3 g flour sample was sus- pended in 100 ml solution containing 0.96 g lactate liter-' and 20 g SDS liter-', and the volume of the pre- cipitate was recorded after 30 min of settling. Because the degree of swelling can be affected by both the quality and quantity of protein in the flour sample, the results were also reported and the ratio of sedimenta- tion volume to actual protein percentage in the flour.
Data analysis
Data from populations I and I1 were analyzed separa- tely using Statistical Analysis System procedures (SAS 1985). The genotype X environment mean square (pooled across sets) provided an estimate of error variance for testing significance (ct = 0.05) of differences between means. Means of the two check cultivars were
compared by t-tests. Means of selection groups were compared to the population mean (HS and protein con- centration only) also using t-tests. Where the population mean was estimated by the control mean of composite samples (flour quality), the two selection group means at a given selection intensity were compared to the same population mean by Dunnet's two-sided test with an experiment-wise error rate of a = 0.05. Selection response for either the selected trait (HS) or quality traits is defined as the mean of selected progeny in the F, generation minus the mean of the corresponding F, population. The genetic correlation between kernel hardness and protein concentration was derived from multivariate analysis of variance across locations for all unselected and selected lines.
RESULTS AND DISCUSSION
Population I was more variable in HS than population I1 based on the ratio of genetic variances (data not shown). This population likely segregated for hardness genes not present in population 11, as indicated by the 20-unit difference in mean HS in the year of selection (Table 1, 1989-1990). Selection for more extreme HS values in 1989-1990 resulted in proportionately higher selection responses in 1990-1991 (Table 1). The response in HS differed between selection groups by 14 units at the 15% selection intensity averaged across populations, while the average difference was 19 units at the 6% intensity. Selection was equally effective for high or low HS, as selection responses were similar in each direction. These results show HS can be changed by selection and suggest with earlier studies that hardness is expressed as a quantitative trait (Trupp 1976; Lukow et a1 1989; Baker and Sutherland 1991).
A mean HS of 36 for population I1 in 1990-1991 may be considered low for HRW wheat, but Chisholm, a HRW cultivar with satisfactory breadmaking quality (Cox et a1 1989), had a HS score of about 27. The environmental influence on hardness, as shown by Laughland and Wilson (1987) and Peterson et a1 (1992), makes classification of genotypes as hard or soft diffi- cult based on hardness alone. Using NIR analysis, Glenn et a1 (1991) reported average hardness values of 21 and 66 for SRW and HRW cultivars, respectively. Rarely in these Oklahoma locations does HS exceed 25 for SRW cultivars (unpublished data). Selection for high HS in population I1 resulted in a more acceptable HS range for HRW wheat of 43-46; selection for lower HS resulted in progeny which could be considered soft, par- ticularly when selection was more intense. Selection for low or high HS in population I produced progeny with varying degrees of hardness expected for HRW wheat in Oklahoma. Therefore, these populations provided a desirable contrast to determine the implications of HS selection on milling and flour quality.

128 B F Carver
TABLE 1 Selection differentials for hardness score (HS) and selection responses for HS and kernel protein concentration in HRW popu-
lations I and I1
Selection criterion Selection H S selection differential Selection response (1990-1991) intensity (%) (1989-1990)
Protein concentration ( g kg - I )
I !I
H S
I I I I I I
High hardness" 6 + 13.5 + 14.4 +9.0** +9.6** + 3** + 4** 15 -11.1 - 10.7 + 6.9** + 7.0** + 2** + 2**
Population meanb - Low hardness" 15 - 13.7 - 10.1 -8.5** - 5.6** - 3** - 2**
72.8 52.6 49.2 36.4 130 118
6 - 29.6 - 12.7 - 12.2** - 6.9** - 5** -1
Check cultivars 2180 Chisholm
86.1 81.7 584 59.2 132 130 39.2 40.4 26.5** 27.5** 119** 115**
~ ~~
Mean of selected lines expressed as deviation from population mean. Mean of the entire population of 141 lines.
**** Difference between mean of selected lines and population mean, or difference between means of checks, significant at P = 0.05 and 0.01, respectively; statistical tests of selection differentials are not appropriate.
Selection for high HS increased kernel protein con- centration, while selection for low HS decreased it (Table 1). The change in protein increased with increased selection intensity (except for low HS selection in population 11). Thus, factors which controlled NIR hardness in these populations also controlled protein content. This was verified by positive genetic correlation coefficients in each population, ranging from 0.50 to 0.67 depending on population or year. Peterson et a1 (1992) reported a genetic correlation coefficient of 0.43 for flour protein versus hardness measured by micro-
scopic evaluation of crushed kernels of 18 HRW wheat lines. However, Trupp (1976) found no genetic relation- ship among 20 soft wheat cultivars. The increase in kernel protein concentration with high HS selection was commercially important in population 11, because the population mean was lower than the minimum desir- able level of 120 g kg-'.
Similar patterns were noted for flour protein concen- tration, but the selection responses were not statistically significant (Tables 2 and 3). The low HS selections of population I, with one exception, tended toward lower
TABLE 2 Milling and flour quality of two check cultivars and progeny in population I after divergent selection for kernel hardness
Selection criterion Selection Flour Flour Mixograph characteristics SDS sedimentation intensity (%) protein yield
(g kg-') ( g k g - ' ) Minutes Mixograph Mixing Actual Adjusted to peak rating tolerance (ml) (ml) (min) (1-10) (mm)
High hardness" 6 +1 -3 -0.19 +0.3 + 0.7 - 1.8* -0.3**
Controlb - 115 596 4.43 4.6 18.9 90.3 1.9 Low hardness" 15 -2 -11 - 0.23 + 0.3 - 0.3 -0.1 +0.1
6 -2 -8 - 0.40 +0.2 - 0.5 - 1.1 +0.1
15 +1 0 - 0.27 + 0.2 + 0.3 - 1.4 - 0.2*
Check cultivars 2180 (high HS) Chisholm (low HS)
117 581 4.66 4.1 18.0 89.4 7.1 109** 580 4.94 4.8* 18.8 92.3** 8.5**
Mean of selected lines expressed as deviation from control mean. Mean of the entire population based on replicated bulk samples.
*. ** Difference between mean of selected lines and control mean, or difference between means of checks, significant at P = 0.05 and 0.01, respectively.
Milling and flour quality of wheat hardness selections 129
I 0
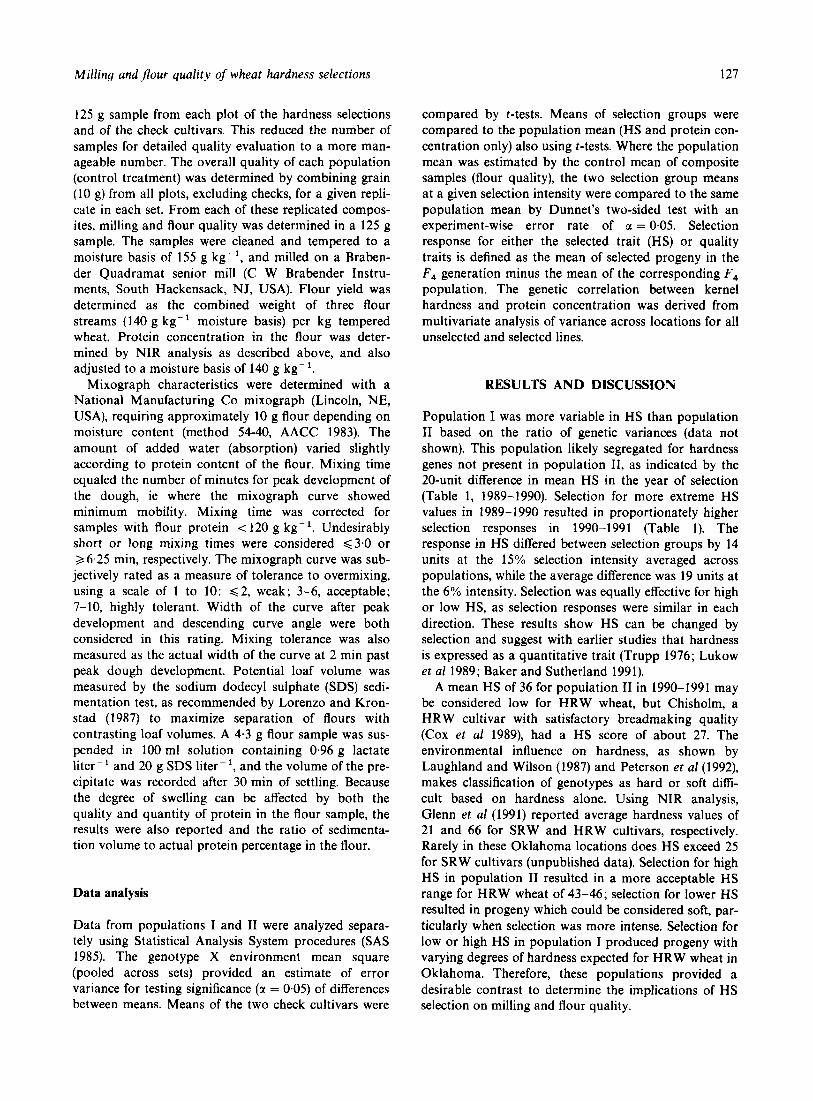
TABLE 3 Milling and flour quality of two check cultivars and progeny in population I1 after divergent selection for kernel hardness
11
~
Selection criterion Selection Flour Flour Mixograph characteristics SDS sedimentation intensity (%) protein yield
( g kg-') ( g kg-') Minutes Mixograph Mixing Actual Adjusted to peak rating tolerance (ml) (ml)
(min) (I-10) (mm)
High hardness" 6 + 2 -1 - 0.07 +0.1 + 0.5 - 1.6 -0.3** 15 +1 + 2 - 0.08 + 0.2 + 0.3 - 1.4 - 0.2* - Controlb 104 613 3.86 4.8 18.2 91.1 8.8
Low hardness" 15 - 1 - 7 +0.10 + 0.3 - 0.2 + 0.6 +0.1 6 0 - 1 1 +0.21 + 0.4 + 0.3 + 1.4 + 0.2
7-120. '9) Y 9)
a,
W 115. .-
CI
2
Check cultivars 2180 (high HS) Chisholm (low HS)
-
-
-
-
113 619 4.14 4.2 17.2 91.0 8.1 104** 619 4.95** 4.8* 17.8 92.5 8.9**
120
115
110
105
Mean of selected lines expressed as deviation from control mean. Mean of the entire population based on replicated bulk samples.
** ** Difference between mean of selected lines and control mean, or difference between means of checks, significant at P = 0.05 and 0.01, respectively.
flour protein values than the high HS selections (Fig 1). In population I1 where the range of flour protein was only one percentage unit, the selection groups showed no discernible difference in flour protein patterns. The check cultivar with lower HS (Chisholm) also had lower kernel and flour protein concentrations (Tables 2 and 3).
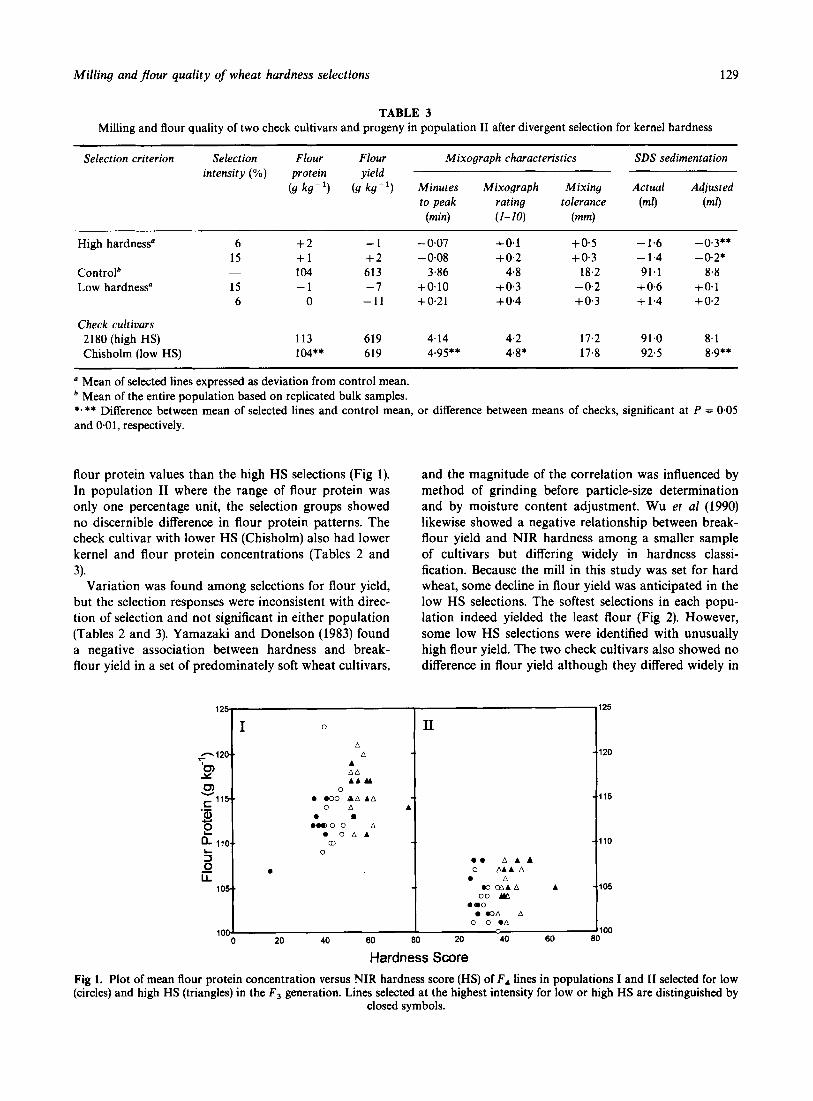
Variation was found among selections for flour yield, but the selection responses were inconsistent with direc- tion of selection and not significant in either population (Tables 2 and 3). Yamazaki and Donelson (1983) found a negative association between hardness and break- flour yield in a set of predominately soft wheat cultivars,
and the magnitude of the correlation was influenced by method of grinding before particle-size determination and by moisture content adjustment. Wu et a1 (1990) likewise showed a negative relationship between break- flour yield and NIR hardness among a smaller sample of cultivars but differing widely in hardness classi- fication. Because the mill in this study was set for hard wheat, some decline in flour yield was anticipated in the low HS selections. The softest selections in each popu- lation indeed yielded the least flour (Fig 2). However, some low HS selections were identified with unusually high flour yield. The two check cultivars also showed no difference in flour yield although they differed widely in
1051
0
A A
A A A A A A
0
O A 0 000 AA A A
0 a * W O O A
0 O A A a,
0
A
0 0 A A A 0 M I A
.O C A A A 0 A
00 m A
eao -A A
0 0 *A 100
0 20 40 60 80 20 40 60 80
Hardness Score
100
Fig 1. Plot of mean flour protein concentration versus NIR hardness score (HS) of F, lines in populations I and I1 selected for low (circles) and high HS (triangles) in the F , generation. Lines selected at the highest intensity for low or high HS are distinguished by
closed symbols.
130 B F Carver
Hardness Score Fig 2. Plot of mean flour yield versus NIR hardness score (HS) of F , lines in populations I and I1 selected for low (circles) and high
HS (triangles) in the F, generation. Lines selected at the highest intensity for low or high HS are distinguished by closed symbols.
HS. Therefore, it is difficult to conclude that selection for improved HS in HRW populations would consis- tently improve flour yield.
Physical dough properties of high and low HS selec- tions were assessed using four mixograph parameters : water absorption, mixing time, mixograph rating (a sub- jective score), and mixing tolerance. For decades these parameters have been used by HRW wheat breeders for early-generation selection of genotypes with desirable breadmaking potential. Genetic variation was lacking for water absorption (data not shown). Average absorp- tion was 0.65 ml g-' in population I and 0.64 ml g-' in population 11. In population I (Table 2), HS selection did not alter mixing time or mixograph rating. Responses to high or low HS showed the same sign and were nonsignificant. Means of all selection groups were considered medium for mixing time and acceptable for mixograph rating. Mixing tolerance tended to increase with higher HS and decrease with lower HS, but the responses were < 1 mm and nonsignificant. Correlated responses were also trivial in population I1 (Table 3). Hence, HS selection had no consistent and detectable impact on physical dough properties.
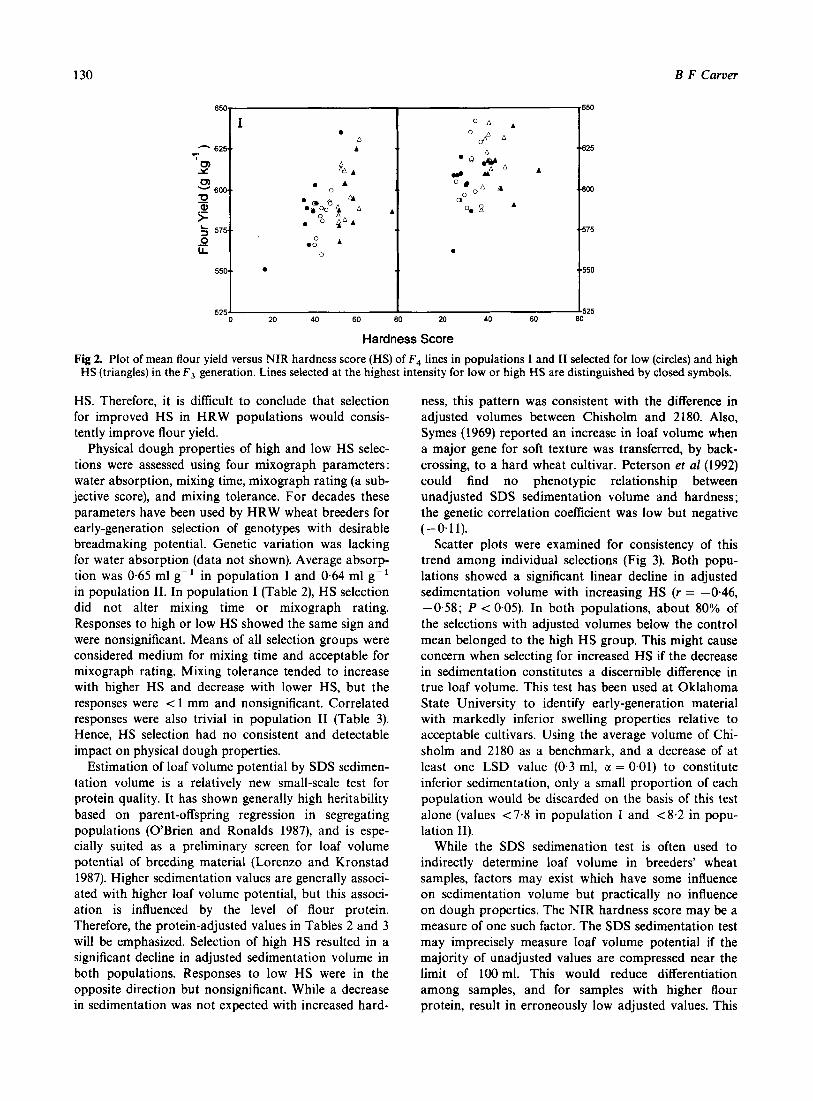
Estimation of loaf volume potential by SDS sedimen- tation volume is a relatively new small-scale test for protein quality. It has shown generally high heritability based on parent-offspring regression in segregating populations (O'Brien and Ronalds 1987), and is espe- cially suited as a preliminary screen for loaf volume potential of breeding material (Lorenzo and Kronstad 1987). Higher sedimentation values are generally associ- ated with higher loaf volume potential, but this associ- ation is influenced by the level of flour protein. Therefore, the protein-adjusted values in Tables 2 and 3 will be emphasized. Selection of high HS resulted in a significant decline in adjusted sedimentation volume in both populations. Responses to low HS were in the opposite direction but nonsignificant. While a decrease in sedimentation was not expected with increased hard-
ness, this pattern was consistent with the difference in adjusted volumes between Chisholm and 2 180. Also, Symes (1969) reported an increase in loaf volume when a major gene for soft texture was transferred, by back- crossing, to a hard wheat cultivar. Peterson et a1 (1992) could find no phenotypic relationship between unadjusted SDS sedimentation volume and hardness; the genetic correlation coefficient was low but negative (- 0.1 1).
Scatter plots were examined for consistency of this trend among individual selections (Fig 3). Both popu- lations showed a significant linear decline in adjusted sedimentation volume with increasing HS (r = -0.46, -0.58; P < 0.05). In both populations, about 80% of the selections with adjusted volumes below the control mean belonged to the high HS group. This might cause concern when selecting for increased HS if the decrease in sedimentation constitutes a discernible difference in true loaf volume. This test has been used at Oklahoma State University to identify early-generation material with markedly inferior swelling properties relative to acceptable cultivars. Using the average volume of Chi- sholm and 2180 as a benchmark, and a decrease of at least one LSD value (0.3 ml, a = 0.01) to constitute inferior sedimentation, only a small proportion of each population would be discarded on the basis of this test alone (values < 7.8 in population I and < 8.2 in popu- lation 11).
While the SDS sedimenation test is often used to indirectly determine loaf volume in breeders' wheat samples, factors may exist which have some influence on sedimentation volume but practically no influence on dough properties. The NIR hardness score may be a measure of one such factor. The SDS sedimentation test may imprecisely measure loaf volume potential if the majority of unadjusted values are compressed near the limit of 100 ml. This would reduce differentiation among samples, and for samples with higher flour protein, result in erroneously low adjusted values. This

Milling and pour quality of wheat hardness selections
= I E a, 9..
v
- 5
.- i!
B c 85.. 0
m C
.-
.#-I
c
U a, ? 75..
a 4
131
. 0. .a 0 . .9
em oo A r n m
.O mam
O O a A - 4 . 5 mo A A 0 A A
0 0 0 .. a A .00 A A - 4
& A 0 A A A . AA A
A 0 Y l A ..75
A
0 I = 0 * A
0 20 40 60 80 20 40 60 ao Hardness Score
Fig 3. Plot of mean SDS sedimentation volume (adjusted for flour protein percentage) versus NIR hardness score (HS) of F , lines in populations I and I1 selected for low (circles) and high HS (triangles) in the F , generation. Lines selected at the highest intensity
for low or high HS are distinguished by closed symbols.
did not, however, explain the lower sedimentation of high HS selections, because the majority of actual sedi- mentation volumes were less than 90 ml.
CONCLUSIONS
Selection based on NIR spectroscopy was effective in changing the degree of kernel hardness in each of two early-generation HRW wheat populations. Correlative effects of hardness selection were primarily expressed in protein quantity, not protein quality. Thematic to various hypotheses explaining kernel hardness is the interaction of starch granules with the surrounding protein matrix; more recent hypotheses account for integral and surface proteins of starch granules [as reviewed by Anjum and Walker (1991)l. The results suggest that selection for high (or low) NIR hardness increased (or decreased) the concentration of proteins functionally different from endosperm storage proteins which determine flour quality. Simmonds et a1 (1973) found no compositional differences between hard and soft near-isogenic lines in gliadin or gluten proteins at the starch-protein interface, while Huebner and Gaines (1992) found certain gliadin proteins associated with texture differences among individual kernels. Other researchers (Lowry et a1 1981 ; Greenwell and Schofield 1986) have since identified starch granule proteins which may uniquely control endosperm texture, although these proteins constitute a very small portion of total flour protein. Further research is needed to more precisely characterize the effect of NIR hardness selection on all protein components. However, the pro- spect for simultaneous improvement in milling or flour quality with NIR hardness selection does not look promising in HRW wheat. Direct selection pressure should be applied to those traits if genetic improvement is desired.
ACKNOWLEDGEMENTS
The technical assistance of Connie Shelton and Wayne Whitmore, and the financial support of the Oklahoma Wheat Research Foundation, are gratefully acknow- ledged. Suggestions provided by Don Abbott during preparation of the manuscript were especially helpful.
REFERENCES
AACC 1983 Approved Methods of the American Association of Cereal Chemists. AACC, St Paul, MN, USA.
Anjum F M, Walker C E 1991 Review on the significance of starch and protein to wheat kernel hardness. J Sci Food Agric 56 1-13.
Baker R J, Dyck P L 1975 Relation of several quality charac- teristics to hardness in two spring wheat crosses. Can J Plant Sci 55 625-627.
Baker R J, Sutherland K A 1991 Inheritance of kernel hard- ness in five spring wheat crosses. Can J Plant Sci 71 179- 181.
Cox T S, Shogren M D, Sears R G, Martin T J, Bolte L C 1989 Genetic improvement in milling and baking quality of hard red winter cultivars, 1919 to 1988. Crop Sci 29 626- 631.
Downey G, Byrne S, Dwyer E 1986 Wheat trading in the Republic of Ireland: The utility of a hardness index derived by near infrared reflectance spectroscopy. J Sci Food Agric 37 762-766.
Glenn G M, Younce F L, Pitts M J 1991 Fundamental physi- cal properties characterizing the hardness of wheat endo- sperm. J Cereal Sci 13 179-194.
Greenwell P, Schofield J D 1986 A starch granule protein associated with endosperm softness in wheat. Cereal Chem
Huebner F R, Gaines C S 1992 Relation between wheat kernel hardness, environment, and gliadin composition. Cereal Chem 69 148-151.
Laughland B J, Wilson A J 1987 The hardness of New Zealand wheat cultivars. N Z J Techno1 Res 3 129-132.
Lorenzo A, Kronstad W E 1987 Reliability of two laboratory techniques to predict bread wheat protein quality in nontra- ditional growing areas. Crop Sci 27 247-252.
63 379-380.
132 B F Carver
Lowry G D A, Sargeant J G, Schofield J D 1981 Wheat starch granule protein: 'the isolation and characterization of the salt-extractable protein from starch granules. J Sci Food Agric 32 371-377.
Lukow 0 M, McKenzie R I H, De Pauw R M 1989 Genetic implications of kernel hardness variation in Canada prairie spring wheats. Can J Plant Sci 69 667-674.
Norris K H, Hruschka W R, Bean M M, Slaughter D C 1989 A definition of wheat hardness using near infrared reflec- tance spectroscopy. Cereal Foods World 34 696-705.
OBrien L, Ronalds J A 1987 Heritabilities of small-scale and standard measures of wheat quality for early generation selection. Aust J Agric Res 38 801-808.
Peterson C J, Graybosch R A, Baenziger P S, Grombacher A W 1992 Genotype and environment effects on quality char- acteristic of hard red winter wheat. Crop Sci 32 98-103.
SAS 1985 User's Guide: Statistics. SAS Inst Inc, Cary, NC, USA.
Simmonds D H, Barlow K K, Wrigley C W 1973 The bio- chemical basis of grain hardness in wheat. Cereal Chem 50
Symes K J 1969 Influence of a gene causing hardness on the milling and baking quality of two wheats. Aust J Agric Res
Trupp C R 1976 Particle size index-Breeding behavior and association with protein percentage in wheat. Crop Sci 16
Wu Y V, Stringfellow A C, Bietz J A 1990 Relation of wheat hardness to air-classification yields and flour particle size distribution. Cereal Chem 67 421-427.
Yamazaki W T, Donelson J R 1983 Kernel hardness of some US wheats. Cereal Chem 60 344-350.
553-562.
20 971-979.
61 8-620.