Embed Size (px)
Citation preview
Genetic Algorithm for Hardware Trojan Detectionwith Ring Oscillator Network (RON)
Nima Karimian, Fatemeh Tehranipoor, Md. Tauhidur Rahman, Shane Kelly and Domenic ForteDept. of Electrical & Computer Engineering
University of Connecticut{nima, f.tehrani, tauhid, spk09001, forte}@engr.uconn.edu
Abstract—Securing integrated circuits against malicious mod-ifications (i.e., hardware Trojans) is of utmost importance, ashardware Trojans may leak information and reduce reliabilityof electronic systems in critical applications. In this paper, weuse ring oscillators (ROs) to gather measurements of ICs thatmay contain hardware Trojans. To distinguish between Trojan-inserted ICs and Trojan-free ICs, we investigate several classi-fication approaches. Furthermore, we propose a novel featureselection approach based on the Genetic Algorithm (GA) andevaluate its performance compared to several popular alterna-tives. The proposed method is an improvement over principalcomponent analysis (PCA) in terms of accuracy and equal errorrate by 30% and 97% respectively.
Index Terms—Hardware Trojan Detection, Ring OscillatorNetwork, One class classification, Genetic Algorithm
I. INTRODUCTION
In recent years, semiconductor companies have increasinglyoutsourced their fabrication of integrated circuits (ICs) to com-panies offshore. Since the IP owner cannot be present duringfabrication, this makes IC designs increasingly vulnerable tomalicious modifications referred as hardware Trojan horses(HTHs). A hardware Trojan is an alteration of the originalintegrated circuit (IC) design by an attacker in order to accessand manipulate information stored or disable processing onthe chip [1], [2].
Hardware Trojans are a realistic threat and should beconsidered as a serious concern to modern ICs. As a result,hardware Trojan detection has become an important researchtopic and gained significant attention in recent years. Thereare various hardware Trojan detection techniques that havebeen proposed so far. Most of them are nondestructive andbased on either logic testing or side channel analysis. Side-channel analysis entails monitoring of operational parametersof the circuit, such as leakage current, dynamic power dueto switching activity, and path delays [3]–[8]. The suspectICs are considered as Trojan-free if they match the expectedside channels compared to a golden model. In logic testingapproaches, test vectors are applied in the hopes of activatinga Trojan and detecting its effects on IC output [6]. Destructiveapproaches that require reverse engineering of ICs have alsobeen proposed such as in [9]. The drawback of destructiveapproaches is that they destroy the ICs they are applied toand, therefore, cannot be applied to all suspect ICs.
Side channel-based approaches are the most widely inves-tigated, but suffer from various shortcomings. Most notably,it is difficult to obtain fine-grained measurements of power,delay, etc. so that small Trojans can be detected, especiallyin the presence of large process variations. To address thisissue, in [10], an on-chip structure called the ring oscillatornetwork (RON) was proposed to improve Trojan detection.The frequency of each ring oscillator (RO) in RON is sensitiveto power fluctuations caused by circuit switching activity aswell as the switching activity of the Trojan. In a RON, the
ROs can detect the increase in transient power consumptioninduced by Trojan circuits in different areas of the IC underauthentication. Still, even the detection of all Trojan-insertedICs by RON has not been obtained in previous work.
In this paper, we investigate different machine learningapproaches for detecting hardware Trojans based on mea-surements gathered by RON. We shall assume that goldenICs are available to act as a baseline for learning. Our maincontributions are as follows:
1) We discuss prior approaches based on Principal Com-ponent Analysis (PCA) and Support Vector Machines aswell as their limitations.
2) We propose a new approach that utilizes the GeneticAlgorithm (GA) to select the best ring oscillator (RO)measurements from RON. We use these optimal featuresand one-class SVM to distinguish between Trojan-freeand Trojan-inserted ICs.
3) We perform experiments using real silicon data (33ICs fabricated via MOSIS) and compare three ma-chine learning approaches (PCA+convex hull, SVM,and GA+SVM). We use several metrics to measurethe performance of each approach including receiveroperating characteristic (ROC) curves which can showthe trade-off between sensitivity and specificity. The pro-posed GA+SVM approach required the largest amountof training time, but could correctly classify Trojaninserted ICs with 99.6% accuracy. This was a significantimprovement compared to the more commonly usedPCA which at best achieved 76.8% accuracy.
The rest of the paper is organized as follows: Section IIgives a brief review of the ring oscillator network (RON).Section III describes some background information about clas-sification problems and algorithms. Section IV explains ourproposed approach that combines the Genetic Algorithm withSupport Vector Machines (SVM). Experiments and results arediscussed in Section V. Finally, Section VI concludes thepaper.
II. RING OSCILLATOR NETWORK (RON)
Prior work has shown that a correlation exists betweenthe switching activity caused by Trojans and ring oscillator(RO) activity. For example, if an RO is placed near a Tro-jan’s trigger, it will have a lower frequency than expected.Several attempts have been made in prior work to exploitthe sensitivity of ROs to Trojans for Trojan detection. In[11], the authors claimed that Trojans can be detected byobserving the changes in the frequency of the ROs as well.They provided an algorithm and applied it to an FPGA unitand then measured the frequencies of the ROs to detect anymalicious change to the design. Even though this method isapplicable to both ASIC and FPGA, it requires reconfiguration
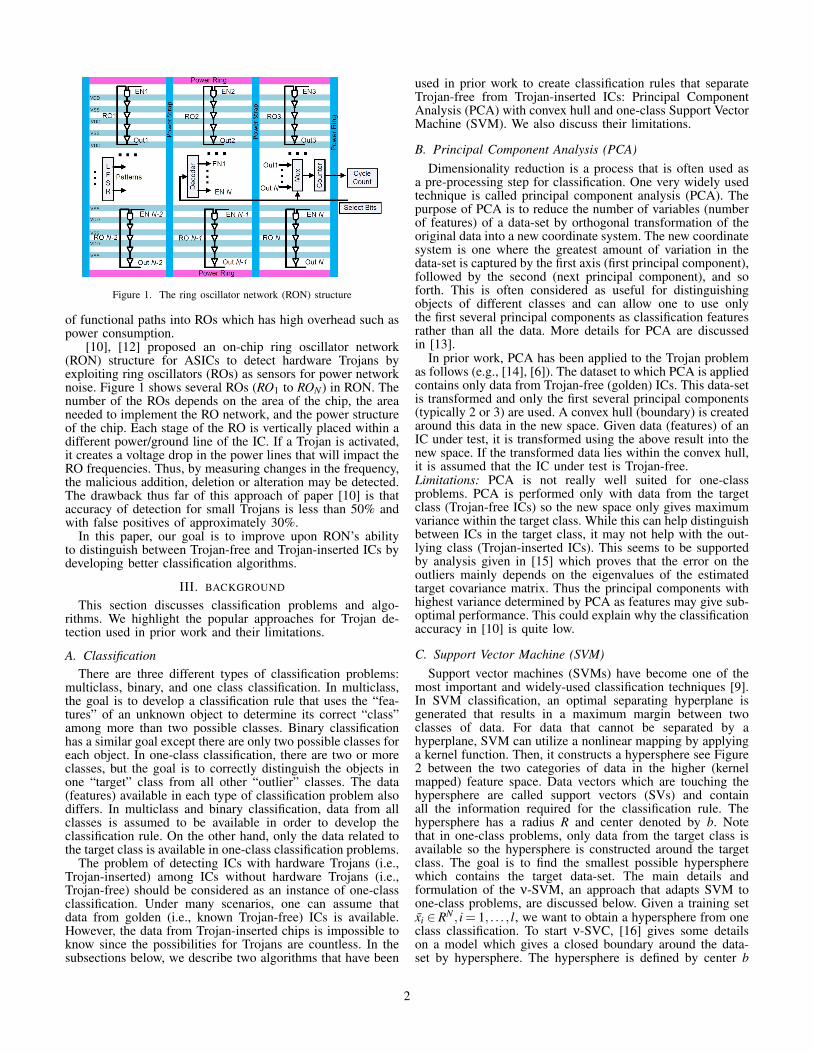
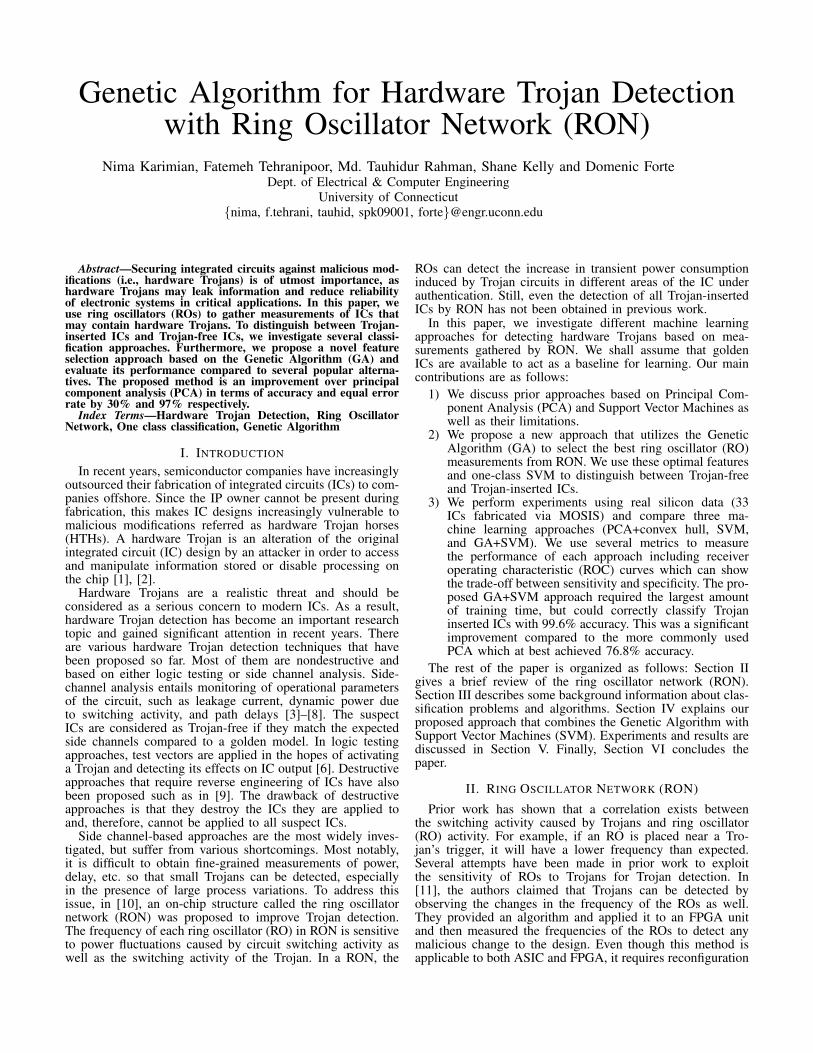
Figure 1. The ring oscillator network (RON) structure
of functional paths into ROs which has high overhead such aspower consumption.
[10], [12] proposed an on-chip ring oscillator network(RON) structure for ASICs to detect hardware Trojans byexploiting ring oscillators (ROs) as sensors for power networknoise. Figure 1 shows several ROs (RO1 to RON) in RON. Thenumber of the ROs depends on the area of the chip, the areaneeded to implement the RO network, and the power structureof the chip. Each stage of the RO is vertically placed within adifferent power/ground line of the IC. If a Trojan is activated,it creates a voltage drop in the power lines that will impact theRO frequencies. Thus, by measuring changes in the frequency,the malicious addition, deletion or alteration may be detected.The drawback thus far of this approach of paper [10] is thataccuracy of detection for small Trojans is less than 50% andwith false positives of approximately 30%.
In this paper, our goal is to improve upon RON’s abilityto distinguish between Trojan-free and Trojan-inserted ICs bydeveloping better classification algorithms.
III. BACKGROUND
This section discusses classification problems and algo-rithms. We highlight the popular approaches for Trojan de-tection used in prior work and their limitations.
A. ClassificationThere are three different types of classification problems:
multiclass, binary, and one class classification. In multiclass,the goal is to develop a classification rule that uses the “fea-tures” of an unknown object to determine its correct “class”among more than two possible classes. Binary classificationhas a similar goal except there are only two possible classes foreach object. In one-class classification, there are two or moreclasses, but the goal is to correctly distinguish the objects inone “target” class from all other “outlier” classes. The data(features) available in each type of classification problem alsodiffers. In multiclass and binary classification, data from allclasses is assumed to be available in order to develop theclassification rule. On the other hand, only the data related tothe target class is available in one-class classification problems.
The problem of detecting ICs with hardware Trojans (i.e.,Trojan-inserted) among ICs without hardware Trojans (i.e.,Trojan-free) should be considered as an instance of one-classclassification. Under many scenarios, one can assume thatdata from golden (i.e., known Trojan-free) ICs is available.However, the data from Trojan-inserted chips is impossible toknow since the possibilities for Trojans are countless. In thesubsections below, we describe two algorithms that have been
used in prior work to create classification rules that separateTrojan-free from Trojan-inserted ICs: Principal ComponentAnalysis (PCA) with convex hull and one-class Support VectorMachine (SVM). We also discuss their limitations.
B. Principal Component Analysis (PCA)Dimensionality reduction is a process that is often used as
a pre-processing step for classification. One very widely usedtechnique is called principal component analysis (PCA). Thepurpose of PCA is to reduce the number of variables (numberof features) of a data-set by orthogonal transformation of theoriginal data into a new coordinate system. The new coordinatesystem is one where the greatest amount of variation in thedata-set is captured by the first axis (first principal component),followed by the second (next principal component), and soforth. This is often considered as useful for distinguishingobjects of different classes and can allow one to use onlythe first several principal components as classification featuresrather than all the data. More details for PCA are discussedin [13].
In prior work, PCA has been applied to the Trojan problemas follows (e.g., [14], [6]). The dataset to which PCA is appliedcontains only data from Trojan-free (golden) ICs. This data-setis transformed and only the first several principal components(typically 2 or 3) are used. A convex hull (boundary) is createdaround this data in the new space. Given data (features) of anIC under test, it is transformed using the above result into thenew space. If the transformed data lies within the convex hull,it is assumed that the IC under test is Trojan-free.Limitations: PCA is not really well suited for one-classproblems. PCA is performed only with data from the targetclass (Trojan-free ICs) so the new space only gives maximumvariance within the target class. While this can help distinguishbetween ICs in the target class, it may not help with the out-lying class (Trojan-inserted ICs). This seems to be supportedby analysis given in [15] which proves that the error on theoutliers mainly depends on the eigenvalues of the estimatedtarget covariance matrix. Thus the principal components withhighest variance determined by PCA as features may give sub-optimal performance. This could explain why the classificationaccuracy in [10] is quite low.
C. Support Vector Machine (SVM)Support vector machines (SVMs) have become one of the
most important and widely-used classification techniques [9].In SVM classification, an optimal separating hyperplane isgenerated that results in a maximum margin between twoclasses of data. For data that cannot be separated by ahyperplane, SVM can utilize a nonlinear mapping by applyinga kernel function. Then, it constructs a hypersphere see Figure2 between the two categories of data in the higher (kernelmapped) feature space. Data vectors which are touching thehypersphere are called support vectors (SVs) and containall the information required for the classification rule. Thehypersphere has a radius R and center denoted by b. Notethat in one-class problems, only data from the target class isavailable so the hypersphere is constructed around the targetclass. The goal is to find the smallest possible hyperspherewhich contains the target data-set. The main details andformulation of the ν-SVM, an approach that adapts SVM toone-class problems, are discussed below. Given a training setxi ∈ RN , i = 1, . . . , l, we want to obtain a hypersphere from oneclass classification. To start ν-SVC, [16] gives some detailson a model which gives a closed boundary around the data-set by hypersphere. The hypersphere is defined by center b
2
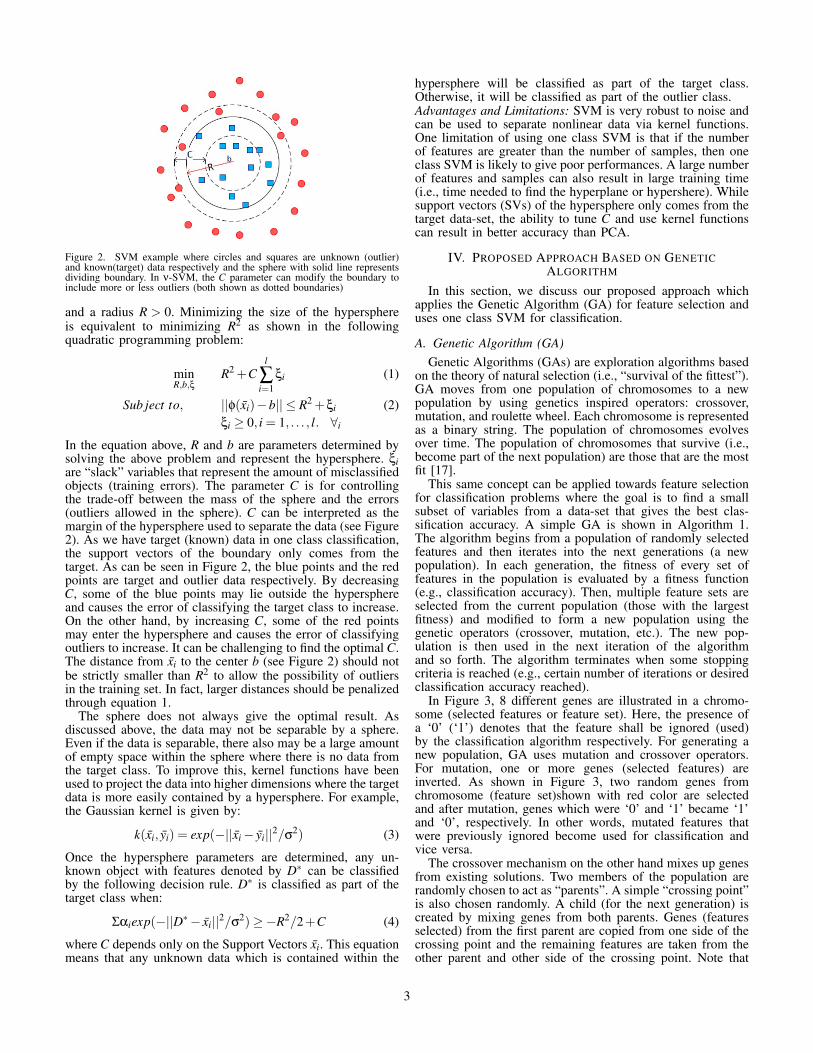
Figure 2. SVM example where circles and squares are unknown (outlier)and known(target) data respectively and the sphere with solid line representsdividing boundary. In ν-SVM, the C parameter can modify the boundary toinclude more or less outliers (both shown as dotted boundaries)
and a radius R > 0. Minimizing the size of the hypersphereis equivalent to minimizing R2 as shown in the followingquadratic programming problem:
minR,b,ξ
R2 +Cl
∑i=1
ξi (1)
Sub ject to, ||φ(xi)−b|| ≤ R2 +ξi (2)ξi ≥ 0, i = 1, . . . , l. ∀i
In the equation above, R and b are parameters determined bysolving the above problem and represent the hypersphere. ξiare “slack” variables that represent the amount of misclassifiedobjects (training errors). The parameter C is for controllingthe trade-off between the mass of the sphere and the errors(outliers allowed in the sphere). C can be interpreted as themargin of the hypersphere used to separate the data (see Figure2). As we have target (known) data in one class classification,the support vectors of the boundary only comes from thetarget. As can be seen in Figure 2, the blue points and the redpoints are target and outlier data respectively. By decreasingC, some of the blue points may lie outside the hypersphereand causes the error of classifying the target class to increase.On the other hand, by increasing C, some of the red pointsmay enter the hypersphere and causes the error of classifyingoutliers to increase. It can be challenging to find the optimal C.The distance from xi to the center b (see Figure 2) should notbe strictly smaller than R2 to allow the possibility of outliersin the training set. In fact, larger distances should be penalizedthrough equation 1.
The sphere does not always give the optimal result. Asdiscussed above, the data may not be separable by a sphere.Even if the data is separable, there also may be a large amountof empty space within the sphere where there is no data fromthe target class. To improve this, kernel functions have beenused to project the data into higher dimensions where the targetdata is more easily contained by a hypersphere. For example,the Gaussian kernel is given by:
k(xi, yi) = exp(−||xi− yi||2/σ2) (3)
Once the hypersphere parameters are determined, any un-known object with features denoted by D∗ can be classifiedby the following decision rule. D∗ is classified as part of thetarget class when:
Σαiexp(−||D∗− xi||2/σ2)≥−R2/2+C (4)
where C depends only on the Support Vectors xi. This equationmeans that any unknown data which is contained within the
hypersphere will be classified as part of the target class.Otherwise, it will be classified as part of the outlier class.Advantages and Limitations: SVM is very robust to noise andcan be used to separate nonlinear data via kernel functions.One limitation of using one class SVM is that if the numberof features are greater than the number of samples, then oneclass SVM is likely to give poor performances. A large numberof features and samples can also result in large training time(i.e., time needed to find the hyperplane or hypershere). Whilesupport vectors (SVs) of the hypersphere only comes from thetarget data-set, the ability to tune C and use kernel functionscan result in better accuracy than PCA.
IV. PROPOSED APPROACH BASED ON GENETICALGORITHM
In this section, we discuss our proposed approach whichapplies the Genetic Algorithm (GA) for feature selection anduses one class SVM for classification.
A. Genetic Algorithm (GA)Genetic Algorithms (GAs) are exploration algorithms based
on the theory of natural selection (i.e., “survival of the fittest”).GA moves from one population of chromosomes to a newpopulation by using genetics inspired operators: crossover,mutation, and roulette wheel. Each chromosome is representedas a binary string. The population of chromosomes evolvesover time. The population of chromosomes that survive (i.e.,become part of the next population) are those that are the mostfit [17].
This same concept can be applied towards feature selectionfor classification problems where the goal is to find a smallsubset of variables from a data-set that gives the best clas-sification accuracy. A simple GA is shown in Algorithm 1.The algorithm begins from a population of randomly selectedfeatures and then iterates into the next generations (a newpopulation). In each generation, the fitness of every set offeatures in the population is evaluated by a fitness function(e.g., classification accuracy). Then, multiple feature sets areselected from the current population (those with the largestfitness) and modified to form a new population using thegenetic operators (crossover, mutation, etc.). The new pop-ulation is then used in the next iteration of the algorithmand so forth. The algorithm terminates when some stoppingcriteria is reached (e.g., certain number of iterations or desiredclassification accuracy reached).
In Figure 3, 8 different genes are illustrated in a chromo-some (selected features or feature set). Here, the presence ofa ‘0’ (‘1’) denotes that the feature shall be ignored (used)by the classification algorithm respectively. For generating anew population, GA uses mutation and crossover operators.For mutation, one or more genes (selected features) areinverted. As shown in Figure 3, two random genes fromchromosome (feature set)shown with red color are selectedand after mutation, genes which were ‘0’ and ‘1’ became ‘1’and ‘0’, respectively. In other words, mutated features thatwere previously ignored become used for classification andvice versa.
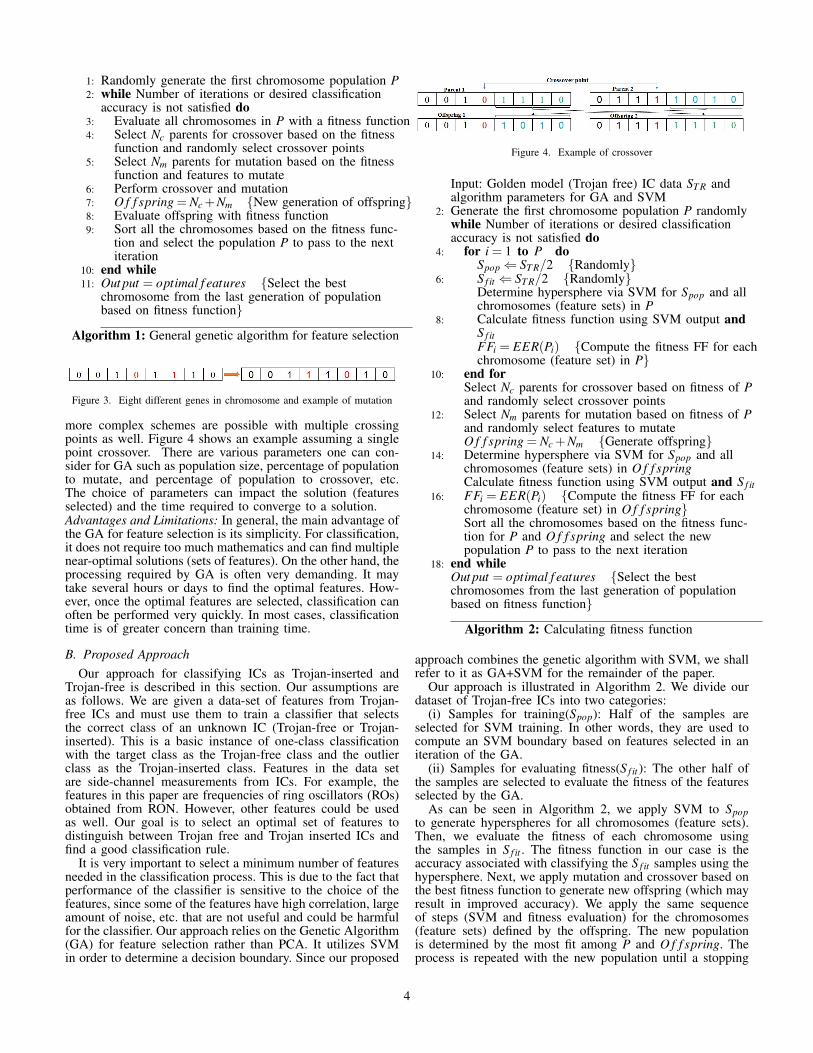
The crossover mechanism on the other hand mixes up genesfrom existing solutions. Two members of the population arerandomly chosen to act as “parents”. A simple “crossing point”is also chosen randomly. A child (for the next generation) iscreated by mixing genes from both parents. Genes (featuresselected) from the first parent are copied from one side of thecrossing point and the remaining features are taken from theother parent and other side of the crossing point. Note that
3
1: Randomly generate the first chromosome population P2: while Number of iterations or desired classification
accuracy is not satisfied do3: Evaluate all chromosomes in P with a fitness function4: Select Nc parents for crossover based on the fitness
function and randomly select crossover points5: Select Nm parents for mutation based on the fitness
function and features to mutate6: Perform crossover and mutation7: O f f spring = Nc+Nm {New generation of offspring}8: Evaluate offspring with fitness function9: Sort all the chromosomes based on the fitness func-
tion and select the population P to pass to the nextiteration
10: end while11: Out put = optimal f eatures {Select the best
chromosome from the last generation of populationbased on fitness function}
Algorithm 1: General genetic algorithm for feature selection
Figure 3. Eight different genes in chromosome and example of mutation
more complex schemes are possible with multiple crossingpoints as well. Figure 4 shows an example assuming a singlepoint crossover. There are various parameters one can con-sider for GA such as population size, percentage of populationto mutate, and percentage of population to crossover, etc.The choice of parameters can impact the solution (featuresselected) and the time required to converge to a solution.Advantages and Limitations: In general, the main advantage ofthe GA for feature selection is its simplicity. For classification,it does not require too much mathematics and can find multiplenear-optimal solutions (sets of features). On the other hand, theprocessing required by GA is often very demanding. It maytake several hours or days to find the optimal features. How-ever, once the optimal features are selected, classification canoften be performed very quickly. In most cases, classificationtime is of greater concern than training time.
B. Proposed ApproachOur approach for classifying ICs as Trojan-inserted and
Trojan-free is described in this section. Our assumptions areas follows. We are given a data-set of features from Trojan-free ICs and must use them to train a classifier that selectsthe correct class of an unknown IC (Trojan-free or Trojan-inserted). This is a basic instance of one-class classificationwith the target class as the Trojan-free class and the outlierclass as the Trojan-inserted class. Features in the data setare side-channel measurements from ICs. For example, thefeatures in this paper are frequencies of ring oscillators (ROs)obtained from RON. However, other features could be usedas well. Our goal is to select an optimal set of features todistinguish between Trojan free and Trojan inserted ICs andfind a good classification rule.
It is very important to select a minimum number of featuresneeded in the classification process. This is due to the fact thatperformance of the classifier is sensitive to the choice of thefeatures, since some of the features have high correlation, largeamount of noise, etc. that are not useful and could be harmfulfor the classifier. Our approach relies on the Genetic Algorithm(GA) for feature selection rather than PCA. It utilizes SVMin order to determine a decision boundary. Since our proposed
Figure 4. Example of crossover
Input: Golden model (Trojan free) IC data ST R andalgorithm parameters for GA and SVM
2: Generate the first chromosome population P randomlywhile Number of iterations or desired classificationaccuracy is not satisfied do
4: for i = 1 to P doSpop⇐ ST R/2 {Randomly}
6: S f it ⇐ ST R/2 {Randomly}Determine hypersphere via SVM for Spop and allchromosomes (feature sets) in P
8: Calculate fitness function using SVM output andS f itFFi = EER(Pi) {Compute the fitness FF for eachchromosome (feature set) in P}
10: end forSelect Nc parents for crossover based on fitness of Pand randomly select crossover points
12: Select Nm parents for mutation based on fitness of Pand randomly select features to mutateO f f spring = Nc +Nm {Generate offspring}
14: Determine hypersphere via SVM for Spop and allchromosomes (feature sets) in O f f springCalculate fitness function using SVM output and S f it
16: FFi = EER(Pi) {Compute the fitness FF for eachchromosome (feature set) in O f f spring}Sort all the chromosomes based on the fitness func-tion for P and O f f spring and select the newpopulation P to pass to the next iteration
18: end whileOut put = optimal f eatures {Select the bestchromosomes from the last generation of populationbased on fitness function}
Algorithm 2: Calculating fitness function
approach combines the genetic algorithm with SVM, we shallrefer to it as GA+SVM for the remainder of the paper.
Our approach is illustrated in Algorithm 2. We divide ourdataset of Trojan-free ICs into two categories:
(i) Samples for training(Spop): Half of the samples areselected for SVM training. In other words, they are used tocompute an SVM boundary based on features selected in aniteration of the GA.
(ii) Samples for evaluating fitness(S f it ): The other half ofthe samples are selected to evaluate the fitness of the featuresselected by the GA.
As can be seen in Algorithm 2, we apply SVM to Spopto generate hyperspheres for all chromosomes (feature sets).Then, we evaluate the fitness of each chromosome usingthe samples in S f it . The fitness function in our case is theaccuracy associated with classifying the S f it samples using thehypersphere. Next, we apply mutation and crossover based onthe best fitness function to generate new offspring (which mayresult in improved accuracy). We apply the same sequenceof steps (SVM and fitness evaluation) for the chromosomes(feature sets) defined by the offspring. The new populationis determined by the most fit among P and O f f spring. Theprocess is repeated with the new population until a stopping
4
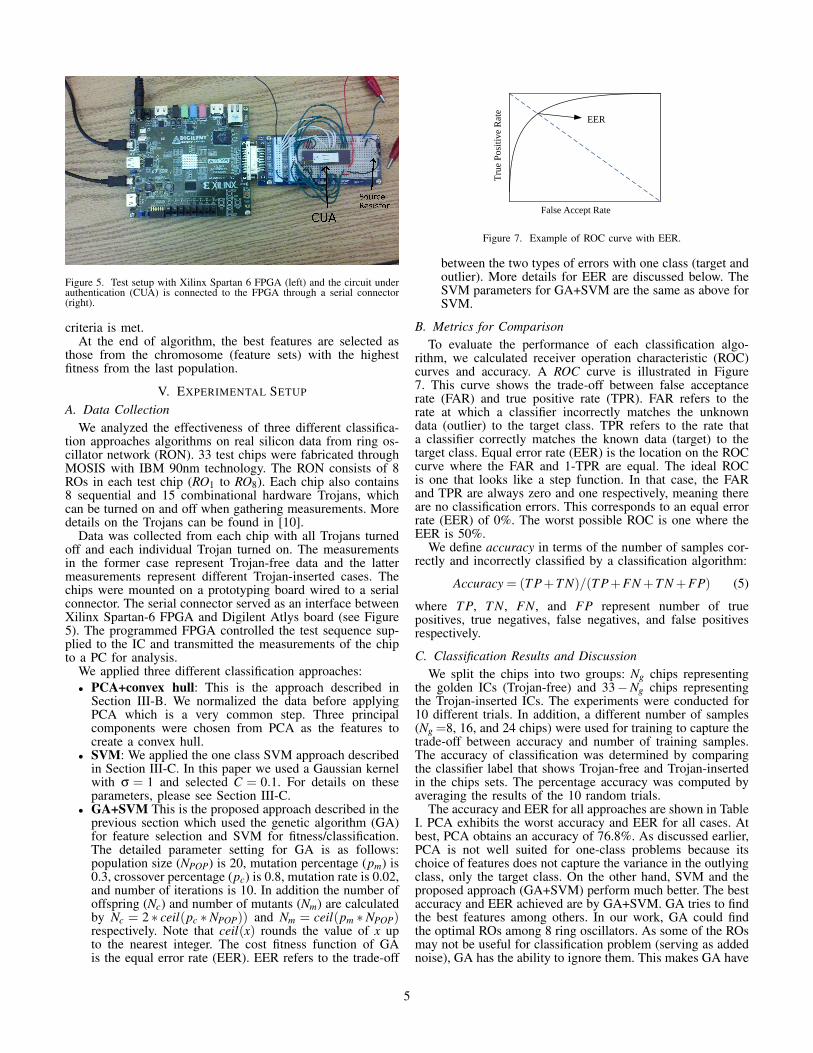
Figure 5. Test setup with Xilinx Spartan 6 FPGA (left) and the circuit underauthentication (CUA) is connected to the FPGA through a serial connector(right).
criteria is met.At the end of algorithm, the best features are selected as
those from the chromosome (feature sets) with the highestfitness from the last population.
V. EXPERIMENTAL SETUP
A. Data CollectionWe analyzed the effectiveness of three different classifica-
tion approaches algorithms on real silicon data from ring os-cillator network (RON). 33 test chips were fabricated throughMOSIS with IBM 90nm technology. The RON consists of 8ROs in each test chip (RO1 to RO8). Each chip also contains8 sequential and 15 combinational hardware Trojans, whichcan be turned on and off when gathering measurements. Moredetails on the Trojans can be found in [10].
Data was collected from each chip with all Trojans turnedoff and each individual Trojan turned on. The measurementsin the former case represent Trojan-free data and the lattermeasurements represent different Trojan-inserted cases. Thechips were mounted on a prototyping board wired to a serialconnector. The serial connector served as an interface betweenXilinx Spartan-6 FPGA and Digilent Atlys board (see Figure5). The programmed FPGA controlled the test sequence sup-plied to the IC and transmitted the measurements of the chipto a PC for analysis.
We applied three different classification approaches:• PCA+convex hull: This is the approach described in
Section III-B. We normalized the data before applyingPCA which is a very common step. Three principalcomponents were chosen from PCA as the features tocreate a convex hull.
• SVM: We applied the one class SVM approach describedin Section III-C. In this paper we used a Gaussian kernelwith σ = 1 and selected C = 0.1. For details on theseparameters, please see Section III-C.
• GA+SVM This is the proposed approach described in theprevious section which used the genetic algorithm (GA)for feature selection and SVM for fitness/classification.The detailed parameter setting for GA is as follows:population size (NPOP) is 20, mutation percentage (pm) is0.3, crossover percentage (pc) is 0.8, mutation rate is 0.02,and number of iterations is 10. In addition the number ofoffspring (Nc) and number of mutants (Nm) are calculatedby Nc = 2 ∗ ceil(pc ∗NPOP)) and Nm = ceil(pm ∗NPOP)respectively. Note that ceil(x) rounds the value of x upto the nearest integer. The cost fitness function of GAis the equal error rate (EER). EER refers to the trade-off
EER
Tru
e P
osi
tiv
e R
ate
False Accept Rate
Figure 7. Example of ROC curve with EER.
between the two types of errors with one class (target andoutlier). More details for EER are discussed below. TheSVM parameters for GA+SVM are the same as above forSVM.
B. Metrics for ComparisonTo evaluate the performance of each classification algo-
rithm, we calculated receiver operation characteristic (ROC)curves and accuracy. A ROC curve is illustrated in Figure7. This curve shows the trade-off between false acceptancerate (FAR) and true positive rate (TPR). FAR refers to therate at which a classifier incorrectly matches the unknowndata (outlier) to the target class. TPR refers to the rate thata classifier correctly matches the known data (target) to thetarget class. Equal error rate (EER) is the location on the ROCcurve where the FAR and 1-TPR are equal. The ideal ROCis one that looks like a step function. In that case, the FARand TPR are always zero and one respectively, meaning thereare no classification errors. This corresponds to an equal errorrate (EER) of 0%. The worst possible ROC is one where theEER is 50%.
We define accuracy in terms of the number of samples cor-rectly and incorrectly classified by a classification algorithm:
Accuracy = (T P+T N)/(T P+FN +T N +FP) (5)
where T P, T N, FN, and FP represent number of truepositives, true negatives, false negatives, and false positivesrespectively.
C. Classification Results and DiscussionWe split the chips into two groups: Ng chips representing
the golden ICs (Trojan-free) and 33−Ng chips representingthe Trojan-inserted ICs. The experiments were conducted for10 different trials. In addition, a different number of samples(Ng =8, 16, and 24 chips) were used for training to capture thetrade-off between accuracy and number of training samples.The accuracy of classification was determined by comparingthe classifier label that shows Trojan-free and Trojan-insertedin the chips sets. The percentage accuracy was computed byaveraging the results of the 10 random trials.
The accuracy and EER for all approaches are shown in TableI. PCA exhibits the worst accuracy and EER for all cases. Atbest, PCA obtains an accuracy of 76.8%. As discussed earlier,PCA is not well suited for one-class problems because itschoice of features does not capture the variance in the outlyingclass, only the target class. On the other hand, SVM and theproposed approach (GA+SVM) perform much better. The bestaccuracy and EER achieved are by GA+SVM. GA tries to findthe best features among others. In our work, GA could findthe optimal ROs among 8 ring oscillators. As some of the ROsmay not be useful for classification problem (serving as addednoise), GA has the ability to ignore them. This makes GA have
5
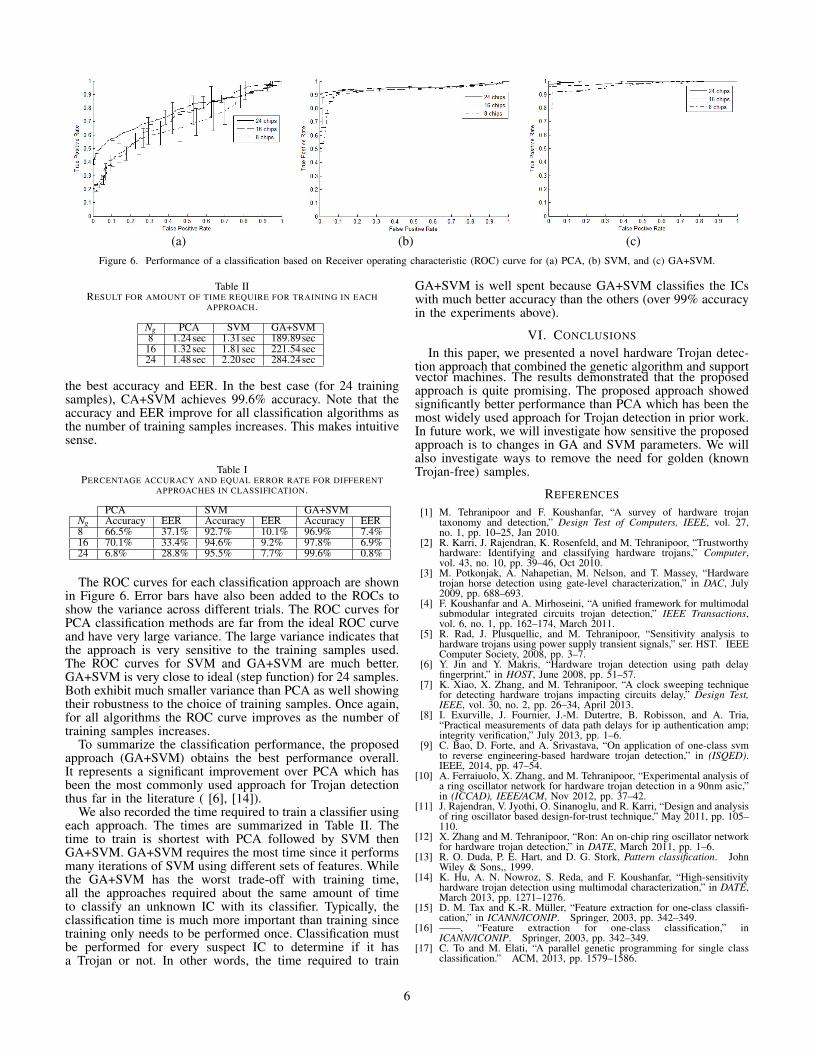
(a) (b) (c)Figure 6. Performance of a classification based on Receiver operating characteristic (ROC) curve for (a) PCA, (b) SVM, and (c) GA+SVM.
Table IIRESULT FOR AMOUNT OF TIME REQUIRE FOR TRAINING IN EACH
APPROACH.
Ng PCA SVM GA+SVM8 1.24sec 1.31sec 189.89sec16 1.32sec 1.81sec 221.54sec24 1.48sec 2.20sec 284.24sec
the best accuracy and EER. In the best case (for 24 trainingsamples), CA+SVM achieves 99.6% accuracy. Note that theaccuracy and EER improve for all classification algorithms asthe number of training samples increases. This makes intuitivesense.
Table IPERCENTAGE ACCURACY AND EQUAL ERROR RATE FOR DIFFERENT
APPROACHES IN CLASSIFICATION.
PCA SVM GA+SVMNg Accuracy EER Accuracy EER Accuracy EER8 66.5% 37.1% 92.7% 10.1% 96.9% 7.4%16 70.1% 33.4% 94.6% 9.2% 97.8% 6.9%24 6.8% 28.8% 95.5% 7.7% 99.6% 0.8%
The ROC curves for each classification approach are shownin Figure 6. Error bars have also been added to the ROCs toshow the variance across different trials. The ROC curves forPCA classification methods are far from the ideal ROC curveand have very large variance. The large variance indicates thatthe approach is very sensitive to the training samples used.The ROC curves for SVM and GA+SVM are much better.GA+SVM is very close to ideal (step function) for 24 samples.Both exhibit much smaller variance than PCA as well showingtheir robustness to the choice of training samples. Once again,for all algorithms the ROC curve improves as the number oftraining samples increases.
To summarize the classification performance, the proposedapproach (GA+SVM) obtains the best performance overall.It represents a significant improvement over PCA which hasbeen the most commonly used approach for Trojan detectionthus far in the literature ( [6], [14]).
We also recorded the time required to train a classifier usingeach approach. The times are summarized in Table II. Thetime to train is shortest with PCA followed by SVM thenGA+SVM. GA+SVM requires the most time since it performsmany iterations of SVM using different sets of features. Whilethe GA+SVM has the worst trade-off with training time,all the approaches required about the same amount of timeto classify an unknown IC with its classifier. Typically, theclassification time is much more important than training sincetraining only needs to be performed once. Classification mustbe performed for every suspect IC to determine if it hasa Trojan or not. In other words, the time required to train
GA+SVM is well spent because GA+SVM classifies the ICswith much better accuracy than the others (over 99% accuracyin the experiments above).
VI. CONCLUSIONS
In this paper, we presented a novel hardware Trojan detec-tion approach that combined the genetic algorithm and supportvector machines. The results demonstrated that the proposedapproach is quite promising. The proposed approach showedsignificantly better performance than PCA which has been themost widely used approach for Trojan detection in prior work.In future work, we will investigate how sensitive the proposedapproach is to changes in GA and SVM parameters. We willalso investigate ways to remove the need for golden (knownTrojan-free) samples.
REFERENCES
[1] M. Tehranipoor and F. Koushanfar, “A survey of hardware trojantaxonomy and detection,” Design Test of Computers, IEEE, vol. 27,no. 1, pp. 10–25, Jan 2010.
[2] R. Karri, J. Rajendran, K. Rosenfeld, and M. Tehranipoor, “Trustworthyhardware: Identifying and classifying hardware trojans,” Computer,vol. 43, no. 10, pp. 39–46, Oct 2010.
[3] M. Potkonjak, A. Nahapetian, M. Nelson, and T. Massey, “Hardwaretrojan horse detection using gate-level characterization,” in DAC, July2009, pp. 688–693.
[4] F. Koushanfar and A. Mirhoseini, “A unified framework for multimodalsubmodular integrated circuits trojan detection,” IEEE Transactions,vol. 6, no. 1, pp. 162–174, March 2011.
[5] R. Rad, J. Plusquellic, and M. Tehranipoor, “Sensitivity analysis tohardware trojans using power supply transient signals,” ser. HST. IEEEComputer Society, 2008, pp. 3–7.
[6] Y. Jin and Y. Makris, “Hardware trojan detection using path delayfingerprint,” in HOST, June 2008, pp. 51–57.
[7] K. Xiao, X. Zhang, and M. Tehranipoor, “A clock sweeping techniquefor detecting hardware trojans impacting circuits delay,” Design Test,IEEE, vol. 30, no. 2, pp. 26–34, April 2013.
[8] I. Exurville, J. Fournier, J.-M. Dutertre, B. Robisson, and A. Tria,“Practical measurements of data path delays for ip authentication amp;integrity verification,” July 2013, pp. 1–6.
[9] C. Bao, D. Forte, and A. Srivastava, “On application of one-class svmto reverse engineering-based hardware trojan detection,” in (ISQED).IEEE, 2014, pp. 47–54.
[10] A. Ferraiuolo, X. Zhang, and M. Tehranipoor, “Experimental analysis ofa ring oscillator network for hardware trojan detection in a 90nm asic,”in (ICCAD), IEEE/ACM, Nov 2012, pp. 37–42.
[11] J. Rajendran, V. Jyothi, O. Sinanoglu, and R. Karri, “Design and analysisof ring oscillator based design-for-trust technique,” May 2011, pp. 105–110.
[12] X. Zhang and M. Tehranipoor, “Ron: An on-chip ring oscillator networkfor hardware trojan detection,” in DATE, March 2011, pp. 1–6.
[13] R. O. Duda, P. E. Hart, and D. G. Stork, Pattern classification. JohnWiley & Sons,, 1999.
[14] K. Hu, A. N. Nowroz, S. Reda, and F. Koushanfar, “High-sensitivityhardware trojan detection using multimodal characterization,” in DATE,March 2013, pp. 1271–1276.
[15] D. M. Tax and K.-R. Muller, “Feature extraction for one-class classifi-cation,” in ICANN/ICONIP. Springer, 2003, pp. 342–349.
[16] ——, “Feature extraction for one-class classification,” inICANN/ICONIP. Springer, 2003, pp. 342–349.
[17] C. To and M. Elati, “A parallel genetic programming for single classclassification.” ACM, 2013, pp. 1579–1586.
6