Embed Size (px)
Citation preview
General Manager’sQuarterly
Management Report
Year-End 2003
King County Department of Transportation—Metro Transit Division
Ron SimsKing County ExecutiveKing County, Washington
Harold S. TaniguchiDirector, Department of Transportation201 South Jackson Street, M.S. KSC-TR-0815Seattle, Washington 98104-3856Phone: (206) 684-1441Fax: (206) 684-1224Internet: [email protected]
Report prepared by:
Darwin Campbell, Acting General ManagerKing County Metro Transit201 South Jackson Street, M.S. KSC-TR-0415Seattle, Washington 98104-3856Phone: (206) 684-1653Fax: (206) 684-1778Internet: [email protected]
Participating Staff:Management Information and Transit Technology Section Peggy Willis, Manager Chuck Sawyer, Supervisor Lisa Durst Libby Krochalis Brad North
King County
General Manager’sQuarterly Management Report
Year-End 2003
King County Department of TransportationMetro Transit Division
201 South Jackson StreetSeattle, Washington 98104-3856
Year-End 2003
General Manager’s Quarterly Management Report
Table of Contents
Introduction . . . . . . . . . . . . . . . . . . . . . . . . . . . . . . . . . . . . . . . . . . . . . . . . . . . . 1Ridership
Transit . . . . . . . . . . . . . . . . . . . . . . . . . . . . . . . . . . . . . . . . . . . . . . . . . . . . . . 1Vanpool . . . . . . . . . . . . . . . . . . . . . . . . . . . . . . . . . . . . . . . . . . . . . . . . . . . . . 1Paratransit . . . . . . . . . . . . . . . . . . . . . . . . . . . . . . . . . . . . . . . . . . . . . . . . . . . 2
Customer ServicesCustomer Assistance Office . . . . . . . . . . . . . . . . . . . . . . . . . . . . . . . . . . . . 2Rider Information Office . . . . . . . . . . . . . . . . . . . . . . . . . . . . . . . . . . . . . . 2Ridematch Services . . . . . . . . . . . . . . . . . . . . . . . . . . . . . . . . . . . . . . . . . . . 2
Financial Summary . . . . . . . . . . . . . . . . . . . . . . . . . . . . . . . . . . . . . . . . . . . . . . 3Safety and Security . . . . . . . . . . . . . . . . . . . . . . . . . . . . . . . . . . . . . . . . . . . . . . 3Operating Highlights . . . . . . . . . . . . . . . . . . . . . . . . . . . . . . . . . . . . . . . . . . . . 4Capital Program Financial Summary . . . . . . . . . . . . . . . . . . . . . . . . . . . . . . . 7Capital Program Highlights . . . . . . . . . . . . . . . . . . . . . . . . . . . . . . . . . . . . . . . 7
Detailed Financial and Operating DataRevenues . . . . . . . . . . . . . . . . . . . . . . . . . . . . . . . . . . . . . . . . . . . . . . . . . . . 10Operating Expenditures . . . . . . . . . . . . . . . . . . . . . . . . . . . . . . . . . . . . . . 11Capital Expenditures . . . . . . . . . . . . . . . . . . . . . . . . . . . . . . . . . . . . . . . . . 11Transit Statistics . . . . . . . . . . . . . . . . . . . . . . . . . . . . . . . . . . . . . . . . . . . . . 12Customer Services . . . . . . . . . . . . . . . . . . . . . . . . . . . . . . . . . . . . . . . . . . . 13Paratransit Services . . . . . . . . . . . . . . . . . . . . . . . . . . . . . . . . . . . . . . . . . . 14DART Service . . . . . . . . . . . . . . . . . . . . . . . . . . . . . . . . . . . . . . . . . . . . . . . 15Vanpool Services . . . . . . . . . . . . . . . . . . . . . . . . . . . . . . . . . . . . . . . . . . . . 15Benson Waterfront Streetcar Line . . . . . . . . . . . . . . . . . . . . . . . . . . . . . . 16Water Taxi . . . . . . . . . . . . . . . . . . . . . . . . . . . . . . . . . . . . . . . . . . . . . . . . . . 16Operating Environment . . . . . . . . . . . . . . . . . . . . . . . . . . . . . . . . . . . . . . 16Metro Transit Employee Information . . . . . . . . . . . . . . . . . . . . . . . . . . . 16Transit Fleet Information . . . . . . . . . . . . . . . . . . . . . . . . . . . . . . . . . . . . . 17Facilities Information . . . . . . . . . . . . . . . . . . . . . . . . . . . . . . . . . . . . . . . . 18Fares . . . . . . . . . . . . . . . . . . . . . . . . . . . . . . . . . . . . . . . . . . . . . . . . . . . . . . . 19Annual Summary . . . . . . . . . . . . . . . . . . . . . . . . . . . . . . . . . . . . . . . . . . . 20
Year-End 2003
General Manager’s Quarterly Management Report
2003 PUBLIC TRANSPORTATIONSERVICES
RIDERSHIP
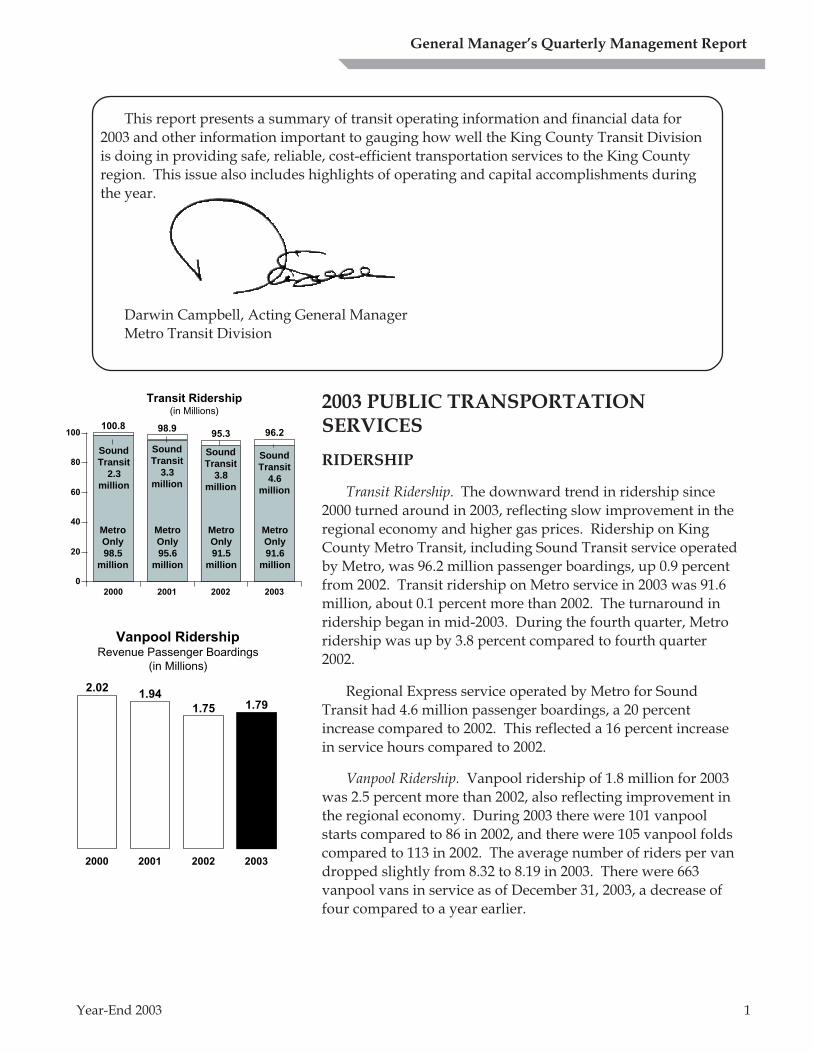
Transit Ridership. The downward trend in ridership since2000 turned around in 2003, reflecting slow improvement in theregional economy and higher gas prices. Ridership on KingCounty Metro Transit, including Sound Transit service operatedby Metro, was 96.2 million passenger boardings, up 0.9 percentfrom 2002. Transit ridership on Metro service in 2003 was 91.6million, about 0.1 percent more than 2002. The turnaround inridership began in mid-2003. During the fourth quarter, Metroridership was up by 3.8 percent compared to fourth quarter2002.
Regional Express service operated by Metro for SoundTransit had 4.6 million passenger boardings, a 20 percentincrease compared to 2002. This reflected a 16 percent increasein service hours compared to 2002.
Vanpool Ridership. Vanpool ridership of 1.8 million for 2003was 2.5 percent more than 2002, also reflecting improvement inthe regional economy. During 2003 there were 101 vanpoolstarts compared to 86 in 2002, and there were 105 vanpool foldscompared to 113 in 2002. The average number of riders per vandropped slightly from 8.32 to 8.19 in 2003. There were 663vanpool vans in service as of December 31, 2003, a decrease offour compared to a year earlier.
This report presents a summary of transit operating information and financial data for2003 and other information important to gauging how well the King County Transit Divisionis doing in providing safe, reliable, cost-efficient transportation services to the King Countyregion. This issue also includes highlights of operating and capital accomplishments duringthe year.
Darwin Campbell, Acting General ManagerMetro Transit Division
1
100.8 98.995.3 96.2
2000 2001 2002 2003
0
20
40
60
80
100
Transit Ridership(in Millions)
Sound Transit
2.3million
Sound Transit
3.3million
Sound Transit
3.8million
MetroOnly98.5
million
MetroOnly95.6
million
MetroOnly91.5
million
MetroOnly91.6
million
Sound Transit
4.6million
Vanpool RidershipRevenue Passenger Boardings
(in Millions)
2.021.94
1.75 1.79
2000 2001 2002 2003

Year-End 2003
General Manager’s Quarterly Management Report
2
Paratransit Ridership. Services include ACCESS transportationvan service for people with disabilities who are eligible underfederal ADA guidelines, and a subsidized taxi scrip program.ACCESS van passenger rides increased 3.3 percent to 1,024,491compared to 991,463 in 2002. Over the same period of time, taxiscrip rides decreased 6 percent to 52,264.
Factors influencing the ACCESS ridership increase are theimplementation of a ‘zero denials’ policy, and the overallimprovement in service quality. Because ACCESS Transportationno longer denies ride requests, riders know they can rely on theservice and may be less likely to look for alternative transportation.Further, with the enhancement of scheduling software, ACCESSeliminated some transfer rides, so more riders are getting directservice. ACCESS has also implemented other operationalimprovements that are likely to have increased demand.
CUSTOMER SERVICES
Customer inquiries are answered through the Customer Assistance Office (CAO), the RiderInformation Office (RIO) and online applications. Ridematch Services provides support for theformation and maintenance of carpools and vanpools. See page 11 for more detail.
Customer Assistance Office. The Customer Assistance Office responds to customers calling andwriting with commendations, complaints and service requests. During 2003, total incomingcontacts increased 1.4 percent—customer calls increased 1.9 percent to 65,786 while mail, email andin-person contacts decreased 2.9 percent to 7,603. Ninety percent of all incoming customer callswere answered during the year compared to 83 percent in 2002. The percent of calls answeredwithin 2-1/3 minutes improved to 87 percent from 75 percent a year earlier. Service requests wereup 24 percent; complaints were up 14 percent while complaints per million boardings were up 13percent. Commendations per million boardings were up 1.5 percent compared with 2002.
Rider Information Office. The Rider Information Office provides information to customersmaking contact via direct telephone calls, automated Bus-Time telephone calls and the Internet,including Metro Online and Online Trip Planner sessions. The RIO also provides Sound Transitand special events service information. There were 6.2 million responses to customer telephone andInternet inquiries in 2003 compared to 5.5 million in 2002, an 11 percent increase. Internet sessionsincreased 15 percent and accounted for more than 80 percent of customer responses in 2003. TheOnline Trip Planner accounted for most of this increase with 1.75 million visits during 2003, up 41percent from 1.24 million visits a year earlier. Total telephone calls answered decreased 2.1 percent.Eighty-six percent of calls were answered in 2003 compared with 83 percent in 2002.
Ridematch Services. Metro Transit provides regional, computerized matching services forindividuals in nine counties wishing to form or join a carpool or vanpool. During 2003, matchinginformation was processed for 14,659 new and current customers, a decrease of 0.7 percent from2002. In addition, customers logged on to Rideshare Online about 58,000 times during 2003.
Paratransit RidershipPassenger Boardings
(in Millions)
1.061.03 1.05
1.08
2000 2001 2002 2003
Year-End 2003
General Manager’s Quarterly Management Report
3
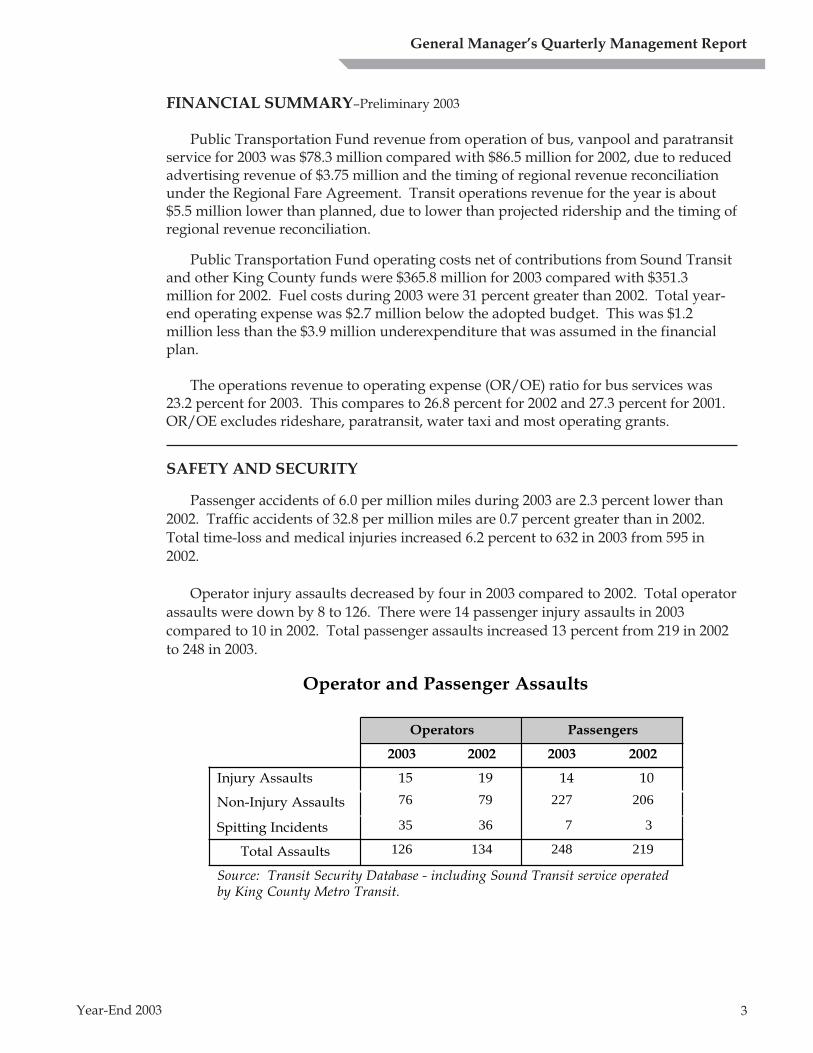
FINANCIAL SUMMARY–Preliminary 2003
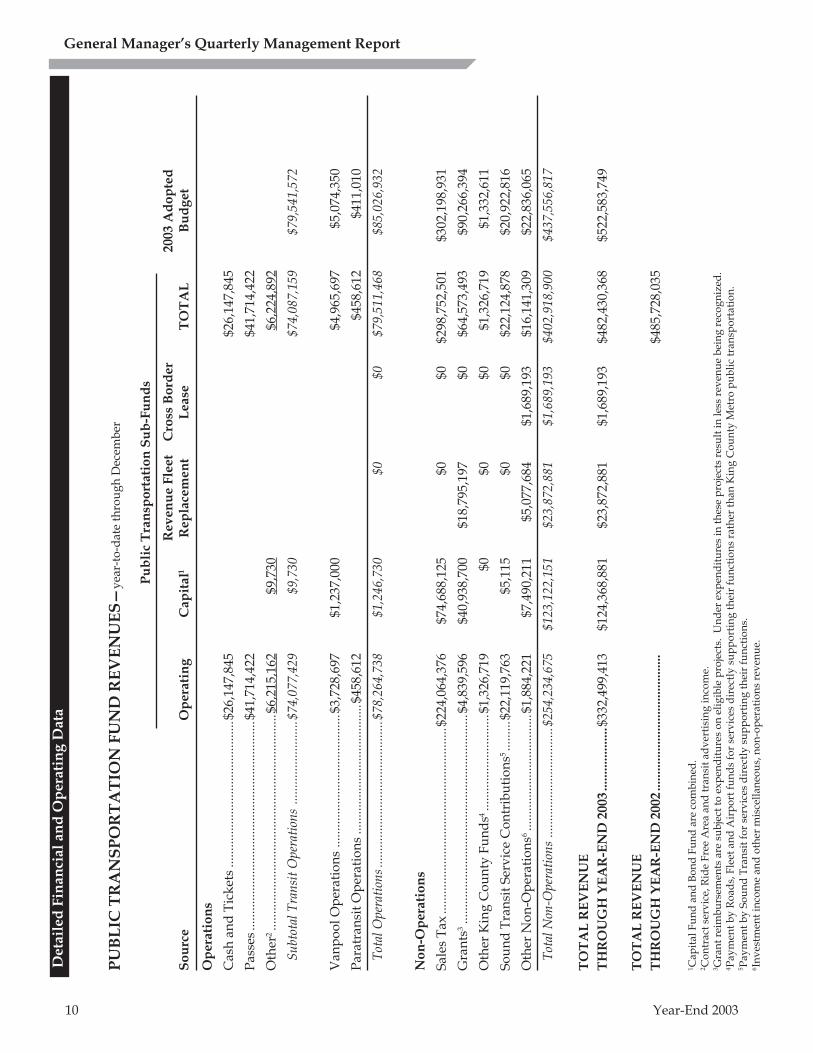
Public Transportation Fund revenue from operation of bus, vanpool and paratransitservice for 2003 was $78.3 million compared with $86.5 million for 2002, due to reducedadvertising revenue of $3.75 million and the timing of regional revenue reconciliationunder the Regional Fare Agreement. Transit operations revenue for the year is about$5.5 million lower than planned, due to lower than projected ridership and the timing ofregional revenue reconciliation.
Public Transportation Fund operating costs net of contributions from Sound Transitand other King County funds were $365.8 million for 2003 compared with $351.3million for 2002. Fuel costs during 2003 were 31 percent greater than 2002. Total year-end operating expense was $2.7 million below the adopted budget. This was $1.2million less than the $3.9 million underexpenditure that was assumed in the financialplan.
The operations revenue to operating expense (OR/OE) ratio for bus services was23.2 percent for 2003. This compares to 26.8 percent for 2002 and 27.3 percent for 2001.OR/OE excludes rideshare, paratransit, water taxi and most operating grants.
SAFETY AND SECURITY
Passenger accidents of 6.0 per million miles during 2003 are 2.3 percent lower than2002. Traffic accidents of 32.8 per million miles are 0.7 percent greater than in 2002.Total time-loss and medical injuries increased 6.2 percent to 632 in 2003 from 595 in2002.
Operator injury assaults decreased by four in 2003 compared to 2002. Total operatorassaults were down by 8 to 126. There were 14 passenger injury assaults in 2003compared to 10 in 2002. Total passenger assaults increased 13 percent from 219 in 2002to 248 in 2003.
Operator and Passenger Assaults
Operators Passengers
2003 2002 2003 2002
Injury Assaults 15 19 14 10
Non-Injury Assaults 76 79 227 206
Spitting Incidents 35 36 7 3
Total Assaults 126 134 248 219
Source: Transit Security Database - including Sound Transit service operatedby King County Metro Transit.
Year-End 2003
General Manager’s Quarterly Management Report
4
OPERATING HIGHLIGHTS
New and Enhanced Services
• Added 32,770 annual hours of new bus service, and operated 24,477 additional annual hours ofSound Transit Express service.
• Implemented the September 2003 service change, which included major restructuring to improveservice in north King County and on routes between downtown Seattle, Federal Way andnortheast Tacoma. The changes provided better connections, improved the distribution of serviceand increased use of the Twin Lakes park-and-Ride.
• Improved service to the Hydro Races and Torchlight Parade. This year, King County MetroTransit provided service from the Northgate, Eastgate and Renton Boeing park-and-ride lotsdirectly to the hydro event, with Seafair covering the fares for riders. This service was successfulin increasing ridership by 18.5 percent over last year.
• Promoted Rideshare Plus in the Duwamish area, the Bothell area and Bellevue. Initiated RidesharePlus in partnership with the City of Redmond and Greater Redmond Transportation ManagementAssociation to provide outreach, follow up and incentive distribution.
• Activated service on eight Custom Bus school routes for Overlake, Lakeside, UniversityPreparatory and Evergreen Schools providing about 16 trips per day. The routes are priced at 100percent cost recovery.
• Increased our pass sales distribution network by more than 60 sites to expand the network to 125outlets, improve convenience and access for customer purchases, and positively impact our abilityto provide additional service to our customers. Each month since the expansion, the new outletshave seen a steady rise in pass sales.
• Began electronic processing of all ACCESS ride requests involving transfers. Customers are nowprovided with schedule information at the time they call, rather than later.
• Completed the Route 48 zone consolidation project. Approximately 30 stops were removedresulting in travel-time savings of two to three minutes in each direction.
Passenger Information and Amenities
• Held seven public meetings and formed two sounding boards to gather public input about serviceneeds in the Rainier Valley/Broadway and Ambaum/Delridge areas prior developing serviceproposals.
• Implemented Live Help Chat Service for Lost and Found, per the County Executive's initiative toenhance customer communication options and expand the use of technology for customer service.Customers can now log onto a web page to find out the status of items left on Metro buses.
• Assisted the King County Sheriff's Office in reducing crime and drug activity in the White Centerarea. King County Metro Transit Police units patrolled bus zones where the criminal activity wasoccurring and are working with other King County Metro Transit employees to improve lightingin area shelters.
• Refurbished 30 shelter units and responded to 654 vandalized glass incidents and 1,384 graffitivandalism incidents (non-glass), mostly in bus shelters.
Year-End 2003
General Manager’s Quarterly Management Report
5
• Eliminated the desktop application for Rideshare matching. Implemented a new version ofRideshareOnline.com, the regional Internet ridematch service in Puget Sound, with severalenhancements including the provision of up to 30 names on a match list request, park-and-ride lotlocations visible on the map, the ability to select newest names on the match list, a promotionalemail message for users regarding their company’s rideshare incentives, and an EmployeeTransportation Coordinator (ETC) contact phone number. The new application includes a directlink to MapQuest on the Internet for mapping capability, eliminating the in-house support andmaintenance of map information.
• Implemented the Point-to-Point Schedule on the Metro Online web site. This allows customers tocreate a custom schedule between two locations for a given time span. It shows all the routes thatserve the two locations in the time span as long as no transfer is required. It also shows the exactstops to use and the time that the route is expected at the stops. This information is available forKing, Pierce and Snohomish counties. The results can easily be printed or downloaded to aPersonal Digital Assistant.
Partnerships
• Conducted the UPass survey, a collaborative study between the University of Washington (UW)and King County Metro Transit, to obtain information about commute trip patterns and identifytravel, demographic, and attitudinal characteristics of the UW's students, staff and faculty.
• Executed numerous project agreements with the City of Seattle for bus zone improvements. Oneagreement was for improvements at 17 bus zones along the city's Northeast 65th and 75th/35thNortheast corridor project including improvements for the Route 71 layover.
• Reached agreement with Pierce Transit to develop, implement and evaluate a vanpool faredemonstration in SeaTac. The demonstration would establish one monthly vanpool fare for thetwo agencies for vanpool riders commuting to SeaTac.
• The Community Partnership Program (CPP) managed 22 partnerships in 2003 that operated 45King County Metro Transit-owned, retired vanpool and Paratransit vehicles, to provide 89,489rides. This program increases the mobility options for a number of vulnerable populations whilesaving approximately $25 per ride that was diverted from ACCESS. Over 50 percent of the rideswere provided for people who were eligible for ACCESS transportation and who might otherwisehave used the Metro ADA Paratransit system. The balance was provided for seniors, people withdisabilities, or others with special transportation needs. The average cost for a CPP ride was $5.71compared with $30.62 for an ACCESS ride.
• Installed direct, no-cost telephone access from the transportation desk at Harborview MedicalCenter to ACCESS dispatch. This assistance for outbound Medicaid clients was in cooperationwith Hopelink.
• Reached an agreement with the largest owner of class one high-rise office buildings in the region toencourage new and renewing tenants to commit a portion of their tenant improvement funds forthe purchase of an annual FlexPass. This partnership is the first formal integration of FlexPass intothe leasing practices of major property managers in the region. This will be the model for futureefforts with other property managers in King County's urban centers.
Year-End 2003
General Manager’s Quarterly Management Report
6
• Concluded the Bellevue Trip Reduction Incentive Project's two-month recruitment during which 60downtown Bellevue employers signed up, accounting for a total of almost 1,800 employees. Noneof the participating employers has previously participated in transportation programs. Twelve ofthese employers purchased a total of 340 Area FlexPasses for their employees. The program is apartnership involving King County Metro Transit, Sound Transit, Washington State DOT, and theCity of Bellevue, that takes a performance-based incentive approach to encouraging employers totake steps to reduce single-occupant vehicle travel by their employees.
• Introduced the Hyde Shuttle and Ride Options Hotline in Beacon Hill and South Seattleneighborhoods. The shuttle and hotline are funded by a bequest from the estate of Lillian Hydeand are operated in partnership with Senior Services of King County. They serve seniors andpeople with disabilities registered for ACCESS Transportation in an extended neighborhoodservice area with vehicles, highly interactive information and assistance in locating alternatives toADA Paratransit service. A mailing of over 5,000 pieces went out to possible customers in the area.
• Implemented the Bellevue Community College Go-BCC pass program, a comprehensive multi-modal commute subsidy and incentive program. Bellevue Community College, King CountyMetro Transit, Sound Transit and the City of Bellevue worked together to develop and expand thisprogram.
• Opened Bikestation Seattle, the first Clean Mobility Center in the Pacific Northwest. TheBikestation, a partnership between King County Metro Transit, WestStart, the City of Seattle,Sound Transit and Flexcar, is designed to link public transportation and bicycling in the south partof downtown Seattle. The facility offers secure access bicycle parking, repair and rental; retailservices, alternative mode transportation, and clean fuel car sharing.
Improved Equipment, Facilities and Systems
• Combined the Power and Facilities, Service Development (Route Facilities), and Design andConstruction passenger shelter work plans into a single, integrated shelter plan. Approximately450 shelter units are included.
• Strengthened security controls at both ends of the Downtown Seattle Transit Tunnel. Vehiclebarricades, closed circuit television, active alarm systems, increased lighting and other securitycontrols will be installed to increase facility security.
• Implemented a process to track shop work and equipment in the fleet maintenance work-ordersystem to improve workload management, equipment maintenance and planning.
• Opened the remodeled South Base operations facility. The building features an open conceptdesign that incorporates more light and space including space for a Safety Office, a Training Officeand a small conference room. All staff are on the same floor of the building, which improves theirability to communicate with each other and the operators.
• Converted the Commuter Bonus applications to in-house Sales and Customer Services software.This move puts the application in a secured, managed environment, improves payment accountingand auditing and eliminates a stand-alone custom system requiring dedicated technical staffsupport.
• Took delivery of 38 new ACCESS transportation vans to replace older equipment that is rotatedout of service and sold at auction. The new vans were printed with a slightly different look toreflect the new ACCESS/King County identity.
Year-End 2003
General Manager’s Quarterly Management Report
7
CAPITAL PROGRAM FINANCIAL SUMMARY
Capital expenditures of $113.4 million were primarily for fleet procurement, park-and-rideexpansion and maintaining and improving the operating facilities. Compared with the financial plan,these expenditures represented an accomplishment level of 93 percent.
CAPITAL PROGRAM HIGHLIGHTS
Overview
In 2003, $113.4 million was expended on capital projects. Federal grants funded $40.9 million ofthe total. The largest expenditures were for 100 new low floor buses, park and ride expansion atEastgate and Redondo Heights and updating operating facilities at East and South bases.
In the current financial plan, CIP expenditures were projected to be $121.6 million when adjustedfor planned under-expenditures. This projection is $30 million lower than the previous estimate forthe program. The decrease includes reductions in estimated expenditures for the Eastgate Park-and-Ride lot and a delay in the construction of the Central-Atlantic Base expansion. When compared toactual expenditures, this results in a 93 percent accomplishment rate for the program. The majority ofthe underexpenditures were in projects that are funded by grants or other revenue sources. Thismeans that while expenditures were below projections, revenues were lower by a like amount.Projects with lower than expected expenditures included: Redondo Heights Park-and-Ride, Kent 5thAvenue Parking Ramp, Central-Atlantic Expansion, Regional Fare Coordination System and purchaseof non-revenue vehicles.
Passenger Facilities
• Improvements and Changes to Bus Zone Network: Implemented 1,200 bus sign changes insupport of service changes. Designed and constructed approximately 250 stop improvementprojects. Provided 300 shelters with new or repaired transparent roofs that improve passenger andoperator security. Created and installed 100 shelter murals.
• Initiated corridor facility improvements, including consolidation of bus stops, along several majorroutes such as Aurora Avenue.
• Completed survey and began making improvements at bus stops along routes operated with newlow floor buses. Bus stop improvements allow better access to these accessible vehicles.
• Began design of Burien Transit Center in consultation with the City of Burien. This primarilygrant-funded project is intended to be the first stage of a Transit Oriented Development project inthe area.
• Construction of the Eastgate Park-and-Ride was largely completed by the end of the year.Expanded parking facilities are anticipated to be available for passenger use in 2004.
• Substantially completed construction of Redondo Heights Park-and-Ride lot in the Federal Wayarea. The construction was halted due to winter weather conditions and will be completed in 2004.
• Acquired property for the new Issaquah Highlands Park-and-Ride lot. Final design was completedon the five-story structure that will provide 1,000 parking stalls.
• Completed design for a new leased lot in Kenmore area to relocate park-and-ride capacity from theNorthshore lot. Lot will provide spaces for 220 vehicles and is better located for access to busservice. Construction is scheduled for completion in 2004.
Year-End 2003
General Manager’s Quarterly Management Report
8
Operating Facilities
• Completed majority of design work for modification and retrofit activities for the DowntownSeattle Transit Tunnel. The tunnel is currently scheduled to close in September 2005 formodification for joint bus and light rail operation.
• Nearing completion of remodels at South and East Bases, updating facilities and providingoperational improvements.
• Completed pre-design for Ryerson Base remodel to upgrade existing operating facilities. Inaddition, the property transfer with WSDOT was completed.
• Initiated Base Security Assessment project resulting in identification of improvements to physicalsecurity at operating bases.
• Completed renovation of HVAC system at Component Supply Paint Preparation Bay.• Completed final design and began construction of new employee parking garage at Central-
Atlantic campus. Garage is the first phase of base expansion project. Site preparation includingdemolition of existing buildings occurred in 2003.
• Awarded construction contract for Power Distribution Headquarters Replacement followingconclusion of final design and permitting.
• Continued design work for the Communications Center Relocation getting to 60 percentcompletion by year-end. Responded to council concerns and developed monthly reportingframework to communicate project activities.
• Completed construction of Central Substation Relocation and placed new equipment into service.
Asset Replacement
• Replaced and upgraded servers for a number of key Transit systems. Purchased licenses for largedata storage device to improve and provide more capacity for data backups.
• Completed information systems upgrade activities for Security System and Stop InformationSystem.
• Replaced 336 personal computers, 13 printers, 44 laptops and 4 specialized peripherals that hadreached the end of their useful live based on standard criteria.
• Replaced over 50 non-revenue vehicles that met replacement criteria.
Fleet
• Received 100 standard 40-foot low floor buses, 99 of the vehicles had been placed in revenueservice by year-end. This fleet represents King County’s first acquisition of low floor buses.
• Awarded contract for the purchase of 213 articulated low-floor hybrid diesel/electric buses and 30articulated diesel buses. Except for the prototype, these hybrid buses will be the first of their kindoperated by King County. The hybrid buses will replace the dual powered buses that currentlyoperate in the Downtown Seattle Transit tunnel.
• Purchased 38 vans for the ACCESS program.
Year-End 2003
General Manager’s Quarterly Management Report
9
All Other
• Began installation of new mobile data terminals on ACCESS vehicles in August. At year-end, twoof the five operating bases had been equipped with new system. Full system implementation isplanned for March 2004. In addition, development and testing of the new broker computer systemwas conducted with the system scheduled for installation in early 2004.
• Purchased and installed Automated Vehicle Passenger Counters on new vans and buses to meetour sampling requirements.
• Completed design for operator comfort stations at Rainier Avenue and South Henderson and theTukwila Park-and-Ride.
• Completed installation of Digital Video Recording systems on 95 coaches including retrofitting ofsystem components. By year-end, approximately 75 percent of the infrastructure needed tocomplete the wireless transfer of alarm files was complete.
• Continued project planning for Montlake Bike Station project that will include expanded bikelockers and increased capacity for bicycle storage and access.
• Continued efforts to improve the speed and reliability of transit service by working withjurisdictions to remove street parking in congested corridors such as the intersections of 85th and105th in Seattle, along University Avenue in Seattle, along Lake City Way and in the City of DesMoines along SR-99S.
• Awarded contract for $1.2 million for traffic engineering support for the regional transit signalpriority effort.
• Awarded vendor contract for implementation of the Regional Fare Coordination System (SmartCard). Completed interlocal agreement with the seven participating agencies, received initialproject schedule from vendor and began conceptual design process.
• Completed overall system design for a replacement of the aging Radio System. Begandevelopment of a request for proposals that was subsequently put on hold awaiting future councilaction.
Year-End 2003
General Manager’s Quarterly Management ReportD
eta
iled
Fin
an
cial
an
d O
pera
tin
g D
ata
10
PU
BL
IC T
RA
NS
PO
RT
AT
ION
FU
ND
RE
VE
NU
ES
—y
ear-
to-d
ate
thro
ug
h D
ecem
ber
Pu
bli
c T
ran
spo
rta
tio
n S
ub
-Fu
nd
s
Re
ve
nu
e F
lee
tC
ross
Bo
rde
r2
00
3 A
do
pte
dS
ou
rce
Op
era
tin
gC
ap
ital1
Re
pla
cem
en
tL
ea
seT
OT
AL
Bu
dg
et
Op
era
tio
ns
Cas
h a
nd
Tic
ket
s...
......
......
......
......
......
......
.....
$26,
147,
845
$26,
147,
845
Pas
ses
......
......
......
......
......
......
......
......
......
......
...$4
1,71
4,42
2$4
1,71
4,42
2
Oth
er2...
......
......
......
......
......
......
......
......
......
......
..$6
,215
,162
$9,7
30$6
,224
,892
S
ubt
otal
Tra
nsi
t O
pera
tion
s...
......
......
......
....$
74,0
77,4
29$9
,730
$74,
087,
159
$79,
541,
572
Van
po
ol
Op
erat
ion
s...
......
......
......
......
......
......
. $3,
728,
697
$1,2
37,0
00$4
,965
,697
$5,0
74,3
50
Par
atra
nsi
t O
per
atio
ns
......
......
......
......
......
......
...$4
58,6
12$4
58,6
12$4
11,0
10
T
otal
Ope
rati
ons
......
......
......
......
......
......
......
..$7
8,26
4,73
8$1
,246
,730
$0$0
$79,
511,
468
$85,
026,
932
No
n-O
pe
rati
on
s
Sal
es T
ax...
......
......
......
......
......
......
......
......
.....
$224
,064
,376
$74,
688,
125
$0$0
$298
,752
,501
$302
,198
,931
Gra
nts
3...
......
......
......
......
......
......
......
......
......
......
$4,8
39,5
96$4
0,93
8,70
0$1
8,79
5,19
7$0
$64,
573,
493
$90,
266,
394
Oth
er K
ing
Co
un
ty F
un
ds4
......
......
......
......
.....
$1,3
26,7
19$0
$0$0
$1,3
26,7
19$1
,332
,611
So
un
d T
ran
sit
Ser
vic
e C
on
trib
uti
on
s5...
......
$22,
119,
763
$5,1
15$0
$0$2
2,12
4,87
8$2
0,92
2,81
6
Oth
er N
on
-Op
erat
ion
s6...
......
......
......
......
......
..$1
,884
,221
$7,4
90,2
11$5
,077
,684
$1,6
89,1
93$1
6,14
1,30
9$2
2,83
6,06
5
T
otal
Non
-Ope
rati
ons
......
......
......
......
......
...$2
54,2
34,6
75$1
23,1
22,1
51$2
3,87
2,88
1$1
,689
,193
$402
,918
,900
$437
,556
,817
TO
TA
L R
EV
EN
UE
TH
RO
UG
H Y
EA
R-E
ND
20
03
...................$
332,
499,
413
$124
,368
,881
$23,
872,
881
$1,6
89,1
93$4
82,4
30,3
68$5
22,5
83,7
49
TO
TA
L R
EV
EN
UE
TH
RO
UG
H Y
EA
R-E
ND
20
02
........................
.................
$485
,728
,035
1C
apit
al F
un
d a
nd
Bo
nd
Fu
nd
are
co
mb
ined
.2C
on
trac
t se
rvic
e, R
ide
Fre
e A
rea
and
tra
nsi
t ad
ver
tisi
ng
in
com
e.3G
ran
t re
imb
urs
emen
ts a
re s
ub
ject
to
exp
end
itu
res
on
eli
gib
le p
roje
cts.
Un
der
exp
end
itu
res
in t
hes
e p
roje
cts
resu
lt i
n l
ess
rev
enu
e b
ein
g r
eco
gn
ized
.4P
aym
ent
by
Ro
ads,
Fle
et a
nd
Air
po
rt f
un
ds
for
serv
ices
dir
ectl
y s
up
po
rtin
g t
hei
r fu
nct
ion
s ra
ther
th
an K
ing
Co
un
ty M
etro
pu
bli
c tr
ansp
ort
atio
n.
5P
aym
ent
by
So
un
d T
ran
sit
for
serv
ices
dir
ectl
y s
up
po
rtin
g t
hei
r fu
nct
ion
s.6In
ves
tmen
t in
com
e an
d o
ther
mis
cell
aneo
us,
no
n-o
per
atio
ns
rev
enu
e.
Year-End 2003
General Manager’s Quarterly Management Report
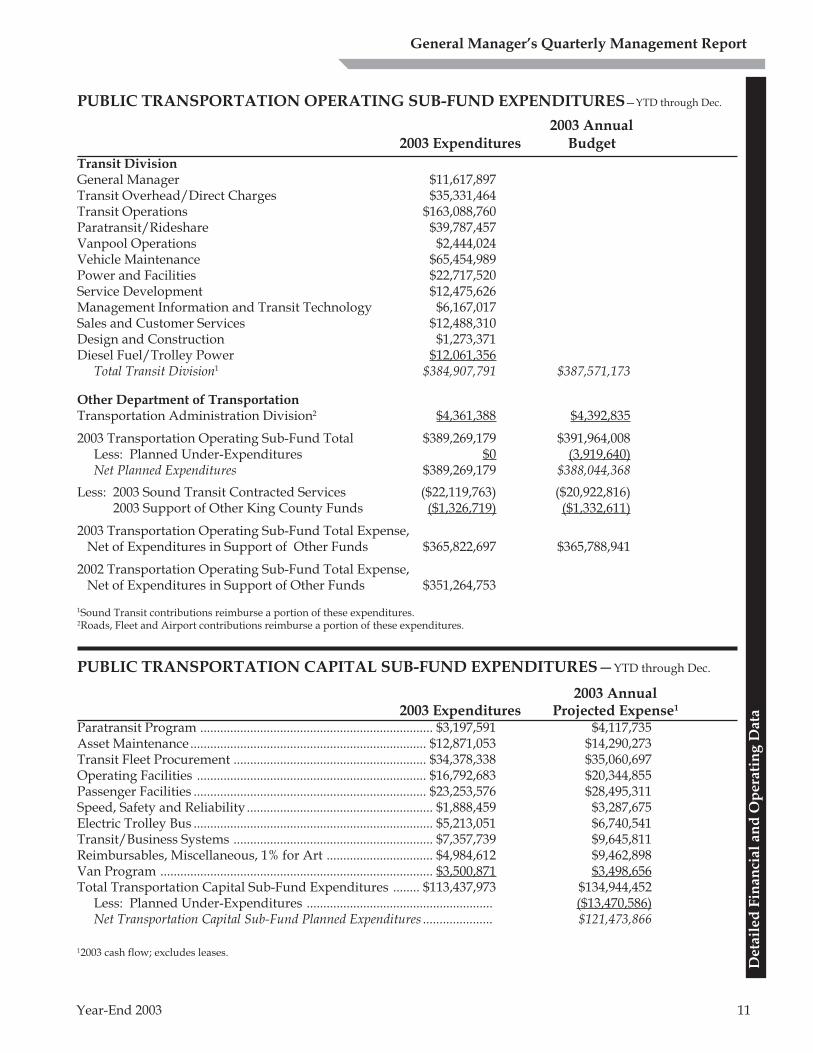
PUBLIC TRANSPORTATION OPERATING SUB-FUND EXPENDITURES—YTD through Dec.
2003 Annual2003 Expenditures Budget
Transit DivisionGeneral Manager $11,617,897Transit Overhead/Direct Charges $35,331,464Transit Operations $163,088,760Paratransit/Rideshare $39,787,457Vanpool Operations $2,444,024Vehicle Maintenance $65,454,989Power and Facilities $22,717,520Service Development $12,475,626Management Information and Transit Technology $6,167,017Sales and Customer Services $12,488,310Design and Construction $1,273,371Diesel Fuel/Trolley Power $12,061,356 Total Transit Division1 $384,907,791 $387,571,173
Other Department of TransportationTransportation Administration Division2 $4,361,388 $4,392,835
2003 Transportation Operating Sub-Fund Total $389,269,179 $391,964,008 Less: Planned Under-Expenditures $0 (3,919,640) Net Planned Expenditures $389,269,179 $388,044,368
Less: 2003 Sound Transit Contracted Services ($22,119,763) ($20,922,816)2003 Support of Other King County Funds ($1,326,719) ($1,332,611)
2003 Transportation Operating Sub-Fund Total Expense, Net of Expenditures in Support of Other Funds $365,822,697 $365,788,941
2002 Transportation Operating Sub-Fund Total Expense, Net of Expenditures in Support of Other Funds $351,264,753
1Sound Transit contributions reimburse a portion of these expenditures.2Roads, Fleet and Airport contributions reimburse a portion of these expenditures.
PUBLIC TRANSPORTATION CAPITAL SUB-FUND EXPENDITURES—YTD through Dec.
2003 Annual2003 Expenditures Projected Expense1
Paratransit Program ...................................................................... $3,197,591 $4,117,735Asset Maintenance....................................................................... $12,871,053 $14,290,273Transit Fleet Procurement .......................................................... $34,378,338 $35,060,697Operating Facilities ..................................................................... $16,792,683 $20,344,855Passenger Facilities ...................................................................... $23,253,576 $28,495,311Speed, Safety and Reliability ........................................................ $1,888,459 $3,287,675Electric Trolley Bus ........................................................................ $5,213,051 $6,740,541Transit/Business Systems ............................................................ $7,357,739 $9,645,811Reimbursables, Miscellaneous, 1% for Art ................................ $4,984,612 $9,462,898Van Program .................................................................................. $3,500,871 $3,498,656Total Transportation Capital Sub-Fund Expenditures ........ $113,437,973 $134,944,452 Less: Planned Under-Expenditures ........................................................ ($13,470,586) Net Transportation Capital Sub-Fund Planned Expenditures ..................... $121,473,866
12003 cash flow; excludes leases.
Deta
iled
Fin
an
cial
an
d O
pera
tin
g D
ata
11
Year-End 2003
General Manager’s Quarterly Management Report
Deta
iled
Fin
an
cial
an
d O
pera
tin
g D
ata
Deta
iled
Fin
an
cial
an
d O
pera
tin
g D
ata
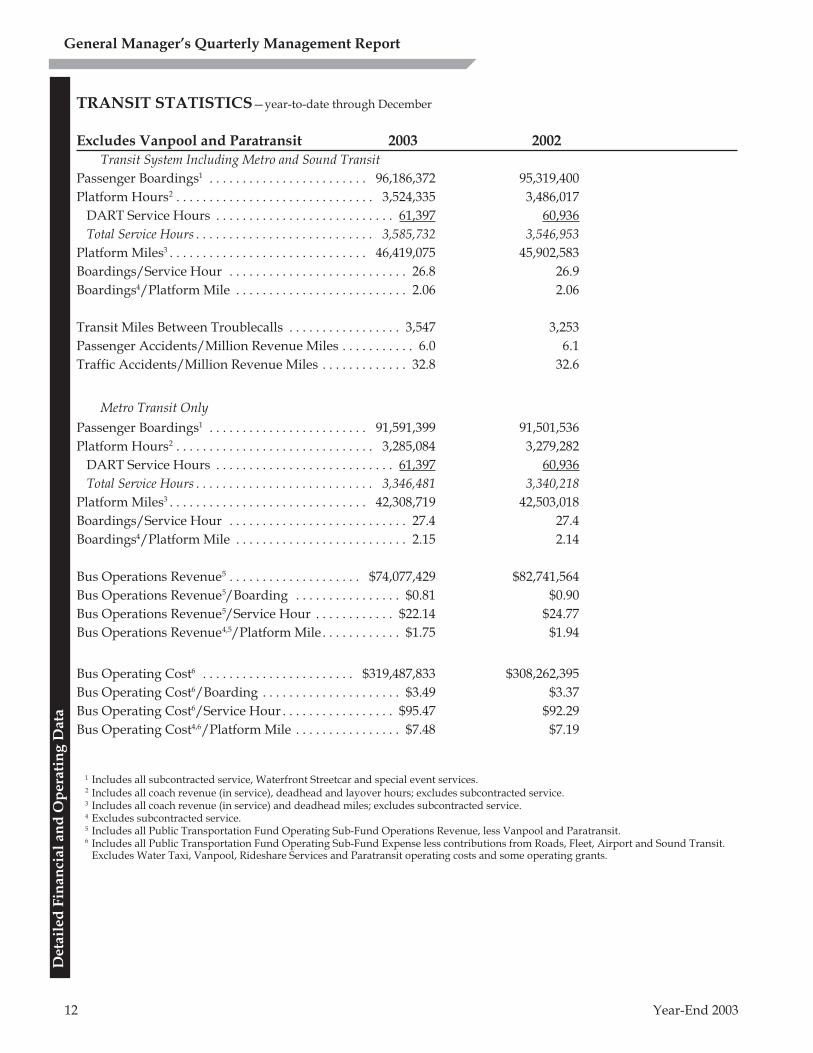
TRANSIT STATISTICS—year-to-date through December
Excludes Vanpool and Paratransit 2003 2002
Transit System Including Metro and Sound Transit
Passenger Boardings1 . . . . . . . . . . . . . . . . . . . . . . . . 96,186,372 95,319,400
Platform Hours2 . . . . . . . . . . . . . . . . . . . . . . . . . . . . . . 3,524,335 3,486,017
DART Service Hours . . . . . . . . . . . . . . . . . . . . . . . . . . . 61,397 60,936
Total Service Hours . . . . . . . . . . . . . . . . . . . . . . . . . . . 3,585,732 3,546,953
Platform Miles3 . . . . . . . . . . . . . . . . . . . . . . . . . . . . . . 46,419,075 45,902,583
Boardings/Service Hour . . . . . . . . . . . . . . . . . . . . . . . . . . . 26.8 26.9
Boardings4/Platform Mile . . . . . . . . . . . . . . . . . . . . . . . . . . 2.06 2.06
Transit Miles Between Troublecalls . . . . . . . . . . . . . . . . . 3,547 3,253
Passenger Accidents/Million Revenue Miles . . . . . . . . . . . 6.0 6.1
Traffic Accidents/Million Revenue Miles . . . . . . . . . . . . . 32.8 32.6
Metro Transit Only
Passenger Boardings1 . . . . . . . . . . . . . . . . . . . . . . . . 91,591,399 91,501,536
Platform Hours2 . . . . . . . . . . . . . . . . . . . . . . . . . . . . . . 3,285,084 3,279,282
DART Service Hours . . . . . . . . . . . . . . . . . . . . . . . . . . . 61,397 60,936
Total Service Hours . . . . . . . . . . . . . . . . . . . . . . . . . . . 3,346,481 3,340,218
Platform Miles3 . . . . . . . . . . . . . . . . . . . . . . . . . . . . . . 42,308,719 42,503,018
Boardings/Service Hour . . . . . . . . . . . . . . . . . . . . . . . . . . . 27.4 27.4
Boardings4/Platform Mile . . . . . . . . . . . . . . . . . . . . . . . . . . 2.15 2.14
Bus Operations Revenue5 . . . . . . . . . . . . . . . . . . . . $74,077,429 $82,741,564
Bus Operations Revenue5/Boarding . . . . . . . . . . . . . . . . $0.81 $0.90
Bus Operations Revenue5/Service Hour . . . . . . . . . . . . $22.14 $24.77
Bus Operations Revenue4,5/Platform Mile . . . . . . . . . . . . $1.75 $1.94
Bus Operating Cost6 . . . . . . . . . . . . . . . . . . . . . . . $319,487,833 $308,262,395
Bus Operating Cost6/Boarding . . . . . . . . . . . . . . . . . . . . . $3.49 $3.37
Bus Operating Cost6/Service Hour . . . . . . . . . . . . . . . . . $95.47 $92.29
Bus Operating Cost4,6/Platform Mile . . . . . . . . . . . . . . . . $7.48 $7.19
1 Includes all subcontracted service, Waterfront Streetcar and special event services.2 Includes all coach revenue (in service), deadhead and layover hours; excludes subcontracted service.3 Includes all coach revenue (in service) and deadhead miles; excludes subcontracted service.4 Excludes subcontracted service.5 Includes all Public Transportation Fund Operating Sub-Fund Operations Revenue, less Vanpool and Paratransit.6 Includes all Public Transportation Fund Operating Sub-Fund Expense less contributions from Roads, Fleet, Airport and Sound Transit.
Excludes Water Taxi, Vanpool, Rideshare Services and Paratransit operating costs and some operating grants.
Deta
iled
Fin
an
cial
an
d O
pera
tin
g D
ata
12
Year-End 2003
General Manager’s Quarterly Management Report
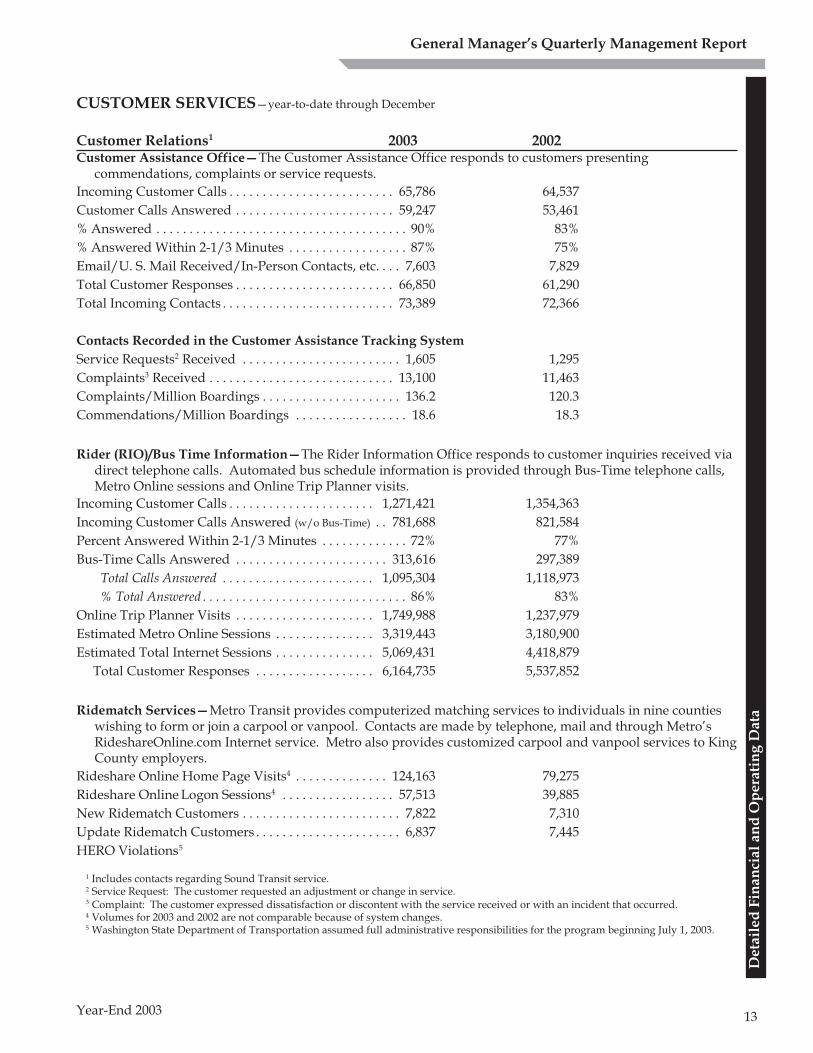
CUSTOMER SERVICES—year-to-date through December
Customer Relations1 2003 2002Customer Assistance Office—The Customer Assistance Office responds to customers presenting
commendations, complaints or service requests.
Incoming Customer Calls . . . . . . . . . . . . . . . . . . . . . . . . . 65,786 64,537
Customer Calls Answered . . . . . . . . . . . . . . . . . . . . . . . . 59,247 53,461
% Answered . . . . . . . . . . . . . . . . . . . . . . . . . . . . . . . . . . . . . . 90% 83%
% Answered Within 2-1/3 Minutes . . . . . . . . . . . . . . . . . . 87% 75%
Email/U. S. Mail Received/In-Person Contacts, etc. . . . 7,603 7,829
Total Customer Responses . . . . . . . . . . . . . . . . . . . . . . . . 66,850 61,290
Total Incoming Contacts . . . . . . . . . . . . . . . . . . . . . . . . . . 73,389 72,366
Contacts Recorded in the Customer Assistance Tracking System
Service Requests2 Received . . . . . . . . . . . . . . . . . . . . . . . . 1,605 1,295
Complaints3 Received . . . . . . . . . . . . . . . . . . . . . . . . . . . . 13,100 11,463
Complaints/Million Boardings . . . . . . . . . . . . . . . . . . . . . 136.2 120.3
Commendations/Million Boardings . . . . . . . . . . . . . . . . . 18.6 18.3
Rider (RIO)/Bus Time Information—The Rider Information Office responds to customer inquiries received viadirect telephone calls. Automated bus schedule information is provided through Bus-Time telephone calls,Metro Online sessions and Online Trip Planner visits.
Incoming Customer Calls . . . . . . . . . . . . . . . . . . . . . . 1,271,421 1,354,363
Incoming Customer Calls Answered (w/o Bus-Time) . . 781,688 821,584
Percent Answered Within 2-1/3 Minutes . . . . . . . . . . . . . 72% 77%
Bus-Time Calls Answered . . . . . . . . . . . . . . . . . . . . . . . 313,616 297,389
Total Calls Answered . . . . . . . . . . . . . . . . . . . . . . . 1,095,304 1,118,973
% Total Answered . . . . . . . . . . . . . . . . . . . . . . . . . . . . . . . 86% 83%
Online Trip Planner Visits . . . . . . . . . . . . . . . . . . . . . 1,749,988 1,237,979
Estimated Metro Online Sessions . . . . . . . . . . . . . . . 3,319,443 3,180,900
Estimated Total Internet Sessions . . . . . . . . . . . . . . . 5,069,431 4,418,879
Total Customer Responses . . . . . . . . . . . . . . . . . . 6,164,735 5,537,852
Ridematch Services—Metro Transit provides computerized matching services to individuals in nine countieswishing to form or join a carpool or vanpool. Contacts are made by telephone, mail and through Metro’sRideshareOnline.com Internet service. Metro also provides customized carpool and vanpool services to KingCounty employers.
Rideshare Online Home Page Visits4 . . . . . . . . . . . . . . 124,163 79,275
Rideshare Online Logon Sessions4 . . . . . . . . . . . . . . . . . 57,513 39,885
New Ridematch Customers . . . . . . . . . . . . . . . . . . . . . . . . 7,822 7,310
Update Ridematch Customers . . . . . . . . . . . . . . . . . . . . . . 6,837 7,445
HERO Violations5
1 Includes contacts regarding Sound Transit service.2 Service Request: The customer requested an adjustment or change in service.3 Complaint: The customer expressed dissatisfaction or discontent with the service received or with an incident that occurred.4 Volumes for 2003 and 2002 are not comparable because of system changes.5 Washington State Department of Transportation assumed full administrative responsibilities for the program beginning July 1, 2003.
13
Deta
iled
Fin
an
cial
an
d O
pera
tin
g D
ata
Year-End 2003
General Manager’s Quarterly Management Report
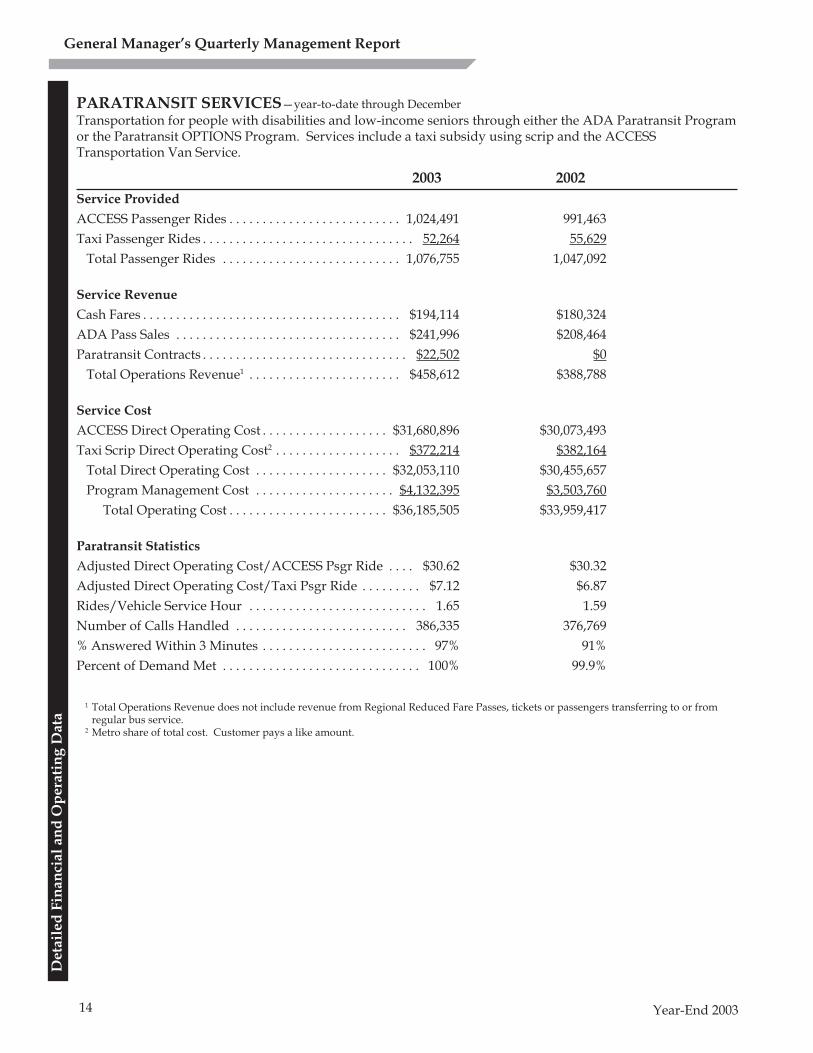
PARATRANSIT SERVICES—year-to-date through December
Transportation for people with disabilities and low-income seniors through either the ADA Paratransit Programor the Paratransit OPTIONS Program. Services include a taxi subsidy using scrip and the ACCESSTransportation Van Service.
2003 2002
Service Provided
ACCESS Passenger Rides . . . . . . . . . . . . . . . . . . . . . . . . . . 1,024,491 991,463
Taxi Passenger Rides . . . . . . . . . . . . . . . . . . . . . . . . . . . . . . . . 52,264 55,629
Total Passenger Rides . . . . . . . . . . . . . . . . . . . . . . . . . . . 1,076,755 1,047,092
Service Revenue
Cash Fares . . . . . . . . . . . . . . . . . . . . . . . . . . . . . . . . . . . . . . . $194,114 $180,324
ADA Pass Sales . . . . . . . . . . . . . . . . . . . . . . . . . . . . . . . . . . $241,996 $208,464
Paratransit Contracts . . . . . . . . . . . . . . . . . . . . . . . . . . . . . . . $22,502 $0
Total Operations Revenue1 . . . . . . . . . . . . . . . . . . . . . . . $458,612 $388,788
Service Cost
ACCESS Direct Operating Cost . . . . . . . . . . . . . . . . . . . $31,680,896 $30,073,493
Taxi Scrip Direct Operating Cost2 . . . . . . . . . . . . . . . . . . . $372,214 $382,164
Total Direct Operating Cost . . . . . . . . . . . . . . . . . . . . $32,053,110 $30,455,657
Program Management Cost . . . . . . . . . . . . . . . . . . . . . $4,132,395 $3,503,760
Total Operating Cost . . . . . . . . . . . . . . . . . . . . . . . . $36,185,505 $33,959,417
Paratransit Statistics
Adjusted Direct Operating Cost/ACCESS Psgr Ride . . . . $30.62 $30.32
Adjusted Direct Operating Cost/Taxi Psgr Ride . . . . . . . . . $7.12 $6.87
Rides/Vehicle Service Hour . . . . . . . . . . . . . . . . . . . . . . . . . . . 1.65 1.59
Number of Calls Handled . . . . . . . . . . . . . . . . . . . . . . . . . . 386,335 376,769
% Answered Within 3 Minutes . . . . . . . . . . . . . . . . . . . . . . . . . 97% 91%
Percent of Demand Met . . . . . . . . . . . . . . . . . . . . . . . . . . . . . . 100% 99.9%
1 Total Operations Revenue does not include revenue from Regional Reduced Fare Passes, tickets or passengers transferring to or fromregular bus service.
2 Metro share of total cost. Customer pays a like amount.
Deta
iled
Fin
an
cial
an
d O
pera
tin
g D
ata
14
Year-End 2003
General Manager’s Quarterly Management Report
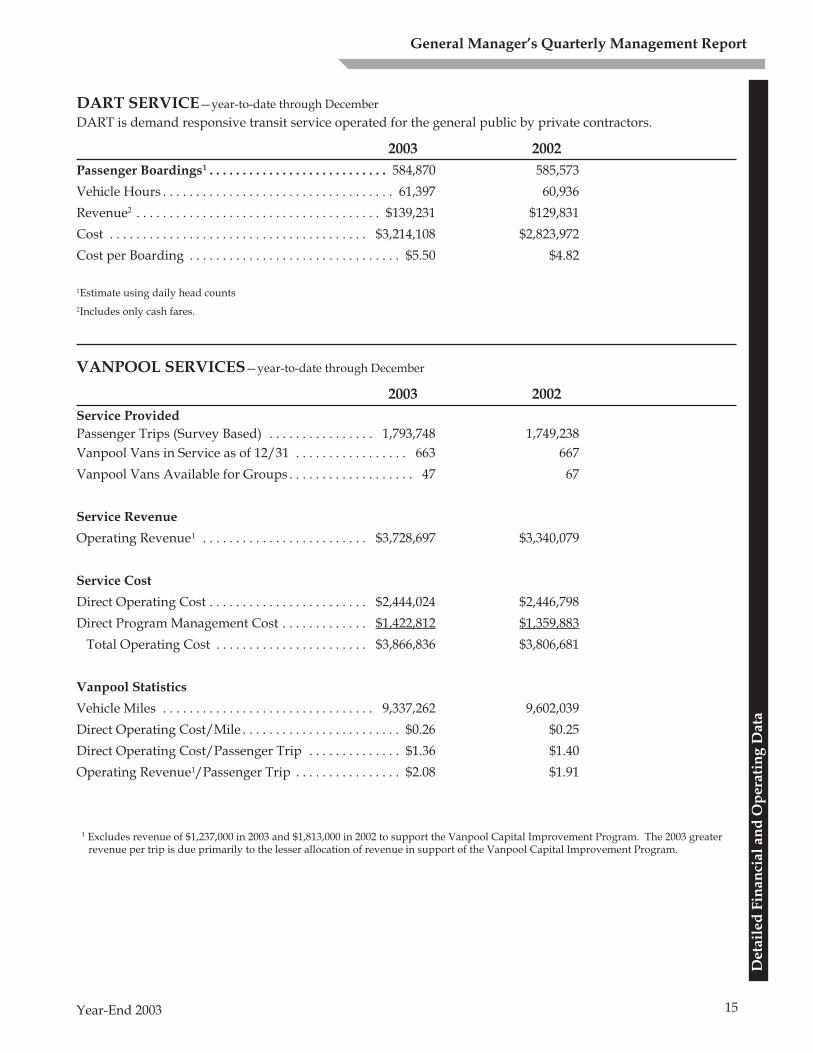
DART SERVICE—year-to-date through December
DART is demand responsive transit service operated for the general public by private contractors.
2003 2002
Passenger Boardings1 . . . . . . . . . . . . . . . . . . . . . . . . . . . 584,870 585,573
Vehicle Hours . . . . . . . . . . . . . . . . . . . . . . . . . . . . . . . . . . . 61,397 60,936
Revenue2 . . . . . . . . . . . . . . . . . . . . . . . . . . . . . . . . . . . . . $139,231 $129,831
Cost . . . . . . . . . . . . . . . . . . . . . . . . . . . . . . . . . . . . . . . $3,214,108 $2,823,972
Cost per Boarding . . . . . . . . . . . . . . . . . . . . . . . . . . . . . . . . $5.50 $4.82
1Estimate using daily head counts
2Includes only cash fares.
VANPOOL SERVICES—year-to-date through December
2003 2002
Service Provided
Passenger Trips (Survey Based) . . . . . . . . . . . . . . . . 1,793,748 1,749,238
Vanpool Vans in Service as of 12/31 . . . . . . . . . . . . . . . . . 663 667
Vanpool Vans Available for Groups . . . . . . . . . . . . . . . . . . . 47 67
Service Revenue
Operating Revenue1 . . . . . . . . . . . . . . . . . . . . . . . . . $3,728,697 $3,340,079
Service Cost
Direct Operating Cost . . . . . . . . . . . . . . . . . . . . . . . . $2,444,024 $2,446,798
Direct Program Management Cost . . . . . . . . . . . . . $1,422,812 $1,359,883
Total Operating Cost . . . . . . . . . . . . . . . . . . . . . . . $3,866,836 $3,806,681
Vanpool Statistics
Vehicle Miles . . . . . . . . . . . . . . . . . . . . . . . . . . . . . . . . 9,337,262 9,602,039
Direct Operating Cost/Mile . . . . . . . . . . . . . . . . . . . . . . . . $0.26 $0.25
Direct Operating Cost/Passenger Trip . . . . . . . . . . . . . . $1.36 $1.40
Operating Revenue1/Passenger Trip . . . . . . . . . . . . . . . . $2.08 $1.91
1 Excludes revenue of $1,237,000 in 2003 and $1,813,000 in 2002 to support the Vanpool Capital Improvement Program. The 2003 greaterrevenue per trip is due primarily to the lesser allocation of revenue in support of the Vanpool Capital Improvement Program.
Deta
iled
Fin
an
cial
an
d O
pera
tin
g D
ata
15
Year-End 2003
General Manager’s Quarterly Management ReportD
eta
iled
Fin
an
cial
an
d O
pera
tin
g D
ata
16
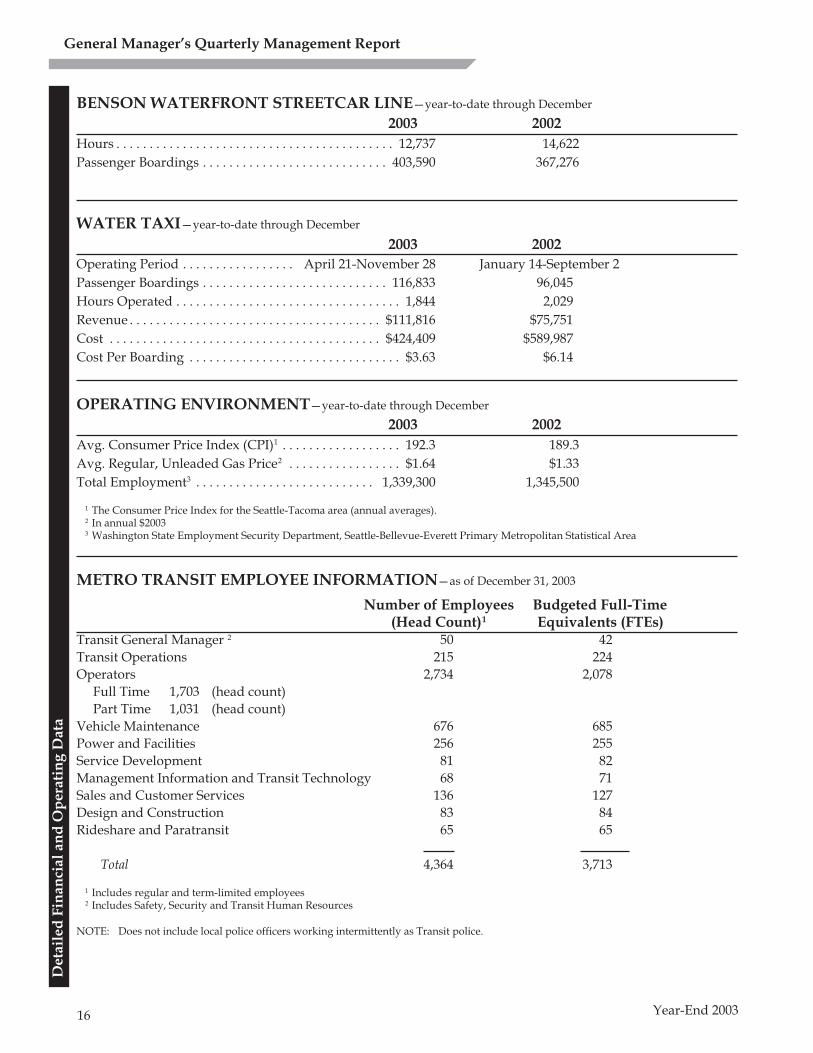
BENSON WATERFRONT STREETCAR LINE—year-to-date through December
2003 2002
Hours . . . . . . . . . . . . . . . . . . . . . . . . . . . . . . . . . . . . . . . . . . 12,737 14,622
Passenger Boardings . . . . . . . . . . . . . . . . . . . . . . . . . . . . 403,590 367,276
WATER TAXI—year-to-date through December
2003 2002
Operating Period . . . . . . . . . . . . . . . . . April 21-November 28 January 14-September 2
Passenger Boardings . . . . . . . . . . . . . . . . . . . . . . . . . . . . 116,833 96,045
Hours Operated . . . . . . . . . . . . . . . . . . . . . . . . . . . . . . . . . . 1,844 2,029
Revenue . . . . . . . . . . . . . . . . . . . . . . . . . . . . . . . . . . . . . . $111,816 $75,751
Cost . . . . . . . . . . . . . . . . . . . . . . . . . . . . . . . . . . . . . . . . . $424,409 $589,987
Cost Per Boarding . . . . . . . . . . . . . . . . . . . . . . . . . . . . . . . . $3.63 $6.14
OPERATING ENVIRONMENT—year-to-date through December
2003 2002
Avg. Consumer Price Index (CPI)1 . . . . . . . . . . . . . . . . . . 192.3 189.3
Avg. Regular, Unleaded Gas Price2 . . . . . . . . . . . . . . . . . $1.64 $1.33
Total Employment3 . . . . . . . . . . . . . . . . . . . . . . . . . . . 1,339,300 1,345,500
1 The Consumer Price Index for the Seattle-Tacoma area (annual averages).2 In annual $20033 Washington State Employment Security Department, Seattle-Bellevue-Everett Primary Metropolitan Statistical Area
METRO TRANSIT EMPLOYEE INFORMATION—as of December 31, 2003
Number of Employees Budgeted Full-Time(Head Count)1 Equivalents (FTEs)
Transit General Manager 2 50 42
Transit Operations 215 224
Operators 2,734 2,078
Full Time 1,703 (head count)
Part Time 1,031 (head count)
Vehicle Maintenance 676 685
Power and Facilities 256 255
Service Development 81 82
Management Information and Transit Technology 68 71
Sales and Customer Services 136 127
Design and Construction 83 84
Rideshare and Paratransit 65 65
Total 4,364 3,713
1 Includes regular and term-limited employees2 Includes Safety, Security and Transit Human Resources
NOTE: Does not include local police officers working intermittently as Transit police.
Year-End 2003
General Manager’s Quarterly Management Report
Deta
iled
Fin
an
cial
an
d O
pera
tin
g D
ata
17
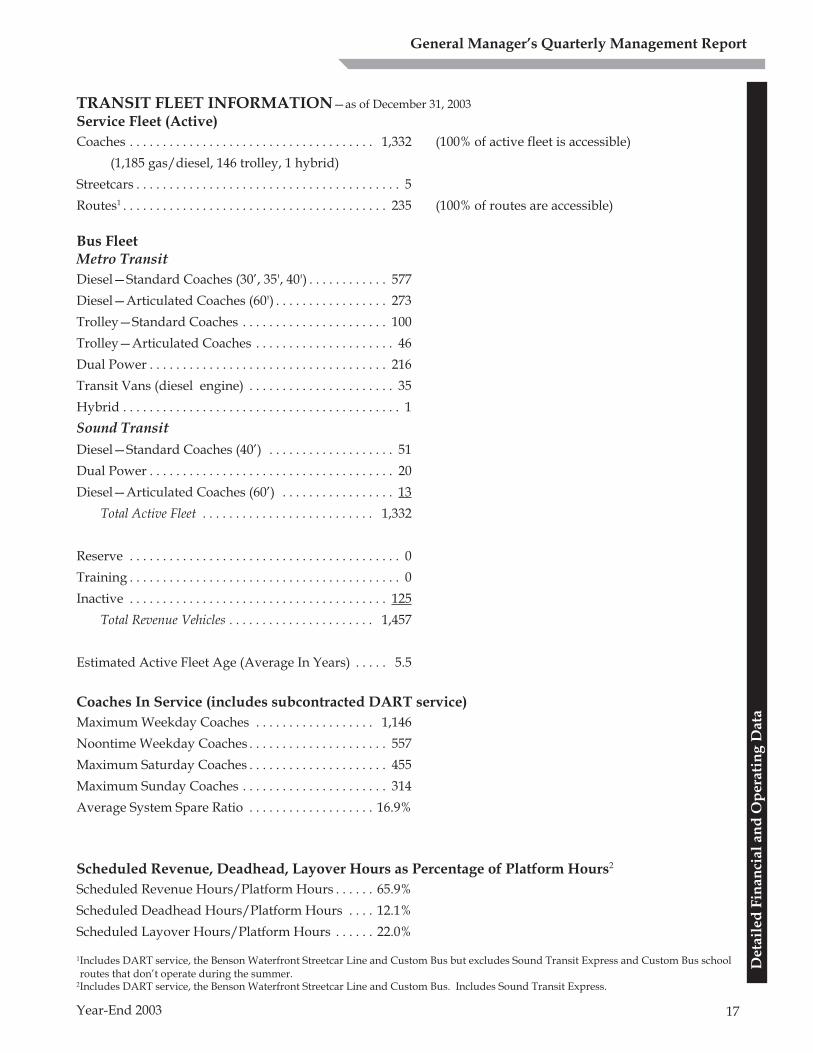
TRANSIT FLEET INFORMATION—as of December 31, 2003
Service Fleet (Active)
Coaches . . . . . . . . . . . . . . . . . . . . . . . . . . . . . . . . . . . . . 1,332 (100% of active fleet is accessible)
(1,185 gas/diesel, 146 trolley, 1 hybrid)
Streetcars . . . . . . . . . . . . . . . . . . . . . . . . . . . . . . . . . . . . . . . . 5
Routes1 . . . . . . . . . . . . . . . . . . . . . . . . . . . . . . . . . . . . . . . . 235 (100% of routes are accessible)
Bus FleetMetro Transit
Diesel—Standard Coaches (30’, 35', 40') . . . . . . . . . . . . 577
Diesel—Articulated Coaches (60') . . . . . . . . . . . . . . . . . 273
Trolley—Standard Coaches . . . . . . . . . . . . . . . . . . . . . . 100
Trolley—Articulated Coaches . . . . . . . . . . . . . . . . . . . . . 46
Dual Power . . . . . . . . . . . . . . . . . . . . . . . . . . . . . . . . . . . . 216
Transit Vans (diesel engine) . . . . . . . . . . . . . . . . . . . . . . 35
Hybrid . . . . . . . . . . . . . . . . . . . . . . . . . . . . . . . . . . . . . . . . . . 1
Sound Transit
Diesel—Standard Coaches (40’) . . . . . . . . . . . . . . . . . . . 51
Dual Power . . . . . . . . . . . . . . . . . . . . . . . . . . . . . . . . . . . . . 20
Diesel—Articulated Coaches (60’) . . . . . . . . . . . . . . . . . 13
Total Active Fleet . . . . . . . . . . . . . . . . . . . . . . . . . . 1,332
Reserve . . . . . . . . . . . . . . . . . . . . . . . . . . . . . . . . . . . . . . . . . 0
Training . . . . . . . . . . . . . . . . . . . . . . . . . . . . . . . . . . . . . . . . . 0
Inactive . . . . . . . . . . . . . . . . . . . . . . . . . . . . . . . . . . . . . . . 125
Total Revenue Vehicles . . . . . . . . . . . . . . . . . . . . . . 1,457
Estimated Active Fleet Age (Average In Years) . . . . . 5.5
Coaches In Service (includes subcontracted DART service)
Maximum Weekday Coaches . . . . . . . . . . . . . . . . . . 1,146
Noontime Weekday Coaches . . . . . . . . . . . . . . . . . . . . . 557
Maximum Saturday Coaches . . . . . . . . . . . . . . . . . . . . . 455
Maximum Sunday Coaches . . . . . . . . . . . . . . . . . . . . . . 314
Average System Spare Ratio . . . . . . . . . . . . . . . . . . . 16.9%
Scheduled Revenue, Deadhead, Layover Hours as Percentage of Platform Hours2
Scheduled Revenue Hours/Platform Hours . . . . . . 65.9%
Scheduled Deadhead Hours/Platform Hours . . . . 12.1%
Scheduled Layover Hours/Platform Hours . . . . . . 22.0%
1Includes DART service, the Benson Waterfront Streetcar Line and Custom Bus but excludes Sound Transit Express and Custom Bus schoolroutes that don’t operate during the summer.
2Includes DART service, the Benson Waterfront Streetcar Line and Custom Bus. Includes Sound Transit Express.
Year-End 2003
General Manager’s Quarterly Management Report
18
Deta
iled
Fin
an
cial
an
d O
pera
tin
g D
ata
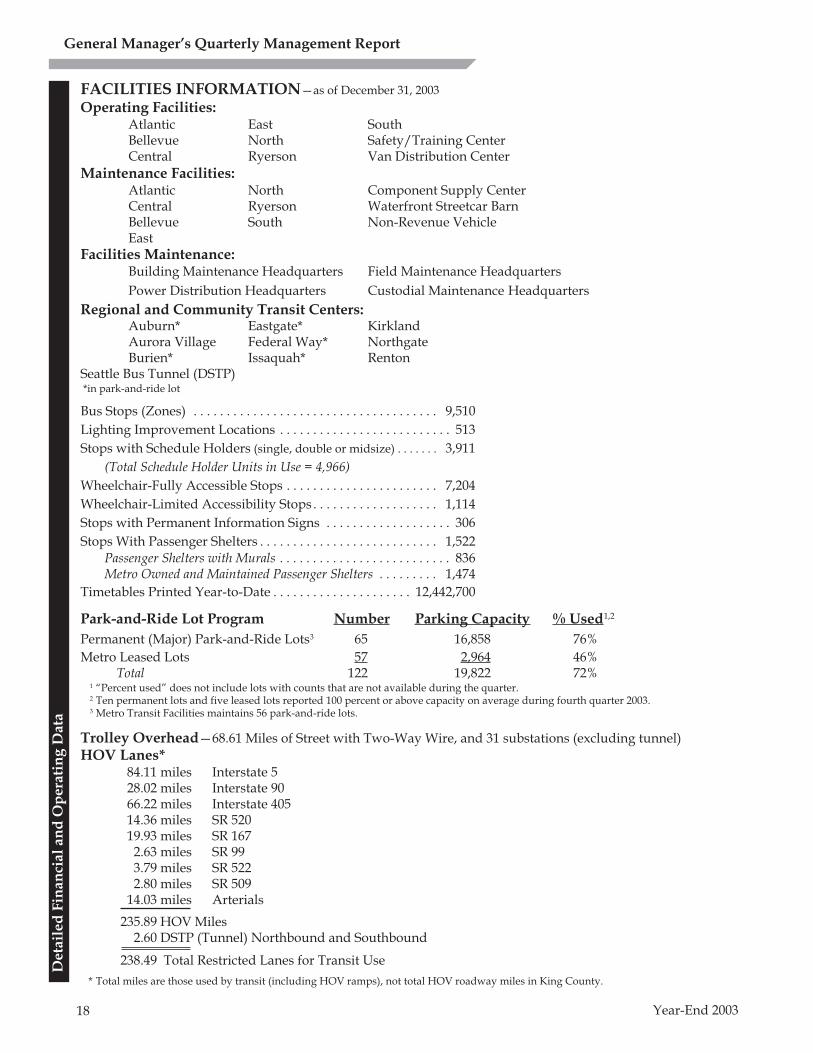
FACILITIES INFORMATION—as of December 31, 2003
Operating Facilities:Atlantic East SouthBellevue North Safety/Training CenterCentral Ryerson Van Distribution Center
Maintenance Facilities:Atlantic North Component Supply CenterCentral Ryerson Waterfront Streetcar BarnBellevue South Non-Revenue VehicleEast
Facilities Maintenance:Building Maintenance Headquarters Field Maintenance Headquarters
Power Distribution Headquarters Custodial Maintenance Headquarters
Regional and Community Transit Centers:Auburn* Eastgate* KirklandAurora Village Federal Way* NorthgateBurien* Issaquah* Renton
Seattle Bus Tunnel (DSTP) *in park-and-ride lot
Bus Stops (Zones) . . . . . . . . . . . . . . . . . . . . . . . . . . . . . . . . . . . . . 9,510
Lighting Improvement Locations . . . . . . . . . . . . . . . . . . . . . . . . . . 513
Stops with Schedule Holders (single, double or midsize) . . . . . . . 3,911
(Total Schedule Holder Units in Use = 4,966)
Wheelchair-Fully Accessible Stops . . . . . . . . . . . . . . . . . . . . . . . 7,204
Wheelchair-Limited Accessibility Stops . . . . . . . . . . . . . . . . . . . 1,114
Stops with Permanent Information Signs . . . . . . . . . . . . . . . . . . . 306
Stops With Passenger Shelters . . . . . . . . . . . . . . . . . . . . . . . . . . . 1,522Passenger Shelters with Murals . . . . . . . . . . . . . . . . . . . . . . . . . . 836Metro Owned and Maintained Passenger Shelters . . . . . . . . . 1,474
Timetables Printed Year-to-Date . . . . . . . . . . . . . . . . . . . . . 12,442,700
Park-and-Ride Lot Program Number Parking Capacity % Used1,2
Permanent (Major) Park-and-Ride Lots3 65 16,858 76%
Metro Leased Lots 57 2,964 46%Total 122 19,822 72%
1 “Percent used” does not include lots with counts that are not available during the quarter.2 Ten permanent lots and five leased lots reported 100 percent or above capacity on average during fourth quarter 2003.3 Metro Transit Facilities maintains 56 park-and-ride lots.
Trolley Overhead—68.61 Miles of Street with Two-Way Wire, and 31 substations (excluding tunnel)
HOV Lanes*84.11 miles Interstate 528.02 miles Interstate 9066.22 miles Interstate 40514.36 miles SR 52019.93 miles SR 1672.63 miles SR 993.79 miles SR 5222.80 miles SR 509
14.03 miles Arterials
235.89 HOV Miles2.60 DSTP (Tunnel) Northbound and Southbound
238.49 Total Restricted Lanes for Transit Use
* Total miles are those used by transit (including HOV ramps), not total HOV roadway miles in King County.
Year-End 2003
General Manager’s Quarterly Management Report
Deta
iled
Fin
an
cial
an
d O
pera
tin
g D
ata
19
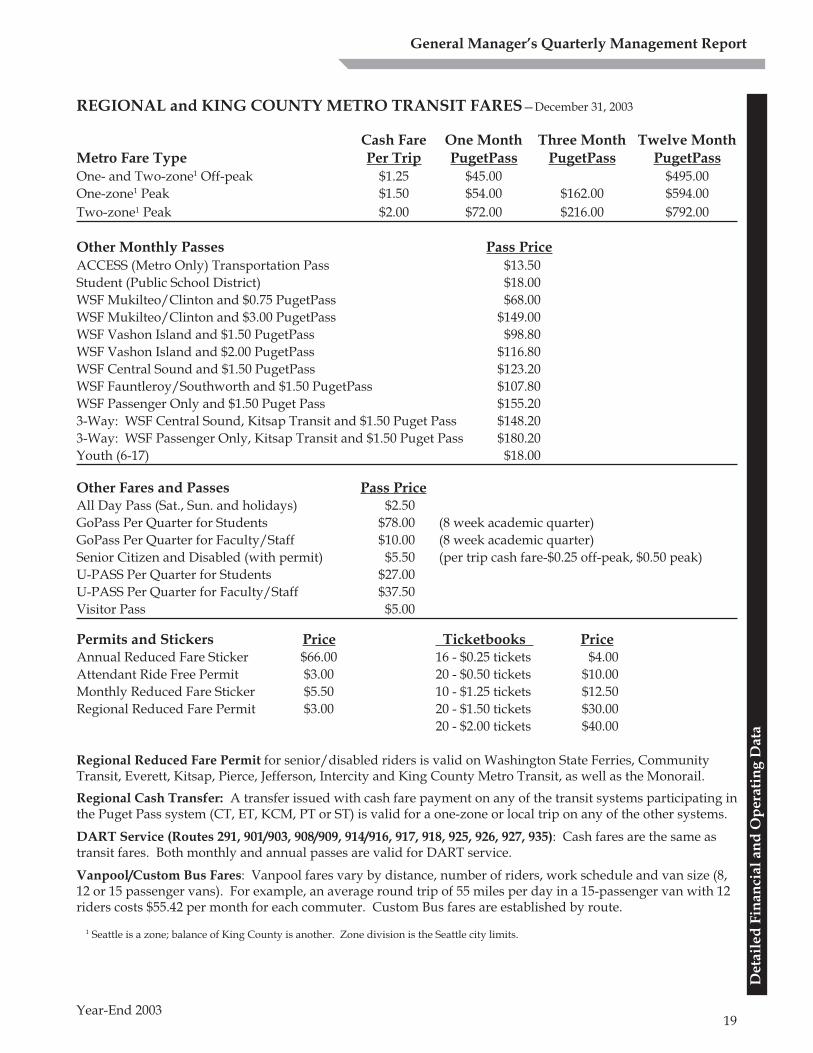
REGIONAL and KING COUNTY METRO TRANSIT FARES—December 31, 2003
Cash Fare One Month Three Month Twelve MonthMetro Fare Type Per Trip PugetPass PugetPass PugetPassOne- and Two-zone1 Off-peak $1.25 $45.00 $495.00
One-zone1 Peak $1.50 $54.00 $162.00 $594.00
Two-zone1 Peak $2.00 $72.00 $216.00 $792.00
Other Monthly Passes Pass PriceACCESS (Metro Only) Transportation Pass $13.50
Student (Public School District) $18.00
WSF Mukilteo/Clinton and $0.75 PugetPass $68.00
WSF Mukilteo/Clinton and $3.00 PugetPass $149.00
WSF Vashon Island and $1.50 PugetPass $98.80
WSF Vashon Island and $2.00 PugetPass $116.80
WSF Central Sound and $1.50 PugetPass $123.20
WSF Fauntleroy/Southworth and $1.50 PugetPass $107.80
WSF Passenger Only and $1.50 Puget Pass $155.20
3-Way: WSF Central Sound, Kitsap Transit and $1.50 Puget Pass $148.20
3-Way: WSF Passenger Only, Kitsap Transit and $1.50 Puget Pass $180.20
Youth (6-17) $18.00
Other Fares and Passes Pass PriceAll Day Pass (Sat., Sun. and holidays) $2.50
GoPass Per Quarter for Students $78.00 (8 week academic quarter)
GoPass Per Quarter for Faculty/Staff $10.00 (8 week academic quarter)
Senior Citizen and Disabled (with permit) $5.50 (per trip cash fare-$0.25 off-peak, $0.50 peak)
U-PASS Per Quarter for Students $27.00
U-PASS Per Quarter for Faculty/Staff $37.50
Visitor Pass $5.00
Permits and Stickers Price Ticketbooks PriceAnnual Reduced Fare Sticker $66.00 16 - $0.25 tickets $4.00
Attendant Ride Free Permit $3.00 20 - $0.50 tickets $10.00
Monthly Reduced Fare Sticker $5.50 10 - $1.25 tickets $12.50
Regional Reduced Fare Permit $3.00 20 - $1.50 tickets $30.00
20 - $2.00 tickets $40.00
Regional Reduced Fare Permit for senior/disabled riders is valid on Washington State Ferries, CommunityTransit, Everett, Kitsap, Pierce, Jefferson, Intercity and King County Metro Transit, as well as the Monorail.
Regional Cash Transfer: A transfer issued with cash fare payment on any of the transit systems participating inthe Puget Pass system (CT, ET, KCM, PT or ST) is valid for a one-zone or local trip on any of the other systems.
DART Service (Routes 291, 901/903, 908/909, 914/916, 917, 918, 925, 926, 927, 935): Cash fares are the same astransit fares. Both monthly and annual passes are valid for DART service.
Vanpool/Custom Bus Fares: Vanpool fares vary by distance, number of riders, work schedule and van size (8,12 or 15 passenger vans). For example, an average round trip of 55 miles per day in a 15-passenger van with 12riders costs $55.42 per month for each commuter. Custom Bus fares are established by route.
1 Seattle is a zone; balance of King County is another. Zone division is the Seattle city limits.
Year-End 2003
General Manager’s Quarterly Management Report
20
Deta
iled
Fin
an
cial
an
d O
pera
tin
g D
ata
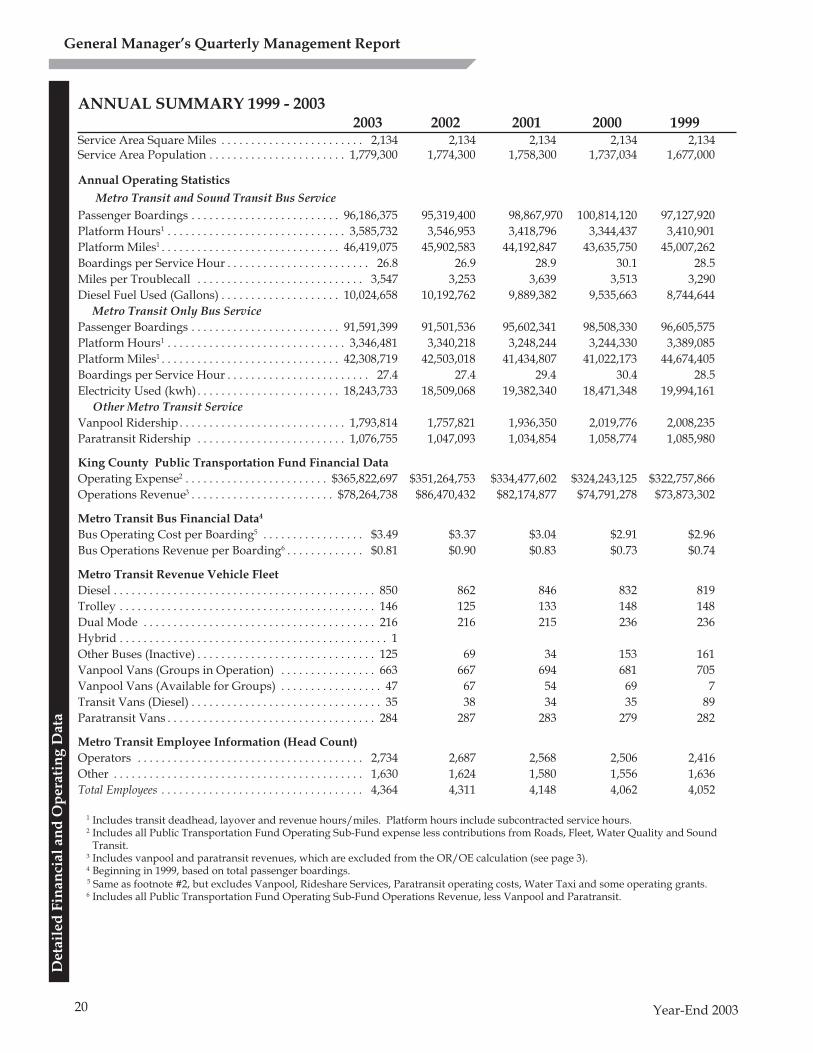
ANNUAL SUMMARY 1999 - 20032003 2002 2001 2000 1999
Service Area Square Miles . . . . . . . . . . . . . . . . . . . . . . . . 2,134 2,134 2,134 2,134 2,134Service Area Population . . . . . . . . . . . . . . . . . . . . . . . 1,779,300 1,774,300 1,758,300 1,737,034 1,677,000
Annual Operating Statistics
Metro Transit and Sound Transit Bus Service
Passenger Boardings . . . . . . . . . . . . . . . . . . . . . . . . . 96,186,375 95,319,400 98,867,970 100,814,120 97,127,920
Platform Hours1 . . . . . . . . . . . . . . . . . . . . . . . . . . . . . . 3,585,732 3,546,953 3,418,796 3,344,437 3,410,901
Platform Miles1 . . . . . . . . . . . . . . . . . . . . . . . . . . . . . . 46,419,075 45,902,583 44,192,847 43,635,750 45,007,262
Boardings per Service Hour . . . . . . . . . . . . . . . . . . . . . . . . 26.8 26.9 28.9 30.1 28.5
Miles per Troublecall . . . . . . . . . . . . . . . . . . . . . . . . . . . . 3,547 3,253 3,639 3,513 3,290
Diesel Fuel Used (Gallons) . . . . . . . . . . . . . . . . . . . . 10,024,658 10,192,762 9,889,382 9,535,663 8,744,644
Metro Transit Only Bus Service
Passenger Boardings . . . . . . . . . . . . . . . . . . . . . . . . . 91,591,399 91,501,536 95,602,341 98,508,330 96,605,575
Platform Hours1 . . . . . . . . . . . . . . . . . . . . . . . . . . . . . . 3,346,481 3,340,218 3,248,244 3,244,330 3,389,085
Platform Miles1 . . . . . . . . . . . . . . . . . . . . . . . . . . . . . . 42,308,719 42,503,018 41,434,807 41,022,173 44,674,405
Boardings per Service Hour . . . . . . . . . . . . . . . . . . . . . . . . 27.4 27.4 29.4 30.4 28.5
Electricity Used (kwh) . . . . . . . . . . . . . . . . . . . . . . . . 18,243,733 18,509,068 19,382,340 18,471,348 19,994,161
Other Metro Transit Service
Vanpool Ridership . . . . . . . . . . . . . . . . . . . . . . . . . . . . 1,793,814 1,757,821 1,936,350 2,019,776 2,008,235
Paratransit Ridership . . . . . . . . . . . . . . . . . . . . . . . . . 1,076,755 1,047,093 1,034,854 1,058,774 1,085,980
King County Public Transportation Fund Financial Data
Operating Expense2 . . . . . . . . . . . . . . . . . . . . . . . . $365,822,697 $351,264,753 $334,477,602 $324,243,125 $322,757,866
Operations Revenue3 . . . . . . . . . . . . . . . . . . . . . . . . $78,264,738 $86,470,432 $82,174,877 $74,791,278 $73,873,302
Metro Transit Bus Financial Data4
Bus Operating Cost per Boarding5 . . . . . . . . . . . . . . . . . $3.49 $3.37 $3.04 $2.91 $2.96
Bus Operations Revenue per Boarding6 . . . . . . . . . . . . . $0.81 $0.90 $0.83 $0.73 $0.74
Metro Transit Revenue Vehicle Fleet
Diesel . . . . . . . . . . . . . . . . . . . . . . . . . . . . . . . . . . . . . . . . . . . . 850 862 846 832 819
Trolley . . . . . . . . . . . . . . . . . . . . . . . . . . . . . . . . . . . . . . . . . . . 146 125 133 148 148
Dual Mode . . . . . . . . . . . . . . . . . . . . . . . . . . . . . . . . . . . . . . . 216 216 215 236 236
Hybrid . . . . . . . . . . . . . . . . . . . . . . . . . . . . . . . . . . . . . . . . . . . . . 1
Other Buses (Inactive) . . . . . . . . . . . . . . . . . . . . . . . . . . . . . . 125 69 34 153 161
Vanpool Vans (Groups in Operation) . . . . . . . . . . . . . . . . 663 667 694 681 705
Vanpool Vans (Available for Groups) . . . . . . . . . . . . . . . . . 47 67 54 69 7
Transit Vans (Diesel) . . . . . . . . . . . . . . . . . . . . . . . . . . . . . . . . 35 38 34 35 89
Paratransit Vans . . . . . . . . . . . . . . . . . . . . . . . . . . . . . . . . . . . 284 287 283 279 282
Metro Transit Employee Information (Head Count)
Operators . . . . . . . . . . . . . . . . . . . . . . . . . . . . . . . . . . . . . . 2,734 2,687 2,568 2,506 2,416
Other . . . . . . . . . . . . . . . . . . . . . . . . . . . . . . . . . . . . . . . . . . 1,630 1,624 1,580 1,556 1,636
Total Employees . . . . . . . . . . . . . . . . . . . . . . . . . . . . . . . . . . 4,364 4,311 4,148 4,062 4,052
1 Includes transit deadhead, layover and revenue hours/miles. Platform hours include subcontracted service hours.2 Includes all Public Transportation Fund Operating Sub-Fund expense less contributions from Roads, Fleet, Water Quality and Sound
Transit.3 Includes vanpool and paratransit revenues, which are excluded from the OR/OE calculation (see page 3).4 Beginning in 1999, based on total passenger boardings.
5 Same as footnote #2, but excludes Vanpool, Rideshare Services, Paratransit operating costs, Water Taxi and some operating grants.6 Includes all Public Transportation Fund Operating Sub-Fund Operations Revenue, less Vanpool and Paratransit.