Embed Size (px)
Citation preview

Please cite this paper as:
Sikora, J. and A. Pokropek (2011), “Gendered CareerExpectations of Students: Perspectives from PISA2006”, OECD Education Working Papers, No. 57, OECDPublishing.doi: 10.1787/5kghw6891gms-en
OECD Education Working PapersNo. 57
Gendered CareerExpectations of Students
PERSPECTIVES FROM PISA 2006
Joanna Sikora, Artur Pokropek

t
Unclassified EDU/WKP(2011)3 Organisation de Coopération et de Développement Économiques Organisation for Economic Co-operation and Development 17-Feb-2011 ___________________________________________________________________________________________
English - Or. English DIRECTORATE FOR EDUCATION
GENDERED CAREER EXPECTATIONS OF STUDENTS: PERSPECTIVES FROM PISA 2006 OECD Education Working Paper No. 57
This document was co-written by Joanna Sikora of the Australian National University, and Artur Pokropek of the Polish Academy of Sciences
Contact: Andreas SCHLEICHER; E-mail: [email protected]; Tel: +33.145.24.93.66
JT03296570
Document complet disponible sur OLIS dans son format d'origine Complete document available on OLIS in its original format
EDU
/WK
P(2011)3 U
nclassified
English - O
r. English

EDU/WKP(2011)3
2
OECD DIRECTORATE FOR EDUCATION
OECD EDUCATION WORKING PAPERS SERIES
This series is designed to make available to a wider readership selected studies drawing on the work of the OECD Directorate for Education. Authorship is usually collective, but principal writers are named. The papers are generally available only in their original language (English or French) with a short summary available in the other.
Comment on the series is welcome, and should be sent to either [email protected] or the Directorate for Education, 2, rue André Pascal, 75775 Paris CEDEX 16, France.
The opinions expressed in these papers are the sole responsibility of the author(s) and do not necessarily reflect those of the OECD or of the governments of its member countries.
Applications for permission to reproduce or translate all, or part of, this material should be sent to OECD Publishing, [email protected] or by fax 33 1 45 24 99 30.
---------------------------------------------------------------------------
www.oecd.org/edu/workingpapers ---------------------------------------------------------------------------
Applications for permission to reproduce or translate all or part of this material should be made to:
Head of Publications Service
OECD 2, rue André-Pascal
75775 Paris, CEDEX 16 France
Copyright OECD 2011

EDU/WKP(2011)3
3
ABSTRACT
This paper provides a comprehensive overview of adolescent career plans reported in PISA 2006. Its main focus is on the differences in the status and area of employment expected by girls and boys in high school. In almost all countries, girls lead boys in their interest in non-manual, high status professional occupations. This can be seen as a vertical dimension of gender segregation in occupational preferences. Students also differ by gender in selecting particular fields of employment within status categories. These differences make up the horizontal segregation of students' expectations and, in PISA 2006, are prominent in the gendered choices of specific subfields of science. Both the vertical and the horizontal dimensions must be considered to appreciate the cultural and institutional factors which promote and reinforce systematic divides in career choices of adolescent boys and girls.
Although, in many countries, the proportions of girls and boys interested in a science-related career are comparable, the types of careers which appeal to each gender are markedly different. Few girls desire employment in computing and engineering, while careers in health services do not attract many boys. Leaving science-related employment aside, socio-cultural professions appeal to girls much more than boys. Remarkably, this pattern holds across all PISA-participating nations, although the size of the gender gap varies by country.
The paper also presents an analysis of potential determinants of this gap, including student academic performance, course-taking patterns, socio-economic background, parental occupations, students' placement in vocational tracks, career information and career preparation in school. While all of these factors make separate contributions to determining the types of careers young people expect, none of them can fully explain the horizontal segregation of expectations by gender.

EDU/WKP(2011)3
4
TABLE OF CONTENTS
ABSTRACT ................................................................................................................................................... 3
Introduction: the importance of career plans ............................................................................................... 5 Data, Measurement and Method ................................................................................................................. 6
How career plans are measured ............................................................................................................... 6 Method ..................................................................................................................................................... 7
DESCRIPTIVE ANALYSES: DISTRIBUTIONS OF STUDENTS' EXPECTATIONS ............................. 9
Overambitious adolescents? ........................................................................................................................ 9 Gender differences in student career expectations .................................................................................... 12 Dispersion in career plans across countries ............................................................................................... 14 Science-related careers: vertical and horizontal segregation by gender .................................................... 17 What explains the horizontal segregation of adolescent career plans? ..................................................... 22
MULTIVARIATE ANALYSES: WHAT ACCOUNTS FOR THE GENDER GAP? ................................ 23
Academic success, family background and career plans ........................................................................... 23 Gender socialisation and career plans ....................................................................................................... 25 Can science performance explain differences in career plans of boys and girls? ..................................... 28 Occupational ambitions of students in vocational tracks at age 15 ........................................................... 34 Occupational ambitions of migrant students ............................................................................................. 36 Attitudes, beliefs and expectations of a career in science ......................................................................... 39 School level factors ................................................................................................................................... 45 Characteristics of national education systems and labour markets ........................................................... 50
SUMMARY, CONCLUSIONS AND POLICY IMPLICATIONS .............................................................. 52
REFERENCES ............................................................................................................................................. 55
APPENDICES .............................................................................................................................................. 60
Appendix 1: Additional descriptive tables ................................................................................................ 60 Appendix 2: Occupational titles comprising science, engineering/computing and health employment ... 67
Appendix 2 Section A ............................................................................................................................ 67 Appendix 2 Section B ............................................................................................................................ 69 Appendix 2 Section C ............................................................................................................................ 70 Appendix 2 Section D ............................................................................................................................ 71
Appendix 3: Plans to enter socio-cultural professions .............................................................................. 73 Appendix 4: Missing data ......................................................................................................................... 76 Appendix 5: Additional information on methods ...................................................................................... 80
THE OECD EDUCATION WORKING PAPERS SERIES ON LINE........................................................ 81

EDU/WKP(2011)3
5
Introduction: the importance of career plans
1. One way of approaching the study of students' occupational plans is to see them as "supply-side" factors which shape the occupational composition of labour force in particular countries (Charles and Grusky, 2004). In contrast to "demand-side" determinants, "supply-side" factors comprise individual preferences, cultural climates and resources available to young people. Educational experiences can be expected to play a significant role in the process of crystallisation of occupational expectations, which, in turn, are known to be consequential for attainments. Thus much can be gained from an understanding of why and how young people set their minds on particular career paths.
2. The knowledge of student career plans enables tracing the process of preference formation and the extent to which plans correspond to cultural trends, respond to market changes and are forged by institutional factors. Psychological theories supported by empirical evidence posit that occupational expectations of adolescents in senior high school are formed with a relatively realistic assessment of future opportunities and difficulties in realising personal goals (Gottfredson 1981; Gottfredson 2002; Helwig 2008). Sociological research confirms this proposition (Kerckhoff 1976) and, moreover, demonstrates that ambitious occupational plans are good predictors of high status attainment in early adulthood (Feliciano and Rumbaut 2005; Sikora and Saha, 2011). This is the case even after youth educational plans, performance and attainments are all taken into account.
3. More recent studies point to the possibility of a progressive “decoupling” between educational and occupational expectations and thus the weakening of the relationship between the former and latter (Goyette 2008; Reynolds, Stewart, MacDonald, and Sischo, 2006). One line of argument proposes that, despite the widely assumed link between educational achievement and productivity, educational expansion leads to the situation where university completion has ceased to "guarantee" future high status employment (Goyette, 2008: 465). Moreover, labour markets become more flexible and volatile which makes the life-long career trajectories, typical for the baby boomers, no longer available to the younger generations. Nowadays, vocational objectives can be partly or entirely dissociated from educational goals if young people treat completing particular stages of education as “the next life stage” rather than a path to pursuing a particular career.
4. In any case, the information about educational expectations of students available in PISA surveys cannot offer insights into both vertical and horizontal segregation of students' educational plans by gender, as PISA collects information about the expected level but not field of future education. In contrast, the PISA-based information on occupational plans has the potential to reveal both dimensions of gender segregation, affording a more complex but also more accurate picture of cultural and institutional forces which promote gender divides in students' educational and occupational pathways.
5. From the point of view of educational policymaking the orientation in patterns of students' career expectations is essential for several reasons. Firstly, it reveals whether students' expectations are aligned with the range of available educational pathways, future employment opportunities and students' own educational plans. Next, this knowledge enables an assessment of the degree to which clear plans as opposed to "indecision", that is lack of career plans, impact on individual students' outcomes in education and the labour market. Such knowledge reveals the degree to which individual determination may compensate for lower levels of cultural, economic and social capital among the disadvantaged but academically able students. Finally it exposes the extent to which students themselves view their educational experiences as consequential for their future employment.
6. Cross-national comparisons of student career plans are valuable as a means of identifying educational and gender ideologies as well as macro-economic and institutional factors which provide a context for plans' formation and realisation. In particular, international comparisons of student career plans

EDU/WKP(2011)3
6
can reveal how widespread gender differences are at this stage of adolescence. Lastly, students' plans can be compared with the actual segregation in employment to highlight the extent to which high school student choices translate into gendered patterns in the labour market.
Data, Measurement and Method
7. This paper is based on the data from PISA 2006 surveys, which contained an extended module devoted to science performance, students' attitudes towards science as well as their perceptions of the value of science, including its desirability as one's future career. Of the 57 countries which participated in the PISA 2006 surveys, Qatar and Liechtenstein have been excluded from the analyses due to lack of information on the key independent variables e.g. gender. The technical details regarding the PISA 2006 sampling design, response rates, and questionnaires with exact question wording are available in comprehensive technical documentation which can be accessed at www.oecd.org/pisa. Therefore we do not describe them here in detail.
How career plans are measured
8. There is an important conceptual distinction between aspirations and expectations. Aspirations refer to life plans which are relatively unaffected by perceived social restraints, while expectations take these restraints into account (Saha, 1983; Saha, 1997). While up to the 1980s these concepts were often considered equivalent, expectations have been found to be better predictors of actual outcomes than aspirations (Goyette 2008). The PISA questionnaires include a single-question measure of students' expectations of the following form:
What kind of job do you expect to have when you are about 30 years old?
Write the job title:___________________________________
9. The responses to this open-ended question have been classified according to the ISCO88, International Standard Classification of Occupations 88 (International Labour Office. 1988). It is these coded responses that have been used to construct scores for students' expectations on the ISEI index of occupational status, following the methodology outlined in Ganzeboom, de Graaf and Treiman (1992).
10. While a single question can be seen as suboptimal compared to multiple item measurement, particularly in light of concerns expressed about the variability of adolescents' plans over time (Rindfuss, Cooksey, and Sutterlin 1999: 231), the single question approach is a standard form of collecting occupational data. Moreover, longitudinal research from Australia indicates that while occupations desired by teenagers vary over time, their preferences in terms of occupational status are significantly more stable (Sikora and Saha, 2011). Teenage preferences seem particularly constant at the aggregate level, that is when they are grouped into major groups of an occupational classification like ISCO88 (International Labour Office. 1988) or similar. For instance in Australia, approximately 80 % of students aiming to work in a professional occupation in Year 10, continue to list one of the professions as their intended labour market destination also in Year 12 (Sikora and Saha, 2011).
11. Nevertheless, data on occupational expectations are affected, in some PISA-participating countries, by high levels of missing answers (Appendix 4). Because the focus of this paper is on gender differences in the expectations of science-related employment, it is possible to assess the differences between students who answered and did not answer the question about their expected occupation using a closely related multi-item scale on science-related future (SCIEFUT)(OECD, 2007b: 16). This scale is useful for this purpose as it incorporates the following statement "I would like to work in a career involving science" alongside three similar items. The scale has low levels of missing data (from 0.1% in
EDU/WKP(2011)3
7
Korea to 10% in Israel) and the analysis of its mean values, presented in Appendix 4, reveals that, in many countries, there are few differences in future science career orientation for students who did and did not provide their expected occupation. In the eleven countries where such differences exist in girls' plans, and in seventeen countries in which boys' plans differ between the two groups, the differences are small (Appendix 4 Tables 1a and 1b). They do not exceed 20% of a standard deviation on a measurement scale ranging from 1.5 to 2.5 standard deviations. The scale measurement units have been standardised within the OECD countries. What further validates the results of this analysis is that they correspond to the patterns of gender composition of tertiary courses enrolment (Charles and Bradley, 2009; OECD, 2006: 37) and employment segregation (Charles and Grusky, 2004).
Method
12. This paper comprises two major parts with a number of sub-sections which focus on specific research questions relevant to students' career expectations and their differentiation by gender. The first part is a broad overview of the distributions in students' preferences for high status employment, employment in science and in particular sub-fields of science. The second part comprises a series of multilevel models conducted separately for each country and, where indicated, on a pooled sample of all countries.
Descriptive analysis
13. Since the PISA surveys are based on a two-stage stratified cluster sample design where schools are sampled with unequal probability, all descriptive analyses are weighted with sampling weights to obtain the correct point estimates. Moreover, the Balanced Repeated Replication (BRR) weights with Fay’s adjustment have been used to achieve unbiased estimates of the population sampling variances (OECD 2007b).
14. In analyses where students achievement in science has been represented by plausible values (Mislevy et al, 1992), all the estimates were obtained using plausible values methodology. This involved first fitting five sets of models, each with one plausible value, and then aggregating these analyses using the Rubin rule (Little and Rubin, 1987).
Multilevel models
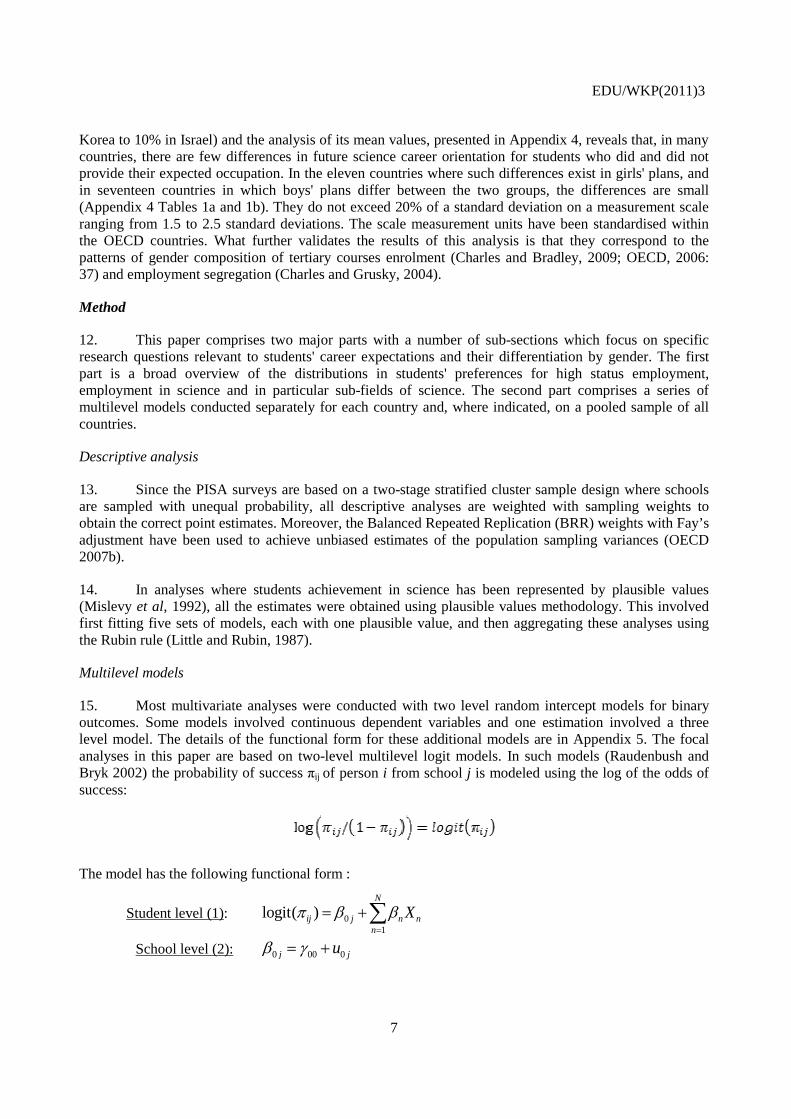
15. Most multivariate analyses were conducted with two level random intercept models for binary outcomes. Some models involved continuous dependent variables and one estimation involved a three level model. The details of the functional form for these additional models are in Appendix 5. The focal analyses in this paper are based on two-level multilevel logit models. In such models (Raudenbush and Bryk 2002) the probability of success πij of person i from school j is modeled using the log of the odds of success:
The model has the following functional form :
Student level (1): 01
logit( )N
ij j n nn
Xπ β β=
= +∑
School level (2): 0 00 0j juβ γ= +

EDU/WKP(2011)3
8
16. Where logit( )ijπ denotes the log of the odds of a student's expectation to work in a specific field
of employment and β0j is the constant or the intercept in school j and 00γ is the average intercept across schools in each country. The error component u0j is a component varying between schools within each country. β1 through βN are regression coefficients for the corresponding student-level explanatory variables X1 through XN.
17. For all types of outcomes, the robust estimation of standard errors is used as it is less sensitive to departures from normality and also the non-independence of observations caused by a two-stage stratified cluster sample design. A number of analyses presented in this paper has been replicated on the data in which missing values were imputed with the multiple imputation procedures. The results are available in the companion excel file for this publication.

EDU/WKP(2011)3
9
DESCRIPTIVE ANALYSES: DISTRIBUTIONS OF STUDENTS' EXPECTATIONS
18. Across OECD and partner countries and economies, a substantial share of students' career goals corresponds to the top ISCO and ISEI occupation status scores, as illustrated by Figure 1. Prior studies based on PISA (Marks, 2010; McDaniel, 2010; Sikora and Saha, 2007; Sikora and Saha, 2009) and other surveys of youth going back at least three decades (Croll, 2008; Goyett,e 2008; Little, 1978; Reynolds et al, and Sischo 2006) consistently find that high school students tend to be quite ambitious in setting their educational and occupational goals.
19. Moreover, evidence from the United States shows that the levels of student ambition ascend from generation to generation (Reynolds et al, 2006). As far as occupational plans are concerned, student preferences tend to centre heavily on occupations which require at least some tertiary study. Most occupations grouped in ISCO88 (International Labour Office, 1988) under the label of 1) legislators, senior officials and managers or 2) professionals require a minimum of university degree at entry, extended levels of numeracy and literacy as well as excellent personal intercommunication skills. These skills are denoted by level 4 in the nomenclature of ISCO88. The occupations listed as 3) technicians and associate professionals require similar skills at a high level and usually necessitate from one to three years of study in a tertiary education institution. Few students see their future in any of the occupations listed in the remaining major groups, i.e. 4) Clerks, 5) Service workers and shop and market sales workers, 6) Skilled agricultural and fishery workers, 7) Craft and related workers, 8) Plant and machine operators and assemblers and 9) Elementary occupations. Nevertheless, of those who expect high status careers in high school, many find employment in occupations listed in groups 4 through 9 upon the completion of their studies (Feliciano and Rumbaut 2005; Sikora and Saha, 2011).
20. Following an overview of cross-country patterns in students' expectations in the next section, the subsequent sections illustrate the key features in the vertical segregation of adolescent career plans by gender.
Overambitious adolescents?
21. Participants in PISA 2006 expect to pursue highly skilled lines of employment, dominated by the professions and managerial positions. Among OECD countries, at least 70 % of students in Chile, Israel, Mexico and Turkey expect to work in occupations requiring a university degree at entry (Figure 1, the top map). In Greece, Portugal, Iceland, Korea and Spain over 60% of students also hope to enter highly skilled managerial and professional careers. In all of these countries the proportions of students oriented to high attainment are larger than the OECD average of 55%. On the other end of the spectrum, the percentage of high school students planning similar careers in the more stratified education systems of Switzerland, Germany, Austria, as well as in Sweden, does not exceed 40%.

EDU/WKP(2011)3
10
Figure 1. Students' career plans. Proportion of adolescents expecting occupations in top ISC)88 major groups and average ISEI occupational status scores by country
Source: PISA 2006. For estimates see Appendix Table I

EDU/WKP(2011)3
11
22. Occupational ambition levels are yet higher among partner countries and economies. On average more than 64 % students in these countries intend to work in the top two major categories of ISCO88. No less than 70% of PISA respondents in Kyrgyzstan, Uruguay, Colombia, Tunisia, Azerbaijan and Jordan expect to be working in one of these occupational categories. Over 60% of their peers in Brazil, Lithuania, Indonesia, Chinese Taipei, Macao-China, Russian Federation, Thailand, Argentina and Bulgaria share similar ambitions. Only in Croatia the proportion of students hoping to become highly educated professionals and managers is merely 40%.
23. The differences in ambition levels between students across countries can be attributed to a number of factors. These include students' family characteristics and academic performance but also the specific national labour market conditions and the features of national education systems which provide different options for 15 year olds (Sikora and Saha, 2010). However, before considering, more systematically, the combined effects of these influences it is necessary to explore the descriptive dimensions of career plans' distributions across countries in greater depth.
24. When the contrast between the most ambitious students and their peers is redefined to include the proportions of adolescents hoping to attain not only professional and managerial but also associate professional occupations, the gap between OECD and partner countries and economies converges (Figure 1, the middle map). On average 79% of students in partner countries and economies and 75% of their peers within the OECD harbour hopes of working in one of the jobs listed in the top three major groups of ISCO88. Over 80 % students from Chile, United States, Portugal, Korea, Mexico, Turkey and Israel report such plans. The lowest proportions of students electing careers of this type are found in Japan, Finland, Hungary, Switzerland, Austria and Germany where they do not exceed 60%.
25. Among partner countries and economies, these top three major occupational groups account for over 85% of choices in Azerbaijan, Kyrgyzstan, Colombia, Brazil, Tunisia, and Jordan (Figure 1, the middle map). At the other end of the spectrum, no fewer than 65% of adolescent Romanians and Croats expect similar careers for themselves.
26. A strong focus on entering the most highly skilled professions among students in less prosperous countries is most evident when plans are presented on the ISEI scale of occupational status, the scores of which range from a low 10 to a high 90 (Ganzeboom and Treiman 1996) (Figure 1, the bottom map). These scores have been derived in an analysis of cross-national data in a manner which optimises the predictive power of education with respect to income for each occupation (Ganzeboom and Treiman, 1996). The advantage of status scores over ISCO88 categories is that ISEI conveys the information about finer differences in the required education and typical financial returns to particular occupations. For instance, judges in courts of law receive the top score of 90, medical doctors receive 88 points while university professors are denoted by the score of 77 in contrast to dancers and choreographers with 64 and social work professionals with only 51 points.
27. On the ISEI scale the plans of students in OECD countries averaged 58 points compared to 63 points on average for students in partner countries and economies. Adolescents in less affluent countries e.g. Mexico and Turkey and partner countries Brazil, Kyrgyzstan, Jordan, Tunisia, Azerbaijan and Colombia typically hoped to enter the top professional and managerial employment with ISEI scores of 65 or higher (Figure 1, the bottom map).
28. Quite the reverse was the case in Switzerland, Austria, Germany and the Czech Republic, where average scores were around 52. The lower levels of occupational expectations found in these countries are consistent with the allocation theory which emphasises that students in these countries are sorted into separate types of academic or vocational schools before they are 15 years of age (Buchmann and Park 2009). Students who are already in educational tracks which do not lead to professional and managerial

EDU/WKP(2011)3
12
employment thus report their expectations in accordance with their educational placement. This aligns with more realistic feedback received at school on their performance (Buchmann and Park, 2009; Kerckhoff, 1977). In contrast, students in the more open, comprehensive systems can longer relish hopes for highly skilled employment, even if not all expectants have realistic chances of attaining their goals.
29. In addition to the apparent curbing influence of early tracking and sorting at schools, high levels of economic prosperity within countries also appear to be aligned with lower levels of occupational ambitions. In countries with high levels of development, participation in school at age 15 is nearly universal, while in less prosperous countries participation rates at age 15 are lower. This is a factor that contributes to country level differences in occupational ambitions (Sikora and Saha, 2010). Nevertheless, the participation rates alone do not fully explain the cross-country differences in career plans in PISA.
Gender differences in student career expectations
30. One of the most prominent features of research on adolescent expectations based on PISA is the attempt to explain widespread gender differences, with girls generally reporting higher status expectations than boys (Buchmann and Dalton, 2002; Sikora and Saha, 2009).
31. Appendix Tables 1, 2 and 3 show that in almost all PISA participating countries girls expect to work in higher status jobs than boys. Regardless of the manner in which occupational status is measured, be it in ISEI scores or ISCO major groups, the difference between the proportions of girls and boys is positive in most countries and in many, the difference in favour of girls is substantial (Marks 2010; Sikora and Saha, 2009) (and Appendix Tables 1,2,3).
32. The finding that girls surpass boys in educational attainment and thus in hopes and plans for high status careers is often interpreted as a sign that gender inequalities have diminished or even reversed direction (Blossfeld & Shavit, 1993: 77; Marks, 2008). Yet the occupational segregation literature (Charles and Grusky, 2004) points out that gender inequalities must be understood not only in terms of vertical differentiation, captured by status and income associated with particular occupations, but also with respect to the horizontal segregation, which denotes gender specific niches persisting at each level of the vertical dimension in the employment structure.
33. There exists evidence of a marked disparity between adolescent expectations and adult attainments in Australia (Sikora and Saha, 2011), the United States (Reynolds et al, 2006) and the United Kingdom (Croll 2008). However, the relative differences in the extent to which boys and girls are able to realise their early goals have received little attention and are yet to be systematically explored.
34. To provide a glimpse of the actual occupational titles which appeal to students of both genders Table 1 presents a selection from the lists of the ten most attractive career choices compiled separately for boys and girls. While it contains no information on the rank of particular occupations in each country, it presents a mosaic of careers particularly popular among PISA 2006 respondents.
35. Boys and girls expect careers in different fields across countries. "Medical doctor" is the only occupational title mentioned by both boys and girls in more than 25 OECD countries. While girls nominated “lawyers” as their preferred career in 25 OECD countries and 17 partner countries and economies, boys did so in ten OECD countries and ten partner countries and economies. The same pattern is observable for “authors journalists and other writers” and “decorators and commercial designers”.

EDU/WKP(2011)3
13
Table 1. Selected occupations from the country-specific lists of the ten most popular career choices among students
Boys Girls
Number of OECD countries
Number of partner countries
Number of OECD countries
Number of partner countries
3475 athletes, sports persons 27 13 2221 medical doctors 32 21 2221 medical doctors 26 15 5141 hairdressers, barbers, beauticians etc workers 28 10 7231 motor vehicle mechanics & fitters 25 6 2421 lawyers 25 17 2140 architects, engineers 14 11 2445 psychologists 25 10 5162 police officers 14 9 2451 authors journalists & other writers 20 8 2141 architects town & traffic planners 13 2 3471 decorators & commercial designers 16 8 5122 cooks 12 7 2230 nursing & midwifery profess 13 6 7137 building etc electricians 10 1 2300 teaching professionals 12 10 7124 carpenters & joiners 10 0 2331 primary education teaching professionals 12 4 2132 computer programmers 10 10 2223 veterinarians 12 5 2421 lawyers 10 10 2141 architects town & traffic planners 10 2 2130 computing professionals 8 1 3231 nursing associate professionals 9 2 2131 computer systems designers & analysts 7 5 2320 secondary education teaching professionals 7 3 2411 accountants 6 5 2332 pre-primary educ. teaching professionals 9 1 2149 architects engineers 6 11 3226 physiotherapists etc associate professionals 7 0 3121 computer assistants 6 1 5220 shop salespersons & demonstrators 6 2 1310 small enterprise general managers 6 11 2411 accountants 5 9 2300 teaching professionals 6 5 3320 pre-primary education teaching associate professionals 5 0 7136 plumbers & pipe fitters 5 1 4100 office clerks 4 3 2451 authors journalists & other writers 4 0 5131 child-care workers 4 0 3471 decorators & commercial designers 4 1 2211 biologists, botanists zoologists etc professionals 3 3 2320 secondary education teaching professionals 4 2 2321 sec. teachers, academic track incl. middle school 4 6
Note: For detailed information on the ten most popular career choices by country see the companion excel sheets for this publication

EDU/WKP(2011)3
14
36. In 13 OECD countries and two partner countries and economies, “architects town and traffic planners” was among the top ten most popular occupations for boys, while among girls the same is true in ten OECD countries and two partner countries and economies.
37. Apart from non-manual employment young women often opt for careers in hairdressing and beauty industry, as shown in Table 1. Other professions favoured by girls include nursing, teaching, veterinary science and psychology, often referred to as "nurturance-oriented" careers (Charles and Grusky, 2004: 15). Other than that, many girls expect to work as authors and artists.
38. In contrast, the preferences of young men concentrate on professional sport, car mechanics, computing, engineering, and law enforcement (Table 1). Cooking also appears on the list of ten most popular occupations among male students. In Hong Kong, Korea, Japan and Indonesia government-related careers are particularly popular among both genders. In these Asian countries public service is an occupational choice that trumps in popularity even the universally coveted law and medicine.
Dispersion in career plans across countries
39. Students' plans differ across countries also with respect to the diversity of career paths forming a spectrum of young people's choices. Although teenagers generally tend to choose a career from a relatively limited set of options (Marini and Greenberger, 1978; Patton and Creed, 2007), a particular concentration of plans on very few occupational titles may be of concern to vocational counsellors. Students' career development knowledge may also vary by gender and thus it is important to know whether, male and female students see themselves in equally diverse ranges of career options. To this end Figures 2a and 2b show the proportions of students of both sexes, who reported, as their intended career, one of the ten most popular occupations amongst their peers of the same sex. The larger the proportion within a country, the higher the concentration of students' expectations.
40. It is plausible to expect that the variety in students' range of choices is related to the range of opportunities in the labour markets, known to adolescents from their everyday experience. From the childhood development perspective the knowledge of potential career options among 15 year olds is relatively comprehensive and realistic (Hartung, Porfeli, and Vondracek, 2008; Super, 1980; Tracey and Sodano, 2008). In other words, students' career plans index, at least partly, the "knowledge of ‘the real world’" (Kerckhoff, 1976: 371) as much as youth motivation.
41. For instance in more affluent countries, where local labour markets avail a variety of manual and non-manual occupational pathways which are comparable with respect to expected autonomy, financial returns and employment security, students' expectations may be diverse. In contrast, in poorer, less developed societies which experience more inequality and where returns to advanced education remain high (Psacharopoulos and Patrinos, 2004), students' plans may be more concentrated on the secure and well rewarded managerial and professional careers, even though for many hopefuls the chances of realising such ambitious goals are at best slim. Figures 2a and 2b lend support to this conjecture as, overall, the concentration of career plans in partner countries, which include many less affluent economies, is higher than the corresponding figures in the most prosperous of OECD nations.
42. Furthermore, there are also systematic differences in the concentration of career plans between genders. In most countries a higher proportion of girls is attracted by the ten most popular career choices among peers of the same sex (the OECD average is approx. 50%). In contrast, boys' career plans tend to be less concentrated (the corresponding average is 36%). It is possible to attribute these differences to the fact that historically women have been concentrated in the non-manual sector of employment in which only high level professional occupations are really attractive employment options.

EDU/WKP(2011)3
15
Figure 2a. Concentration of career plans among boys in OECD and partner countries
Source: PISA 2006. For exact figures see Appendix Table 7
Note: Estimates in countries denoted by grey bars are not different from the OECD average Note: Estimates for Japan are not reported, as in Japan occupational expectations were coded to a two rather than a four-digit level of ISCO
0% 20% 40% 60% 80%
OECD average
GermanyBelgium
NetherlandsAustriaFrance
AustraliaSlovenia
SwitzerlandItaly
ChileUnited Kingdom
LuxembourgSpain
CanadaHungary
KoreaFinland
Czech RepublicNew Zealand
DenmarkGreeceIreland
United StatesSwedenIceland
Slovak RepublicNorwayPoland
PortugalMexicoTurkey
IsraelEstonia
Japan
Percent of students who chose one of the ten most popular occupations Boys in OECD countries
0% 20% 40% 60% 80%
Montenegro
Croatia
Argentina
Serbia
Chinese Taipei
Uruguay
Lithuania
Russian Federation
Colombia
Hong Kong-China
Indonesia
Thailand
Kyrgyzstan
Latvia
Bulgaria
Brazil
Romania
Macao-China
Tunisia
Azerbaijan
Jordan
Percent of students who chose one of the ten most popular occupations Boys in non-OECD countries

EDU/WKP(2011)3
16
Figure 2b. Concentration of career plans among girls in OECD and partner countries
Source: PISA 2006. For exact figures see Appendix Table 7
Note: Estimates in countries denoted by grey bars are not different from the OECD average Note: Estimates for Japan are not reported, as in Japan occupational expectations were coded to a two rather than a four-digit level of ISCO
0% 20% 40% 60% 80%
OECD averageGermanyAustraliaSwedenSloveniaHungary
Czech RepublicSwitzerland
FranceNew Zealand
FinlandBelgium
ItalySlovak Republic
NetherlandsKoreaSpain
AustriaGreece
NorwayUnited Kingdom
EstoniaCanada
ChileIceland
PortugalDenmark
IrelandUnited States
PolandLuxembourg
IsraelMexicoTurkey
Japan
Percent of students who chose one of the ten most popular occupations Girls in OECD countries
0% 20% 40% 60% 80%
Montenegro
Croatia
Chinese Taipei
Serbia
Lithuania
Argentina
Bulgaria
Romania
Russian Federation
Thailand
Hong Kong-China
Latvia
Indonesia
Colombia
Macao-China
Uruguay
Jordan
Brazil
Tunisia
Kyrgyzstan
Azerbaijan
Percent of students who chose one of the ten most popular occupations Girls in non-OECD countries

EDU/WKP(2011)3
17
43. In contrast young men in many countries can look forward to attractive employment in both manual and non-manual sectors where men work as managers and professionals as well as, often well rewarded and enjoying considerable work autonomy, tradesmen and craftsmen. Another possibility is that gender ideologies in many countries limit the knowledge of the diversity in career options among girls (Marini and Greenberger, 1978).
44. Moreover, it is possible that girls take into account more than boys, their future family obligations when planning careers (Looker and Magee, 2000). This itself, however, does not explain why girls' preferences are more concentrated, because girls' most preferred jobs in particular countries do not comprise exclusively "family-friendly" options. The cursory review, presented here, attests to the systematic differences in the career-related imagery embraced by adolescents of both genders. These divides are illustrated by the contrasts in particular types of science-related career preferences discussed below.
Science-related careers: vertical and horizontal segregation by gender
45. PISA provides an opportunity to analyse both the vertical and the horizontal dimensions of gender segregation in students' career plans. There is vertical segregation in career plans in favour of girls, Overall, girls expect higher status employment compared to what is typically expected by boys. However, thanks to the level of detail of the data collected in PISA on science related careers, it is possible to contrast gender differences across different fields of science. Furthermore, the PISA 2006 assessment focused on science and contains a wealth of data on science performance and student attitudes towards science as a field of study and employment.
46. While decades ago girls were expected to underperform relative to boys (Marini and Greenberger, 1978), in recent cohorts, girls in many countries have caught up with or even overtaken their male peers in scientific competence (Hill, Corbett, and Rose, 2010; OECD 2007a). A better performance among girls, however, does not necessarily mean that girls will desire to pursue science related careers more than boys (Looker and Magee, 2000).
47. Before exploring this issue further, it must be noted that any analysis of gender differences in preferences for a science career hinges on a specific definition of science. For instance, where subfields of science are distinguished, it is often found that women have made significant inroads into the careers in biological and agricultural sciences but continue to be dramatically underrepresented in computing and engineering (Hill, Corbett, and Rose, 2010).
48. The definition of science-related careers applied in this paper follows the PISA 2006 questionnaire, which specified that "many jobs involve science – not just the traditional ‘scientist’. Careers like engineer (involving physics), weather forecaster (involving earth science), optician (involving biology and physics), and medical doctors (involving the medical sciences) are all examples of science-related careers". In this paper, science-related careers comprise selected ISCO88 titles (listed in Appendix 2, Section A) from the first three major occupational groups.1 Occupational titles from major groups 4, 5, 6, 7, 8 and 9 have not been included.
49. The following section commences from an overview of gender preferences for thus defined science-related employment. It then proceeds to examine two subfields of science-related careers, computing and engineering versus health-related sciences.
1. PISA 2006 included a list of science careers in ISCO-88 (OECD 2007: Table A10.4). The list used in
this document follows closely this list but introduces a number of changes. For example, code 2442 “Sociologists, anthropologists, etc professionals” is no longer included while code 3141 “Ships engineers” is included. Any choice will be inherently arbitrary and the inclusion or exclusion of a particular occupation is likely to have little impact on the final results given the small proportions of students who choose a particular 4 digit ISCO code.

EDU/WKP(2011)3
18
50. Science careers are attractive to adolescents in many countries (Figure 3). The highest proportions of students who intend to work in some science-related occupation are, among OECD countries, in the United States, Israel, Mexico, Portugal and Chile, where at least 45% of students report that they expect to pursue such a career. Equally high or even higher levels of interest in science careers are also present in Brazil, Thailand, Colombia and Jordan. In contrast, in Korea, Hungary, Finland and a partner country Montenegro science seems less alluring to students than elsewhere, attracting only about 20% of choices.
Figure 3. Proportions of boys and girls planning a science-related career
Source: PISA 2006. For exact figures see Appendix Table 4
0.0% 20.0% 40.0% 60.0% 80.0%
Croatia
Lithuania
Romania
Tunisia
Serbia
Colombia
Bulgaria
Indonesia
Argentina
Chinese Taipei
Jordan
Hong Kong-China
Latvia
Russian Federation
Macao-China
Montenegro
Uruguay
Azerbaijan
Brazil
Kyrgyzstan
Thailand
Partners average
Female Male
Science career expectations in partner countries
0.0% 20.0% 40.0% 60.0% 80.0%
Greece
Chile
Czech Republic
Ireland
Luxembourg
Australia
Germany
France
Spain
Belgium
Estonia
United Kingdom
Switzerland
Israel
Japan
Sweden
Portugal
Austria
Mexico
Korea
Poland
Slovak Republic
Slovenia
Italy
Turkey
Hungary
Finland
New Zealand
Canada
Iceland
Norway
Denmark
United States
Netherlands
OECD average
Female Male
Science career expectations in OECD countries

EDU/WKP(2011)3
19
51. Countries in which science-related careers are most popular are not necessarily the ones where most students achieve high scores in science tests (OECD, 2007a: Table 2.1c). In Mexico, Portugal and Poland, among the OECD countries, students are keen on pursuing science-related career although their performance in science is well behind the leading Finland, Canada, Japan and New Zealand. In the countries with highest science performance levels, fewer students are interested in science as their preferred career option. Similarly, among partner countries and economies, the proportions of students interested in science-related employment are moderate in Hong-Kong-China or Chinese Taipei relative to Colombia or, for example, Jordan. This is despite the fact that the former two countries have students who, on average, obtain strong results in science while the latter pair of countries comprises student populations with mostly average science performance. Such disparities may be indicative of students' relatively poor knowledge of the prerequisites and investment required for the highly specialised science occupations. Alternatively, the perceptions of a high prestige or financial returns associated with these jobs might generate an interest which is as unrealistic as it is widespread.
52. Overall, when science-related career plans are contrasted between genders in various OECD countries, a complex and varied pattern emerges. In some nations the proportions of girls and boys who plan employment in these occupations are similar (lower parts of Figure 3). In many countries one gender dominates the other in opting for science as the area of preferred future employment. There is no apparent systematic pattern, however, in who dominates whom (upper parts of Figure 3). Girls beat boys in their enthusiasm for science jobs in the United States, Canada, Iceland, Norway, the Netherlands and New Zealand but in Italy, Poland and Korea boys enthused by science outnumber girls.
Expectations of careers in computing and engineering
53. While this fusion of patterns could be perceived as an indication of progressing, albeit at a dissimilar pace in different countries, integration of student choices, it actually results from grouping together various types of science careers that have a gender-specific appeal. This is illustrated in Figures 4 and 5 which present the proportions of boys and girls who aim specifically at entering engineering and computing and health-science-related employment.2 Careers in engineering and computing attract relatively few girls. Among OECD countries, on average less than five percent of girls contemplate embarking on this path of employment (Appendix 1 Table 5). In partner countries and economies the corresponding average is over six percent. This is even though the definition of computing and engineering employed here extends to include fields like architecture, which is rarely considered to be one of the typically "masculine" jobs (Appendix 2, Section B). There is much cross-country variation in the numbers of students opting for future employment in this field, ranging from relatively high proportions in Poland, Slovenia, Mexico, Jordan and Colombia to very low numbers in the Netherlands, Finland, Azerbaijan and Montenegro.
54. Yet, the most striking feature of these distributions is that in almost no country does the number of girls thinking of computing and engineering as their future career choice exceed the number of boys. The singular exception to this trend is Montenegro. Moreover, the ratios of boys to girls are quite large in most OECD and many partner countries and economies. On average, there are almost four times as many boys as there are girls expecting employment in engineering and 2. It is important to bear in mind that the categories of engineering/computing and health utilised in this
analysis do not include all science-related occupations. These two categories account for about 75% of plans for science-related employment and some science occupations such as "mathematician", "physicist" or "psychologist" are neither in the engineering/computing nor in the health category. Nevertheless it is possible to relate gender differences in these two fields to the overall patterns of segregation previously found in studies of employment or tertiary enrolments.

EDU/WKP(2011)3
20
computing within OECD and close to three times as many boys as girls in partner countries and economies.
Expectations of careers in health services
55. The pattern of preferences for health-science careers by gender is a mirror image of the expectations related to employment in engineering and computing. Just as boys outnumbered girls in their enthusiasm for computing and engineering, girls who yearn for a career in health and medicine outnumber boys, without a single exception among countries. It is noteworthy that this holds even after nurses and midwives are excluded from the list of health-related careers, so the gender imbalance in preferences for health-related careers is not brought about solely by the traditional over-representation of women in nursing and midwifery.
Figure 4. Proportions of boys and girls planning a career in engineering or computing
Source: PISA 2006. For exact figures see Appendix Table 5
0.0% 10.0% 20.0% 30.0% 40.0%
Netherlands
Finland
New Zealand
Korea
United Kingdom
Denmark
Iceland
Germany
Switzerland
Austria
Japan
Sweden
Israel
Australia
United States
Luxembourg
Ireland
France
Estonia
Belgium
Canada
Hungary
Greece
Norway
Czech Republic
Turkey
Italy
Slovak Republic
Spain
Portugal
Chile
Mexico
Slovenia
Poland
OECD average
Female Male
Expected careers in engineering and computing OECD countries
0.0% 10.0% 20.0% 30.0% 40.0%
Montenegro
Azerbaijan
Kyrgyzstan
Macao-China
Indonesia
Bulgaria
Hong Kong-China
Tunisia
Uruguay
Romania
Croatia
Brazil
Serbia
Argentina
Lithuania
Russian Federation
Thailand
Chinese Taipei
Latvia
Colombia
Jordan
Partners average
Female Male
Expected careers in engineering and computing partner countries

EDU/WKP(2011)3
21
Figure 5. Proportions of boys and girls planning a career in health services
Source: PISA 2006. For exact figures see Appendix 1 Table 6
0.0% 10.0% 20.0% 30.0% 40.0%
Korea
Estonia
Czech Republic
Slovak Republic
Hungary
Greece
Germany
Finland
Sweden
Turkey
Japan
Italy
Poland
Belgium
Luxembourg
United Kingdom
Switzerland
Australia
Denmark
Mexico
Austria
Iceland
Spain
New Zealand
Norway
Slovenia
Ireland
Netherlands
Israel
France
Portugal
Canada
Chile
United States
OECD average
Female Male
Expected careers in health OECD countries
0.0% 10.0% 20.0% 30.0% 40.0%
Latvia
Lithuania
Chinese Taipei
Macao-China
Montenegro
Hong Kong-China
Russian Federation
Romania
Croatia
Serbia
Argentina
Bulgaria
Indonesia
Uruguay
Azerbaijan
Tunisia
Jordan
Thailand
Brazil
Colombia
Kyrgyzstan
Partners average
Female Male
Expected careers in health partner countries

EDU/WKP(2011)3
22
56. The gender gap is particularly large in Austria, Norway and Switzerland in the OECD group and Thailand, Latvia, and Russian Federation in the remaining countries. By contrast, boys and girls in Mexico, Korea and Italy, as well as Bulgaria, Indonesia and Hong Kong are closer to their peers of the opposite sex in their intentions to pursue careers in health. Nevertheless, this does not mean gender-integration of plans but only a smaller between-gender gap.
What explains the horizontal segregation of adolescent career plans?
57. While the dramatic underrepresentation of women in computing and engineering has been recognised and attracted attention in particular countries, the PISA data reveal an almost universal presence of the gender segregation in employment expectations of youth. This segregation is present already at 15 years of age, in a large number of countries which differ markedly with respect to economic contexts and the organisation of their education systems.
58. Biological explanations of the persisting gender differences are particularly inept in accounting why women should excel in biological sciences and plan to work in many demanding, health-science fields (Figure 5) but at the same time shun computing and engineering jobs.
59. Charles and Grusky propose the concept of cultural gender essentialism, as a possible explanation of these patterns (2004; Charles and Bradley, 2009). Women and men's preferences and subsequently employment paths are rooted in cultural and institutional phenomena. The ideology of gender essentialism represents women as "more competent than men in service, nurturance, and social interaction." (Charles and Grusky, 2004: 15). To the extent to which health related occupations are culturally construed as involving more tasks related to these domains, the ideology of gender essentialism may indeed be at the root of persisting differences between the gender-specific imageries of desirable and a fulfilling careers.
60. The sections that follow systematically examine a number of possible reasons for the gender gap in career plans: differences in science performance, in course-taking, in family background, in the transfer of tastes and preferences within a family along gender lines, in students' perceptions of their capacity for success in science and their knowledge of what is required for a science career. Many of these factors affect the variation between boys and girls, suggesting possibilities for future policy initiatives aimed at a better utilisation of youth talent. Nevertheless, the gap between girls and boys remains unexplained by these factors, which, together with its universal presence across countries, points to global gender ideologies as the most promising explanation.

EDU/WKP(2011)3
23
MULTIVARIATE ANALYSES: WHAT ACCOUNTS FOR THE GENDER GAP?
Academic success, family background and career plans
61. For over three decades studies in educational psychology, sociology and other social sciences demonstrated that the two most influential groups of factors which shape youth motivation and ambition were family background and academic performance (Haller, Luther, Meier, and Ohlendorf 1974; Hauser and Grusky, 1988).
62. The meritocratic ideology, central in the ideals governing modern mass education, prioritises ability and effort as the sole criteria which should underpin advancement in the school system and in the labour market. The underlying principle of egalitarianism stipulates that gender, ethnicity, socio-economic status and other structural differences between students should have no direct effect on their quality of education and the chances of advancement in life. Even if certain differences between students in these groups are experienced in the education system, they should answer to the "different but equal" principle and neither lead to any tangible disadvantages for particular groups of students nor to constrain their individual preferences. Therefore to the extent to which meritocratic ideology and practices have been successfully instilled across the educational systems in the world, academic performance should be the key determinant of students' educational and occupational plans.
63. Indeed, recent research based on PISA surveys (Marks, 2010; Sikora and Saha, 2009) documents a positive relationship between high levels of academic performance and ambitious occupational goals. This relationship is, in all likelihood, one of mutual reinforcement, that is high level academic performance leads to ambitious occupational goals which, in turn, inspire more effort in educational pursuits, save for the instances where students have poor knowledge of educational credentials required to enter particular careers.
64. But academic performance is by no means the only strong booster of ambitious plans. Theories of allocation, risk aversion and elite reproduction (Bourdieu, 1984; Bourdieu, 1986; Breen and Yaish, 2006; Kerckhoff, 1976) posit that even in the era of modern meritocratic education the children of the highly educated parents in highly skilled employment benefit from more generous endowments in cultural, economic and social capital. These endowments advance the children of elite to experience educational success beyond the levels typical for their equally academically able but more socially disadvantaged peers. The risk aversion theory, backed up with some empirical studies (Breen and Yaish, 2006; Golthorpe, 2007), proposes that the children in higher status families at minimum expect to attain as high an educational and occupational position as their parents. Therefore, such children continue their education beyond compulsory years, even when their academic performance is only moderately successful. Moreover, such children, taking their parents' attainment as a natural benchmark, are likely to be firmly oriented towards high status occupational employment for themselves. By contrast, the children of lower status parents need much higher motivation or far more academic success to be enticed to continue in education past the compulsory threshold. Regardless of these differences, in strongly meritocratic systems both groups of students should advance primarily through academic performance, that is, either effort or talent. In these systems occupational expectations should be linked more strongly to academic success than to family capital.
65. Most PISA 2006 participating countries appear to have education systems which closely approach so defined meritocracy as students' career plans in most places are better predicted by academic performance than by family economic, social and cultural resources. Figure 6 presents

EDU/WKP(2011)3
24
regression coefficients from a two level random intercept model in which students' expectations expressed in the ISEI status scores have been regressed on their performance in science and their family of origin's economic, social and cultural status. In this instance ISEI scores have been used to conserve space as the patterns for students who wish to work in particular science fields are essentially the same. For comparability the independent variables, that is, the science scale performance scores and the status of family home, have been standardised to a mean of zero and the standard deviation of one across all OECD countries. These standardised coefficients can be interpreted as the change in average ISEI occupational status score which is associated with a change of one standard deviation on either students' science performance or the family status scale.
Figure 6. Relative importance of students' academic performance and economic, social and cultural status as predictors of occupational plans expressed in ISEI scores
OECD countries
Girls
Boys Science performance Girls science performanceBoys ESCS Girls ESCS
Boys10 8 6 4 2 0 2 4 6 8 10
Japan
Italy
Switzerland
Canada
Austria
Sweden
Mexico
Israel
United States
Chile
Slovenia
Estonia
France
Norway
Germany
Ireland
Hungary
Australia
Korea
Finland
Poland
New Zealand
Slovak Republic
Iceland
Portugal
United Kingdom
Czech Republic
Greece
Turkey
Luxembourg
Spain
Belgium
Netherlands
Denmark
Partner countries
Girls
Source: OECD PISA 2006 database
Boys Science performance Girls science performanceBoys ESCS Girls ESCS
Boys8 6 4 2 0 2 4 6 8
Kyrgyzstan
Brazil
Russian Federation
Bulgaria
Colombia
Azerbaijan
Argentina
Indonesia
Montenegro
Latvia
Uruguay
Romania
Macao-China
Serbia
Hong Kong-China
Jordan
Lithuania
Croatia
Taiwan Chinese Taipei
Tunisia
Thailand

EDU/WKP(2011)3
25
66. In most countries science performance is a stronger predictor of high status occupational expectations (Figure 6) than students' socio-cultural and economic capital. This is the case for boys and girls. But there are some exceptions from this pattern as the economic, social and cultural capital of a student's family predict as well as school performance future career plans in Japan for students of both genders. In Kyrgyzstan and Brazil the performance of girls is unrelated to their occupational expectations which is atypical.
67. Notwithstanding the stronger impact of science performance than family background on student career expectations, in many countries family background nonetheless has a bearing on the expected status of students' future employment net of students' performance. As Marks (2010) pointed out in his analysis of career plans in PISA 2000, the strong version of meritocracy hypothesis would require a complete absence of the family background effects. Despite the undeniable progress of meritocracy in education systems across the world, students from advantageous home environments continue to expect better jobs than their equally able peers from less privileged homes.
68. Regardless of the obvious relationship between the cultures of meritocracy and egalitarianism and their apparent prevalence in most countries, the horizontal segregation of career plans by gender persists. While across countries most students are oriented towards the managerial and professional employment and high achievers are particularly ambitious, the fields of employment that attract young men and women continue to be distinct.
Gender socialisation and career plans
69. Notwithstanding the consensus over the declining gender differentiation in socialisation practices within home and school environments, the proposition that a child is influenced more by the parent of the same sex has received attention and even some support in recent research (Kleinjans, 2010; Marks, 2008). The key expectation of the same-sex-socialisation theory is that daughters are influenced and inspired by their mothers' rather than their fathers' attainments. Likewise, sons are more likely to look up to and follow into their fathers, rather than their mothers’ footsteps. Within this perspective family role-modelling processes work most effectively along gender division lines and thus for instance while the daughters of engineer fathers might be more likely to contemplate a career in engineering than adolescents who have no engineers in their family circle, the daughters of female engineers should be particularly well poised to consider a similar career for themselves. The key foundation for this preference is the child's "expert" understanding of not only the content of the parent's job but also of day-to-day strategies which enable success in combining the heavy human capital investments necessary for these careers with gendered roles and identities outside of the world of work. The gender socialisation hypothesis is potentially attractive where persistent differences between boys and girls, as these occurring in career plans, cannot be explained by biological theories, the differences in sex-specific academic strengths or an absence of policies designed to foster egalitarian gender attitudes. But it must be noted that it is not optimal for understanding the situation of youth in single parent families or the families with parents of the same sex.
70. Prior research which sought to establish whether academic results of boys and girls participating in PISA surveys were more influenced by the characteristics of fathers or mothers found at best a modest support for the sex-socialisation hypothesis (Marks, 2008). Nevertheless, in several countries, it could not be entirely dismissed. The PISA 2006 report found little or no relationship between expectations of employment in science and having a parent employed in one of science fields (OECD, 2007a). In contrast to this finding Figure 7 below highlights that, in many countries, parents’ occupational profiles are positively associated with their children’s plans to pursue employment in similar areas.
71. Figure 7 displays coefficients from two-level logit models predicting the likelihood of planning employment in computing or engineering or in health services as a function of mother and

EDU/WKP(2011)3
26
father's employment in these fields. The model incorporates only two independent variables as the total influence of fathers and mothers' characteristics is pertinent here, regardless of the mechanisms through which parents in particular professions sway and support their children in considering similar career paths for themselves.
72. Overall, the cross-national evidence in support for gender socialisation hypothesis with regard to occupational plans is moderate but non-negligible. Boys follow in the footsteps of their fathers more often that girls (Figure 7). In a number of countries, for instance in Japan, Mexico or Poland, having either parent working in health enhances the children's interest in this field regardless of the sex of the parent. The stronger influence of fathers' employment in health on their daughters' plans in Italy, Poland or Lithuania contrasts with the logic of the gender socialisation theory but is in accordance with the expectation of within-family transfer of tastes and preferences for particular types of carers. By contrast, in many countries, e.g. Bulgaria, Colombia or Estonia, the profile of parents' employment was unrelated to the career expectations which students reported in PISA 2006.
73. On the whole there is stronger evidence of a transfer of tastes between fathers and sons than mothers and daughters which corresponds to the findings of studies concerned with educational attainment (Kleinjans, 2010; Marks, 2008). The number of countries where this relationship for men in the family is significant is larger than the number of countries with the corresponding effects for the women.
74. The link between parents', particularly fathers' employment in health, and children's hopes of entering a career in health and medicine is stronger in a large number of countries than the intergenerational transfer of preferences for computing and engineering. What impedes the attempts to test the gender socialisation hypothesis with regard to the within-family transfer of tastes for engineering and computing is an almost total absence of engineers and computing scientists among mothers in the sample. On average the proportion of mother engineers does not exceed half a percent. By contrast, there are between 1% and 3 % of fathers who work in these occupations. Figure 7 shows only coefficients in countries in which at least 0.5 % of parents of each sex were in each group of occupations of interest, and, moreover, in which there were at least 5 students whose expected career corresponded to employment held by their parent of the same sex. As there are very few mothers employed in engineering and computing, even the application of these liberal criteria led to a dearth of the information necessary for establishing any relationship between mothers' employment and their daughters’ plans. The influence of parents' employment in health on children's occupational plans is easier to ascertain, thanks to the higher proportions of both mothers and fathers working in the relevant occupations.
75. Alternatively, the very low counts of engineer mothers in the PISA sample could be seen as evidence in support of gender socialisation hypothesis. A shortage of female role models within the family circle who "normalise" the perception that engineering and computing as a domain fully accessible to women, may well prevent girls from planning this type of employment. In contrast, in a number of countries, the coefficients depicting a son's preference for engineering and computing as a function of his father's work in these fields is positive and significant. Hence, in more locations, boys seem to have higher chances than girls of being exposed, within their own family circle, to the experiences and role models which normalise engineering and computing as a professional activity appropriate for their sex.

EDU/WKP(2011)3
27
Figure 7. Coefficients from two-level logit models predicting the probability of a student choosing a career in the same field as the parent.
Only coefficients statistically significant at p = 0.05 level
0.00
0.50
1.00
1.50
2.00
2.50
3.00
3.50
Aus
tral
ia
Aus
tria
Belg
ium
Cana
da
Chile
Czec
h Re
publ
ic
Den
mar
k
Esto
nia
Finl
and
Fran
ce
Ger
man
y
Gre
ece
Hun
gary
Icel
and
Irel
and
Isra
el
Italy
Japa
n
Kore
a
Luxe
mbo
urg
Mex
ico
Net
herl
ands
New
Zea
land
Nor
way
Pola
nd
Port
ugal
Slov
ak R
epub
lic
Slov
enia
Spai
n
Swed
en
Switz
erla
nd
Turk
ey
Uni
ted
King
dom
Uni
ted
Stat
es
Arg
entin
a
Aze
rbai
jan
Braz
il
Bulg
aria
Colo
mbi
a
Croa
tia
Hon
g Ko
ng-C
hina
Indo
nesi
a
Jord
an
Kyrg
yzst
an
Latv
ia
Lith
uani
a
Mac
ao-C
hina
Mon
tene
gro
Rom
ania
Russ
ian
Fede
ratio
n
Serb
ia
Chin
ese
Taip
ei
Thai
land
Tuni
sia
Uru
guay
Girls' plans to work in health and parents' employment
Father works in health Mother works in health
0.00
0.50
1.00
1.50
2.00
2.50
3.00
3.50
Aus
tral
ia
Aus
tria
Belg
ium
Cana
da
Chile
Czec
h Re
publ
ic
Den
mar
k
Esto
nia
Finl
and
Fran
ce
Ger
man
y
Gre
ece
Hun
gary
Icel
and
Irel
and
Isra
el
Italy
Japa
n
Kore
a
Luxe
mbo
urg
Mex
ico
Net
herl
ands
New
Zea
land
Nor
way
Pola
nd
Port
ugal
Slov
ak R
epub
lic
Slov
enia
Spai
n
Swed
en
Switz
erla
nd
Turk
ey
Uni
ted
King
dom
Uni
ted
Stat
es
Arg
entin
a
Aze
rbai
jan
Braz
il
Bulg
aria
Colo
mbi
a
Croa
tia
Hon
g Ko
ng-C
hina
Indo
nesi
a
Jord
an
Kyrg
yzst
an
Latv
ia
Lith
uani
a
Mac
ao-C
hina
Mon
tene
gro
Rom
ania
Russ
ian
Fede
ratio
n
Serb
ia
Chin
ese
Taip
ei
Thai
land
Tuni
sia
Uru
guay
Girls' plans to work in engineering/computing and parents employment
Father works in engineering/computing Mother works in engineering/computing
0.00
0.50
1.00
1.50
2.00
2.50
3.00
3.50
Aus
tral
ia
Aus
tria
Belg
ium
Cana
da
Chile
Czec
h Re
publ
ic
Den
mar
k
Esto
nia
Finl
and
Fran
ce
Ger
man
y
Gre
ece
Hun
gary
Icel
and
Irel
and
Isra
el
Italy
Japa
n
Kore
a
Luxe
mbo
urg
Mex
ico
Net
herl
ands
New
Zea
land
Nor
way
Pola
nd
Port
ugal
Slov
ak R
epub
lic
Slov
enia
Spai
n
Swed
en
Switz
erla
nd
Turk
ey
Uni
ted
King
dom
Uni
ted
Stat
es
Arg
entin
a
Aze
rbai
jan
Braz
il
Bulg
aria
Colo
mbi
a
Croa
tia
Hon
g Ko
ng-C
hina
Indo
nesi
a
Jord
an
Kyrg
yzst
an
Latv
ia
Lith
uani
a
Mac
ao-C
hina
Mon
tene
gro
Rom
ania
Russ
ian
Fede
ratio
n
Serb
ia
Chin
ese
Taip
ei
Thai
land
Tuni
sia
Uru
guay
Boys' plans to work in health and parents' employment
Father works in health Mother works in health
0.00
0.50
1.00
1.50
2.00
2.50
3.00
3.50
Aus
tral
ia
Aus
tria
Belg
ium
Cana
da
Chile
Czec
h Re
publ
icD
enm
ark
Esto
nia
Finl
and
Fran
ce
Ger
man
y
Gre
ece
Hun
gary
Icel
and
Irel
and
Isra
el
Italy
Japa
n
Kore
a
Luxe
mbo
urg
Mex
ico
Net
herl
ands
New
Zea
land
Nor
way
Pola
nd
Port
ugal
Slov
ak R
epub
lic
Slov
enia
Spai
nSw
eden
Switz
erla
ndTu
rkey
Uni
ted
King
dom
Uni
ted
Stat
es
Arg
entin
a
Aze
rbai
jan
Braz
il
Bulg
aria
Colo
mbi
aCr
oatia
Hon
g Ko
ng-C
hina
Indo
nesi
aJo
rdan
Kyrg
yzst
an
Latv
iaLi
thua
nia
Mac
ao-C
hina
Mon
tene
gro
Rom
ania
Russ
ian
Fede
ratio
nSe
rbia
Chin
ese
Taip
ei
Thai
land
Tuni
sia
Uru
guay
Boys plans to work in computing or engineering and parents' employment
Father works in engineering/computing Mother works in engineering/computing

EDU/WKP(2011)3
28
Can science performance explain differences in career plans of boys and girls?
76. The assessment of science performance in PISA 2006 showed that in many countries boys performed on a par with girls (OECD, 2007a). This was the case, for instance, in United States, Canada or Poland. In contrast, in the United Kingdom, Denmark or Mexico girls' science performance lagged somewhat behind that of their male counterparts. Finally, in yet other countries, girls outperformed boys in science, as for instance in Jordan, Bulgaria, Turkey and Greece (OECD, 2007a). In countries where there are no gender disparities in science competence, there can be no relationship between them and gender differences in career expectations. However, does science performance play a role in driving career expectations in countries where boys and girls do not perform equally well in science?
77. The goal of the analysis in this section is to ascertain the extent to which controlling for differentials in science performance and course taking can explain the gap in the interest boys and girls have in engineering or computing (Tables 2a and 2b) and health-sciences (Tables 3a and 3b). Apart from student science performance and familial environments, one factor which received attention as a possible driver of gender differences in career preferences is the differential course taking in upper years of secondary high-school (Xie and Shauman 2003).
78. Some researchers argued that young women begin opting out of advanced mathematics and science courses at quite early stages in their education and thus simply do not possess the appropriate credentials at the time when entry to science university degrees would be possible (Xie and Shauman 2003). However, recent evidence from the USA does not support this hypothesis. Throughout the 1980s and 1990s average gender differences in math and science performance were small but American boys were markedly more likely than American girls to be among the top 5% maths and science achievers. However, neither difference was consequential for the gender gap in expectations to complete a science-related degree (Xie and Shauman 2003).
79. PISA 2006 has the information on students' participation in compulsory and optional courses in general science, biology, chemistry and physics. Each student was asked about his or her participation in such courses in 2006 and the preceding year, i.e. in 2005. Although the data on course-taking are not strictly comparable between countries due to the curricular and program differences, it is possible to construct a measure of course participation which is suitable for comparisons between genders within each country. After initial analyses, in which all questions on course-taking were treated as separate variables, the information on compulsory and optional course participation in both years was combined to create a variable indicating exposure to each subject area. This variable ranged from zero, if a student took no compulsory or optional courses in the year of assessment or the previous year, to four, if both types of courses were taken in both years.
80. Coefficients from two-level random intercept logit models are presented in each table for the OECD (in tables annotated with an "a") and partner countries (in tables annotated with a "b"). The science performance scale and the variables depicting course-taking in particular areas of science are control variables in Tables 2a, 2b, 3a and 3b below.
81. The change in the gender gap in students' expectations due to control variables can be observed by comparing the first two left-hand columns in each table. For instance, in the Slovak Republic, where the proportions of boys and girls who expect a career in engineering or computing are very different, the gender coefficient changes from the baseline Model 1 "-2.18" to "-2.06" in Model 2 (Table 2a). The latter model can be interpreted as representing a hypothetical situation in which boys and girls do not differ at all with respect to science performance or science subjects taken at school.

EDU/WKP(2011)3
29
Table 2a. Science performance, course-taking and expected career in engineering. OECD countries.
Expected career in computing/engineering
Model 1 Model 2*
Fem
ale
Fem
ale
Scie
nce
perf
orm
ance
sc
ale
Gen
eral
sc
ienc
e co
urse
s
Bio
logy
co
urse
s
Che
mis
try
cour
ses
Phys
ics
cour
ses
coeff. coeff. coeff. coeff. coeff. coeff. coeff. Slovak Republic -2.18 -2.06 0.62 - 0.01 -0.01 0.34 Switzerland -2.00 -1.98 0.42 -0.03 -0.02 -0.07 0.02 United States -1.96 -1.93 0.34 -0.02 -0.01 0.12 -0.07 United Kingdom -1.95 -1.85 0.48 -0.01 -0.28 0.09 0.26 Australia -1.92 -1.85 0.51 0.03 -0.38 0.12 0.30 Ireland -1.90 -1.84 0.46 -0.08 -0.52 -0.24 0.65 France -1.86 -1.79 0.35 - -0.20 0.00 0.45 Canada -1.85 -1.84 0.55 0.07 -0.15 0.06 0.11 Hungary -1.84 -1.67 0.64 - -0.02 -0.14 0.35 Slovenia -1.79 -1.71 0.33 0.10 -0.35 -0.09 0.27 Czech Republic -1.79 -1.72 0.60 -0.01 -0.11 0.20 0.22 Poland -1.76 -1.77 0.22 - - - - Portugal -1.67 -1.60 0.51 0.10 -0.31 0.16 -0.07 Finland -1.65 -1.66 0.41 -0.11 -0.04 0.24 -0.01 Chile -1.57 -1.52 0.30 -0.04 -0.02 -0.04 0.02 Korea -1.56 -1.54 0.19 -0.01 -0.28 0.13 0.30 Germany -1.55 -1.45 0.48 0.09 -0.08 0.02 0.01 Belgium -1.54 -1.45 0.60 -0.04 -0.27 0.42 -0.03 Japan -1.53 -1.54 0.68 0.03 -0.21 0.04 -0.02 Mexico -1.49 -1.45 0.26 -0.01 -0.09 0.03 0.05 Denmark -1.47 -1.44 0.63 0.13 -0.07 -0.03 0.10 Turkey -1.38 -1.34 0.49 -0.09 0.02 0.18 0.18 Italy -1.38 -1.25 0.39 -0.14 -0.01 0.21 0.41 Luxembourg -1.38 -1.28 0.49 - -0.20 0.10 0.12 Spain -1.38 -1.31 0.71 -0.06 -0.40 0.29 0.18 New Zealand -1.35 -1.30 0.35 0.08 -0.22 0.07 0.31 Sweden -1.34 -1.33 0.55 -0.09 0.10 0.17 -0.17 Austria -1.22 -1.16 0.32 - -0.10 0.04 0.34 Netherlands -1.22 -0.99 0.54 -0.03 -0.05 0.16 0.31 Greece -1.16 -1.11 0.37 - -0.03 -0.01 0.06 Norway -1.13 -1.12 0.58 - - - - Israel -0.99 -0.85 0.28 0.06 -0.21 -0.04 0.11 Estonia -0.82 -0.81 0.37 0.05 -0.22 0.23 -0.17 Iceland -0.73 -0.71 0.24 0.11 -0.15 0.05 0.03 OECD Average -1.54 -1.48 0.45 0.00 -0.15 0.08 0.15
*model controls also for the PISA index of economic, social and cultural status (ESCS) Coefficients from two-level random intercept models Coefficients in bold are statistically significant
82. The exponentiation of these two coefficients gives the odds ratios of: e-2.18= 0.11 and e-2.06= 0.13. Thus the odds of Slovak girls which depict the plan to work in engineering or computing are only 0.11 of the odds for Slovak boys in the first model. When the controls for "differences in science performance" and "course-taking" are introduced, the odds for girls rise to 0.13. Thus, there is effectively no change in the gender gap that can be attributed to these control variables. The greater propensity of girls to shy away from computing and engineering has little to do with the variation in

EDU/WKP(2011)3
30
science performance or course participation between sexes, although it is the higher achievers in science who do contemplate such careers at all. This is the case in all OECD countries.
83. The order of countries in Table 2a follows the decreasing gender gap. While, within the OECD, in the highly differentiated education systems of the Slovak Republic, Switzerland, and the internally differentiated the USA and the United Kingdom have students with the most sex-segregated preferences for engineering, the gap between sexes in Israel, Estonia and Iceland is considerably smaller. In Iceland the odds of expecting a career in engineering for girls are 0.48 (e-0.73=0.48). This is considerably more than the figure for the Slovak Republic (e-2.18=0.11), but this estimate changes very little after the introduction of the controls equivalent to the assumption that girls and boys have identical science achievement and take the same science subjects.
84. Good results in science assessment are positively correlated with an inclination towards engineering or computing in all OECD countries. With respect to course-taking, students who do courses in biology are less likely to consider engineering as their career path, what is indicated by the mostly negative coefficients in Table 2a. Chemistry courses do not discourage students from considering this type of employment in Italy, Spain, Estonia and Portugal, but make little difference in most other places. Finally, the physics courses have a strong association with computing and engineering careers in many of PISA 2006 participating countries, including Italy, the Slovak Republic, Ireland and Korea.
85. The relationship between science performance, course-participation and plans to work as an engineer or computer scientist is similar in most partner countries. However, in contrast to the OECD, where girls are less than boys prepared to consider this type of a career, girls in Montenegro, Indonesia and Bulgaria are as willing as boys to enter engineering and computing. The gender gap decreases a little after controlling for science performance and course taking in the UK, Hungary, Germany and Belgium. Yet, in no country can the gender gap in expectations be entirely explained by the differences in science performance and course-taking.
86. In another analogy with the OECD patterns, specific high school courses seem conducive of contemplating engineering as a career in only a handful countries. Biology, as a subject, decreases chances of planning a career in engineering in Romania and Chinese Taipei. Physics courses raise an interest in these careers in Croatia, Kyrgyzstan, Hong-Kong and Jordan. Tunisia is the only place where more participation in physics courses actually decreases an interest in engineering.
87. Tables 3a and 3b present the results of two-level logit regressions which predict expectations of a career in health sciences from the same set of science-learning predictors.
88. As previously shown, in all OECD countries, girls are far more interested in health-related careers than boys, which is also the case when nursing and midwifery are excluded. The largest difference between girls' and boys' interest in health is in Switzerland, Norway and the Netherlands where female students are more than five times as likely to plan employment in this field (e.g. for Switzerland e2.07=7.92 which means that girls' odds of expecting a career in health are almost eight times larger than the odds for boys). The smallest gap in the enthusiasm for health as a career is between boys and girls is in Mexico, Greece and Korea, but even there girls are nearly twice as likely as boys to hope to enter the health sector as employees.

EDU/WKP(2011)3
31
Table 2b. Science performance, course-taking and expected career in engineering. Partner countries
Expected career in computing/engineering
Model 1 Model 2*
Fe
mal
e
Fem
ale
Scie
nce
perf
orm
ance
sc
ale
Gen
eral
sci
ence
co
urse
s
Bio
logy
cou
rses
Che
mis
try
cour
ses
Phys
ics
cour
ses
coeff. coeff. coeff. coeff. coeff. coeff. coeff. Macao-China -1.96 -1.98 0.68 0.04 0.12 0.00 0.06 Hong Kong-China -1.89 -1.81 0.40 0.04 -0.18 -0.24 0.59 Chinese Taipei -1.89 -1.84 0.24 0.02 -0.15 -0.05 0.21 Azerbaijan -1.64 -1.64 0.26 - -0.10 0.27 0.00 Russian Federation -1.61 -1.58 0.38 -0.18 -0.08 0.80 -0.53 Romania -1.47 -1.32 0.81 0.06 -0.12 -0.09 0.06 Colombia -1.47 -1.43 0.22 -0.01 -0.05 -0.05 0.11 Croatia -1.46 -1.35 0.39 - 0.06 -0.15 0.58 Lithuania -1.43 -1.47 0.52 - -0.13 -0.05 0.06 Serbia -1.36 -1.31 0.56 - -0.23 -0.04 0.34 Kyrgyzstan -1.32 -1.26 0.60 0.13 -0.09 -0.13 0.18 Argentina -1.28 -1.29 0.32 0.11 -0.08 0.03 -0.04 Brazil -1.17 -1.10 0.41 0.13 -0.08 -0.07 0.12 Latvia -1.15 -1.15 0.41 -0.02 -0.05 0.07 0.03 Uruguay -1.11 -1.05 0.38 0.08 -0.20 0.28 0.02 Tunisia -0.87 -0.81 0.49 0.11 0.03 0.09 -0.12 Jordan -0.80 -0.87 0.30 -0.02 -0.05 0.00 0.14 Thailand -0.54 -0.53 0.44 0.12 0.02 -0.04 0.08 Bulgaria -0.18 -0.20 0.10 - 0.02 0.04 -0.04 Indonesia -0.08 -0.05 0.02 -0.01 0.02 0.04 0.05 Montenegro 0.11 0.15 0.11 -0.01 0.00 0.18 0.01
*model controls also for the PISA index of economic, social and cultural status (ESCS) Coefficients from two-level random intercept models Coefficients in bold are statistically significant
89. A solid performance in science increases chances of planning a career in this group of occupations everywhere. Taking courses in general science also has a positive impact, illustrated by coefficients greater than zero in many OECD countries, with the sole exception of Italy. Studying biology and chemistry in high school correlates with students' hopes to work in health, although the relationship is not statistically significant in many nations. In contrast, if participation in physics classes is statistically different from zero, its association with health career expectations tends to be negative: physics rarely (only in France and Slovenia) goes together with the expectations of working in health.
90. The comparison of the gender coefficients in the baseline Model 1 and Model 2 with the controls reveals that had girls not differed in any way from boys in their science performance and patterns of course-taking, they would be even more keen on careers in health, surpassing the levels of interest among boys by even greater ratios.
91. This tendency is visible in Denmark, Germany, Spain, France and Hungary, to name only a few countries. The largest predicted increase in the likelihood of girls expecting health careers, net of performance and course participation is in Portugal where the odds of girls rise from 3.63 (which equals e1.29) to 5.16 (i.e. e1.64).
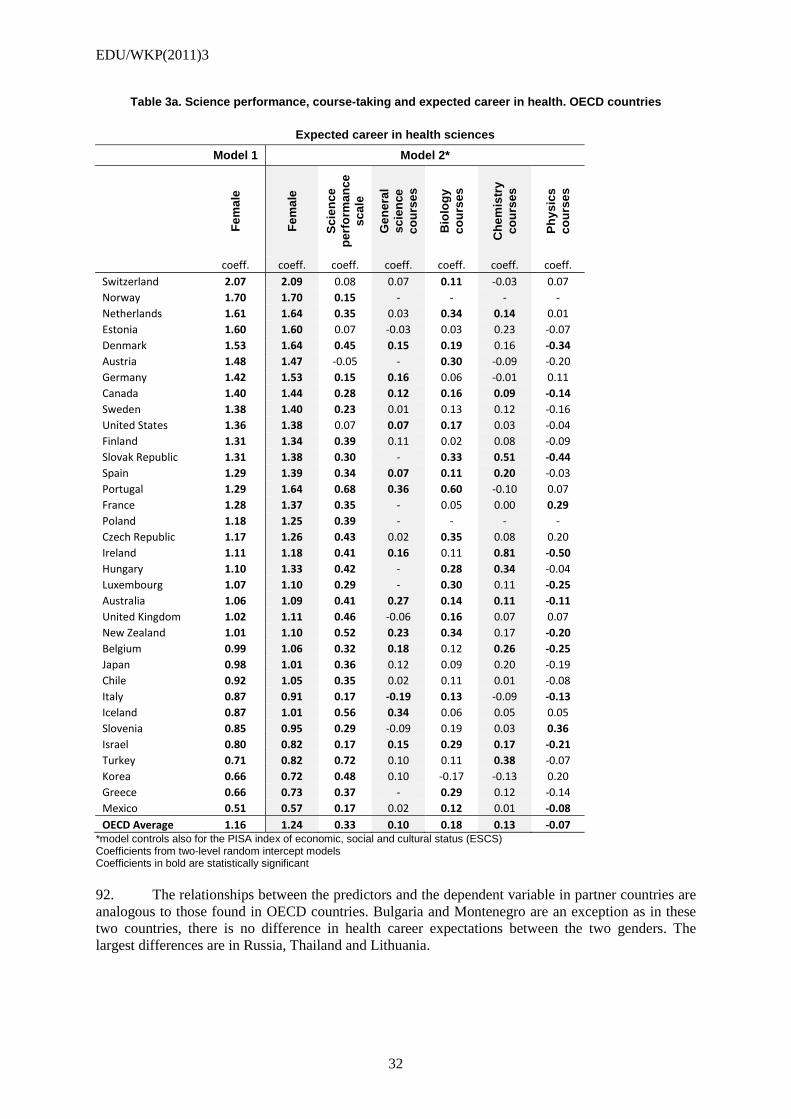
EDU/WKP(2011)3
32
Table 3a. Science performance, course-taking and expected career in health. OECD countries
Expected career in health sciences
Model 1 Model 2*
Fe
mal
e
Fem
ale
Scie
nce
perf
orm
ance
sc
ale
Gen
eral
sc
ienc
e co
urse
s
Bio
logy
co
urse
s
Che
mis
try
cour
ses
Phys
ics
cour
ses
coeff. coeff. coeff. coeff. coeff. coeff. coeff. Switzerland 2.07 2.09 0.08 0.07 0.11 -0.03 0.07 Norway 1.70 1.70 0.15 - - - - Netherlands 1.61 1.64 0.35 0.03 0.34 0.14 0.01 Estonia 1.60 1.60 0.07 -0.03 0.03 0.23 -0.07 Denmark 1.53 1.64 0.45 0.15 0.19 0.16 -0.34 Austria 1.48 1.47 -0.05 - 0.30 -0.09 -0.20 Germany 1.42 1.53 0.15 0.16 0.06 -0.01 0.11 Canada 1.40 1.44 0.28 0.12 0.16 0.09 -0.14 Sweden 1.38 1.40 0.23 0.01 0.13 0.12 -0.16 United States 1.36 1.38 0.07 0.07 0.17 0.03 -0.04 Finland 1.31 1.34 0.39 0.11 0.02 0.08 -0.09 Slovak Republic 1.31 1.38 0.30 - 0.33 0.51 -0.44 Spain 1.29 1.39 0.34 0.07 0.11 0.20 -0.03 Portugal 1.29 1.64 0.68 0.36 0.60 -0.10 0.07 France 1.28 1.37 0.35 - 0.05 0.00 0.29 Poland 1.18 1.25 0.39 - - - - Czech Republic 1.17 1.26 0.43 0.02 0.35 0.08 0.20 Ireland 1.11 1.18 0.41 0.16 0.11 0.81 -0.50 Hungary 1.10 1.33 0.42 - 0.28 0.34 -0.04 Luxembourg 1.07 1.10 0.29 - 0.30 0.11 -0.25 Australia 1.06 1.09 0.41 0.27 0.14 0.11 -0.11 United Kingdom 1.02 1.11 0.46 -0.06 0.16 0.07 0.07 New Zealand 1.01 1.10 0.52 0.23 0.34 0.17 -0.20 Belgium 0.99 1.06 0.32 0.18 0.12 0.26 -0.25 Japan 0.98 1.01 0.36 0.12 0.09 0.20 -0.19 Chile 0.92 1.05 0.35 0.02 0.11 0.01 -0.08 Italy 0.87 0.91 0.17 -0.19 0.13 -0.09 -0.13 Iceland 0.87 1.01 0.56 0.34 0.06 0.05 0.05 Slovenia 0.85 0.95 0.29 -0.09 0.19 0.03 0.36 Israel 0.80 0.82 0.17 0.15 0.29 0.17 -0.21 Turkey 0.71 0.82 0.72 0.10 0.11 0.38 -0.07 Korea 0.66 0.72 0.48 0.10 -0.17 -0.13 0.20 Greece 0.66 0.73 0.37 - 0.29 0.12 -0.14 Mexico 0.51 0.57 0.17 0.02 0.12 0.01 -0.08 OECD Average 1.16 1.24 0.33 0.10 0.18 0.13 -0.07
*model controls also for the PISA index of economic, social and cultural status (ESCS) Coefficients from two-level random intercept models Coefficients in bold are statistically significant 92. The relationships between the predictors and the dependent variable in partner countries are analogous to those found in OECD countries. Bulgaria and Montenegro are an exception as in these two countries, there is no difference in health career expectations between the two genders. The largest differences are in Russia, Thailand and Lithuania.

EDU/WKP(2011)3
33
Table 3b. Science performance, course-taking and expected career in health. Partner countries
Expected career in health sciences
Model 1 Model 2*
Fe
mal
e
Fem
ale
Scie
nce
perf
orm
ance
sc
ale
Gen
eral
sci
ence
co
urse
s
Bio
logy
cou
rses
Che
mis
try
cour
ses
Phys
ics
cour
ses
coeff. coeff. coeff. coeff. coeff. coeff. coeff. Russian Federation 1.47 1.46 -0.05 -0.16 -0.27 -0.26 0.04 Thailand 1.44 1.52 0.59 0.08 0.06 0.04 0.10 Lithuania 1.29 1.29 0.38 - 0.30 0.32 -0.42 Latvia 1.26 1.32 0.28 0.05 0.35 0.23 -0.40 Romania 1.19 1.23 0.17 0.06 0.25 0.20 -0.37 Kyrgyzstan 1.17 1.16 -0.33 -0.07 0.11 0.06 -0.07 Brazil 1.11 1.11 -0.06 0.02 -0.01 0.00 -0.11 Colombia 1.03 1.06 0.09 0.03 0.12 0.00 -0.13 Argentina 1.02 1.04 0.15 -0.02 0.02 0.09 -0.07 Azerbaijan 1.01 1.02 0.17 - 0.21 0.06 -0.10 Uruguay 0.94 0.97 0.02 0.00 0.28 0.05 -0.23 Tunisia 0.76 0.82 0.46 0.07 0.02 0.03 0.05 Macao-China 0.57 0.63 0.36 0.09 0.14 0.05 0.13 Croatia 0.55 0.80 0.37 - 0.04 0.25 0.60 Serbia 0.43 0.50 0.32 - 0.22 -0.35 0.14 Chinese Taipei 0.38 0.47 0.43 -0.10 -0.01 0.47 -0.10 Hong Kong-China 0.37 0.60 0.65 0.07 0.58 0.16 -0.31 Jordan 0.24 0.19 0.45 0.00 0.03 -0.02 0.03 Bulgaria 0.19 0.17 0.09 - -0.07 0.02 -0.03 Indonesia 0.17 0.19 0.17 0.01 -0.01 0.01 -0.04 Montenegro 0.00 0.05 0.31 0.12 -0.14 0.06 -0.05
*model controls also for the PISA index of economic, social and cultural status (ESCS) Coefficients from two-level random intercept models Coefficients in bold are statistically significant
93. On the whole, most of the differences between boys and girls in career expectations cannot be attributed to the gender differences in science performance, where such occur, or to gender differentiation in the distribution of students across various science courses. Largely independent of these two factors, girls tend to shun computing and engineering, while boys are less attracted to health professions.
94. While much attention has been devoted to the underrepresentation of women in certain fields of science (Hill, Corbett, and Rose, 2010; Howel, Blaisdell, Figueiredo, Gorham, and Hatch 2005; Matyas and Dix 1992), the question that emerges from this analysis is whether similar concern should not be raised over the underrepresentation of young men among health career seekers. While it is true that women continue to be crowded in the lower status health occupations (Grusky and Charles 2004) they have also been making inroads into top status health jobs. Supplementary analysis, not shown here, in which midwifery and nursing were excluded from the list of health occupations, confirms the much higher interest among girls in careers within this subfield of science. Given these patterns in adolescent occupational expectations, it is possible that, in the future, the segregation of men into computing, engineering and physics and women into biology, agriculture and health will not only continue but further intensify.
95. Another aspect of students' educational experiences which may be relevant to expectations is the timing of students' branching out into vocational versus academic tracks. In many countries women have fewer employment opportunities outside of the non-manual sector and thus there is a

EDU/WKP(2011)3
34
marked overrepresentation of men in manual employment (Charles and Grusky, 2004). Therefore it is likely that the gender divide evident in the labour market is likely to manifest as early as the first educational transition in which students are divided between academic and vocationally oriented programs. This is because the former are, down the track, related to non-manual and the latter to manual employment. In some PISA-participating countries such a transition occurs before the age of 15 but in others students are not grouped into specific programs until later (PISA 2006 Database Table 5.2). If boys are more likely than girls to populate vocational programs, this difference in student distributions can affect the size of the gender gap in science-related career plans.
Occupational ambitions of students in vocational tracks at age 15
96. Students’ placement in either vocationally or pre-vocationally-oriented programs is a factor defining not only educational but also career options. It is the first transition which encourages students, for the first time in their lives to seriously and realistically assess their future educational and occupational prospects. Students in vocational tracks are generally less oriented towards the highest status occupations (Sikora and Saha, 2009) and thus, by definition, less likely to nominate, as their goal, one of the science-related occupations in the top ISCO88 major groups.
97. Table 4a presents the effects of placement in a vocational program on chances of planning employment in engineering and computing or health (Models 2a). Because in some countries there are no students in vocational tracks but instead the PISA sample comprises students at lower and higher International Standard Classification of Education (ISCED) levels (UNESCO, 2006), an alternative version of the model (2b) utilises ISCED level as an indicator of important educational transitions which might foster serious thinking about future educational and career prospects. The estimates are provided only for countries in which at least 3 percent of students in the sample could be identified as pre-vocational or vocational track placements. The influence of such placement on career plans related to either health or engineering is present in only some countries. In Italy, Japan, Korea, Mexico and the Slovak Republic vocational program placement is actually conducive of planning employment in engineering or computing. In contrast in Belgium, it has a deterring impact.
98. A vocational track placement decreases chances of expecting employment in health sciences in all OECD countries where the relationship is statistically significant. In some contrast to the vocational program, ISCED level has no systematic relationship to these particular career plans.
99. The important feature of analyses in Tables 4a and 4b is that, as was the case with science performance and course taking, vocational program placement makes no difference to the gender gap in career expectations. This pattern is consistent across all countries, as even when point estimates for the gender coefficients change, they do so by a relatively small margin.

EDU/WKP(2011)3
35
Table 4a. Vocational track, ISCED level and expected career in engineering or health. OECD countries.
Expected career in computing/engineering Expected career in health sciences
Model 1 Model 2a* Model 2b* Model 1 Model 2a* Model 2b*
Fem
ale
Fem
ale
Voca
tiona
l pr
ogra
m
Fem
ale
ISC
ED le
vel
Fem
ale
Fem
ale
Voca
tiona
l pr
ogra
m
Fem
ale
ISC
ED le
vel
coeff. coeff. coeff. coeff. coeff. coeff. coeff. coeff. coeff. coeff. Australia -1.92 -1.93 -0.09 -1.92 -0.21 1.06 1.09 -0.57 1.11 -0.14 Austria -1.22 -1.20 -0.07 -1.18 -0.71 1.48 1.47 -0.92 1.51 -0.23 Belgium -1.54 -1.51 -0.48 -1.46 -0.22 0.99 1.04 -0.85 1.09 0.25 Canada -1.85 - - -1.86 -0.06 1.40 - - 1.43 0.10 Chile -1.57 -1.52 -0.13 -1.52 0.35 0.92 1.05 -0.28 1.05 -0.22 Czech Republic -1.79 -1.74 -0.12 -1.73 -0.33 1.17 1.22 -1.41 1.29 -0.21 Denmark -1.47 - - -1.47 1.06 1.53 - - 1.63 -1.15 Estonia -0.82 - - -0.80 -0.41 1.60 - - 1.63 -0.71 Finland -1.65 - - - - 1.31 - - 1.33 - France -1.86 -1.81 -0.42 -1.80 -0.07 1.28 1.37 -0.07 1.37 0.02 Germany -1.55 -1.47 -1.41 -1.47 -1.07 1.42 1.50 -0.47 1.50 -0.05 Greece -1.16 -1.11 -0.04 -1.11 -0.50 0.66 0.74 0.58 0.72 -0.21 Hungary -1.84 -1.69 -0.01 -1.71 1.39 1.10 1.19 -1.13 1.25 1.47 Iceland -0.73 - - -0.72 0.79 0.87 - - 0.97 -0.89 Ireland -1.90 -1.90 -0.71 -1.90 -0.03 1.11 1.19 0.21 1.20 -0.15 Israel -0.99 -0.92 0.04 -0.92 -0.46 0.80 0.86 -0.08 0.86 0.38 Italy -1.38 -1.33 0.30 -1.35 1.20 0.87 0.80 -1.89 0.97 -0.14 Japan -1.53 -1.53 0.49 - - 0.98 1.01 -0.68 - - Korea -1.56 -1.59 0.97 -1.57 0.82 0.66 0.70 -0.84 0.70 0.04 Luxembourg -1.38 -1.32 0.27 -1.33 0.12 1.07 1.13 -0.30 1.16 -0.20 Mexico -1.49 -1.44 0.31 -1.46 0.21 0.51 0.55 -0.20 0.56 -0.04 Netherlands -1.22 -1.15 -0.46 -1.13 -0.05 1.61 1.68 0.26 1.68 -0.18 New Zealand -1.35 - - -1.35 -0.02 1.01 - - 1.09 -0.38 Norway -1.13 - - -1.12 -0.40 1.70 - - 1.71 -0.60 Poland -1.76 - - -1.76 -0.13 1.18 - - 1.26 -0.36 Portugal -1.67 -1.62 0.32 -1.66 0.19 1.29 1.42 -0.48 1.42 0.21 Slovak Republic -2.18 -2.10 -0.21 -2.08 -0.29 1.31 1.36 -1.24 1.40 -0.61 Slovenia -1.79 -1.73 0.21 -1.75 0.41 0.85 0.84 -1.92 0.93 -0.36 Spain -1.38 - - -1.37 1.60 1.29 - - 1.36 - Sweden -1.34 -1.33 -0.93 -1.33 0.06 1.38 1.40 -1.07 1.40 0.30 Switzerland -2.00 -1.97 0.11 -1.97 -0.21 2.07 2.07 -1.27 2.08 -0.25 Turkey -1.38 -1.39 0.27 -1.40 -0.57 0.71 0.69 -1.03 0.73 -1.30 United Kingdom -1.95 - - -1.95 1.46 1.02 - - 1.11 0.41 United States -1.96 - - -1.95 0.35 1.36 - - 1.36 0.24 OECD Average -1.54 -1.54 -0.08 -1.50 0.13 1.16 1.15 -0.68 1.24 -1.12
*model controls also for the PISA index of economic, social and cultural status (ESCS) and the science performance scale Coefficients from two-level random intercept models Coefficients in bold are statistically significant

EDU/WKP(2011)3
36
Table 4b. Vocational track, ISCED level and expected career in engineering. Partner countries.
Expected career in computing/engineering Expected career in health sciences
Model 1 Model 2a* Model 2b* Model 1 Model 2a* Model 2b*
Fem
ale
Fem
ale
Voca
tiona
l pr
ogra
m
Fem
ale
ISC
ED le
vel
Fem
ale
Fem
ale
Voca
tiona
l pr
ogra
m
Fem
ale
ISC
ED le
vel
coeff. coeff. coeff. coeff. coeff. coeff. coeff. coeff. coeff. coeff. Argentina -1.28 -1.29 0.64 -1.29 -0.16 1.02 1.02 -0.76 1.03 0.08 Azerbaijan -1.64 -1.65 0.04 -1.65 -0.17 1.01 1.00 -1.04 1.01 -0.23 Brazil -1.17 - - -1.12 0.03 1.11 - - 1.11 0.17 Bulgaria -0.18 -0.21 -0.08 -0.20 0.44 0.19 0.20 0.13 0.17 0.27 Chinese Taipei -1.89 -1.88 0.21 -1.87 -0.21 0.38 0.44 -0.56 0.45 -0.59 Colombia -1.47 -1.44 0.25 -1.47 0.26 1.03 1.06 -0.08 1.06 -0.03 Croatia -1.46 -1.39 0.03 - - 0.55 0.64 -1.03 - - Hong Kong-China -1.89 -1.82 0.22 -1.82 -0.33 0.37 0.52 -0.41 0.54 -0.25 Indonesia -0.08 -0.06 1.94 -0.07 0.63 0.17 0.18 -2.34 0.19 0.12 Jordan -0.80 - - - - 0.24 - - - - Kyrgyzstan -1.32 -1.26 -0.32 -1.25 -0.24 1.17 1.16 -3.54 1.15 0.24 Latvia -1.15 -1.14 -0.49 -1.14 -0.49 1.26 1.29 -0.15 1.29 -0.15 Lithuania -1.43 -1.49 -15.61 - - 1.29 1.30 -30.00 - - Macao-China -1.96 -1.96 0.64 -1.97 0.04 0.57 0.60 0.49 0.59 0.14 Montenegro 0.11 0.03 -0.81 - - 0.00 0.00 -0.86 - - Romania -1.47 -1.35 -0.57 - - 1.19 1.18 -1.01 - - Russian Federation -1.61 -1.56 0.25 -1.58 0.14 1.47 1.38 -3.68 1.47 -0.14 Serbia -1.36 -1.33 0.11 -1.34 0.62 0.43 0.48 -0.73 0.50 -0.19 Thailand -0.54 -0.54 0.28 -0.56 0.21 1.44 1.47 -1.81 1.49 -0.03 Tunisia -0.87 - - -0.86 0.67 0.76 - - 0.77 0.36 Uruguay -1.11 -1.05 -0.03 -1.08 0.33 0.94 0.92 -1.54 0.93 0.32
*model controls also for the PISA index of economic, social and cultural status (ESCS) and the science performance scale Coefficients from two-level random intercept models Coefficients in bold are statistically significant
100. This examination of country-by-country patterns in vocational placement and ISCED level differences brings no insights into the reasons behind the gender gap in science-related career plans. Students in vocational tracks are less likely to consider health science careers in a number of countries, and in several countries such placement fosters more interest in engineering and computing as fields of future employment. Overall, however, these variables make little contribution to explaining the differences in preferences between boys and girls.
101. Although there are no reasons to expect that the gender gap in expectations might be related to the migrant status within student populations, it is informative to consider the contrast between the migrant and native stock students as a supplement to the gender gap analysis. Before proceeding to the examination of socio-psychological variables related to students' confidence in individual abilities and self-efficacy the next section focuses on the differences in plans of the migrant and native students.
Occupational ambitions of migrant students
102. Ethnic minority students, in country-specific studies, had been often found to have higher than expected levels of aspirations and expectations (Feliciano and Rumbaut 2005; Khattab 2003;

EDU/WKP(2011)3
37
Portes, McLeod, and Parker 1978; Wells, Bills, Park, and Chen 2007). Economic, social and cultural resources of immigrant students are often limited compared with wealth and cultural competence of locally born students. This is why in many countries which experience steadily rising inflows of migration, foreign born students have been lagging in performance, compared with non-migrants (OECD, 2007a: 175). Yet, American studies found that first and second generation migrant youth held “very high ambitions and hopes of the future” (Feliciano and Rumbaut 2005: 1088) despite systematic evidence that migrant students underperform by a significant margin. This lower level of performance has been confirmed in a number of PISA-participating countries whose student populations include non-trivial numbers of migrant children (Ammermueller 2007; Heus, Dronkers, and Levels 2008; OECD 2007a; Rangvid 2007). Since the PISA surveys include only students fluent in the national language in which tests are administered, the actual effect of the migration status may be underestimated and thus, in reality, even more substantial.
103. In many OECD countries (Table 5a) migrant students have stronger hopes to secure science-related employment than their locally born counterparts. In this analysis migrant students comprise both those foreign born and those identified as second generation migrants, because preliminary analyses which considered these groups separately revealed few differences between them. However, only countries in which migrant students comprise at least 3 percent of the student population have been included in the analysis in this section.
104. Migrant students are also more interested in health-science employment in many OECD countries, including Australia, New Zealand, Canada, the US and a number of countries in Western Europe. This is consistent with the expectation that the children of migrants are particularly oriented towards upward mobility and the attainment of high status jobs. This analysis suggests that science-related employment might be the preferred path of advancement in a number of countries where migrant students account for a non-trivial part of adolescent population. Although academic achievement of migrant students falls behind that of their native counterparts in many countries in which migration policy does not favour skilled migration (OECD, 2007a: 175), overall, there is a positive association between migrant status and ambitious occupational plans. This finding is noteworthy as it poses interesting questions for policy makers. While migrant students in many countries perform at a lower level, they are optimistic and hold high expectations with regard to their future occupational achievement. Where their socio-economic background is often significantly lower than the mainstream average, they aspire as high as their native peers; where their socio-economic background matches that of their native peers, they expect more of themselves. The challenge for educational policymaking is to effectively convert these high levels of ambition into more academic success.

EDU/WKP(2011)3
38
Table 5a. Migrant students and expectations of future employment in engineering or health. OECD
countries.
Expected career in computing/engineering Expected career in health
sciences
Model 1 Model 2* Model 1 Model 2*
Fem
ale
Fem
ale
Mig
rant
st
uden
ts
Fem
ale
Fem
ale
Mig
rant
st
uden
ts
coeff. coeff. coeff. coeff. coeff. coeff. Australia -1.92 -1.93 0.68 1.06 1.12 0.60 Austria -1.22 -1.20 0.76 1.48 1.51 0.55 Belgium -1.54 -1.48 0.55 0.99 1.11 0.68 Canada -1.85 -1.85 0.48 1.40 1.45 0.59 Chile - - - - - - Czech Republic - - - - - - Denmark -1.47 -1.47 1.00 1.53 1.66 1.43 Estonia -0.82 -0.83 -0.11 1.60 1.65 0.60 Finland - - - - - - France -1.86 -1.81 0.60 1.28 1.39 0.29 Germany -1.55 -1.45 0.58 1.42 1.54 0.13 Greece -1.16 -1.14 0.68 0.66 0.73 -0.04 Hungary - - - - - - Iceland - - - - - - Ireland -1.90 -1.90 0.34 1.11 1.18 0.43 Israel -0.99 -0.91 0.32 0.80 0.87 0.20 Italy -1.38 -1.36 0.51 0.87 0.97 0.39 Japan - - - - - - Korea - - - - - - Luxembourg -1.38 -1.31 0.18 1.07 1.12 0.47 Mexico - - - - - - Netherlands -1.22 -1.12 0.45 1.61 1.69 0.08 New Zealand -1.35 -1.33 0.32 1.01 1.08 0.77 Norway -1.13 -1.12 0.39 1.70 1.70 0.79 Poland Portugal -1.67 -1.64 0.29 1.29 1.45 0.12 Slovak Republic - - - - - - Slovenia -1.79 -1.74 -0.08 0.85 0.91 0.32 Spain -1.38 -1.37 0.32 1.29 1.36 0.70 Sweden -1.34 -1.33 0.35 1.38 1.44 1.25 Switzerland -2.00 -1.99 0.58 2.07 2.08 0.39 Turkey - - - - - - United Kingdom -1.95 -1.96 0.28 1.02 1.11 0.90 United States -1.96 -1.91 0.82 1.36 1.40 0.41 OECD Average -1.51 -1.49 0.45 1.25 1.33 0.52
*model controls also for the PISA index of economic, social and cultural status (ESCS) and the science performance scale Coefficients from two-level random intercept models Coefficients in bold are statistically significant
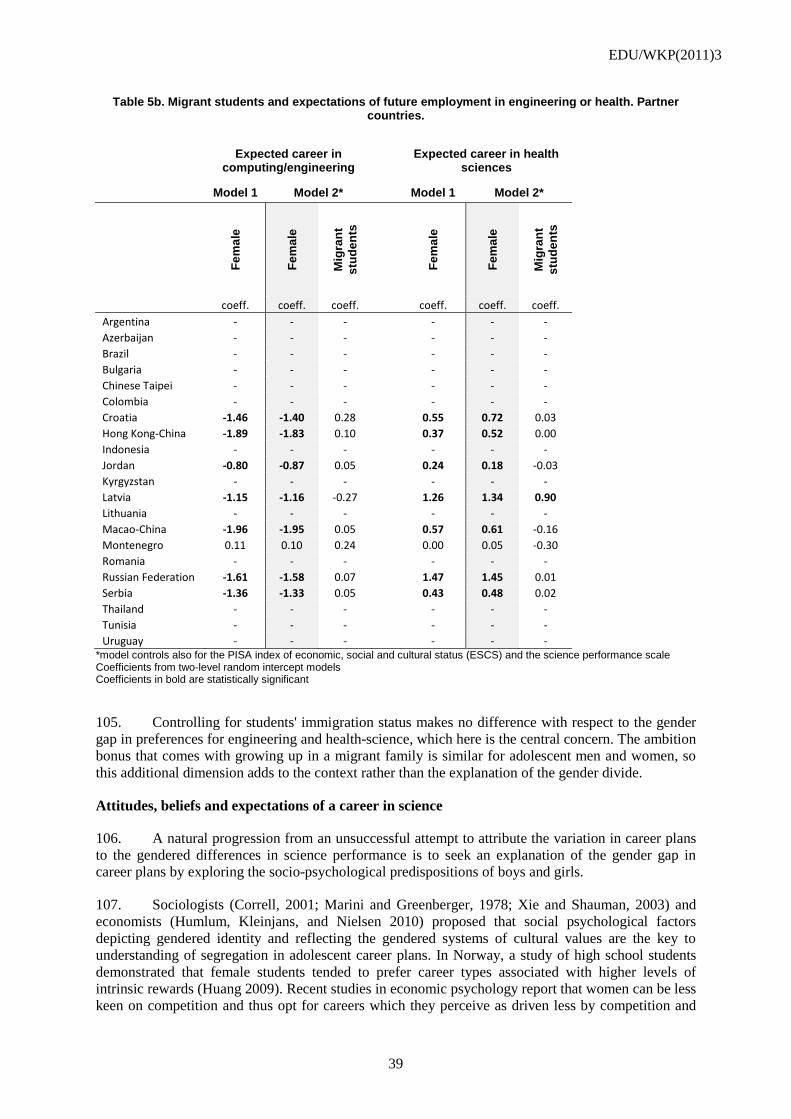
EDU/WKP(2011)3
39
Table 5b. Migrant students and expectations of future employment in engineering or health. Partner countries.
Expected career in computing/engineering Expected career in health
sciences
Model 1 Model 2* Model 1 Model 2*
Fem
ale
Fem
ale
Mig
rant
st
uden
ts
Fem
ale
Fem
ale
Mig
rant
st
uden
ts
coeff. coeff. coeff. coeff. coeff. coeff. Argentina - - - - - - Azerbaijan - - - - - - Brazil - - - - - - Bulgaria - - - - - - Chinese Taipei - - - - - - Colombia - - - - - - Croatia -1.46 -1.40 0.28 0.55 0.72 0.03 Hong Kong-China -1.89 -1.83 0.10 0.37 0.52 0.00 Indonesia - - - - - - Jordan -0.80 -0.87 0.05 0.24 0.18 -0.03 Kyrgyzstan - - - - - - Latvia -1.15 -1.16 -0.27 1.26 1.34 0.90 Lithuania - - - - - - Macao-China -1.96 -1.95 0.05 0.57 0.61 -0.16 Montenegro 0.11 0.10 0.24 0.00 0.05 -0.30 Romania - - - - - - Russian Federation -1.61 -1.58 0.07 1.47 1.45 0.01 Serbia -1.36 -1.33 0.05 0.43 0.48 0.02 Thailand - - - - - - Tunisia - - - - - - Uruguay - - - - - -
*model controls also for the PISA index of economic, social and cultural status (ESCS) and the science performance scale Coefficients from two-level random intercept models Coefficients in bold are statistically significant
105. Controlling for students' immigration status makes no difference with respect to the gender gap in preferences for engineering and health-science, which here is the central concern. The ambition bonus that comes with growing up in a migrant family is similar for adolescent men and women, so this additional dimension adds to the context rather than the explanation of the gender divide.
Attitudes, beliefs and expectations of a career in science
106. A natural progression from an unsuccessful attempt to attribute the variation in career plans to the gendered differences in science performance is to seek an explanation of the gender gap in career plans by exploring the socio-psychological predispositions of boys and girls.
107. Sociologists (Correll, 2001; Marini and Greenberger, 1978; Xie and Shauman, 2003) and economists (Humlum, Kleinjans, and Nielsen 2010) proposed that social psychological factors depicting gendered identity and reflecting the gendered systems of cultural values are the key to understanding of segregation in adolescent career plans. In Norway, a study of high school students demonstrated that female students tended to prefer career types associated with higher levels of intrinsic rewards (Huang 2009). Recent studies in economic psychology report that women can be less keen on competition and thus opt for careers which they perceive as driven less by competition and

EDU/WKP(2011)3
40
more by social co-operation and care (Humlum, Kleinjans, and Nielsen, 2010). All of these explanations are consistent with the logic of the cultural gender essentialism thesis proposed by Charles and Grusky (2004), except that these studies focus on micro-social or psychological manifestations of what can be seen as a global institutional culture which shapes adolescent identities and the social constructions of femininity and masculinity. In line with its predictions, studies in the USA found that girls in high school who enrol in maths and science classes of highest difficulty see themselves as "less feminine, attractive, popular and sociable" (Matyas and Dix 1992; Xie and Shauman 2003: 48). Thus if imageries associated with certain professions seem to be in profound opposition to the cultural norms of femininity or masculinity, the choice of a career incompatible with such norms must come at a high cost, despite the promise of potential material or non-material rewards.
108. The analysis in this section focuses on indicators of students' self-efficacy and self-concept to explore the possibility that girls have lower levels of self-confidence in their science performance and thus are less likely to seek more demanding careers. Both science self-efficacy and self-concept are the potential causes of gender differences according to the argument which posits that girls, despite their equally good performance in science, lag behind boys in self-confidence and thus see little point in investing effort and time in their science skills. Prior analyses of science self-concept, showed that boys in most PISA 2006 participating countries had higher levels of belief in their own abilities than girls (OECD, 2007a: Table 3.21). In some countries the differences were substantial.
109. The first measure, science self-efficacy, probed students' perceptions that they could easily "Recognise the science question that underlies a newspaper report on a health issue"; "Explain why earthquakes occur more frequently in some areas than in others"; "Describe the role of antibiotics in the treatment of disease"; "Identify the science question associated with the disposal of garbage"; "Predict how changes to an environment will affect the survival of certain species"; "Interpret the scientific information provided on the labelling of food items "; "Discuss how new evidence can lead you to change your understanding about the possibility of life on Mars" and "Identify the better of two explanations for the formation of acid rain" (OECD, 2007a: 134; OECD, 2007b: 323)
110. The second measure, science self-concept, comprised students' self-evaluation in response to the following items : "Learning advanced science topics would be easy for me", "I can usually give good answers to test questions on school science topics ", "I learn science topics quickly", "Science topics are easy for me", "When I am being taught science I can understand the concepts very well" and "I can easily understand new ideas in science" (OECD, 2007b: 323).
111. Overall, as evident in Tables 6a and 6b, science self-concept is a better predictor of expectations to work either in engineering or in health than science self-efficiency.
112. While, in many countries, coefficients for self-efficacy are not significantly different from zero, the belief in one's own ability is positively associated with an expectation to work in engineering or computing in many countries. There are exceptions to this pattern as neither attitudinal variable contributes any explanatory power in Switzerland, the USA, Slovenia, Czech Republic, Portugal, Mexico, Italy, Luxembourg, Austria or Estonia, as far as engineering is concerned. In some contrast to this trend, the positive association between science-related self-confidence and a plan to enter health sector employment holds in all OECD countries, without a single exception.
113. While the discussion of these patterns is informative in its own right, the key goal of the analyses in this section is to explore factors which might be capable of bridging the gender gap. Attitudinal variables, which relate to self-confidence and self-efficacy, while most relevant to occupational expectations, make no contribution to the explanation of the gender differences in preferences for these particular career fields. In other words, while boys and girls differ in their confidence levels with respect to science performance, this difference cannot account for the horizontal segregation of their occupational plans within the broad field of science.

EDU/WKP(2011)3
41
114. Gender coefficients in Model 1 and Model 2 change very little. Thus, although boys feel far more comfortable about their science ability in many countries within and outside of OECD (OECD, 2007a: Table 3.21), the gender difference in confidence levels cannot be seen as a key to understanding why students of each gender strongly prefer their own particular niche of science employment. When the difference in science self-efficacy and self-concepts between students is taken into account, the gender gap remains as it was in the baseline estimation. All of the factors so far considered foster a stronger likelihood of considering a science-related employment. But these contributions are above and beyond the systematic gender divide, which is ubiquitous in almost all countries, with only some variation in size.
115. PISA 2006 included a series of questions designed to collect information about students' perceived career preparation and career information levels.
116. The first group of questions, combined into a scale, comprised four items which probed students' perception of being well prepared by their school for a possibility of pursuing a career in science (CARPREP) (OECD, 2007b: 331). Students were asked whether their schools gave them the basic skills for future science employment, whether science subjects offered at school were well suited to the preparation for a broad range of such careers. Moreover, students were also asked whether science classes they were enrolled in served well the purpose of science career preparation and whether teachers were effective in imbuing students with relevant skills. The following statements constituted the scale: "The subjects available at my school provide students with the basic skills and knowledge for a science-related career"; "The school science subjects at my school provide students with the basic skills and knowledge for many different careers"; "The subjects I study provide me with the basic skills and knowledge for a science-related career"; " My teachers equip me with the basic skills and knowledge I need for a science-related career" (OECD, 2007a: 331).
117. Students participating in PISA 2006 have been also asked whether they felt well informed about "Science-related careers that are available in the job market"; "Where to find information about science-related careers"; "The steps a student needs to take if they want a science-related career" and "Employers or companies that hire people to work in science-related careers" . A multi-item scale CARINFO was constructed from these items (OECD, 2007a: 331).
118. If levels of information and the feeling of being well prepared for a science-related career differ systematically between genders, such differences might be conducive to the variation in readiness to plan a science-related career. However, as evident in Table 7a, while these factors are related to higher probability of planning employment in engineering or health in many countries, they do not explain the persisting gender difference in preferences for these subfields of science.
119. The perceptions of oneself as well prepared and informed about the prospects of a science career are positively associated with the plan to work in health in many countries, while the associations between such perceptions and the plan to pursue engineering are less frequent. Only in the UK, Denmark, Spain and the Netherlands do both perceptions foster a higher likelihood of planning a computing or engineering career. In Poland, Hungary, Finland and Lithuania there is even a negative association between the sense of being either well informed or well prepared for a science job and the plan to pursue an occupation in engineering and computing. In contrast, plans for careers in health are mostly positively associated with higher levels of self-assessed career information and preparation. These differential patterns point to the possibility that, in many countries, a number of pro-engineering choices is made by adolescents in the context of little information about the nature and requirements of these jobs. Therefore, it is possible that more comprehensive information programs, focused on these particular occupations, could increase the number of students who develop an interest in them. Conversely, where such programs already exist, the lack of association between high information levels and the intention to work in these occupations is consistent with the assumption that preferring or shunning engineering is driven primarily by the deeply entrenched gender ideologies which construe some occupations as more appropriate than others for particular sexes (Howel et al, 2005). If such gendered ideologies permeate the family and out-of-school

EDU/WKP(2011)3
42
environments of adolescents, isolated efforts of counsellors operating from schools are doomed to encounter resistance from young people whose strong sense of gendered identity has already been formed (Howel et al, 2005).
Table 6a. Science self-efficacy and self-concept and expectations to work in engineering or health.
Expected career in computing/engineering Expected career in health sciences
Model 1 Model 2* Model 1 Model 2*
Fem
ale
Fem
ale
Scie
nce
self-
effic
acy
Scie
nce
self-
conc
ept
Fem
ale
Fem
ale
Scie
nce
self-
effic
acy
Scie
nce
self-
conc
ept
coeff. coeff. coeff. coeff. coeff. coeff. coeff. coeff. Slovak Republic -2.18 -2.08 0.00 0.22 Switzerland 2.07 2.24 0.03 0.36 Switzerland -2.00 -1.98 0.06 0.06 Norway 1.70 1.88 0.06 0.30 United States -1.96 -1.91 -0.04 0.04 Netherlands 1.61 1.95 -0.09 0.48 United Kingdom -1.95 -1.90 -0.06 0.22 Estonia 1.60 1.67 0.11 0.30 Australia -1.92 -1.89 -0.03 0.30 Denmark 1.53 1.99 0.10 0.57 Ireland -1.90 -1.87 -0.03 0.21 Austria 1.48 1.64 0.05 0.26 France -1.86 -1.63 -0.10 0.51 Germany 1.42 1.67 -0.02 0.37 Canada -1.85 -1.84 0.03 0.22 Canada 1.40 1.59 -0.03 0.47 Hungary -1.84 -1.66 -0.04 0.20 Sweden 1.38 1.64 0.10 0.60 Slovenia -1.79 -1.75 -0.02 -0.06 United States 1.36 1.46 -0.01 0.30 Czech Republic -1.79 -1.71 0.01 0.10 Finland 1.31 1.50 -0.06 0.55 Poland -1.76 -1.75 -0.17 0.05 Slovak Republic 1.31 1.49 0.05 0.47 Portugal -1.67 -1.74 -0.09 0.00 Spain 1.29 1.53 0.03 0.55 Finland -1.65 -1.67 -0.14 0.24 Portugal 1.29 1.86 0.09 0.41 Chile -1.57 -1.55 -0.20 0.00 France 1.28 1.59 -0.05 0.50 Korea -1.56 -1.50 0.02 0.26 Poland 1.18 1.36 0.03 0.82 Germany -1.55 -1.40 -0.06 0.22 Czech Republic 1.17 1.41 -0.10 0.68 Belgium -1.54 -1.38 0.00 0.28 Ireland 1.11 1.31 0.05 0.60 Japan -1.53 -1.28 0.14 0.51 Hungary 1.10 1.49 -0.12 0.75 Mexico -1.49 -1.46 0.01 0.01 Luxembourg 1.07 1.30 0.12 0.47 Denmark -1.47 -1.35 -0.10 0.60 Australia 1.06 1.27 -0.03 0.53 Turkey -1.38 -1.36 -0.04 0.42 United Kingdom 1.02 1.30 0.01 0.56 Italy -1.38 -1.34 -0.01 0.14 New Zealand 1.01 1.35 0.02 0.68 Luxembourg -1.38 -1.34 -0.07 -0.03 Belgium 0.99 1.27 0.08 0.55 Spain -1.38 -1.31 -0.06 0.43 Japan 0.98 1.29 0.06 0.49 New Zealand -1.35 -1.30 -0.04 0.24 Chile 0.92 1.19 0.13 0.59 Sweden -1.34 -1.26 -0.14 0.35 Italy 0.87 1.10 -0.02 0.30 Austria -1.22 -1.19 0.00 0.09 Iceland 0.87 1.24 0.06 0.55 Netherlands -1.22 -0.88 -0.05 0.47 Slovenia 0.85 1.00 0.03 0.34 Greece -1.16 -1.03 -0.06 0.30 Israel 0.80 1.02 0.04 0.62 Norway -1.13 -1.02 0.02 0.27 Turkey 0.71 0.83 0.00 0.52 Israel -0.99 -0.99 -0.12 0.12 Korea 0.66 0.82 -0.11 0.42 Estonia -0.82 -0.81 0.05 0.01 Greece 0.66 0.96 0.08 0.59 Iceland -0.73 -0.70 0.12 0.05 Mexico 0.51 0.58 0.08 0.24 OECD Average -1.54 -1.47 -0.04 0.21 OECD Average 1.16 1.41 0.02 0.49
*model controls also for the PISA index of economic, social and cultural status (ESCS) and the science performance scale Coefficients from two-level random intercept models Coefficients in bold are statistically significant

EDU/WKP(2011)3
43
Table 6b. Science self-efficacy and self-concept and expectations to work in engineering or health.
Partner countries
Expected career in computing/engineering Expected career in health sciences
Model
1 Model 2* Model 1 Model 2*
Fem
ale
Fem
ale
Scie
nce
self-
effic
acy
Scie
nce
self-
conc
ept
Fem
ale
Fem
ale
Scie
nce
self-
effic
acy
Scie
nce
self-
conc
ept
coeff. coeff. coeff. coeff. coeff. coeff. Macao-China -1.96 -1.64 0.04 0.23 Montenegro 0.00 0.03 -0.05 0.12 Hong Kong-China -1.89 -1.69 -0.02 0.47 Indonesia 0.17 0.20 0.01 0.18 Chinese Taipei -1.89 -1.74 -0.12 0.27 Bulgaria 0.19 0.21 -0.02 -0.06 Azerbaijan -1.64 -1.63 -0.03 0.11 Jordan 0.24 0.20 0.08 0.35 Russian Federation -1.61 -1.57 -0.12 0.06 Hong Kong-China 0.37 0.75 0.11 0.50 Romania -1.47 -1.31 -0.02 0.07 Chinese Taipei 0.38 0.67 0.02 0.40 Colombia -1.47 -1.43 -0.03 -0.10 Serbia 0.43 0.49 0.08 0.37 Croatia -1.46 -1.49 -0.09 -0.01 Croatia 0.55 0.82 -0.10 0.51 Lithuania -1.43 -1.45 0.05 0.19 Macao-China 0.57 0.91 -0.03 0.47 Serbia -1.36 -1.32 -0.10 0.27 Tunisia 0.76 0.87 0.00 0.42 Kyrgyzstan -1.32 -1.26 0.04 -0.11 Uruguay 0.94 0.97 0.01 0.55 Argentina -1.28 -1.28 0.14 0.02 Azerbaijan 1.01 1.02 -0.05 0.83 Brazil -1.17 -1.14 0.04 0.12 Argentina 1.02 1.04 0.02 0.24 Latvia -1.15 -1.15 0.06 0.00 Colombia 1.03 1.05 -0.07 0.29 Uruguay -1.11 -1.07 0.09 -0.12 Brazil 1.11 1.16 -0.03 0.17 Tunisia -0.87 -0.73 0.11 0.06 Kyrgyzstan 1.17 1.17 -0.03 0.28 Jordan -0.80 -0.85 0.01 0.12 Romania 1.19 1.28 0.02 0.45 Thailand -0.54 -0.53 0.02 0.22 Latvia 1.26 1.37 -0.03 0.46 Bulgaria -0.18 -0.23 0.08 0.00 Lithuania 1.29 1.40 0.07 0.41 Indonesia -0.08 -0.07 0.15 -0.08 Thailand 1.44 1.52 0.20 0.38
Montenegro 0.11 0.15 0.06 0.06 Russian Federation 1.47 1.50 0.17 0.33
*model controls also for the PISA index of economic, social and cultural status (ESCS) and the science performance scale Coefficients from two-level random intercept models Coefficients in bold are statistically significant

EDU/WKP(2011)3
44
Table 7a. Career information, career preparation and expectations to work in engineering or health.
OECD countries.
Panel A. Expected career in computing/engineering Panel B. Expected career in
health sciences
Model
1 Model 2a* Model 1 Model 2a*
Fem
ale
Fem
ale
Info
rmat
ion
on
scie
nce
care
ers
Prep
arat
ion
for
scie
nce
care
er
Fem
ale
Fem
ale
Info
rmat
ion
on
scie
nce
care
ers
Prep
arat
ion
for
scie
nce
care
er
coeff. coeff. coeff. coeff. coeff. coeff. coeff. coeff. Slovak Republic -2.18 -2.07 -0.01 -0.07 Mexico 0.51 0.60 0.08 0.11 Switzerland -2.00 -1.98 0.02 0.02 Turkey 0.71 0.82 0.25 0.11 United States -1.96 -1.91 -0.04 0.01 Korea 0.66 0.84 0.17 0.13 UK -1.95 -1.94 0.22 0.12 Greece 0.66 0.97 0.08 0.11 Australia -1.92 -1.92 0.03 0.15 Slovenia 0.85 0.98 0.07 0.19 Ireland -1.90 -1.90 0.12 0.03 Israel 0.80 1.00 0.07 0.21 France -1.86 -1.65 0.07 0.08 Italy 0.87 1.12 0.30 0.23 Canada -1.85 -1.86 0.09 0.08 Chile 0.92 1.16 0.33 0.05 Hungary -1.84 -1.69 -0.20 0.23 Australia 1.06 1.21 0.30 0.31 Slovenia -1.79 -1.74 0.06 -0.06 Iceland 0.87 1.24 0.14 0.29 Czech Rep -1.79 -1.72 -0.04 0.05 Belgium 0.99 1.24 0.05 0.30 Poland -1.76 -1.75 -0.10 -0.03 Ireland 1.11 1.25 0.08 0.19 Portugal -1.67 -1.76 0.08 0.04 UK 1.02 1.27 0.27 0.21 Finland -1.65 -1.67 0.14 -0.22 New Zealand 1.01 1.28 0.19 0.38 Chile -1.57 -1.54 0.00 0.00 Japan 0.98 1.30 0.03 0.22 Korea -1.56 -1.50 0.07 0.01 Luxembourg 1.07 1.33 0.28 0.17 Germany -1.55 -1.42 -0.04 0.13 Czech Rep 1.17 1.33 0.52 0.11 Belgium -1.54 -1.42 -0.06 0.24 Poland 1.18 1.36 0.18 -0.03 Japan -1.53 -1.28 0.07 0.01 Finland 1.31 1.44 0.41 0.01 Mexico -1.49 -1.45 0.02 0.00 United States 1.36 1.45 0.21 0.11 Denmark -1.47 -1.39 0.16 0.07 Spain 1.29 1.49 0.19 0.21 Turkey -1.38 -1.36 0.06 0.04 Hungary 1.10 1.49 0.27 -0.03 Italy -1.38 -1.36 0.08 0.13 Slovak Rep 1.31 1.50 0.19 0.19 Luxembourg -1.38 -1.37 -0.08 0.13 France 1.28 1.52 0.27 0.17 Spain -1.38 -1.34 0.10 0.10 Canada 1.40 1.56 0.23 0.16 New Zealand -1.35 -1.33 0.16 0.00 Austria 1.48 1.64 0.20 0.13 Sweden -1.34 -1.24 0.12 -0.10 Sweden 1.38 1.64 0.34 0.10 Austria -1.22 -1.20 -0.12 0.06 Estonia 1.60 1.66 0.17 0.16 Netherlands -1.22 -0.88 0.20 0.08 Germany 1.42 1.68 0.30 0.08 Greece -1.16 -1.03 0.06 0.01 Portugal 1.29 1.83 0.17 0.30 Norway -1.13 -1.03 0.03 0.16 Norway 1.70 1.89 0.13 0.07 Israel -0.99 -0.99 -0.04 -0.07 Denmark 1.53 1.93 0.36 0.15 Estonia -0.82 -0.81 -0.01 0.05 Netherlands 1.61 1.96 0.04 0.28 Iceland -0.73 -0.72 -0.06 0.18 Switzerland 2.07 2.23 0.30 0.10 OECD Average -1.54 -1.48 0.03 0.05 1.16 1.39 0.21 0.01
*model controls also for the PISA index of economic, social and cultural status (ESCS) and the science performance scale Coefficients from two-level random intercept models Coefficients in bold are statistically significant

EDU/WKP(2011)3
45
Table 7b. Career information, career preparation and expectations to work in engineering or health Partner countries
Expected career in computing/engineering Expected career in health sciences
Model
1 Model 2* Model 1 Model 2*
Fem
ale
Fem
ale
Stud
ent i
nfor
mat
ion
on
scie
nce
care
ers
Scho
ol p
repa
ratio
n fo
r sc
ienc
e ca
reer
Fem
ale
Fem
ale
Stud
ent i
nfor
mat
ion
on
scie
nce
care
ers
Scho
ol p
repa
ratio
n fo
r sc
ienc
e ca
reer
Scho
ol p
repa
ratio
n fo
r sc
ienc
e ca
reer
coeff. coeff. coeff. coeff. coeff. coeff. Tunisia -0.87 -0.73 0.02 0.00 Macao-China 0.57 0.93 0.20 0.17 Macao-China -1.96 -1.63 -0.01 0.06 Hong Kong 0.37 0.78 -0.01 0.46 Montenegro 0.11 0.14 0.12 -0.07 Croatia 0.55 0.82 0.07 0.20 Romania -1.47 -1.33 0.00 0.12 Latvia 1.26 1.37 0.30 0.13 Hong Kong -1.89 -1.68 0.06 0.18 Romania 1.19 1.28 -0.01 0.17 Chinese Taipei -1.89 -1.73 0.06 0.09 Tunisia 0.76 0.89 0.07 -0.02 Kyrgyzstan -1.32 -1.27 0.08 0.08 Thailand 1.44 1.51 0.01 0.21 Uruguay -1.11 -1.07 -0.06 0.10 Lithuania 1.29 1.36 0.38 0.16 Serbia -1.36 -1.32 0.02 -0.02 Russian Feder. 1.47 1.51 0.05 0.18 Russian Feder. -1.61 -1.56 -0.03 0.06 Uruguay 0.94 0.99 0.19 0.11 Brazil -1.17 -1.15 0.02 0.02 Colombia 1.03 1.06 0.16 0.01 Azerbaijan -1.64 -1.61 0.03 0.00 Serbia 0.43 0.49 -0.05 0.14 Colombia -1.47 -1.44 -0.08 -0.01 Brazil -1.89 -1.68 0.06 0.04 Indonesia -0.08 -0.07 0.16 -0.04 Indonesia 0.17 0.19 0.07 -0.02 Latvia -1.15 -1.14 0.05 -0.12 Montenegro 0.00 0.02 0.03 0.13 Lithuania -1.43 -1.44 0.06 -0.14 Argentina -1.47 -1.44 -0.08 0.18 Argentina -1.28 -1.29 -0.01 -0.10 Bulgaria -0.08 -0.07 0.16 0.09 Thailand -0.54 -0.55 0.03 0.11 Azerbaijan -1.46 -1.48 0.00 -0.03 Croatia -1.46 -1.48 0.00 0.06 Chinese Taipei -0.80 -0.85 0.06 0.15 Jordan -0.80 -0.85 0.06 0.04 Jordan 0.24 0.20 0.03 -0.01 Bulgaria -0.18 -0.22 0.04 -0.02 Kyrgyzstan 1.17 1.15 -0.09 0.18
*model controls also for the PISA index of economic, social and cultural status (ESCS) and the science performance scale Coefficients from two-level random intercept models Coefficients in bold are statistically significant
120. Individual differences between students exert significant influences on occupational status of expected careers and on the intentions to pursue specific science careers. In many countries, high achievers, migrant students, students who consider themselves better informed about science-related employment options are all more likely to plan to work in science. Yet, for any two students who differ only with respect to gender and are otherwise identical, a female student is far more likely to opt for health science than engineering. A male student will make the opposite choice. This tendency is unexplained by any of the individual level characteristics canvassed in the preceding sections.
School level factors
121. Prior studies of gender typed adolescent career plans found a number of school characteristics which boost higher status expectations among students. These characteristics are school resources, the compositional features of school populations and particular processes which manifest in the formal and informal culture of school.

EDU/WKP(2011)3
46
122. For instance schools in urban areas, which cater to the children of well-educated managers or professionals, have students with higher ambition levels. There, student occupational ambition exceeds levels implied by particular family backgrounds. Well-resourced schools with high level of access to information technology, private schools, schools which are selective, that is refuse admission to the less academically successful students foster very high occupational ambition among their pupils (Marks, 2010; Sikora and Saha, 2009). Selective and affluent school environments convey the "affluent community" boost to students' plans and expectations. A student from a modest social background is thus likely to expect more educational and occupational success as such expectations are normalised in the school's cultural environment.
123. Yet, while all of these factors have a positive relationship with the intentions to enter high status employment, almost none of these factors have any predictive power with respect to intentions to work in engineering as opposed to the health sector.
124. The country specific two level logit models which introduce school characteristics as control variables in are provided in Tables 8a and 8b below. Only percentage of girls in school and the averaged socio-economic status are reported, although the models controlled also for the teacher to student ratio, an indicator of whether a school employed a counsellor on regular basis, an scale measuring the school activities aimed at promoting science (SCIPROM) and the principal's perception that teachers in the school concentrated on developing in students the skills and knowledge essential for science careers. Other control variables contributed a negligible increase to the models' explanatory power and therefore are not presented here.
125. To allow for the variation in the effect these variables might have on students' plans the analyses were conducted separately by gender. In most countries these school characteristics have no consequences for occupational plans oriented towards specific subfields of science.
126. However, as Table 8a illustrates, in several countries there is evidence that boys attending schools with large proportions of females in student populations are less likely to go along with their own sex's preferences for engineering and computing. While girls attending schools dominated by their own gender are even more reluctant to contemplate these fields of employment, the effect for boys, instead of being no different from zero, is, where significant, in the same direction as the effect for girls. This is the case in Austria, the Czech Republic, Italy, Japan, Mexico, Slovak Republic and Slovenia. In several countries the attendance of school with higher proportions of girls may temper boys plans even if it has no extra influence on girls. This is the case in Chile, Hungary, Ireland, Korea, Portugal, Turkey and the USA.

EDU/WKP(2011)3
47
Table 8a. Compositional factors: percentage of girls, parents' status and expectations of a career in engineering or computing
School effects on girls'
expectations to work in
engineering or computing
School effects on boys'
expectations to work in
engineering or computing
School effects on girls'
expectations to work in
engineering or computing
School effects on boys'
expectations to work in
engineering or computing
Perc
ent o
f girl
s in
sc
hool
Ave
rage
par
ents
' SE
S at
sch
ool
Perc
ent o
f girl
s in
sc
hool
Ave
rage
par
ents
' SE
S at
sch
ool
Perc
ent o
f girl
s in
sc
hool
Ave
rage
par
ents
' SE
S at
sch
ool
Perc
ent o
f girl
s in
sc
hool
Ave
rage
par
ents
' SE
S at
sch
ool
coeff. coeff. coeff. coeff. coeff. coeff. coeff. coeff. Australia -0.21 -0.02 0.52 0.04 Argentina -3.23 0.14 -2.60 0.24 Austria -3.47 1.18 -3.49 0.82 Azerbaijan -5.33 0.48 -1.18 0.04 Belgium -1.88 -0.24 0.14 -0.28 Brazil -2.22 0.17 -0.07 0.10 Canada -0.50 0.17 0.39 0.31 Bulgaria -0.29 -0.14 -0.29 0.19 Chile 0.18 -0.17 -1.60 -0.09 Chinese Taipei -1.63 0.34 -0.25 -0.27 Czech Republic -4.30 0.15 -1.78 -0.56 Colombia -0.05 0.11 -0.85 -0.13 Denmark -0.79 -0.70 -2.16 0.14 Croatia -3.80 0.40 -3.44 1.28 Estonia -0.69 -0.02 0.05 0.17 Hong Kong-China 0.61 0.69 0.80 0.07 Finland -7.24 0.83 0.87 -0.11 Indonesia -3.61 1.70 -4.49 1.38 France - - - - Jordan -0.41 0.14 -2.28 0.52 Germany 2.64 0.49 0.23 0.59 Kyrgyzstan -3.08 0.20 0.38 -0.24 Greece -0.98 0.25 0.19 0.31 Latvia 1.97 -0.42 2.85 -0.24 Hungary -2.54 0.93 -1.49 0.82 Lithuania -1.73 0.23 -0.56 0.15 Iceland -1.05 -0.02 -2.05 0.45 Macao-China 0.78 -0.03 0.10 0.14 Ireland 1.25 -0.10 -0.69 -0.42 Montenegro -2.67 0.62 -0.16 0.20 Israel 1.37 0.31 -0.91 0.00 Romania -1.36 -0.10 -0.11 0.65 Italy -4.21 0.75 -2.16 0.57 Russian Fed. -2.54 -0.37 -2.34 0.48 Japan -1.94 -0.04 -1.22 -0.38 Serbia -6.00 1.38 -3.98 0.79 Korea -0.62 -0.34 -0.88 -1.06 Thailand -0.52 0.02 0.10 0.09 Luxembourg 0.52 0.04 -1.42 -1.05 Tunisia 0.76 0.45 1.40 0.41 Mexico -1.46 0.03 -0.99 0.04 Uruguay 0.46 0.16 -0.29 0.29 Netherlands 3.72 1.49 0.00 -0.28 New Zealand -0.19 0.81 1.10 0.19 Norway 3.34 -0.62 0.95 -0.38 Poland -1.38 -0.08 0.58 -0.20 Portugal -1.20 0.25 -2.35 0.01 Slovak Republic -4.14 0.48 -2.70 0.57 Slovenia -5.18 0.17 -4.48 0.88 Spain -0.55 0.40 0.64 0.05 Sweden 0.98 -0.25 -0.54 0.50 Switzerland -0.11 -0.04 -0.54 -0.03 Turkey 1.13 0.42 -2.63 0.53 United Kingdom 1.22 -0.22 -0.09 -0.08 United States 1.41 0.40 -1.18 -0.29
*The model controls also for the PISA index of economic, social and cultural status (ESCS) , the science performance scale, student self-efficacy and self concept in science, the teacher to student ratio, an indicator of whether a school employed a counsellor on a regular basis, a scale measuring the school activities aimed at promoting science (SCIPROM) and the principal's perception that teachers in the school concentrated on developing students' skills and knowledge essential for science careers. Coefficients from two-level random intercept models Coefficients in bold are statistically significant

EDU/WKP(2011)3
48
127. These effects could be interpreted as support for cultural explanations of gender typing if the numbers of girls can be seen as a proxy for cultural factors in operation in particular schools. However, these effects can be only tentative evidence, as there are many countries in which the proportion of girls within a school is irrelevant to students' occupational intentions related to engineering. The effects of school populations' average SES, where consequential, indicate that engineering can be popular in schools with lower and higher SES profiles.
128. In some analogy to the patterns emergent in the analysis of school composition effects and engineering, in several countries boys who attend schools with high representation of girls are more likely, above and beyond their individual inclination, to consider health services as their future career (Table 8b). However, this is not the case in all countries where this factor is relevant. Attending a school with a large population of girls deters boys from this line of employment in Australia and Bulgaria. In many places gender school composition is irrelevant and the effects of school population's SES are highly variable from country to country.
129. Overall, the aspects of school environments examined here seem of limited relevance to the gender differences in preferences for particular subfields of science. It is possible that more detailed indicators of gender cultures within schools could reveal the processes which in some schools help bridge and in others perpetuate the horizontal gender segregation of occupational intentions. The evidence available in PISA 2006 indicates that, in at least several countries, the gender compositional effect points to the future promise of such investigations. However, until more direct measures of gender role attitudes and cultures within schools are available for many countries, no more insights about the impact of gender ideologies on these outcomes are possible.

EDU/WKP(2011)3
49
Table 8b. Compositional factors: percentage of girls, parents' status and expectations of health science careers
School effects on girls'
expectations to work in
health occupations
School effects on boys'
expectations to work in health occupations
School effects on girls'
expectations to work in
health occupations
School effects on boys'
expectations to work in
health occupations
Perc
ent o
f girl
s in
sc
hool
Ave
rage
par
ents
' SES
at
sch
ool
Perc
ent o
f girl
s in
sc
hool
Ave
rage
par
ents
' SES
at
sch
ool
Perc
ent o
f girl
s in
sc
hool
Ave
rage
par
ents
' SES
at
sch
ool
Perc
ent o
f girl
s in
sc
hool
Ave
rage
par
ents
' SES
at
sch
ool
coeff. coeff. coeff. coeff. coeff. coeff. coeff. coeff. Australia -0.12 0.16 -0.98 0.18 Argentina 1.73 0.01 1.70 0.17 Austria 1.85 -0.54 2.24 1.10 Azerbaijan -0.34 -0.04 -1.38 0.25 Belgium 0.75 0.22 2.31 -0.18 Brazil 0.76 0.06 0.77 -0.01 Canada -0.42 -0.10 -0.93 0.32 Bulgaria 0.57 0.15 -0.72 -0.13 Chile -0.56 0.04 0.65 0.29 Chinese Taipei 1.51 -0.24 1.53 0.22 Czech Republic 3.60 0.35 3.21 1.05 Colombia -0.13 -0.17 -1.19 -0.16 Denmark -3.02 -0.22 4.65 0.63 Croatia 4.25 -0.24 6.11 -0.93 Estonia 2.64 0.11 6.18 -0.45 Hong Kong-China 0.22 0.27 0.22 0.14 Finland -0.13 -0.30 5.06 0.49 Indonesia 1.43 0.66 5.97 0.57 France - - - Jordan 0.33 -0.11 0.62 -0.45 Germany 2.54 0.04 2.09 0.53 Kyrgyzstan -0.19 -0.70 -0.78 -0.61 Greece 0.09 -0.30 1.76 -0.03 Latvia 4.53 0.21 -1.79 0.67 Hungary 0.99 0.74 5.24 0.39 Lithuania -0.65 0.06 -2.13 0.68 Iceland 0.67 -0.07 -4.97 0.50 Macao-China -0.38 0.23 -0.76 0.35 Ireland -0.27 0.29 -0.06 0.67 Montenegro 2.16 0.18 3.90 -1.08 Israel 0.69 -0.69 0.42 -0.57 Romania 1.38 0.14 1.03 0.20 Italy -0.10 1.04 1.73 1.60 Russian Fed 1.32 -0.52 3.45 0.52 Japan 0.31 1.22 1.13 2.15 Serbia 2.84 -0.03 4.78 -0.55 Korea -0.03 0.01 -0.37 -0.32 Thailand 0.44 -0.11 0.28 0.13 Luxembourg 0.02 0.15 5.33 0.27 Tunisia 1.55 -0.10 0.73 -0.21 Mexico 0.73 -0.05 2.51 0.07 Uruguay 1.85 0.08 2.71 0.11 Netherlands -0.03 -0.30 1.32 1.54 New Zealand -0.12 -0.03 -0.36 0.54 Norway -0.50 0.29 2.30 0.20 Poland -0.32 Portugal 4.25 -0.05 9.52 -0.10 Slovak Republic 1.62 -0.44 3.63 0.45 Slovenia 2.84 0.96 6.72 0.97 Spain -0.44 0.08 0.49 0.13 Sweden 0.06 0.09 0.86 0.54 Switzerland -0.97 0.18 1.37 0.79 Turkey -0.22 0.03 -0.09 0.13 United Kingdom -0.37 -0.11 -0.45 -0.10 United States 1.02 -0.08 0.34 0.18
*The model controls also for the PISA index of economic, social and cultural status (ESCS) , the science performance scale, student self-efficacy and self concept in science, the teacher to student ratio, an indicator of whether a school employed a counsellor on a regular basis, a scale measuring the school activities aimed at promoting science (SCIPROM) and the principal's perception that teachers in the school concentrated on developing students' skills and knowledge essential for science careers. Coefficients from two-level random intercept models Coefficients in bold are statistically significant

EDU/WKP(2011)3
50
Characteristics of national education systems and labour markets
130. Country characteristics which have been demonstrated to foster more ambitious career expectations among youth comprise several factors in a specific configuration (Sikora and Saha, 2010). Students in less prosperous countries where participation rates in secondary education are lower, where the levels of economic disparities are substantial but where employment opportunities within the service sector expand rapidly, cherish strong and unanimous hopes for high status employment. This tendency is enhanced by the absence of early sorting into academic and vocational streams at the age of 15 as well as the reception of direct financial aid from abroad by the national education sector (Sikora and Saha, 2010).
131. Official aid, administered by the United Nations and the associated international agencies, is usually tied to various forms of educational expansion programs which are built around the global ideology of meritocracy and egalitarianism in education. Obviously aid is directed to developing countries, but receiving aid to education is a strong predictor of students' higher occupational ambitions also when differences in economic wealth and inequality between countries are taken into account (Sikora and Saha, 2010). Thus high school students in countries which experience poverty and inequality are motivated not only by relative deprivation coupled with the fast pace of expansion in national labour markets but also the promises of the meritocratic and egalitarian ideologies advanced by international aid and co-operation.
132. In contrast to the average status of expected occupations, the tendency of female and male students to opt for a career in one of the subfields of science considered here is not systematically aligned with many country characteristics, be they economic or related to the features of national education systems. The Gender Gap Index which measures the degree to which countries provide equal access for men and women to economic, educational and political resources, regardless of the level of economic development appears to have a negative relationship with all dependent variables in Table 9 (Hausmann, Tyson, and Zahidi, 2006). The GGI effect is statistically significant only as a predictor of boys' propensity to plan a health-related career. However, the negative coefficients seem to suggest that in more gender egalitarian societies the propensity of both genders to plan a career in engineering/computing or health is weaker than in nations with higher levels of gender inequality. Early tracking of students into a larger number of programs or types of schools lowers the likelihood of planning a career in health among boys and girls and in engineering among girls only. The former is likely to be associated with the incompatibility of early vocational streaming and school pathways which lead to medicine and other health-related employment. The latter suggests that early streaming into vocational tracks may deter girls but not boys from considering engineering/computing as future area of employment.
133. Finally higher levels of economic development are associated with lower likelihood for girls of planning employment in engineering while boys in more affluent countries are less likely than boys elsewhere to expect a health related career. While the segregation literature (Charles and Bradley, 2009: 945) suggests that girls in more developed countries are overrepresented in health-related university degrees, the GDP coefficient for girls' expectations of health employment is not different from zero.

EDU/WKP(2011)3
51
Table 9. Expectations of career in health/engineering. Coefficients from three-level random intercept models
Girls Boys
Health Engineering, computing Health
Engineering, computing
Coeff Std Er Coeff
Std Er Coeff
Std Er Coeff
Std Er
Fixed effects Country characteristics
Gender Gap Index -2.01 1.67 -3.52 1.34 -6.53** 1.66 -3.00 2.04 Number of school types available to 15 year olds -0.15** 0.05 -0.09# 0.05 -0.25** 0.07 -0.05 0.06 GDP per capita - ratio to USA 0.40 0.30 -1.17** 0.33 -0.76* 0.30 -0.58 0.35
Number of countries 50 50 50 50 Number of schools 12212 12212 12386 12386
Number of students 178437 178437 174910 174910 ** statistically different from zero at p=0.01,* statistically different from zero at p=0.05, # statistically different from zero at p=0.10 All analyses weighted with student population weights adjusted so that each country contributes equally to the analysis

EDU/WKP(2011)3
52
SUMMARY, CONCLUSIONS AND POLICY IMPLICATIONS
Main findings
134. This comprehensive examination of the patterns in the vertical and horizontal segregation in youth career plans reveals that occupational expectations of 15 year olds are segregated by gender in a manner resembling gender segregation in university enrolments and in the labour market. The broad picture is that girls expect to work in higher status jobs than boys. Moreover, science is as popular among girls as it is among boys in many countries. But a closer examination of science-related employment, discloses each gender's strong preference for its own niche of science, namely, health versus engineering and computing. While this form of horizontal segregation in adolescent plans was previously documented in a number of single-country studies, this paper demonstrates for the first time that this type of segregation is prevalent in a many countries that differ markedly in their educational systems and socio-economic conditions. The omnipresence of this pattern defies the country-specific explanations and calls for the consideration of global cultural ideologies as the framework for understanding the persisting segregation of students' occupational expectations first documented in the 1960s and 1970s (Holland 1997; Marini and Greenberger 1978). The cultural theory of gender essentialism which asserts the persisting association between culturally construed gender identity and particular types of jobs aligns with the patterns found in this analysis. Because the construction of gender identity models is cultural rather than biological, historical changes to the entrenched associations between gender and particular types of employment are certainly possible.
135. The cultural processes of socialisation which distribute the young people into different niches of national labour markets associate students' occupational expectations with different fields of employment by Year 9 of high school. The analytical strategy of examining a large number of potential reasons why these preferences are so firmly segregated so early leads to an unequivocal conclusion. Neither the gender gap in the preferences for engineering and computing nor for health sciences can be explained by the broad range of high school experiences. The differences between genders in academic performance, family social, economic and cultural resources, students' migration status, vocational program and ISCED level placement, career information and preparation as well as self-confidence in science ability might exist but they do not bridge or widen gender disparities in preferences for particular types of science employment. At 15 years of age students' career goals, if present, are already strongly gender typed and this gender difference seems largely unrelated to the varying levels of academic performance or self-confidence although systematic differences between sexes in performance and confidence are evident in many countries.
Policy implications
136. The starting point in any attempt to develop policy guidelines emerging from this research must involve a decision whether this type of horizontal segregation is a social problem. Is there an identifiable talent loss at the individual and societal levels which can be attributed to the concentration of women and men into different fields of employment? Arguably such talent loss may be considerable as the creative activity of engineers and computing scientists is likely to benefit from gender diverse insights. For instance anecdotal evidence indicates that an absence of women from engineering teams designing new products and technical solutions results in ignorance of gender-specific user needs and thus in potentially sub-

EDU/WKP(2011)3
53
optimal designs. Moreover, the underrepresentation of men in healthcare and other care-based occupations is likely to adversely affect the progressively greying societies in which care industries expand while struggling to attract a diverse pool of workers.
137. There is much scope for a more comprehensive provision of educational programs which not only popularise engineering and computing amongst girls, but also aim to raise the level of interest in care and healthcare among boys. However, the important caveat is that such programs cannot be conceived as isolated, locally implemented initiatives. They must coexist with a host of "social, cultural and economic changes that are large scale and are interdependent" (Xie and Shauman 2003: 214). As Xie and Shauman point out, isolated policy programs are unlikely to be effective in implementing and consolidating such broad changes in the institutional and cultural contexts in which women make their career choices. Rather the universal nature of these horizontal divides calls for initiatives from international agencies supporting educational policy at country level. Moreover, they must be implemented at much earlier stages of students' educational experiences and with support of parents, as the influence of the latter on their children's vocational intentions is non-trivial.
138. The entrenched cultural climates of gender essentialism cannot be attributed to a single process or failure within the educational institutions. These differences in youth expectations are most unlikely to be primarily reinforced by lack of educators' efforts to achieve gender integration in school environments (Howel et al. 2005). Rather, these divides are most likely too firmly established by the time students reach their 15th birthday to be easily mediated by simple educational policy or vocational counselling measures.
139. Nevertheless, cross-national differentiation in the perceived desirability of engineering and computing raises questions about the effectiveness of vocational counselling services within the education systems of particular countries. Gender ideologies are undeniably cultural phenomena and their entrenchment in institutional settings, media discourses and everyday life creates a context in which even the best designed counselling programs, while not without chances for success, are likely to encounter difficulties. The relative shortage of prominent role models, that is "female celebrities" in engineering and computing, the well-publicised underrepresentation of women in these fields, their reputed family "unfriendliness" and adolescents' day-to-day experiences often defy the encouragement girls receive from the educators and policy makers.
140. The difficulties facing future policy initiatives designed to bridge the disparities between young men's and women's occupational choices lay in the complex network of micro-social processes which reproduce these gender-specific patterns. While various information campaigns within and outside schools are launched to entice young women into traditionally masculine fields of employment and, less frequently, to encourage men to enter feminised professions, they appear to be no more than "surface veneer" egalitarianism (Charles and Grusky, 2004). The messages from the policy makers often do not correspond to the messages transmitted by the media, the actual gendered patterns of employment known to youth from their every-day observations and the ideology of cultural gender essentialism which constructs women as better suited to occupations related to nurturance, care and managing interpersonal relationships. In contrast to the educational campaigns which encourage girls to take up computing and engineering, the programs designed to direct boys towards nursing or midwifery or teaching are few or non-existent so the efforts towards employment desegregation can be seen so far as partial at best. This is attributable to the popularity of "separate but equal" ideology, which sees genders as necessarily belonging in different niches of the labour market (Charles and Bradley, 2009). In this approach, the goal of policy is solely to be concerned about the vertical segregation by gender in educational and occupational expectations and attainments. However, even if monetary returns and status of segregated careers were equivalent, crowding men and women into different fields of employment can be associated with a number of social disadvantages.

EDU/WKP(2011)3
54
141. Despite the difficulties in designing and implementing policies aimed at gender integration in all fields of education and employment, the inroads that women have made into various areas of science, including engineering, over the last four decades are promising. Yet, the focus of policy must widen to include the measures to entice adolescent men to enter non-traditional areas of employment. While several isolated policy programs are unlikely to bring gender segregation in its vertical and horizontal forms to an end, the more broadly conceived policy programs, supported by the international agencies, have the potential to bring about change. The change at the level of students’ individual choices, through early broadening of perceptive horizons, might not be possible, however, without some institutionally enforced employment and educational gender equity incentives that specifically address horizontal segregation by gender.
142. Adolescent occupational expectations align closely with patterns in graduation rates across tertiary institutions. Among science graduates women have made strides in agriculture, health and biology but not other areas. While the difficulties with combining the demanding science careers and family life are likely to be important deterrents, the fact that across the world girls at 15 show a remarkable unity of opinions in preferring health science to other types of science is consequential. It reveals cultural forces reinforced by a conglomerate of social micro processes and structures of opportunities.
143. The reverse side of these trends is that boys need enticement to enter health and teaching-related occupations in greater numbers. The severe underrepresentation of women amongst physicists, mathematicians, engineers and computer scientists is undesirable but so is having only token numbers of men in socio-cultural, health, and care-related professions. Cultural constructs which frame particular types of employment as "feminine" or "masculine" limit the full realisation of individual talent. This process begins early, is cumulatively reinforced over the life course of young people and universally present. Thus its amelioration requires a mobilisation of policy which will lead to the shift in values, perceptions, institutional incentives and labour market opportunities. Such a mobilisation seems possible only through the co-ordination of cross-national policy efforts.

EDU/WKP(2011)3
55
REFERENCES
Ammermueller, Andreas. 2007. "Poor Background or Low Returns? Why Immigrant Students in Germany Perform so Poorly in the Programme for International Student Assessment." Education Economics 15:215-230.
Bourdieu, Pierre. 1984. Distinction: A Social Critique of the Judgment of Taste. Cambridge, MA: Harvard University Press.
—. 1986. The Forms of Capital. New York: Greenwood.
Breen, Richard and Meir Yaish. 2006. "Testing the Breen-Goldthorpe Model of Educational Decision Making." Pp. 232-258 in Mobility and Inequality, edited by S. L. Morgan, D. B. Grusky, and G. S. Fields. Stanford: Stanford University Press.
Buchmann, Claudia and Ben Dalton. 2002. "Interpersonal Influences and Educational Aspirations in 12 Countries: The Importance of Institutional Context." Sociology of Education 75:99-122.
Buchmann, Claudia and Hyunjoon Park. 2009. "Stratification and the Formation of Expectations in Highly-Differentiated Educational Systems." Research on Social Stratification and Mobility 27:245-267.
Charles, M. and K. Bradley. 2009. "Indulging our Gendered Selves? Sex Segregation by Field of Study in 44 countries." American Journal of Sociology 114:924-976.
Charles, Maria and David B. Grusky. 2004. Occupational Ghettos: The Worldwide Segregation of Women and Men. Stanford: Stanford University Press.
Correll, Shelley. 2001. "Gender and the Career Choice Process: the Role of Biased Self-Assessments." American Journal of Sociology 106:1691-1730.
Croll, Paul. 2008. "Occupational Choice, Socio-Economic Status and Educational Attainment: A Study of the Occupational Choices and Destinations of Young People in the British Household Panel Survey." Research Papers in Education 23:243-268.
Feliciano, Cynthia and Ruben G. Rumbaut. 2005. "Gendered Paths: Educational and Occupational Expectations and Outcomes among Adult Children of Immigrants." Ethnic and Racial Studies 28:1087-1118.
Ganzeboom, Harry B. G., Paul M. de Graaf, and Donald J. Treiman. 1992. "A Standard International Socio-economic Index of Occupational Status." Social Science Research 21:1-56.

EDU/WKP(2011)3
56
Ganzeboom, Harry B. G. and Donald J. Treiman. 1996. "Internationally Comparable Measures of Occupational Status for the 1988 International Standard Classification of Occupations." Social Science Research 25:201-239.
Golthorpe, John. 2007. On Sociology , Second Edition: Volume One. Stanford: Stanford University Press.
Gottfredson, Linda S. 1981. "Circumscription and Compromise: A Developmental Theory of Occupational Aspirations." Journal of Counseling and Development 82:49-57.
—. 2002. "Gottfredson's Theory of Circumscription, Compromise and Self-Creation." in Career Choice and Development, edited by D. Brown. San Francisco: Jossey-Bass.
Goyette, Kimberly. 2008. "College for Some to College for All: Social Background, Occupational Expectations, and Educational Expectations over Time." Social Science Research 37:461-84.
Haller, Archibald O., Otto B. Luther, Robert F. Meier, and George W. Ohlendorf. 1974. "Level of Occupational Aspiration: An Empirical Analysis." American Sociological Review 39:113-121.
Hartung, Paul J., Erik J. Porfeli, and Fred W. Vondracek. 2008. "Career Adaptability in Childhood." The Career Development Quarterly 57:63.
Hauser, R. M. and D. B. Grusky. 1988. "Cross-National Variation in Occupational Distributions, Relative Mobility Chances, and Intergenerational Shifts in Occupational Distributions." American Sociological Review 53:723-741.
Hausmann, Ricardo, Laura D. Tyson, and Saadia Zahidi. 2006. "The Global Gender Gap Report 2006." http://www.weforum.org/pdf/gendergap/report2006.pdf.
Helwig, Andrew A. 2008. "From Childhood to Adulthood: A 15-Year Longitudinal Career Development Study." The Career Development Quarterly 57:38.
Heus, Manon de, Jaap Dronkers, and Mark Levels. 2008. "Educational Systems as a Resource or Hindrance for Immigrants? The Effects of Educational System Characteristics of Both Countries of Origin and Destination on the Scientific Literacy of Immigrant Children in Western Countries.": RC 28 Spring Meeting 2008, Florence Italy.
Hill, Catherine, Christianne Corbett, and Andresse St. Rose. 2010. "Why So Few? Women in Science, Technology, Engineering, and Mathematics." American Association of University Women, Washington.
Holland, John L. 1997. Making Vocational Choices: A Theory of Careers. Odessa, Florida: Psychological Assessment Resources.
Howel, Jane, Stephanie Blaisdell, Alicia Figueiredo, Douglas Gorham, and Sybill Hatch. 2005. "The Extraordinary Women Engineers - Final Report." http://www.aacei.org/wpc/ExtraordinaryWomen-FinalReport.pdf.
Huang, Lihong. 2009. "Gender Segregation in Student Career Aspirations in Norwegian Secondary Schools." Pp. 333-356 in Gender, Equality and Education from International and Comparative Perspectives, vol. 10, International Perspectives on Education and Society, edited by A. Wiseman: Emerald Group Publishing Limited.
EDU/WKP(2011)3
57
Humlum, Maria K., Kristin J. Kleinjans, and Helena S. Nielsen. 2010. "An Economic Analysis of Identity and Career Choice." Economic Inquiry.
International Labour Office. 1988. International Standard Classification of Occupations. Geneva: International Labour Office.
Kerckhoff, Alan. 1977. "The Realism of Educational Ambitions in England and the United States." American Sociological Review 42:563-571.
Kerckhoff, Alan C. 1976. "The Status Attainment Process: Socialization or Allocation?" Social Forces 55:368-381.
Khattab, Nabil. 2003. "Explaining Educational Aspirations of Minority Students: the Role of Social Capital and Students' Perceptions." Social Psychology of Education 6:283-281.
Kleinjans, Kristin J. . 2010. "Family Background and Gender Differences in Educational Expectations." Economics Letters 107:125-127
Little, Angela. 1978. "The Occupational and Educational Expectations of Students in Developed and Less-Developed Countries." Sussex University, Institute of Development Studies, Sussex.
Little, Roderick J. A. and Donald B. Rubin. 1987. Statistical Analysis with Missing Data. New York: Wiley.
Looker, E. Dianne and Pamela A. Magee. 2000. "Gender and Work: The Occupational Expectations of Young Women and Men in the 1990s " Gender Issues 18:74-88.
Marini, Margaret Mooney and Ellen Greenberger. 1978. "Sex Differences in Occupational Aspirations and Expectations." Work and Occupations 5:147-178.
Marks, Gary, N. 2008. "Gender Differences in the Effects of Socioeconomic Background." International Sociology 23:845-863.
Marks, Gary N. 2010. "Meritocracy, modernization and students‘ occupational expectations: Cross-national evidence " Research in Social Stratification and Mobility 28: 275-289
Matyas, Marsha Lakes and Linda Skidmore Dix. 1992. "Science and Engineering programs: on target for women." Washington, D.C: National Academy Press.
McDaniel, Anne. 2010. "Cross-National Gender Gaps in Educational Expectations: The Influence of National-Level Gender Ideology and Educational Systems." Comparative Education Review 54:27-50.
Mello, Zena R. 2008. "Gender Variation in Developmental Trajectories of Educational and Occupational Expectations and Attainment from Adolescence to Adulthood." Developmental Psychology 44:1069-1080.
Mislevy, Robert J., Albert E. Beaton, Bruce Kaplan, and Kathleen M. Sheehan. 1992. "Estimating Population Characteristics from Sparse Matrix Samples of Item Responses." Journal of Educational Measurement 29:133-161.
OECD. 2006. "Women in Scientific Careers: Unleashing the Potential." OECD, Paris.

EDU/WKP(2011)3
58
—. 2007a. PISA 2006 Science Competencies for Tomorrow's World: Volume 1 Analysis. Paris: OECD.
—. 2007b. PISA 2006 Technical Report. Paris: Organisation for Economic Co-operation and Development.
Patton, Wendy and Peter Creed. 2007. " Occupational Aspirations and Expectations for Australian Adolescents." Australian Journal of Career Development 16:46-58.
Pfeffermann, D., C. J. Skinner, D. J. Holmes, H. Goldstein, and J. Rasbash. 2002. "Weighting for Unequal Selection Probabilities in Multilevel Models." Journal of the Royal Statistical Society: Series B (Statistical Methodology) 60:123-40.
Portes, Alejandro, Samuel A. McLeod, and Robert N. Parker. 1978. "Immigrant Aspirations." Sociology of Education 51:241-260.
Psacharopoulos, George and Harry Anthony Patrinos. 2004. "Returns to Investment in Education: A Further Update " Education Economics 12:111-134.
Rangvid, Beatrice Schindler. 2007. "Sources if Immigrants' Underachievement: Results from PISA - Copenhagen." Education Economics 15:293-326.
Raudenbush, Stephen W. and Anthony S. Bryk. 2002. Hierarchical Linear Models: Applications and Data Analysis Methods. Thousand Oaks: Sage Publications.
Reynolds, John, Michael Stewart, Ryan MacDonald, and Lacey Sischo. 2006. "Have Adolescents Become too Ambitious? High School Seniors' Educational and Occupational Plans 1976 to 2000." Social Problems 53:186-206.
Rindfuss, Ronald R., Elizabeth C. Cooksey, and Rebecca L. Sutterlin. 1999. "Young Adult Occupational Achievement. Early Expectations Versus Behaviour Reality." Work and Occupations 26:220-263.
Saha, Lawrence J. 1983. "Gender, School Attainment and Occupational Plans: Determinants of Aspirations and Expectations Among Australian Urban School Leavers." Australian Journal of Education 26:247-265.
—. 1997. "Aspirations and Expectations of Students." Pp. 512-517 in International Encyclopedia of the Sociology of Education, edited by L. J. Saha. Oxford: Pergamon Press.
Sikora, Joanna and Lawrence J. Saha. 2007. "Corrosive Inequality? Structural Determinants of Educational and Occupational Expectations in Comparative Perspective " International Education Journal: Comparative Perspectives 8:57-78.
—. 2009. "Gender and Professional Career Plans of High School Students in Comparative Perspective." Educational Research and Evaluation 15: 387-405
—. 2010. "New Directions in National Education Policymaking: Student Career Plans in International Achievement Studies." Pp. 83-115 in The Impact of International Achievement Studies on National Education Policymaking, vol. 14, International Perspectives on Education and Society, edited by A. W. Wiseman. Bingley: Emerald Publishing.
—. 2011. "Lost Talent? The Occupational Expectations and Attainments of Young Australians." National Centre for Vocational Education Research, Adelaide, http://www.lsay.edu.au/publications/2313.html.

EDU/WKP(2011)3
59
Super, Donald. E. 1980. "A Life-span, Life Space Approach to Career Development." Journal of Vocational Behaviour 16:262-298.
Tracey, Terence J. G. and Sandro M. Sodano. 2008. "Issues of Stability and Change in Interest Development." The Career Development Quarterly 57:51-62.
UNESCO, United Nations Educational, Scientific and Cultural Organization. 2006. "International Standard Classification of Education, ISCED 1997." http://www.uis.unesco.org/TEMPLATE/pdf/isced/ISCED_A.pdf.
Wells, Ryan, David Bills, Sueuk Park, and Yi Chen. 2007. "National Education Sector and Labor Market Effects on Students' Postsecondary Expectations." Unpublished manuscript. University of Iowa.
White, Patrick. 2007. Education and Career Choice: a New Model of Decision Making. New York: Palgrave.
Xie, Yu and Kimberlee A. Shauman. 2003. Women in Science - Career Opportunities and Outcomes. Cambridge: Harvard University Press.

EDU/WKP(2011)3
60
APPENDICES
Appendix 1: Additional descriptive tables Appendix 1 Table 1 Students' expected ISEI at age 30, total and by gender All students Male Female DifferenceOECD mean S.E. mean S.E. mean S.E. mean S.E. Australia 56.95 (0.28) 55.88 (0.43) 58.00 (0.32) 2.11 (0.51) Austria 51.87 (0.66) 49.51 (1.08) 54.18 (0.78) 4.68 (1.37) Belgium 55.32 (0.48) 53.78 (0.71) 57.01 (0.63) 3.23 (0.97) Canada 61.16 (0.28) 58.49 (0.35) 63.67 (0.36) 5.18 (0.44) Chile 64.07 (0.52) 62.73 (0.73) 65.58 (0.59) 2.85 (0.85) Czech Republic 52.54 (0.50) 50.57 (0.57) 54.82 (0.78) 4.26 (0.89) Denmark 54.50 (0.48) 53.42 (0.53) 55.61 (0.64) 2.19 (0.67) Estonia 57.34 (0.42) 53.52 (0.54) 61.19 (0.54) 7.67 (0.71) Finland 51.33 (0.42) 49.01 (0.55) 53.29 (0.54) 4.28 (0.70) France 54.92 (0.55) 53.82 (0.83) 55.85 (0.57) 2.03 (0.88) Germany 52.07 (0.49) 51.83 (0.67) 52.31 (0.56) 0.48 (0.73) Greece 60.99 (0.40) 58.94 (0.56) 62.70 (0.47) 3.76 (0.66) Hungary 53.28 (0.57) 51.41 (0.76) 55.16 (0.77) 3.76 (1.02) Iceland 60.38 (0.34) 58.60 (0.53) 61.99 (0.46) 3.39 (0.72) Ireland 57.56 (0.44) 56.62 (0.66) 58.43 (0.47) 1.81 (0.73) Israel 66.01 (0.46) 63.36 (0.75) 68.27 (0.50) 4.92 (0.83) Italy 59.92 (0.31) 57.14 (0.40) 62.62 (0.44) 5.48 (0.56) Japan 55.12 (0.44) 54.35 (0.42) 55.89 (0.70) 1.54 (0.76) Korea 60.77 (0.27) 61.71 (0.39) 59.81 (0.38) -1.91 (0.52) Luxembourg 56.38 (0.23) 56.07 (0.31) 56.67 (0.37) 0.60 (0.50) Mexico 67.39 (0.28) 66.66 (0.42) 68.00 (0.36) 1.34 (0.54) Netherlands 53.90 (0.36) 53.98 (0.46) 53.81 (0.46) -0.17 (0.57) New Zealand 57.57 (0.39) 55.15 (0.56) 59.58 (0.47) 4.43 (0.69) Norway 55.97 (0.42) 53.44 (0.46) 58.48 (0.57) 5.04 (0.64) Poland 58.95 (0.41) 55.85 (0.48) 61.93 (0.52) 6.08 (0.63) Portugal 61.73 (0.42) 60.00 (0.54) 63.25 (0.50) 3.25 (0.63) Slovak Republic 56.80 (0.62) 54.25 (0.74) 59.35 (0.73) 5.10 (0.78) Slovenia 59.21 (0.27) 56.72 (0.36) 61.51 (0.42) 4.79 (0.57) Spain 60.17 (0.33) 57.33 (0.50) 62.70 (0.43) 5.38 (0.64) Sweden 53.38 (0.39) 51.77 (0.49) 54.99 (0.45) 3.22 (0.53) Switzerland 49.81 (0.30) 49.42 (0.37) 50.23 (0.44) 0.81 (0.53) Turkey 66.28 (0.45) 65.29 (0.51) 67.31 (0.64) 2.02 (0.69) United Kingdom 56.26 (0.33) 55.41 (0.38) 57.07 (0.43) 1.66 (0.50) United States 62.85 (0.38) 61.15 (0.57) 64.46 (0.50) 3.31 (0.75) OECD average 57.89 (0.08) 56.29 (0.10) 59.37 (0.10) 3.08 (0.13) Partners Argentina 64.01 (0.54) 60.57 (0.67) 66.88 (0.67) 6.31 (0.86) Azerbaijan 68.69 (0.41) 65.76 (0.65) 71.50 (0.36) 5.74 (0.67) Brazil 66.24 (0.29) 61.80 (0.41) 69.70 (0.36) 7.90 (0.52) Bulgaria 65.49 (0.52) 64.15 (0.87) 66.86 (0.60) 2.71 (1.09) Colombia 69.07 (0.43) 67.58 (0.46) 70.29 (0.47) 2.71 (0.47) Croatia 55.04 (0.49) 50.43 (0.62) 59.44 (0.73) 9.01 (1.01) Hong Kong-China 58.46 (0.36) 59.49 (0.47) 57.54 (0.47) -1.95 (0.62) Indonesia 61.47 (0.87) 60.05 (1.23) 62.96 (0.76) 2.90 (1.16) Jordan 67.49 (0.29) 66.21 (0.46) 68.43 (0.37) 2.22 (0.60) Kyrgyzstan 67.20 (0.43) 63.98 (0.69) 69.27 (0.48) 5.29 (0.82) Latvia 57.90 (0.45) 54.88 (0.63) 60.33 (0.53) 5.45 (0.73) Lithuania 60.28 (0.37) 57.46 (0.57) 63.03 (0.43) 5.57 (0.69) Macao-China 60.73 (0.28) 60.83 (0.41) 60.63 (0.36) -0.20 (0.53) Montenegro 56.51 (0.31) 55.09 (0.40) 57.94 (0.44) 2.85 (0.59) Romania 58.30 (0.93) 54.17 (0.88) 62.33 (1.04) 8.16 (0.91) Russian Federation 62.62 (0.50) 58.25 (0.77) 66.25 (0.44) 8.00 (0.82) Serbia 57.20 (0.66) 53.41 (0.68) 61.00 (0.78) 7.59 (0.85) Chinese Taipei 58.42 (0.46) 60.58 (0.43) 56.20 (0.70) -4.38 (0.73) Thailand 60.33 (0.44) 58.28 (0.85) 61.52 (0.47) 3.24 (0.96) Tunisia 68.59 (0.34) 66.06 (0.48) 70.63 (0.40) 4.57 (0.59) Uruguay 65.31 (0.49) 60.78 (0.74) 69.28 (0.43) 8.50 (0.72)

EDU/WKP(2011)3
61
Appendix 1 Table 2 Percent of students expecting to enter an occupation in ISCO88 major group 1 or 2, total and by gender All students Male Female DifferenceOECD mean S.E. mean S.E. mean S.E. mean S.E. Australia 54.5% (0.8%) 49.6% (1.1%) 59.4% (0.9%) 9.8% (1.3%) Austria 36.3% (1.5%) 30.8% (2.1%) 41.5% (2.2%) 10.8% (3.2%) Belgium 57.7% (1.1%) 50.2% (1.6%) 65.9% (1.3%) 15.7% (2.2%) Canada 59.1% (0.6%) 51.2% (0.9%) 66.6% (0.7%) 15.4% (1.1%) Chile 70.0% (1.4%) 67.2% (2.1%) 73.2% (1.3%) 6.0% (2.2%) Czech Republic 45.1% (1.5%) 40.7% (1.8%) 50.3% (1.9%) 9.6% (2.4%) Denmark 41.4% (1.1%) 39.3% (1.2%) 43.6% (1.5%) 4.3% (1.7%) Estonia 52.6% (1.0%) 44.8% (1.4%) 60.5% (1.4%) 15.7% (1.8%) Finland 41.3% (1.0%) 31.6% (1.3%) 49.6% (1.3%) 18.0% (1.7%) France 42.8% (1.5%) 42.4% (1.9%) 43.2% (1.6%) 0.8% (2.0%) Germany 33.6% (1.1%) 33.3% (1.5%) 33.9% (1.4%) 0.7% (1.9%) Greece 60.1% (1.2%) 48.3% (1.8%) 70.0% (1.2%) 21.7% (1.9%) Hungary 45.8% (1.5%) 40.9% (2.1%) 50.7% (2.0%) 9.8% (2.7%) Iceland 60.9% (0.9%) 54.4% (1.4%) 66.8% (1.2%) 12.4% (1.7%) Ireland 59.7% (1.2%) 53.8% (1.5%) 65.1% (1.4%) 11.3% (1.8%) Israel 73.2% (1.3%) 65.3% (2.4%) 79.9% (1.3%) 14.6% (2.6%) Italy 59.2% (0.8%) 52.7% (1.3%) 65.6% (1.0%) 12.8% (1.5%) Japan 42.7% (1.1%) 42.5% (1.3%) 43.0% (1.7%) 0.5% (1.9%) Korea 61.4% (0.9%) 59.5% (1.2%) 63.3% (1.2%) 3.8% (1.8%) Luxembourg 59.9% (0.7%) 50.0% (0.9%) 69.1% (1.1%) 19.1% (1.5%) Mexico 80.3% (0.6%) 77.7% (1.0%) 82.5% (0.7%) 4.8% (1.3%) Netherlands 45.5% (1.1%) 43.2% (1.4%) 47.8% (1.5%) 4.6% (1.7%) New Zealand 54.9% (0.8%) 46.3% (1.3%) 62.0% (1.0%) 15.7% (1.7%) Norway 51.4% (1.0%) 44.4% (1.3%) 58.4% (1.4%) 14.0% (1.7%) Poland 54.8% (1.1%) 43.6% (1.3%) 65.6% (1.4%) 22.0% (1.7%) Portugal 60.2% (1.2%) 53.5% (1.7%) 66.1% (1.2%) 12.6% (1.8%) Slovak Republic 58.2% (1.5%) 52.1% (1.9%) 64.3% (1.8%) 12.2% (2.1%) Slovenia 56.9% (0.8%) 47.9% (1.1%) 65.1% (1.1%) 17.2% (1.6%) Spain 61.5% (0.9%) 52.3% (1.4%) 69.6% (1.1%) 17.3% (1.7%) Sweden 39.5% (0.9%) 34.1% (1.1%) 44.9% (1.3%) 10.8% (1.5%) Switzerland 33.5% (0.8%) 35.2% (0.9%) 31.6% (1.2%) -3.6% (1.3%) Turkey 82.3% (1.0%) 79.0% (1.4%) 85.8% (1.3%) 6.7% (1.8%) United Kingdom 51.9% (0.8%) 46.5% (1.1%) 56.9% (1.1%) 10.4% (1.4%) United States 63.7% (1.0%) 56.4% (1.4%) 70.6% (1.3%) 14.2% (1.9%) OECD average 54.6% (0.2%) 49.0% (0.3%) 59.8% (0.2%) 10.9% (0.3%) Partners Argentina 69.1% (1.5%) 60.0% (2.1%) 76.7% (1.6%) 16.6% (2.3%) Azerbaijan 82.6% (1.0%) 70.3% (1.9%) 94.3% (0.7%) 23.9% (2.0%) Brazil 61.9% (0.9%) 49.9% (1.3%) 71.3% (1.0%) 21.4% (1.5%) Bulgaria 69.8% (1.3%) 66.3% (2.0%) 73.4% (1.4%) 7.1% (2.3%) Colombia 76.4% (1.2%) 74.4% (1.4%) 78.0% (1.4%) 3.6% (1.4%) Croatia 40.2% (1.2%) 26.6% (1.5%) 53.3% (1.7%) 26.7% (2.4%) Hong Kong-China 55.0% (1.0%) 57.4% (1.3%) 53.0% (1.3%) -4.4% (1.8%) Indonesia 63.1% (2.0%) 60.0% (2.4%) 66.2% (2.0%) 6.2% (1.7%) Jordan 84.2% (0.8%) 77.4% (1.5%) 89.1% (0.7%) 11.7% (1.7%) Kyrgyzstan 70.6% (1.1%) 59.9% (1.8%) 77.4% (1.0%) 17.5% (1.9%) Latvia 56.9% (1.1%) 51.9% (1.6%) 60.8% (1.3%) 8.9% (2.0%) Lithuania 62.8% (1.1%) 58.2% (1.8%) 67.3% (1.2%) 9.1% (2.1%) Macao-China 64.3% (0.9%) 61.8% (1.3%) 66.6% (1.2%) 4.7% (1.6%) Montenegro 54.0% (1.0%) 50.8% (1.2%) 57.1% (1.5%) 6.3% (1.9%) Romania 54.0% (2.4%) 42.9% (2.0%) 64.8% (2.8%) 21.9% (2.3%) Russian Federation 65.0% (1.3%) 54.7% (2.0%) 73.5% (1.0%) 18.8% (2.1%) Serbia 51.7% (1.6%) 39.0% (1.8%) 64.5% (1.8%) 25.6% (2.2%) Chinese Taipei 64.1% (1.0%) 67.0% (1.0%) 61.2% (1.6%) -5.8% (1.8%) Thailand 68.5% (1.0%) 58.3% (2.0%) 74.5% (1.1%) 16.2% (2.3%) Tunisia 78.4% (0.9%) 70.6% (1.5%) 84.7% (0.9%) 14.1% (1.6%) Uruguay 70.9% (1.3%) 57.6% (2.0%) 82.5% (1.1%) 24.9% (2.1%)

EDU/WKP(2011)3
62
Appendix 1 Table 3 Percent of students expecting to enter an occupation in ISCO88 major group 1,2 or 3, total and by gender All students Male Female DifferenceOECD mean S.E. mean S.E. mean S.E. mean S.E. Australia 72.9% (0.6%) 66.5% (1.0%) 79.2% (0.8%) 12.7% (1.3%) Austria 58.9% (1.8%) 52.1% (2.7%) 65.4% (2.0%) 13.4% (3.3%) Belgium 69.6% (1.2%) 62.9% (1.9%) 77.0% (1.3%) 14.2% (2.5%) Canada 79.0% (0.6%) 69.9% (0.9%) 87.6% (0.7%) 17.7% (1.0%) Chile 81.4% (1.3%) 79.1% (1.7%) 84.0% (1.2%) 4.9% (1.5%) Czech Republic 61.3% (1.4%) 57.7% (1.7%) 65.5% (2.0%) 7.8% (2.4%) Denmark 66.3% (1.1%) 58.6% (1.4%) 74.3% (1.2%) 15.7% (1.6%) Estonia 69.1% (1.0%) 59.9% (1.4%) 78.3% (1.3%) 18.4% (1.8%) Finland 56.3% (1.0%) 47.0% (1.3%) 64.2% (1.2%) 17.2% (1.6%) France 74.1% (1.4%) 66.5% (2.2%) 80.5% (1.2%) 14.0% (2.3%) Germany 59.5% (1.3%) 56.3% (1.7%) 62.6% (1.5%) 6.2% (1.8%) Greece 78.9% (1.1%) 72.7% (1.7%) 84.1% (1.1%) 11.3% (1.9%) Hungary 58.2% (1.7%) 53.4% (2.3%) 62.9% (1.9%) 9.5% (2.8%) Iceland 75.1% (0.8%) 70.9% (1.2%) 78.8% (1.1%) 7.9% (1.7%) Ireland 74.3% (1.0%) 68.5% (1.6%) 79.8% (1.0%) 11.2% (1.7%) Israel 91.1% (0.8%) 89.9% (1.4%) 92.2% (0.9%) 2.3% (1.6%) Italy 76.3% (0.8%) 71.9% (1.1%) 80.6% (0.7%) 8.7% (1.2%) Japan 52.9% (1.2%) 52.8% (1.2%) 53.1% (2.0%) 0.4% (2.1%) Korea 84.6% (0.7%) 85.5% (1.0%) 83.6% (0.9%) -1.8% (1.3%) Luxembourg 72.6% (0.6%) 65.3% (1.0%) 79.4% (0.9%) 14.1% (1.4%) Mexico 88.7% (0.6%) 86.9% (0.9%) 90.3% (0.7%) 3.3% (1.1%) Netherlands 71.3% (1.0%) 66.7% (1.3%) 76.0% (1.1%) 9.3% (1.4%) New Zealand 74.1% (0.9%) 66.2% (1.4%) 80.6% (0.9%) 14.4% (1.6%) Norway 68.4% (1.0%) 58.3% (1.2%) 78.4% (1.3%) 20.1% (1.7%) Poland 73.6% (0.9%) 70.4% (1.1%) 76.6% (1.1%) 6.2% (1.4%) Portugal 83.8% (0.9%) 80.2% (1.3%) 87.0% (0.9%) 6.9% (1.4%) Slovak Republic 70.0% (1.5%) 65.1% (1.8%) 74.8% (1.9%) 9.6% (2.1%) Slovenia 74.9% (0.6%) 70.1% (1.0%) 79.3% (0.9%) 9.3% (1.4%) Spain 76.1% (0.8%) 67.6% (1.3%) 83.7% (1.0%) 16.2% (1.6%) Sweden 69.9% (0.9%) 65.1% (1.3%) 74.7% (1.0%) 9.6% (1.5%) Switzerland 58.9% (0.9%) 52.6% (1.1%) 65.5% (1.2%) 12.9% (1.4%) Turkey 89.6% (0.8%) 86.0% (1.2%) 93.4% (0.8%) 7.4% (1.3%) United Kingdom 71.4% (0.7%) 66.0% (1.1%) 76.4% (0.9%) 10.3% (1.4%) United States 83.5% (0.7%) 78.9% (1.1%) 87.9% (0.8%) 9.0% (1.4%) OECD average 73.0% (0.2%) 67.8% (0.3%) 77.8% (0.2%) 10.0% (0.3%) Partners Argentina 82.7% (1.2%) 74.8% (1.7%) 89.2% (1.2%) 14.5% (1.8%) Azerbaijan 87.3% (0.9%) 78.6% (1.7%) 95.7% (0.6%) 17.1% (1.8%) Brazil 89.0% (0.6%) 86.6% (1.0%) 90.9% (0.7%) 4.4% (1.2%) Bulgaria 77.7% (1.1%) 75.5% (1.8%) 79.9% (1.3%) 4.4% (2.1%) Colombia 88.8% (1.0%) 86.9% (1.0%) 90.4% (1.3%) 3.4% (1.2%) Croatia 66.6% (1.4%) 59.3% (2.1%) 73.6% (1.9%) 14.4% (2.8%) Hong Kong-China 70.5% (1.0%) 70.6% (1.3%) 70.5% (1.2%) -0.1% (1.6%) Indonesia 73.2% (2.4%) 71.5% (3.4%) 75.0% (1.7%) 3.5% (2.6%) Jordan 92.6% (0.5%) 90.5% (1.1%) 94.1% (0.5%) 3.6% (1.2%) Kyrgyzstan 87.4% (0.8%) 78.8% (1.7%) 92.9% (0.6%) 14.1% (1.7%) Latvia 72.0% (1.1%) 64.2% (1.6%) 78.3% (1.3%) 14.1% (1.8%) Lithuania 76.9% (0.9%) 69.7% (1.5%) 83.9% (1.0%) 14.1% (1.8%) Macao-China 74.1% (0.8%) 69.8% (1.2%) 78.2% (1.0%) 8.4% (1.5%) Montenegro 75.2% (0.7%) 71.1% (1.0%) 79.4% (1.1%) 8.2% (1.6%) Romania 67.9% (2.3%) 59.5% (2.1%) 76.1% (2.7%) 16.5% (2.3%) Russian Federation 76.3% (1.4%) 63.3% (2.2%) 87.1% (1.0%) 23.7% (2.2%) Serbia 72.2% (1.5%) 67.4% (1.7%) 77.1% (1.9%) 9.7% (2.3%) Chinese Taipei 77.7% (0.9%) 80.8% (1.0%) 74.5% (1.4%) -6.3% (1.6%) Thailand 77.6% (1.0%) 65.6% (2.0%) 84.5% (1.1%) 18.9% (2.3%) Tunisia 89.1% (0.6%) 86.1% (1.1%) 91.6% (0.6%) 5.4% (1.3%) Uruguay 83.2% (1.0%) 74.1% (1.7%) 91.1% (0.8%) 17.0% (1.9%)

EDU/WKP(2011)3
63
Appendix 1 Table 4 Percent of students expecting science professions at age 30, total and by gender All students Male Female DifferenceOECD mean S.E. mean S.E. mean S.E. mean S.E. Australia 33.5% (0.6%) 34.2% (0.8%) 32.8% (0.9%) -1.4% (1.1%) Austria 29.2% (1.7%) 27.3% (2.4%) 31.0% (1.8%) 3.6% (2.5%) Belgium 31.6% (0.9%) 31.4% (1.2%) 31.8% (1.0%) 0.4% (1.4%) Canada 42.4% (0.7%) 39.8% (1.0%) 44.9% (0.9%) 5.1% (1.2%) Chile 47.9% (1.4%) 49.1% (1.6%) 46.6% (1.9%) -2.5% (2.2%) Czech Republic 25.6% (1.2%) 26.8% (1.5%) 24.3% (1.8%) -2.6% (2.3%) Denmark 28.4% (0.8%) 24.3% (1.0%) 32.6% (1.1%) 8.3% (1.5%) Estonia 27.7% (0.8%) 27.4% (1.1%) 28.0% (1.1%) 0.6% (1.6%) Finland 23.2% (0.7%) 21.3% (1.0%) 24.8% (1.1%) 3.5% (1.5%) France 36.2% (1.1%) 36.3% (1.6%) 36.1% (1.2%) -0.3% (1.8%) Germany 25.8% (0.8%) 26.2% (1.2%) 25.3% (1.1%) -0.9% (1.6%) Greece 36.3% (0.9%) 38.1% (1.4%) 34.8% (1.2%) -3.3% (1.9%) Hungary 24.5% (1.4%) 26.4% (1.7%) 22.6% (1.5%) -3.8% (1.8%) Iceland 39.8% (0.9%) 36.8% (1.3%) 42.5% (1.3%) 5.7% (1.9%) Ireland 33.5% (0.9%) 34.5% (1.5%) 32.6% (1.0%) -1.9% (1.6%) Israel 45.1% (1.4%) 43.6% (2.1%) 46.3% (1.6%) 2.8% (2.5%) Italy 35.6% (1.0%) 38.6% (1.3%) 32.8% (1.1%) -5.8% (1.3%) Japan 24.8% (1.5%) 23.7% (1.4%) 25.9% (2.5%) 2.3% (2.6%) Korea 20.7% (0.8%) 25.1% (1.1%) 16.2% (1.0%) -8.9% (1.4%) Luxembourg 30.1% (0.8%) 31.0% (1.0%) 29.3% (1.1%) -1.7% (1.5%) Mexico 45.9% (0.9%) 50.9% (1.4%) 41.7% (1.1%) -9.2% (1.7%) Netherlands 27.1% (0.9%) 21.6% (0.9%) 32.7% (1.3%) 11.1% (1.4%) New Zealand 30.2% (0.9%) 27.7% (1.3%) 32.3% (1.2%) 4.6% (1.7%) Norway 34.4% (0.8%) 30.4% (1.1%) 38.3% (1.3%) 7.9% (1.8%) Poland 38.9% (0.8%) 43.3% (1.2%) 34.7% (1.2%) -8.6% (1.8%) Portugal 47.5% (1.1%) 45.5% (1.5%) 49.3% (1.2%) 3.8% (1.7%) Slovak Republic 26.4% (1.4%) 30.4% (1.8%) 22.5% (1.7%) -7.9% (2.1%) Slovenia 39.4% (0.8%) 43.1% (1.1%) 36.0% (1.2%) -7.1% (1.7%) Spain 38.0% (1.0%) 38.1% (1.2%) 37.9% (1.1%) -0.2% (1.2%) Sweden 26.9% (0.8%) 25.4% (1.2%) 28.5% (1.2%) 3.1% (1.7%) Switzerland 26.3% (0.5%) 25.7% (0.7%) 26.9% (0.9%) 1.2% (1.1%) Turkey 31.9% (1.6%) 33.8% (2.0%) 30.0% (1.6%) -3.9% (1.8%) United Kingdom 27.7% (0.7%) 27.2% (1.0%) 28.1% (0.9%) 1.0% (1.2%) United States 44.8% (0.9%) 39.9% (1.5%) 49.4% (1.1%) 9.5% (1.8%) OECD average 33.2% (0.2%) 33.1% (0.2%) 33.2% (0.2%) 0.1% (0.3%) Partners Argentina 36.2% (1.1%) 34.5% (1.4%) 37.7% (1.6%) 3.2% (1.9%) Azerbaijan 27.3% (1.2%) 23.9% (1.7%) 30.4% (1.6%) 6.5% (2.2%) Brazil 46.1% (0.9%) 40.3% (1.3%) 50.6% (1.1%) 10.3% (1.5%) Bulgaria 34.2% (0.8%) 33.4% (1.2%) 34.9% (1.0%) 1.5% (1.6%) Colombia 54.1% (0.9%) 54.2% (1.3%) 54.0% (1.1%) -0.3% (1.7%) Croatia 26.2% (2.0%) 28.0% (1.9%) 24.4% (2.8%) -3.6% (2.7%) Hong Kong-China 26.3% (0.8%) 31.1% (1.1%) 22.2% (1.1%) -8.9% (1.6%) Indonesia 34.2% (2.0%) 32.9% (3.6%) 35.6% (1.7%) 2.6% (3.8%) Jordan 56.0% (1.1%) 64.1% (1.6%) 50.3% (1.4%) -13.9% (2.1%) Kyrgyzstan 34.3% (1.0%) 26.8% (1.4%) 39.1% (1.3%) 12.3% (1.8%) Latvia 25.7% (0.8%) 29.0% (1.2%) 23.1% (1.1%) -5.9% (1.7%) Lithuania 29.6% (0.8%) 31.1% (1.2%) 28.2% (1.1%) -2.9% (1.7%) Macao-China 22.9% (0.7%) 25.5% (1.3%) 20.5% (0.8%) -5.0% (1.8%) Montenegro 22.3% (0.9%) 20.8% (1.2%) 23.9% (1.1%) 3.1% (1.5%) Romania 24.2% (1.5%) 25.0% (1.7%) 23.4% (1.7%) -1.5% (1.5%) Russian Federation 28.7% (1.0%) 31.8% (1.8%) 26.2% (0.9%) -5.6% (2.0%) Serbia 27.5% (1.9%) 28.1% (1.6%) 27.0% (2.8%) -1.1% (2.5%) Chinese Taipei 29.2% (1.2%) 37.5% (0.9%) 20.6% (2.2%) -16.9% (2.2%) Thailand 47.2% (1.3%) 38.2% (1.8%) 52.4% (1.7%) 14.3% (2.4%) Tunisia 40.5% (1.2%) 41.5% (1.5%) 39.8% (1.3%) -1.7% (1.6%) Uruguay 38.9% (1.3%) 36.3% (0.8%) 41.3% (1.4%) 5.0% (1.6%)

EDU/WKP(2011)3
64
Appendix 1 Table 5. Percent of students expecting engineering and computing professions at age 30, total and by gender All students Male Female DifferenceOECD mean S.E. mean S.E. mean S.E. mean S.E. Australia 9.5% (0.4%) 16.3% (0.6%) 2.8% (0.2%) -13.5% (0.7%) Austria 9.1% (1.0%) 15.1% (1.6%) 3.3% (0.5%) -11.8% (1.5%) Belgium 12.2% (0.6%) 18.7% (0.9%) 5.1% (0.4%) -13.6% (0.9%) Canada 10.7% (0.4%) 18.8% (0.7%) 3.2% (0.3%) -15.6% (0.7%) Chile 16.4% (0.9%) 25.9% (1.4%) 5.9% (0.5%) -20.0% (1.4%) Czech Republic 12.9% (1.2%) 20.0% (1.6%) 4.8% (1.2%) -15.2% (1.9%) Denmark 8.2% (0.4%) 13.0% (0.8%) 3.3% (0.5%) -9.7% (1.0%) Estonia 13.7% (0.6%) 18.5% (1.0%) 8.8% (0.7%) -9.7% (1.3%) Finland 6.0% (0.4%) 10.5% (0.7%) 2.1% (0.4%) -8.3% (0.7%) France 10.3% (0.7%) 18.3% (1.1%) 3.5% (0.5%) -14.7% (1.2%) Germany 8.9% (0.5%) 14.2% (1.0%) 3.6% (0.4%) -10.6% (1.1%) Greece 12.5% (0.7%) 19.2% (1.0%) 7.0% (0.7%) -12.3% (1.1%) Hungary 11.6% (1.0%) 19.1% (1.6%) 4.1% (0.5%) -15.0% (1.5%) Iceland 10.6% (0.5%) 14.1% (0.9%) 7.5% (0.7%) -6.7% (1.2%) Ireland 10.5% (0.6%) 18.1% (1.0%) 3.4% (0.5%) -14.7% (1.1%) Israel 10.8% (0.8%) 15.6% (1.5%) 6.8% (0.8%) -8.9% (1.7%) Italy 13.1% (0.9%) 21.4% (1.3%) 4.9% (0.5%) -16.5% (1.1%) Japan 9.0% (0.7%) 15.1% (1.2%) 3.2% (0.4%) -11.9% (1.2%) Korea 7.5% (0.6%) 12.4% (0.8%) 2.6% (0.4%) -9.8% (0.9%) Luxembourg 10.4% (0.5%) 16.4% (0.9%) 4.8% (0.5%) -11.7% (1.1%) Mexico 16.7% (0.5%) 27.3% (0.9%) 7.8% (0.5%) -19.5% (1.0%) Netherlands 5.1% (0.4%) 7.8% (0.7%) 2.4% (0.4%) -5.5% (0.8%) New Zealand 7.6% (0.5%) 12.2% (0.9%) 3.7% (0.4%) -8.6% (1.1%) Norway 13.4% (0.7%) 19.4% (1.1%) 7.4% (0.7%) -12.0% (1.2%) Poland 19.6% (0.7%) 32.6% (1.2%) 7.2% (0.6%) -25.3% (1.4%) Portugal 14.9% (0.7%) 24.6% (1.3%) 6.3% (0.6%) -18.3% (1.4%) Slovak Republic 13.1% (1.1%) 23.1% (1.5%) 3.1% (0.5%) -20.0% (1.5%) Slovenia 15.2% (0.5%) 27.7% (0.9%) 3.6% (0.6%) -24.1% (1.1%) Spain 14.4% (0.6%) 23.8% (0.9%) 6.1% (0.5%) -17.7% (0.9%) Sweden 9.8% (0.6%) 15.3% (0.9%) 4.4% (0.5%) -10.9% (0.9%) Switzerland 9.1% (0.4%) 14.8% (0.6%) 3.1% (0.4%) -11.7% (0.7%) Turkey 14.1% (0.9%) 20.9% (1.4%) 7.0% (0.8%) -13.9% (1.3%) United Kingdom 7.2% (0.4%) 12.6% (0.6%) 2.1% (0.2%) -10.5% (0.7%) United States 9.4% (0.5%) 16.4% (0.8%) 2.7% (0.4%) -13.7% (0.9%) OECD average 11.2% (0.1%) 18.0% (0.2%) 4.7% (0.1%) -13.3% (0.2%) Partners Argentina 11.7% (0.9%) 18.6% (1.4%) 6.0% (0.8%) -12.6% (1.5%) Azerbaijan 5.2% (0.5%) 8.6% (1.0%) 2.0% (0.4%) -6.6% (1.0%) Brazil 11.0% (0.5%) 17.3% (0.9%) 6.0% (0.6%) -11.2% (1.0%) Bulgaria 11.5% (0.6%) 12.5% (0.9%) 10.6% (0.7%) -1.9% (1.1%) Colombia 16.6% (0.6%) 26.9% (1.1%) 8.3% (0.8%) -18.6% (1.6%) Croatia 10.2% (1.2%) 17.2% (1.8%) 3.5% (0.5%) -13.7% (1.8%) Hong Kong-China 8.0% (0.4%) 14.1% (0.7%) 2.7% (0.4%) -11.5% (0.9%) Indonesia 9.3% (2.4%) 11.8% (4.7%) 6.6% (1.0%) -5.1% (5.1%) Jordan 24.1% (0.9%) 32.7% (1.7%) 18.0% (1.0%) -14.7% (2.0%) Kyrgyzstan 5.0% (0.4%) 8.8% (0.9%) 2.6% (0.4%) -6.3% (0.9%) Latvia 14.9% (0.7%) 22.3% (1.2%) 9.0% (0.8%) -13.2% (1.4%) Lithuania 11.9% (0.6%) 18.8% (1.0%) 5.3% (0.6%) -13.5% (1.2%) Macao-China 5.7% (0.5%) 10.1% (0.9%) 1.7% (0.4%) -8.4% (1.0%) Montenegro 4.5% (0.4%) 4.7% (0.6%) 4.3% (0.6%) -0.3% (0.8%) Romania 11.0% (0.9%) 16.9% (1.4%) 5.2% (0.6%) -11.7% (1.3%) Russian Federation 12.4% (1.0%) 20.9% (1.6%) 5.3% (0.6%) -15.7% (1.4%) Serbia 10.6% (0.9%) 17.5% (1.4%) 3.6% (0.6%) -13.9% (1.2%) Chinese Taipei 13.1% (0.6%) 22.3% (0.8%) 3.8% (0.4%) -18.5% (0.8%) Thailand 17.5% (0.9%) 22.2% (1.5%) 14.8% (0.9%) -7.4% (1.5%) Tunisia 10.2% (0.7%) 14.3% (1.1%) 6.8% (0.7%) -7.5% (1.2%) Uruguay 11.0% (0.6%) 16.3% (1.1%) 6.5% (0.6%) -9.8% (1.1%)

EDU/WKP(2011)3
65
Appendix 1 Table 6 Percent of students expecting employment in health services at age 30, total and by gender All students Male Female DifferenceOECD mean S.E. mean S.E. mean S.E. mean S.E. Australia 13.3% (0.4%) 8.3% (0.5%) 18.3% (0.6%) 10.0% (0.7%) Austria 12.7% (0.9%) 4.5% (0.7%) 20.5% (1.4%) 15.9% (1.5%) Belgium 11.5% (0.6%) 6.2% (0.5%) 17.2% (0.7%) 10.9% (0.8%) Canada 21.2% (0.5%) 11.8% (0.6%) 30.1% (0.7%) 18.3% (0.9%) Chile 21.9% (1.0%) 14.2% (0.8%) 30.6% (1.8%) 16.4% (1.9%) Czech Republic 6.6% (0.7%) 2.8% (0.4%) 10.9% (1.3%) 8.1% (1.2%) Denmark 12.7% (0.6%) 5.4% (0.5%) 20.2% (1.0%) 14.8% (1.2%) Estonia 6.5% (0.5%) 2.2% (0.3%) 10.8% (0.9%) 8.6% (0.9%) Finland 10.6% (0.6%) 4.7% (0.6%) 15.6% (0.9%) 10.9% (1.2%) France 19.2% (0.8%) 9.2% (0.8%) 27.6% (1.0%) 18.4% (1.2%) Germany 9.8% (0.6%) 4.1% (0.6%) 15.4% (1.0%) 11.2% (1.2%) Greece 10.5% (0.6%) 7.3% (0.8%) 13.1% (0.8%) 5.8% (1.1%) Hungary 8.0% (0.7%) 3.9% (0.6%) 12.1% (1.1%) 8.2% (1.2%) Iceland 15.8% (0.7%) 10.1% (0.8%) 20.9% (1.1%) 10.8% (1.4%) Ireland 16.9% (0.7%) 9.5% (0.9%) 23.7% (0.8%) 14.2% (1.2%) Israel 21.0% (1.2%) 14.3% (1.4%) 26.7% (1.4%) 12.3% (1.7%) Italy 12.5% (0.7%) 8.6% (1.0%) 16.4% (0.8%) 7.9% (1.1%) Japan 11.5% (1.3%) 6.4% (0.7%) 16.4% (2.0%) 10.0% (1.9%) Korea 7.4% (0.5%) 5.2% (0.4%) 9.6% (0.8%) 4.4% (0.9%) Luxembourg 12.1% (0.6%) 6.6% (0.6%) 17.4% (1.0%) 10.8% (1.1%) Mexico 16.8% (0.6%) 12.4% (0.8%) 20.4% (0.8%) 8.0% (1.0%) Netherlands 15.6% (0.8%) 6.0% (0.6%) 25.2% (1.1%) 19.2% (1.0%) New Zealand 16.1% (0.7%) 9.4% (0.8%) 21.7% (1.0%) 12.3% (1.3%) Norway 13.2% (0.6%) 4.7% (0.5%) 21.8% (1.1%) 17.1% (1.2%) Poland 11.2% (0.5%) 5.7% (0.5%) 16.5% (0.8%) 10.8% (1.0%) Portugal 20.4% (0.8%) 10.5% (0.9%) 29.0% (1.0%) 18.5% (1.3%) Slovak Republic 7.6% (0.8%) 3.3% (0.5%) 11.9% (1.3%) 8.6% (1.2%) Slovenia 16.0% (0.6%) 8.3% (0.7%) 23.1% (1.0%) 14.8% (1.3%) Spain 14.8% (0.6%) 7.4% (0.7%) 21.4% (0.8%) 14.0% (1.0%) Sweden 10.2% (0.6%) 4.6% (0.6%) 15.8% (0.9%) 11.2% (1.0%) Switzerland 10.2% (0.5%) 2.8% (0.3%) 18.2% (0.9%) 15.4% (0.9%) Turkey 12.8% (0.8%) 9.5% (0.9%) 16.3% (1.4%) 6.8% (1.5%) United Kingdom 13.0% (0.5%) 7.9% (0.6%) 17.8% (0.7%) 9.9% (0.9%) United States 24.3% (0.8%) 12.4% (0.8%) 35.6% (1.0%) 23.2% (1.2%) OECD average 13.5% (0.1%) 7.2% (0.1%) 19.3% (0.2%) 12.1% (0.2%) Partners Argentina 14.2% (0.8%) 7.8% (0.9%) 19.5% (1.1%) 11.7% (1.1%) Azerbaijan 17.9% (1.0%) 10.8% (1.2%) 24.7% (1.4%) 13.9% (1.6%) Brazil 24.1% (0.9%) 13.8% (1.0%) 32.0% (1.2%) 18.2% (1.4%) Bulgaria 18.8% (0.7%) 17.4% (1.0%) 20.3% (1.1%) 2.8% (1.6%) Colombia 25.3% (0.8%) 15.3% (1.0%) 33.5% (1.1%) 18.2% (1.4%) Croatia 11.0% (1.8%) 6.1% (1.1%) 15.7% (2.6%) 9.6% (1.9%) Hong Kong-China 12.2% (0.6%) 9.9% (0.7%) 14.1% (0.8%) 4.2% (1.0%) Indonesia 18.6% (1.6%) 15.1% (1.9%) 22.3% (1.5%) 7.3% (1.9%) Jordan 26.9% (0.8%) 24.9% (1.2%) 28.4% (1.1%) 3.6% (1.6%) Kyrgyzstan 26.2% (1.0%) 14.1% (1.2%) 34.0% (1.2%) 20.0% (1.5%) Latvia 5.9% (0.5%) 2.5% (0.4%) 8.6% (0.7%) 6.1% (0.8%) Lithuania 7.7% (0.5%) 3.4% (0.5%) 11.8% (0.8%) 8.4% (0.9%) Macao-China 10.4% (0.5%) 7.9% (0.8%) 12.7% (0.7%) 4.8% (1.1%) Montenegro 11.6% (0.5%) 9.2% (0.8%) 14.0% (0.9%) 4.8% (1.2%) Romania 10.4% (0.7%) 5.0% (0.6%) 15.7% (1.1%) 10.6% (1.1%) Russian Federation 9.5% (0.6%) 3.6% (0.4%) 14.4% (1.0%) 10.8% (1.0%) Serbia 12.7% (1.8%) 7.5% (1.1%) 17.8% (2.7%) 10.3% (2.1%) Chinese Taipei 9.8% (1.4%) 7.1% (0.7%) 12.4% (2.3%) 5.3% (2.1%) Thailand 23.0% (0.9%) 9.8% (0.8%) 30.7% (1.3%) 20.9% (1.6%) Tunisia 21.0% (0.7%) 14.4% (0.8%) 26.3% (1.0%) 11.9% (1.2%) Uruguay 17.9% (0.8%) 11.0% (1.2%) 24.0% (1.0%) 13.0% (1.4%)

EDU/WKP(2011)3
66
Appendix 1 Table 7 Concentration of career plans (percentage of students who expect one of the 10 most popular jobs) All students Male Female DifferenceOECD mean S.E. mean S.E. mean S.E. mean S.E. Australia 29.8% (0.6%) 34.1% (0.8%) 42.0% (0.8%) -7.9% (1.1%) Austria 32.5% (1.5%) 31.7% (2.3%) 47.6% (1.7%) -16.0% (2.9%) Belgium 28.4% (0.8%) 31.1% (1.1%) 45.3% (1.2%) -14.2% (1.6%) Canada 37.6% (0.7%) 40.0% (0.9%) 50.4% (1.1%) -10.4% (1.4%) Chile 39.5% (1.0%) 37.3% (1.2%) 50.7% (1.9%) -13.4% (2.2%) Czech Republic 35.1% (1.2%) 42.6% (1.6%) 43.4% (1.7%) -0.8% (2.4%) Denmark 40.2% (0.8%) 42.8% (1.1%) 54.2% (1.2%) -11.5% (1.7%) Estonia 45.0% (0.9%) 54.7% (1.2%) 49.4% (1.2%) 5.2% (1.8%) Finland 34.2% (0.8%) 42.1% (1.3%) 45.2% (1.2%) -3.1% (1.7%) France 33.0% (1.0%) 32.9% (1.3%) 44.6% (1.3%) -11.7% (1.8%) Germany 28.6% (0.8%) 28.3% (1.2%) 41.5% (1.2%) -13.2% (1.7%) Greece 38.3% (1.0%) 42.9% (1.3%) 48.2% (1.2%) -5.3% (1.7%) Hungary 36.0% (1.5%) 41.0% (2.0%) 43.4% (2.0%) -2.4% (2.8%) Iceland 42.6% (0.9%) 44.5% (1.3%) 53.2% (1.3%) -8.7% (1.9%) Ireland 40.7% (0.9%) 42.9% (0.9%) 54.5% (1.1%) -11.6% (1.4%) Israel 53.1% (1.1%) 54.4% (2.0%) 60.2% (1.3%) -5.8% (2.4%) Italy 33.8% (0.8%) 36.4% (1.2%) 45.4% (1.0%) -9.0% (1.6%) Korea 40.3% (0.9%) 41.3% (1.4%) 47.5% (1.2%) -6.2% (1.8%) Luxembourg 45.1% (0.8%) 39.4% (1.3%) 59.9% (1.1%) -20.5% (1.7%) Mexico 55.5% (0.7%) 53.0% (1.0%) 60.6% (1.1%) -7.7% (1.4%) Netherlands 32.5% (0.9%) 31.2% (1.2%) 46.8% (1.2%) -15.6% (1.7%) New Zealand 38.0% (1.0%) 42.7% (1.4%) 45.1% (1.1%) -2.3% (1.8%) Norway 37.2% (0.9%) 45.4% (1.5%) 48.4% (1.3%) -3.0% (2.0%) Poland 47.2% (0.9%) 50.2% (1.2%) 56.7% (1.3%) -6.4% (1.8%) Portugal 43.3% (0.8%) 52.7% (1.3%) 53.8% (1.3%) -1.0% (1.9%) Slovak Republic 38.0% (1.4%) 45.1% (2.0%) 46.1% (1.6%) -1.0% (2.6%) Slovenia 29.1% (0.7%) 34.5% (1.1%) 43.1% (1.1%) -8.7% (1.6%) Spain 38.3% (0.7%) 39.7% (1.0%) 47.6% (0.9%) -7.8% (1.4%) Sweden 34.3% (1.0%) 44.2% (1.4%) 42.9% (1.3%) 1.3% (1.9%) Switzerland 33.3% (0.7%) 36.4% (1.1%) 44.3% (0.9%) -7.9% (1.4%) Turkey 56.8% (1.4%) 54.1% (1.4%) 66.9% (1.3%) -12.8% (1.9%) United Kingdom 36.4% (0.7%) 39.1% (1.0%) 49.1% (0.8%) -10.0% (1.3%) United States 41.7% (0.9%) 43.9% (1.4%) 54.8% (1.2%) -10.9% (1.8%) OECD average 38.65% (0.2%) 41.60% (0.2%) 49.48% (0.2%) -7.88% (0.3%) Partners Argentina 42.7% (1.4%) 37.0% (1.6%) 52.7% (1.7%) -15.7% (2.3%) Azerbaijan 67.2% (1.1%) 63.5% (1.7%) 82.4% (1.1%) -18.8% (2.1%) Brazil 57.5% (0.9%) 54.1% (1.2%) 66.1% (1.2%) -12.0% (1.7%) Bulgaria 53.4% (1.2%) 53.4% (1.5%) 54.2% (1.3%) -0.8% (2.0%) Colombia 49.8% (1.0%) 48.7% (1.3%) 56.6% (1.4%) -7.9% (1.9%) Croatia 29.3% (1.2%) 36.6% (2.4%) 39.7% (1.6%) -3.0% (2.9%) Hong Kong-China 48.9% (0.9%) 50.0% (1.4%) 55.5% (1.1%) -5.6% (1.8%) Indonesia 52.5% (1.9%) 51.6% (2.5%) 56.0% (2.0%) -4.4% (3.2%) Jordan 62.1% (0.9%) 63.7% (1.3%) 65.8% (1.2%) -2.2% (1.8%) Kyrgyzstan 61.1% (1.1%) 52.6% (1.6%) 75.4% (1.2%) -22.8% (2.0%) Latvia 45.9% (1.0%) 53.3% (1.5%) 55.8% (1.4%) -2.5% (2.0%) Lithuania 36.3% (1.2%) 46.6% (1.4%) 44.8% (1.2%) 1.7% (1.9%) Macao-China 55.9% (1.0%) 58.1% (1.4%) 56.8% (1.2%) 1.3% (1.8%) Montenegro 25.0% (0.8%) 23.9% (1.1%) 28.0% (1.2%) -4.0% (1.6%) Romania 49.5% (1.9%) 56.9% (1.6%) 54.8% (1.5%) 2.2% (2.1%) Russian Federation 44.8% (1.0%) 48.5% (1.3%) 54.8% (1.1%) -6.4% (1.7%) Serbia 32.4% (1.1%) 37.8% (1.5%) 41.8% (1.7%) -4.1% (2.3%) Chinese Taipei 34.3% (1.4%) 38.8% (1.1%) 41.5% (1.8%) -2.7% (2.1%) Thailand 49.2% (1.3%) 51.9% (1.9%) 55.0% (1.3%) -3.1% (2.4%) Tunisia 62.0% (1.1%) 60.5% (1.5%) 67.9% (1.5%) -7.4% (2.1%) Uruguay 46.6% (1.2%) 44.9% (1.5%) 58.5% (1.4%) -13.6% (2.0%)

EDU/WKP(2011)3
67
Appendix 2: Occupational titles comprising science, engineering/computing and health employment
Appendix 2 Section A
Science-related careers
1221 production dep. managers agriculture & fishing 1222 production dep. managers manufacturing [incl. factory manager] 1223 production dep. managers construction 1236 computing services department managers 1237 research & development department managers 2100 physical, mathematical & engineering science professionals 2110 physicists, chemists & related professionals 2111 physicists & astronomers 2112 meteorologists 2113 chemists 2114 geologists & geophysicists [incl. geodesist] 2120 mathematicians, statisticians etc professionals 2121 mathematicians etc professionals 2122 statisticians [incl. actuary] 2130 computing professionals 2131 computer systems designers & analysts [incl. software engineer] 2132 computer programmers 2139 computing professionals not elsewhere classified 2140 architects, engineers etc professionals 2141 architects town & traffic planners [incl. landscape architect] 2142 civil engineers [incl. construction engineer] 2143 electrical engineers 2144 electronics & telecommunications engineers 2145 mechanical engineers 2146 chemical engineers 2147 mining engineers, metallurgists, etc, professionals 2148 cartographers & surveyors 2149 architects engineers etc professionals not elsewhere classified [incl. consultant] 2200 life science & health professionals 2210 life science professionals 2211 biologists, botanists zoologists etc professionals 2212 pharmacologists, pathologists etc profess. [incl. biochemist] 2213 agronomists etc professionals 2220 health professionals (except nursing) 2221 medical doctors 2222 dentists 2223 veterinarians 2224 pharmacists 2229 health professionals except nursing not elsewhere classified 2230 nursing & midwifery profess. [incl. registered nurses, midwives] 2445 psychologists 3000 technicians and associate professionals 3100 physical & engineering science associate professionals 3110 physical & engineering science technicians 3111 chemical & physical science technicians

EDU/WKP(2011)3
68
3112 civil engineering technicians 3113 electrical engineering technicians 3114 electronics & telecommunications engineering technicians 3115 mechanical engineering technicians 3116 chemical engineering technicians 3117 mining & metallurgical technicians 3118 draughtspersons [incl. technical illustrator] 3119 physical & engineering science technicians not elsewhere classified 3130 optical & electronic equipment operators 3131 photographers & electronic equipment operators 3132 broadcasting & telecommunications equipment operators 3133 medical equipment operators [incl. x-ray technician] 3139 optical & electronic equipment operators not elsewhere classified 3140 ship & aircraft controllers & technicians 3141 ships engineers 3142 ships deck officers & pilots [incl. river boat captain] 3143 aircraft pilots etc associate professionals 3144 air traffic controllers 3145 air traffic safety technicians 3200 life science & health associate professionals 3210 life science technicians etc associate professionals 3211 life science technicians [incl. medical laboratory assistant] 3212 agronomy & forestry technicians 3213 farming & forestry advisers 3220 modern health associate professionals except nursing 3221 medical assistants 3222 sanitarians 3223 dieticians & nutritionists 3224 optometrists & opticians [incl. dispensing optician] 3225 dental assistants [incl. oral hygienist] 3226 physiotherapists etc associate professionals 3227 veterinary assistants [incl. veterinarian vaccinator] 3228 pharmaceutical assistants 3229 modern health associate professionals except nursing not elsewhere classified 3230 nursing & midwifery associate professionals 3231 nursing associate professionals [incl. trainee nurses] 3232 midwifery associate professionals [incl. trainee midwife] 3434 statistical, mathematical etc associate professionals

EDU/WKP(2011)3
69
Appendix 2 Section B
Careers in computing and engineering
2100 physical, mathematical & engineering science professionals 2130 computing professionals 2131 computer systems designers & analysts [incl. software engineer] 2132 computer programmers 2139 computing professionals not elsewhere classified 2140 architects, engineers etc professionals 2141 architects town & traffic planners [incl. landscape architect] 2142 civil engineers [incl. construction engineer] 2143 electrical engineers 2144 electronics & telecommunications engineers 2145 mechanical engineers 2146 chemical engineers 2147 mining engineers, metallurgists etc professionals 2148 cartographers & surveyors 2149 architects engineers etc professionals not elsewhere classified [incl. consultant] 3100 physical & engineering science associate professionals 3110 physical & engineering science technicians 3112 civil engineering technicians 3113 electrical engineering technicians 3114 electronics & telecommunications engineering technicians 3115 mechanical engineering technicians 3116 chemical engineering technicians 3119 physical & engineering science technicians not elsewhere classified 3141 ships engineers

EDU/WKP(2011)3
70
Appendix 2 Section C
Health services 2200 life science & health professionals 2212 pharmacologists, pathologists etc profess. incl. biochemist 2220 health professionals (except nursing) 2221 medical doctors 2222 dentists 2223 veterinarians 2224 pharmacists 2229 health professionals except nursing nec 2230 nursing & midwifery profess. incl. registered nurses, midwives 3152 safety, health & quality inspectors 3220 modern health associate professionals except nursing 3221 medical assistants 3222 sanitarians 3223 dieticians & nutritionists 3224 optometrists & opticians incl. dispensing optician 3225 dental assistants incl. oral hygienist 3226 physiotherapists etc associate professionals 3227 veterinary assistants incl. veterinarian vaccinator 3228 pharmaceutical assistants 3229 modern health associate professionals except nursing nec 3230 nursing & midwifery associate professionals 3231 nursing associate professionals incl. trainee nurses 3232 midwifery associate professionals incl. trainee midwife

EDU/WKP(2011)3
71
Appendix 2 Section D
Socio-cultural professionals 2300 teaching professionals 2310 higher education teaching professionals incl. univ. professor 2320 secondary education teaching professionals 2321 sec. teachers, academic track incl. middle school teacher 2322 sec. teachers, vocational track incl. vocational instructor 2330 primary & pre-primary education teaching professionals 2331 primary education teaching professionals 2332 pre-primary educ. teaching professionals incl. kindergarten 2340 special educ. teaching professionals incl. remedial, blind 2350 other teaching professionals 2351 education methods specialists incl. curricula developer 2352 school inspectors 2359 other teaching professionals not elsewhere classified 2412 personnel & careers profess. incl. job analyst, stud. counsellors 2419 business profess. incl. publicity/patent agent, market research 2420 legal professionals 2421 lawyers 2422 judges 2429 legal professionals not elsewhere classified incl. notary, notary public 2430 archivists, librarians etc information professionals 2431 archivists & curators 2432 librarians etc information professionals 2440 social science etc professionals 2441 economists 2442 sociologists, anthropologists etc professionals 2443 philosophers, historians & political scientists 2444 philologists, translators & interpreters 2446 social work professionals incl. welfare worker 2450 writers & creative or performing artists 2451 authors journalists & other writers incl. editor, technical writer 2452 sculptors, painters etc artists 2453 composers, musicians & singers 2454 choreographers & dancers 2455 film, stage etc actors & directors 2460 religious professionals 3240 traditional medicine practitioners & faith healers 3241 traditional medicine practitioners incl. herbalist 3242 faith healers 3300 teaching associate professionals 3310 primary education teaching associate professionals 3320 pre-primary education teaching associate professionals 3330 special education teaching associate professionals 3340 other teaching associate professionals 3400 other associate professionals

EDU/WKP(2011)3
72
3423 employment agents & labour contractors 3460 social work associate professionals 3470 artistic, entertainment & sports associate professionals 3471 decorators & commercial designers 3472 radio, television & other announcers 3473 street night-club etc musicians, singers & dancers 3474 clowns, magicians, acrobats and associate professionals 3475 athletes, sports persons and associate professionals 3480 religious associate professionals incl. evangelist, lay preacher

EDU/WKP(2011)3
73
Appendix 3: Plans to enter socio-cultural professions
To complement the descriptive presentation of gender differences in the preferred fields of employment Appendix 3 summarises the information about students who saw their future in education, law, arts and social sciences. While the cursory overview of occupational titles listed most frequently by PISA respondents suggested that teaching was likely to appeal to both young men and women, the proportions of young women who choose teaching, and other socio-cultural professions (the full list of which is in Appendix 2 Section D) outweigh the numbers of young men by a large margin.
Japan is the only country where socio-cultural professions attract more boys than girls, but it is also the only country where the information about students' plans was coded only to two, instead of four digit level of ISCO88. Thus this exception must treated with caution. In all other countries employment in these fields attracts more girls than boys. The disparities between countries in the size of the gender gap are not as strongly pronounced as in the case of health and computing/engineering employment. Nevertheless at least twice as many girls as boys plan a socio-cultural career in Italy, Belgium, Hungary, Austria, Greece, Spain, Luxembourg, Finland and the Czech Republic in the OECD group. At least as large a gender gap in these preferences exists in Macao-China, Kyrgyzstan, Thailand, Slovenia, Lithuania, Latvia, Estonia, Croatia, Russian Federation and Jordan.
These patterns are consistent with the proposition that gender ideologies entrenched in educational institutions, labour markets and the popular culture are powerful forces operating, at least to some extent, in much varied economic, political and social conditions in a notably similar manner.

EDU/WKP(2011)3
74
Appendix 3 Figure 1. Proportions of males and females planning a career in socio-cultural professions
Source: PISA 2006. For exact figures see Appendix 3 Table 1 below
0.0% 10.0% 20.0% 30.0% 40.0% 50.0% 60.0%
Japan
Austria
Chile
Czech Republic
Mexico
Switzerland
Germany
Hungary
Slovak Republic
United States
Iceland
Netherlands
Portugal
Poland
France
Finland
Sweden
Denmark
New Zealand
Norway
Australia
Italy
Canada
Belgium
Estonia
Slovenia
Israel
Spain
Ireland
Greece
United Kingdom
Luxembourg
Korea
Turkey
OECD average
Female Male
Expected careers Socio-cultural professions OECD countries
0.0% 20.0% 40.0% 60.0%
Thailand
Colombia
Indonesia
Montenegro
Hong Kong-China
Romania
Brazil
Macao-China
Bulgaria
Latvia
Ta Chinese Taipei
Jordan
Argentina
Lithuania
Serbia
Croatia
Russian Federation
Uruguay
Kyrgyzstan
Tunisia
Azerbaijan
Partners average
Female Male
Expected careers Socio-cultural professions partner countries

EDU/WKP(2011)3
75
Appendix 3 Table 1 Percent of students expecting socio-cultural professions at age 30, total and by gender All students Male Female DifferenceOECD mean S.E. mean S.E. mean S.E. mean S.E. Australia 28.7% (0.6%) 21.1% (0.6%) 36.1% (0.7%) 15.0% (0.9%) Austria 18.1% (0.9%) 12.2% (1.1%) 23.8% (1.2%) 11.6% (1.6%) Belgium 26.8% (0.9%) 17.9% (0.9%) 36.6% (1.2%) 18.7% (1.4%) Canada 28.9% (0.7%) 21.1% (0.8%) 36.4% (0.9%) 15.3% (1.0%) Chile 20.0% (1.3%) 15.2% (1.4%) 25.2% (1.4%) 10.0% (1.4%) Czech Republic 17.3% (1.0%) 10.3% (1.0%) 25.4% (1.5%) 15.1% (1.8%) Denmark 26.5% (0.8%) 18.0% (1.0%) 35.2% (1.3%) 17.2% (1.6%) Estonia 25.5% (0.8%) 14.1% (1.0%) 36.9% (1.4%) 22.8% (1.8%) Finland 26.1% (0.8%) 16.4% (0.9%) 34.4% (1.1%) 18.0% (1.3%) France 26.4% (1.1%) 19.2% (1.4%) 32.6% (1.2%) 13.4% (1.6%) Germany 22.1% (1.0%) 15.6% (1.1%) 28.6% (1.4%) 13.0% (1.7%) Greece 33.5% (1.0%) 23.8% (1.3%) 41.7% (1.3%) 17.9% (1.9%) Hungary 21.9% (1.5%) 14.9% (1.5%) 28.8% (1.8%) 13.9% (1.8%) Iceland 27.9% (1.0%) 24.9% (1.2%) 30.7% (1.3%) 5.8% (1.6%) Ireland 30.2% (0.7%) 21.5% (1.0%) 38.3% (1.0%) 16.9% (1.4%) Israel 31.9% (1.2%) 25.4% (1.6%) 37.5% (1.8%) 12.1% (2.3%) Italy 27.3% (0.8%) 18.0% (0.7%) 36.3% (1.1%) 18.3% (1.2%) Japan 12.9% (0.7%) 14.9% (0.9%) 11.1% (1.1%) -3.9% (1.4%) Korea 43.6% (1.1%) 34.4% (1.1%) 52.9% (1.3%) 18.5% (1.8%) Luxembourg 35.3% (0.9%) 23.6% (1.1%) 46.4% (1.2%) 22.8% (1.6%) Mexico 22.6% (0.5%) 16.9% (0.8%) 27.4% (0.7%) 10.5% (1.2%) Netherlands 25.4% (0.9%) 19.9% (1.0%) 31.1% (1.2%) 11.2% (1.2%) New Zealand 29.8% (0.8%) 23.2% (1.3%) 35.3% (0.9%) 12.1% (1.5%) Norway 28.4% (0.8%) 21.0% (1.1%) 35.7% (1.1%) 14.7% (1.6%) Poland 25.6% (0.8%) 18.7% (0.9%) 32.2% (1.0%) 13.5% (1.2%) Portugal 27.4% (0.9%) 22.9% (1.2%) 31.3% (1.1%) 8.4% (1.3%) Slovak Republic 23.8% (1.2%) 17.4% (1.1%) 30.1% (1.6%) 12.7% (1.6%) Slovenia 27.4% (0.7%) 16.8% (0.8%) 37.2% (1.2%) 20.3% (1.3%) Spain 29.5% (0.7%) 20.3% (0.9%) 37.6% (1.0%) 17.3% (1.3%) Sweden 29.0% (0.8%) 23.6% (1.1%) 34.4% (1.2%) 10.7% (1.7%) Switzerland 20.9% (0.7%) 14.5% (0.7%) 27.8% (0.9%) 13.3% (1.0%) Turkey 45.3% (1.6%) 35.9% (1.6%) 55.1% (1.7%) 19.1% (1.7%) United Kingdom 34.8% (0.7%) 27.3% (0.9%) 41.9% (1.0%) 14.6% (1.3%) United States 28.5% (0.8%) 26.6% (1.3%) 30.3% (0.9%) 3.7% (1.5%) OECD average 28.2% (0.2%) 21.1% (0.2%) 34.9% (0.2%) 13.9% (0.3%) Partners Argentina 31.4% (1.3%) 24.2% (1.7%) 37.5% (1.4%) 13.3% (2.0%) Azerbaijan 50.2% (1.4%) 39.1% (1.9%) 60.7% (1.7%) 21.7% (2.3%) Brazil 29.6% (0.9%) 27.7% (1.2%) 31.1% (1.2%) 3.4% (1.6%) Bulgaria 33.6% (0.9%) 32.5% (1.3%) 34.8% (1.2%) 2.3% (1.8%) Colombia 19.3% (0.8%) 17.7% (1.1%) 20.5% (1.0%) 2.8% (1.4%) Croatia 28.0% (1.2%) 15.3% (1.1%) 40.2% (1.8%) 24.9% (2.0%) Hong Kong-China 23.6% (0.7%) 16.8% (0.9%) 29.5% (0.9%) 12.7% (1.2%) Indonesia 21.0% (1.7%) 20.0% (2.3%) 22.1% (1.8%) 2.2% (2.6%) Jordan 25.2% (1.0%) 9.6% (0.9%) 36.2% (1.3%) 26.6% (1.6%) Kyrgyzstan 38.7% (1.0%) 28.4% (1.5%) 45.4% (1.2%) 17.0% (1.6%) Latvia 26.5% (0.9%) 15.6% (1.1%) 35.2% (1.3%) 19.6% (1.8%) Lithuania 26.8% (0.8%) 15.7% (0.9%) 37.6% (1.1%) 21.9% (1.4%) Macao-China 24.4% (0.8%) 16.7% (1.1%) 31.6% (1.1%) 14.9% (1.6%) Montenegro 26.7% (0.9%) 24.4% (1.2%) 29.0% (1.2%) 4.6% (1.7%) Romania 24.5% (1.1%) 17.7% (1.4%) 31.1% (2.2%) 13.4% (2.9%) Russian Federation 29.4% (1.0%) 14.6% (1.0%) 41.6% (1.5%) 27.0% (1.9%) Serbia 32.1% (1.5%) 24.6% (1.5%) 39.7% (2.0%) 15.1% (1.8%) Chinese Taipei 28.4% (0.8%) 21.8% (0.9%) 35.3% (1.2%) 13.5% (1.4%) Thailand 13.7% (0.8%) 9.0% (0.8%) 16.5% (1.0%) 7.4% (1.2%) Tunisia 41.1% (1.1%) 34.3% (1.4%) 46.5% (1.3%) 12.2% (1.5%) Uruguay 34.9% (1.1%) 24.8% (1.2%) 43.6% (1.5%) 18.8% (1.8%)

EDU/WKP(2011)3
76
Appendix 4: Missing data
The single question about student career plans is subject to high levels of missing data in some countries and therefore the impact of missing information must be systematically considered.
While the construction of student achievement scores and most attitudinal indices in the PISA data results in reduction of missing data, in some nations the proportions of uncodable responses and missing data on occupational expectations are high. The survey question about career plans is difficult to answer for some students (see Appendix Table 7). Missing and uncodable responses range from 8 to 53%. In almost all countries girls and students who are more successful academically are more likely to respond to the question about occupational expectations. In contrast male students and those less academically successful tend to skip this question.
Firstly, it is possible that students considered this particular question to be a “test” question, and thus the more academically oriented students felt a stronger obligation to give a valid answer. Thus the fact that the background questionnaire is administered in the context of a school test might adversely affect these students for whom the test situation is particularly confronting. For example, students completing an academic-oriented questionnaire where there are “right” and “wrong” answers, might be inclined to regard the educational and occupational expectation questions to have “right” and “wrong” answers.
Gender differences in levels of missing data are substantial and in almost all countries girls are more likely to provide information about their future career plans. It is possible, as was argued in the context of other studies, that girls tend to form concrete plans regarding their future at earlier stages in high school than boys (Feliciano and Rumbaut 2005). Therefore girls are more likely to give some answer to questions regarding plans for the future while boys are more likely to find such questions difficult to answer and annoying (White 2007). Moreover, in some countries, the average academic performance of girls exceeds, if by a small margin, the average performance of boys which may widen the gap in the likelihood of engaging with this question.
The gender difference in the rates of missing answers may be reflecting higher levels of average compliance with the school culture among girls. Schools usually encourage developing educational and occupational ambition as part of vocational counselling and a part of the broader education process. This compliance can be facilitated by the fact that women tend to be concentrated in non-manual employment sectors and thus the list of careers known to be entered by women which are attractive in terms of social status is both shorter and possibly better known among adolescents.
At least in Australia the ability and readiness to answer the question about career expectations has been found to be a good predictor of young adults' success in the labour market (Sikora and Saha, 2011). Relative to their high school peers who found this question too difficult to answer, young Australians who had a concrete occupational goal in high school tended to begin their adult career in higher status positions. This was the case even after the differences in academic performance in high school, university completion and plans regarding education have been taken into account.
Because the focus of this paper is on gender differences in the expectations of science-related employment, it is possible to assess the differences between students who answered and did not answer the question about their expected occupation using a closely related multi-item scale on science-related future (SCIEFUT)(OECD, 2007b: 16). This scale is useful for this purpose as it incorporates the following statement "I would like to work in a career involving science" alongside three similar items. The scale has low levels of missing data (from 0.1% in Korea to 10% in Israel) and the analysis of its mean values,

EDU/WKP(2011)3
77
presented below, reveals that, in many countries, there are few differences in future science career orientation for students who did and did not provide their expected occupation. In the eleven countries where such differences exist in girls' plans, and in seventeen countries in which boys' plans differ between the two groups, the differences are small (Appendix 4 Tables 1a and 1b). They do not exceed 20% of a standard deviation on a measurement scale ranging from 1.5 to 2.5 standard deviations. The scale measurement units have been standardised within the OECD countries.
Appendix 4 Table 1a Missing data by mean values on future-oriented science motivation. OECD countries
Males Females Mean on future-oriented science motivation
no answer to question about
expected occupation
question about expected
occupation answered
no answer to question about
expected occupation
question about expected
occupation answered
Mean S.E. Mean S.E. Mean S.E. Mean S.E. Australia -0.02 (0.03) -0.03 (0.02) -0.15 (0.03) -0.11 (0.02) Austria -0.29 (0.04) -0.29 (0.03) -0.34 (0.03) -0.38 (0.04) Belgium 0.12 (0.04) 0.04 (0.03) -0.07 (0.03) -0.13 (0.02) Canada 0.10 (0.03) 0.24 (0.02) -0.06 (0.03) 0.23 (0.02) Chile 0.25 (0.04) 0.24 (0.03) 0.19 (0.04) 0.25 (0.03) Czech Rep -0.16 (0.04) -0.23 (0.03) -0.01 (0.04) 0.01 (0.04) Denmark -0.13 (0.05) -0.23 (0.03) -0.20 (0.05) -0.12 (0.03) Estonia -0.05 (0.03) -0.14 (0.02) -0.06 (0.03) -0.06 (0.03) Finland -0.11 (0.04) -0.27 (0.03) -0.05 (0.04) -0.14 (0.02) France 0.10 (0.04) 0.04 (0.04) -0.09 (0.04) -0.13 (0.03) Germany 0.04 (0.04) -0.09 (0.03) -0.17 (0.04) -0.29 (0.02) Greece 0.39 (0.04) 0.29 (0.03) 0.04 (0.05) -0.04 (0.02) Hungary 0.08 (0.03) 0.06 (0.03) 0.06 (0.03) 0.09 (0.03) Iceland 0.18 (0.05) 0.11 (0.03) -0.15 (0.05) -0.18 (0.03) Ireland -0.06 (0.04) -0.10 (0.02) -0.06 (0.06) 0.01 (0.03) Israel 0.35 (0.04) 0.44 (0.04) 0.13 (0.04) 0.29 (0.03) Italy 0.26 (0.04) 0.30 (0.02) 0.08 (0.03) 0.10 (0.02) Japan -0.03 (0.03) -0.02 (0.03) -0.51 (0.03) -0.44 (0.03) Korea -0.10 (0.07) -0.11 (0.03) -0.27 (0.08) -0.40 (0.03) Luxembourg 0.05 (0.05) -0.06 (0.03) -0.08 (0.05) -0.05 (0.03) Mexico 0.72 (0.04) 0.62 (0.02) 0.58 (0.04) 0.55 (0.02) Netherlands 0.01 (0.06) -0.13 (0.03) -0.20 (0.04) -0.39 (0.02) New Zealand 0.07 (0.04) 0.01 (0.03) -0.03 (0.05) -0.02 (0.03) Norway -0.01 (0.05) -0.20 (0.03) -0.23 (0.04) -0.32 (0.03) Poland 0.23 (0.05) 0.05 (0.02) 0.22 (0.04) 0.22 (0.02) Portugal 0.35 (0.04) 0.27 (0.03) 0.20 (0.05) 0.25 (0.03) Slovak Republic 0.07 (0.04) 0.01 (0.03) 0.09 (0.05) 0.15 (0.04) Slovenia 0.11 (0.04) -0.04 (0.03) 0.05 (0.05) 0.02 (0.03) Spain 0.12 (0.03) 0.14 (0.02) 0.00 (0.03) 0.02 (0.02) Sweden -0.08 (0.06) -0.20 (0.03) -0.20 (0.05) -0.26 (0.02) Switzerland -0.04 (0.04) -0.20 (0.02) -0.24 (0.04) -0.28 (0.03) Turkey 0.60 (0.04) 0.74 (0.04) 0.56 (0.06) 0.60 (0.03) United Kingdom 0.04 (0.04) -0.04 (0.02) -0.29 (0.05) -0.19 (0.02) United States 0.27 (0.05) 0.27 (0.02) 0.14 (0.05) 0.13 (0.02)
Note: shaded estimates are statistically different between students who did and did not answer the single question about occupational expectations.

EDU/WKP(2011)3
78
Appendix 4 Table 1b Missing data by mean values on future-oriented science motivation. Partners countries
Males Females Mean on future-oriented science motivation
no answer to question about
expected occupation
question about expected occupation
answered
no answer to question about
expected occupation
question about expected occupation
answered Mean S.E. Mean S.E. Mean S.E. Mean S.E. Argentina 0.36 (0.08) 0.31 (0.04) 0.19 (0.07) 0.33 (0.03) Azerbaijan 0.84 (0.03) 0.60 (0.03) 0.82 (0.05) 0.63 (0.03) Brazil 0.53 (0.04) 0.47 (0.02) 0.34 (0.04) 0.45 (0.02) Bulgaria 0.36 (0.05) 0.31 (0.03) 0.38 (0.04) 0.46 (0.03) Colombia 0.84 (0.06) 0.73 (0.04) 0.66 (0.13) 0.74 (0.03) Croatia 0.20 (0.04) 0.20 (0.03) 0.27 (0.03) 0.21 (0.02) Hong Kong-China 0.39 (0.03) 0.48 (0.02) 0.07 (0.06) 0.13 (0.02) Indonesia 0.83 (0.04) 0.75 (0.05) 0.84 (0.03) 0.85 (0.03) Jordan 1.06 (0.03) 1.19 (0.02) 0.92 (0.05) 1.01 (0.03) Kyrgyzstan 1.05 (0.03) 0.98 (0.02) 1.09 (0.03) 1.03 (0.03) Latvia -0.03 (0.03) -0.12 (0.03) -0.11 (0.04) -0.08 (0.02) Lithuania 0.12 (0.03) 0.07 (0.02) 0.20 (0.03) 0.16 (0.03) Macao-China 0.21 (0.04) 0.28 (0.02) 0.05 (0.04) 0.07 (0.02) Montenegro 0.31 (0.05) 0.32 (0.03) 0.31 (0.05) 0.34 (0.03) Romania 0.62 (0.06) 0.55 (0.02) 0.54 (0.07) 0.54 (0.02) Russian Federation 0.44 (0.04) 0.34 (0.02) 0.36 (0.04) 0.27 (0.02) Serbia 0.37 (0.05) 0.33 (0.03) 0.38 (0.05) 0.20 (0.03) Chinese Taipei 0.37 (0.04) 0.40 (0.02) -0.08 (0.03) -0.15 (0.02) Thailand 0.82 (0.02) 0.85 (0.02) 0.80 (0.02) 0.90 (0.02) Tunisia 1.08 (0.05) 1.11 (0.02) 0.99 (0.07) 1.05 (0.02) Uruguay 0.17 (0.05) 0.06 (0.03) 0.21 (0.05) 0.20 (0.03)
Note: shaded estimates are statistically different between students who did and did not answer the single question about occupational expectations.

EDU/WKP(2011)3
79
Appendix 4 Table 2 Missing data and uncodable responses
Uncodable responses (housewife, welfare beneficiary,
don't know) Missing answer
OECD Males Females Males Females Australia 4.1% (0.3%) 7192 5.2% (0.4%) 6978 13.4% (0.5%) 7192 10.3% (0.5%) 6978 Austria 12.7% (0.8%) 2480 18.3% (0.9%) 2447 17.6% (0.9%) 2480 12.7% (0.8%) 2447 Belgium 9.4% (0.5%) 4626 12.4% (0.5%) 4231 9.6% (0.7%) 4626 7.7% (0.5%) 4231 Canada 13.5% (0.5%) 11104 11.5% (0.5%) 11542 5.0% (0.5%) 11104 3.1% (0.2%) 11542 Chile 5.4% (0.4%) 2830 5.5% (0.6%) 2403 14.6% (1.2%) 2830 12.5% (1.1%) 2403 Czech Republic 12.0% (0.8%) 3146 14.0% (1.0%) 2786 20.9% (0.9%) 3146 15.4% (0.9%) 2786 Denmark 14.7% (0.9%) 2201 18.3% (0.9%) 2331 6.3% (0.8%) 2201 6.0% (0.7%) 2331 Estonia 12.0% (0.7%) 2479 11.6% (0.8%) 2386 14.4% (0.9%) 2479 13.0% (1.0%) 2386 Finland 18.3% (0.8%) 2329 13.2% (0.7%) 2385 9.6% (0.7%) 2329 6.7% (0.5%) 2385 France 2.8% (0.4%) 2292 2.6% (0.3%) 2424 21.6% (1.2%) 2292 17.9% (1.0%) 2424 Germany 13.9% (0.7%) 2491 11.9% (0.8%) 2400 21.0% (1.0%) 2491 18.8% (0.8%) 2400 Greece 6.3% (0.5%) 2432 6.6% (0.6%) 2441 20.5% (1.3%) 2432 13.4% (0.8%) 2441 Hungary 12.5% (0.8%) 2286 15.6% (0.8%) 2204 18.4% (1.0%) 2286 14.0% (0.8%) 2204 Iceland 0.0% (0.0%) 1877 0.0% (0.0%) 1912 23.7% (1.0%) 1877 19.3% (0.9%) 1912 Ireland 6.1% (0.6%) 2264 7.5% (0.6%) 2321 10.4% (0.9%) 2264 7.9% (0.7%) 2321 Israel 11.9% (0.9%) 2204 14.7% (0.7%) 2380 39.6% (1.6%) 2204 35.0% (1.4%) 2380 Italy 6.7% (0.4%) 10934 7.4% (0.5%) 10839 8.0% (0.5%) 10934 7.3% (0.4%) 10839 Japan 19.6% (0.9%) 3003 21.1% (1.2%) 2949 13.7% (0.8%) 3003 12.9% (0.8%) 2949 Korea 3.3% (0.4%) 2613 4.9% (0.5%) 2563 3.4% (0.5%) 2613 2.6% (0.3%) 2563 Luxembourg 13.7% (0.7%) 2306 14.1% (0.7%) 2261 7.5% (0.6%) 2306 3.7% (0.4%) 2261 Mexico 7.2% (0.7%) 14188 7.0% (0.4%) 16783 16.9% (0.9%) 14188 13.1% (0.7%) 16783 Netherlands 10.2% (0.6%) 2501 9.0% (0.6%) 2370 3.7% (0.4%) 2501 2.9% (0.4%) 2370 New Zealand 11.8% (0.7%) 2350 11.1% (0.6%) 2473 12.3% (0.7%) 2350 8.4% (0.6%) 2473 Norway 7.9% (0.6%) 2415 12.2% (0.7%) 2277 19.1% (1.2%) 2415 14.3% (0.8%) 2277 Poland 7.7% (0.6%) 2719 9.4% (0.7%) 2828 12.7% (0.6%) 2719 10.9% (0.7%) 2828 Portugal 19.3% (1.0%) 2425 14.4% (0.7%) 2684 4.0% (0.5%) 2425 4.1% (0.5%) 2684 Slovak Republic 11.4% (0.9%) 2391 14.5% (0.9%) 2340 12.8% (1.1%) 2391 8.9% (0.7%) 2340 Slovenia 7.1% (0.5%) 3552 8.1% (0.6%) 3043 14.7% (0.8%) 3552 11.3% (0.7%) 3043 Spain 6.1% (0.5%) 9803 6.5% (0.5%) 9801 20.0% (0.9%) 9803 14.7% (0.6%) 9801 Sweden 10.9% (0.7%) 2282 10.7% (0.6%) 2161 8.6% (0.8%) 2282 6.5% (0.5%) 2161 Switzerland 8.9% (0.5%) 6249 13.4% (0.7%) 5943 9.3% (0.7%) 6249 7.7% (0.5%) 5943 Turkey 0.2% (0.1%) 2652 0.2% (0.1%) 2290 20.4% (1.5%) 2652 13.9% (1.0%) 2290 United Kingdom 8.2% (0.5%) 6523 9.3% (0.7%) 6629 6.8% (0.6%) 6523 4.8% (0.5%) 6629 United States 11.0% (0.6%) 2839 8.4% (0.6%) 2772 7.2% (0.8%) 2839 5.1% (0.6%) 2772
Partners Argentina 5.9% (0.8%) 1981 5.5% (0.7%) 2358 11.7% (1.7%) 1981 9.5% (1.0%) 2358 Azerbaijan 4.1% (0.5%) 2685 2.5% (0.5%) 2499 33.2% (1.7%) 2685 29.8% (1.5%) 2499 Brazil 5.3% (0.5%) 4258 6.3% (0.5%) 5037 13.2% (0.8%) 4258 9.2% (0.6%) 5037 Bulgaria 10.1% (0.8%) 2320 9.1% (0.6%) 2178 21.2% (1.0%) 2320 20.0% (1.0%) 2178 Chinese Taipei 15.1% (0.7%) 4620 11.1% (0.7%) 4195 5.7% (0.5%) 4620 5.0% (0.5%) 4195 Colombia 1.2% (0.2%) 2043 1.2% (0.3%) 2435 8.5% (1.0%) 2043 6.3% (0.7%) 2435 Croatia 19.0% (0.9%) 2613 24.8% (0.9%) 2600 12.5% (1.0%) 2613 8.2% (0.6%) 2600 Hong Kong-China 8.8% (0.6%) 2294 7.1% (0.6%) 2351 9.9% (0.9%) 2294 7.0% (0.6%) 2351 Indonesia 6.0% (0.9%) 5291 7.0% (0.9%) 5356 19.1% (2.1%) 5291 18.5% (1.2%) 5356 Jordan 3.5% (0.5%) 2952 4.9% (0.4%) 3557 24.4% (2.0%) 2952 12.7% (0.5%) 3557 Kyrgyzstan 5.5% (0.6%) 2731 4.5% (0.4%) 3173 32.2% (1.6%) 2731 24.1% (1.2%) 3173 Latvia 10.1% (0.7%) 2286 9.0% (0.8%) 2433 16.6% (1.3%) 2286 11.3% (0.8%) 2433 Lithuania 13.5% (0.9%) 2384 14.2% (0.9%) 2360 12.4% (0.9%) 2384 9.7% (0.7%) 2360 Macao-China 9.0% (0.7%) 2320 6.1% (0.4%) 2440 15.5% (0.7%) 2320 13.3% (0.7%) 2440 Montenegro 9.4% (0.8%) 2330 8.3% (0.7%) 2125 20.5% (1.0%) 2330 18.8% (0.9%) 2125 Romania 6.1% (0.8%) 2684 6.0% (1.0%) 2434 4.5% (0.8%) 2684 3.9% (0.6%) 2434 Russian Federation 8.6% (0.5%) 2799 11.5% (0.8%) 3000 15.1% (0.8%) 2799 10.1% (0.7%) 3000 Serbia 7.4% (0.7%) 2434 8.3% (0.6%) 2364 8.8% (0.8%) 2434 7.2% (0.6%) 2364 Thailand 15.3% (1.0%) 2608 13.0% (0.8%) 3584 22.1% (1.5%) 2608 16.6% (1.0%) 3584 Tunisia 3.8% (0.5%) 2190 2.1% (0.4%) 2450 13.1% (1.3%) 2190 8.9% (0.8%) 2450 Uruguay 11.9% (0.8%) 2272 11.2% (0.7%) 2567 9.3% (0.9%) 2272 6.4% (0.5%) 2567

EDU/WKP(2011)3
80
Appendix 5: Additional information on methods
This appendix provides the details of the modelling strategy used for three level models with binary variables and multi-level models with continuous outcomes.
For outcomes which were binary variables the three level model specified the probability of expecting an occupation within a specified subfield of science ( )ijcπ of person i from school j and country c using log of the odds:
( )log / (1 ) logit( )ijc ijc ijcπ π π− =
Continuous outcomes - two-level models
Where the dependent variable was continuous (e.g. the ISEI scale of occupational status) the two-level models took on the following form:
Student level (1): 01
N
ij j n n ijn
Y X rβ β=
= + +∑
School level (2): 0 00 0 0 01
N
j n n jn
X uβ γ γ=
= + +∑
where β0j is the constant or the intercept in school j and 00γ is the average intercept across schools in each country. The error component u0j varies between schools within each country, Βn=1 through βN are regression coefficients for corresponding student-level explanatory variables Xn=1 through XN. Moreover, rij, which is error varying between students within a school, is also specified. In multilevel logit models, this individual error term is omitted due to identification problems (Raudenbush and Bryk 2002).
Binary outcomes - three-level models
For the three-level estimation with country-level covariates the models had the following form:
Student level (1): 01
logit( )N
ij jc n nn
Xπ β β=
= +∑
School level (2): 0 00 0 0 01
N
jc c n n jcn
X uβ γ γ=
= + +∑
Country level (3): 00 000 00 00 01
N
c n n cn
X hγ η η=
= + +∑
Country level estimates are in the third equation and subscript c denotes regression coefficients at this level. Country-level covariates (X00n=1 through X00N ) correspond to regression coefficients (X00n=1 through X00N ) while 000η denotes the average intercept across countries. The error component 0ch varies between countries.
All estimates have been obtained with robust standard errors which is appropriate to offset the impact of any non-normality of outcomes and non-independence of observations due to a two-stage stratified cluster sample design. In three level models the sampling weights as per Pfeffermann et al. procedure were used (Pfeffermann, Skinner, Holmes, Goldstein, and Rasbash 2002). To ensure that each country contributes equally to the analysis the student final weights were also normalised at the country level.

EDU/WKP(2011)3
81
THE OECD EDUCATION WORKING PAPERS SERIES ON LINE
The OECD Education Working Papers Series may be found at:
• The OECD Directorate for Education website: www.oecd.org/edu/workingpapers
• The OECD’s online library, SourceOECD: www.sourceoecd.org
• The Research Papers in Economics (RePEc) website: www.repec.org
If you wish to be informed about the release of new OECD Education working papers, please:
• Go to www.oecd.org
• Click on “My OECD”
• Sign up and create an account with “My OECD”
• Select “Education” as one of your favourite themes
• Choose “OECD Education Working Papers” as one of the newsletters you would like to receive