Embed Size (px)
Citation preview
Workplace Gender Equality Agency | Gender pay gap statistics | www.wgea.gov.au 1
August 2016
Gender pay gap statistics
Contents Key results ........................................................................................................................ 2
About this fact sheet ......................................................................................................... 3
Further information ........................................................................................................... 3
National ............................................................................................................................ 4
State and territory ............................................................................................................. 5
Industry ............................................................................................................................. 5
Private and public sector .................................................................................................. 6
Age group ......................................................................................................................... 7
Method of setting pay ....................................................................................................... 8
Occupation ....................................................................................................................... 9
Organisational gender pay gap analysis......................................................................... 11
Workplace Gender Equality Agency | Gender pay gap statistics | www.wgea.gov.au 2
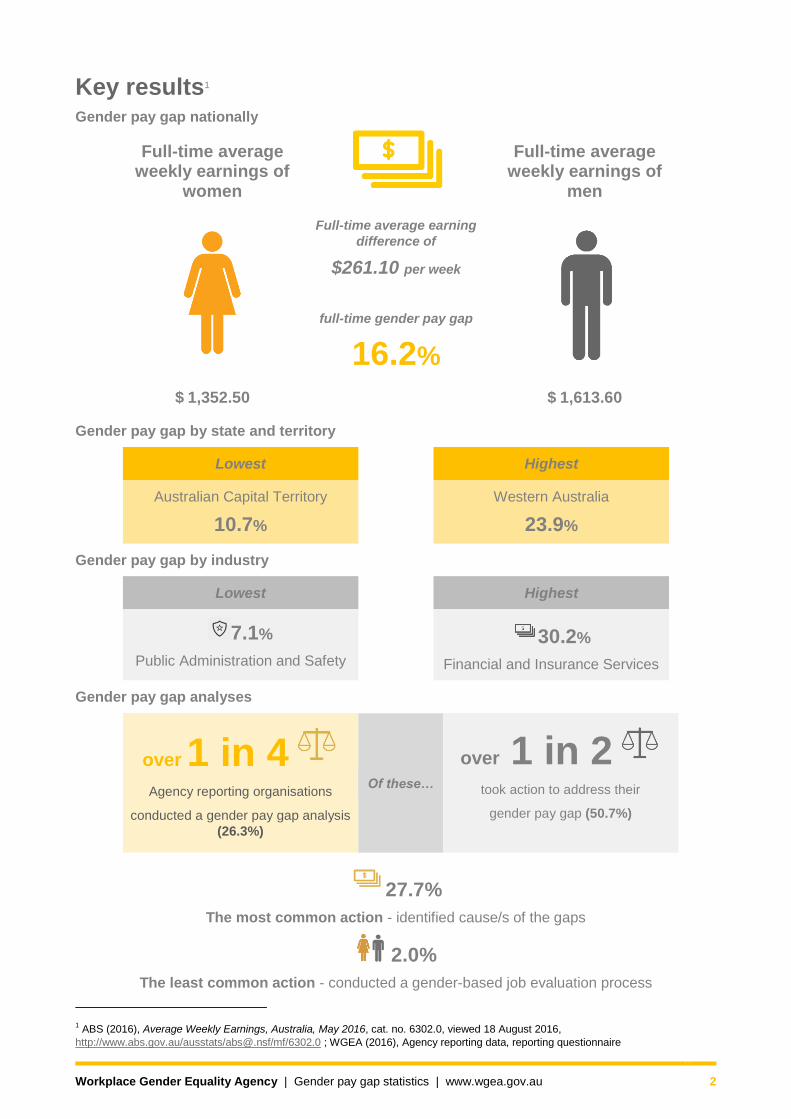
Key results1 Gender pay gap nationally
Full-time average weekly earnings of
women
Full-time average weekly earnings of
men
Full-time average earning
difference of
$261.10 per week
full-time gender pay gap
16.2%
$ 1,352.50 $ 1,613.60
Gender pay gap by state and territory
Lowest Highest
Australian Capital Territory
10.7%
Western Australia
23.9%
Gender pay gap by industry
Lowest Highest
7.1%
Public Administration and Safety
30.2%
Financial and Insurance Services
Gender pay gap analyses
over 1 in 4
Agency reporting organisations
conducted a gender pay gap analysis
(26.3%)
Of these…
over 1 in 2
took action to address their
gender pay gap (50.7%)
27.7% The most common action - identified cause/s of the gaps
2.0%
The least common action - conducted a gender-based job evaluation process
1 ABS (2016), Average Weekly Earnings, Australia, May 2016, cat. no. 6302.0, viewed 18 August 2016,
http://www.abs.gov.au/ausstats/[email protected]/mf/6302.0 ; WGEA (2016), Agency reporting data, reporting questionnaire
Workplace Gender Equality Agency | Gender pay gap statistics | www.wgea.gov.au 3
About this fact sheet The gender pay gap is the difference between women’s and men’s average weekly full-time equivalent
earnings, expressed as a percentage of men’s earnings. The Workplace Gender Equality Agency (Agency)
calculates the national gender pay gap using Australian Bureau of Statistics' (ABS) Full-Time Adult Average
Weekly Ordinary Time Earnings (AWOTE) Trend data from the Average Weekly Earnings (AWE) survey
(cat. no. 6302.0).
The national gender pay gap is currently 16.2%1 and has hovered between 15% and 19% for the past two
decades.
The national gender pay gap based on AWE is a symbol for the overall position of women in the workforce. It
does not show ‘like-for-like’ pay gaps, that is employees working in the same or comparable roles, nor
determine or explain the causes of any differences in earnings between women and men.
The gender pay gap is influenced by a number of interrelated work, family and societal factors, including
stereotypes about the work women and men ‘should’ do, and the way women and men ‘should’ engage in
the workforce. Other factors that contribute to the gender pay gap include:
women and men working in different industries (industrial segregation) and different jobs (occupational
segregation). Historically, female-dominated industries and jobs have attracted lower wages than male-
dominated industries and jobs
a lack of women in senior positions, and a lack of part-time or flexible senior roles. Women are more likely
than men to work part-time or flexibly because they still undertake most of society’s unpaid caring work
and may find it difficult to access senior roles
women’s more precarious attachment to the workforce (largely due to their unpaid caring responsibilities)
differences in education, work experience and seniority
discrimination, both direct and indirect.
This fact sheet details the national gender pay gap, as well as the gender pay gap by states and territories,
industries, sectors, age groups, methods of setting pay and occupations. The data was sourced primarily
from the ABS Full-Time Adult Average Weekly Ordinary Time Earnings Trend series from the AWE survey,2
which calculates the full-time adult average weekly ordinary time earnings (trend) before tax, excluding
factors such as overtime, pay that is salary sacrificed and junior and part-time employees.
Where data was unavailable from this survey, this data was sourced from the ABS Employee Earnings and
Hours employer survey3 (age group and method of setting pay) and from the Agency’s own gender pay gap
data (occupation).4
Information about whether organisations have conducted, or are in the process of developing a gender pay
gap analysis and have taken action to address the gender pay gap, is derived from the Agency’s online
reporting questionnaire conducted in the 2014-15 reporting period.5
Further information For Agency gender pay gap data (based on a census of non-public sector organisations with 100 or more
employees that are required to report to the Agency, and representing 40% of Australian employees), refer
to the WGEA Data Explorer, a comprehensive data visualisation tool that allows users to ‘drill down’ the
Agency’s aggregated dataset using industry and occupation categories.
Alternatively, refer to Australia’s gender equality scorecard released in November 2015, and the first report in
the BCEC | WGEA Gender Equity Series, Gender Equity Insights 2016: Inside Australia’s Gender Pay Gap
released March 2016 for a more detailed analysis of the Agency’s gender pay gap data (such as by
Workplace Gender Equality Agency | Gender pay gap statistics | www.wgea.gov.au 4
governing boards’ gender composition and by whether organisations are more female-dominated, male-
dominated or mixed).
For more information on employer initiatives in relation to the gender pay gap (including taking action to
address the gender pay gap and pay equity objectives within formal remuneration policies and strategies),
refer to the Agency’s 2015 Pay equity report card.
For more information on how the gender pay gap is measured and interpreted refer to the Gender Pay Gap
Taskforce Report.
To find out more about the different data sets that can be used to understand gender pay gaps in Australia,
refer to the Agency’s Differences between the full-time gender pay gap infographic at the end of this fact
sheet.
National
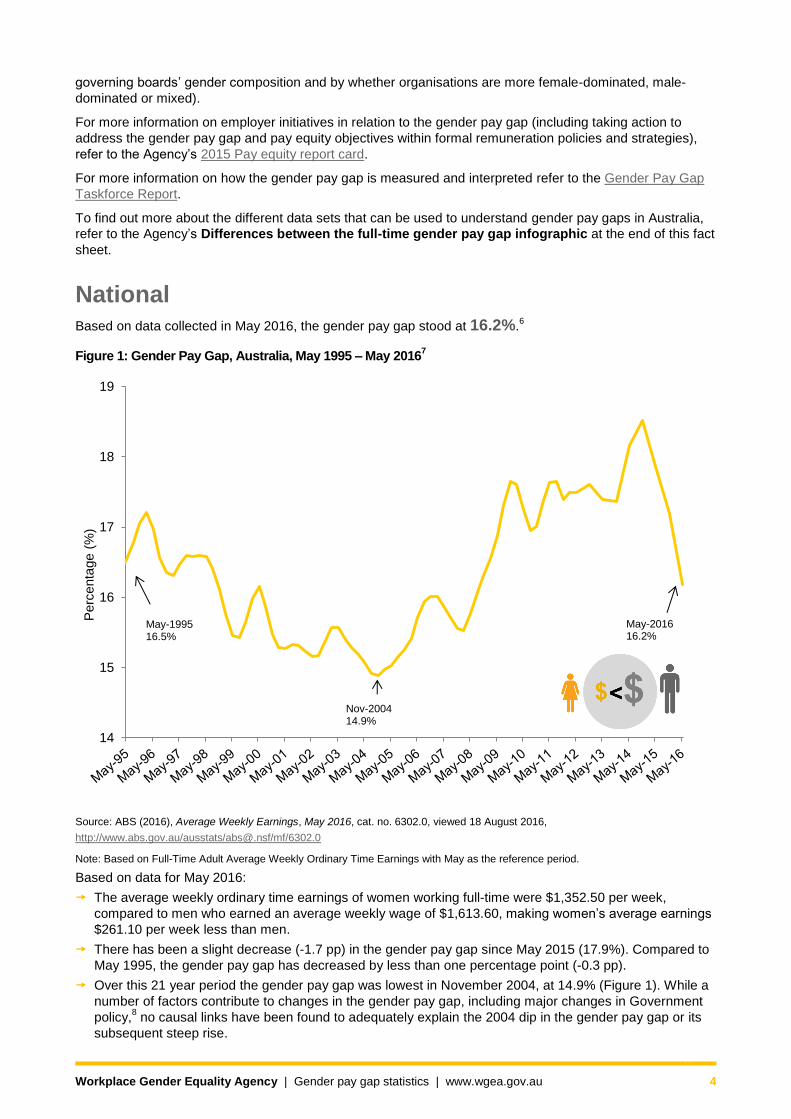
Based on data collected in May 2016, the gender pay gap stood at 16.2%.6
Figure 1: Gender Pay Gap, Australia, May 1995 – May 20167
Source: ABS (2016), Average Weekly Earnings, May 2016, cat. no. 6302.0, viewed 18 August 2016,
http://www.abs.gov.au/ausstats/[email protected]/mf/6302.0
Note: Based on Full-Time Adult Average Weekly Ordinary Time Earnings with May as the reference period.
Based on data for May 2016:
The average weekly ordinary time earnings of women working full-time were $1,352.50 per week,
compared to men who earned an average weekly wage of $1,613.60, making women’s average earnings
$261.10 per week less than men.
There has been a slight decrease (-1.7 pp) in the gender pay gap since May 2015 (17.9%). Compared to
May 1995, the gender pay gap has decreased by less than one percentage point (-0.3 pp).
Over this 21 year period the gender pay gap was lowest in November 2004, at 14.9% (Figure 1). While a
number of factors contribute to changes in the gender pay gap, including major changes in Government
policy,8 no causal links have been found to adequately explain the 2004 dip in the gender pay gap or its
subsequent steep rise.
14
15
16
17
18
19
Perc
enta
ge (
%)
May-1995 16.5%
Nov-2004 14.9%
May-2016 16.2%
Workplace Gender Equality Agency | Gender pay gap statistics | www.wgea.gov.au 5
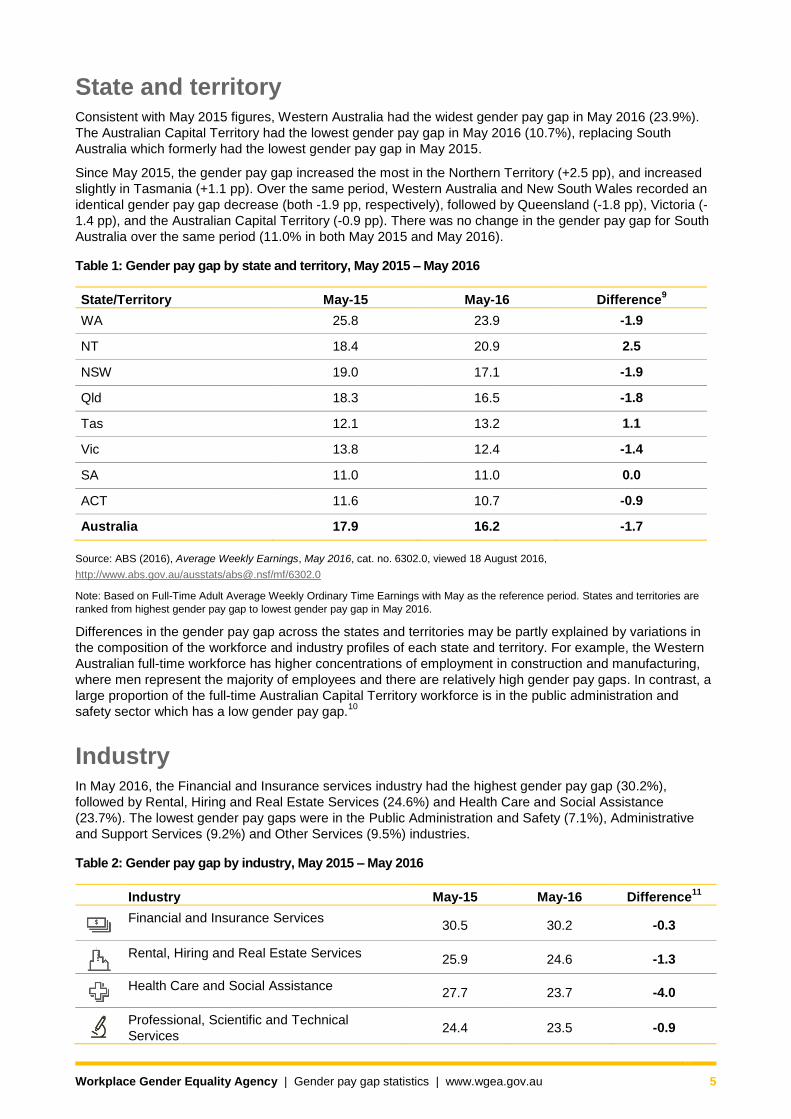
State and territory Consistent with May 2015 figures, Western Australia had the widest gender pay gap in May 2016 (23.9%).
The Australian Capital Territory had the lowest gender pay gap in May 2016 (10.7%), replacing South
Australia which formerly had the lowest gender pay gap in May 2015.
Since May 2015, the gender pay gap increased the most in the Northern Territory (+2.5 pp), and increased
slightly in Tasmania (+1.1 pp). Over the same period, Western Australia and New South Wales recorded an
identical gender pay gap decrease (both -1.9 pp, respectively), followed by Queensland (-1.8 pp), Victoria (-
1.4 pp), and the Australian Capital Territory (-0.9 pp). There was no change in the gender pay gap for South
Australia over the same period (11.0% in both May 2015 and May 2016).
Table 1: Gender pay gap by state and territory, May 2015 – May 2016
State/Territory May-15 May-16 Difference9
WA 25.8 23.9 -1.9
NT 18.4 20.9 2.5
NSW 19.0 17.1 -1.9
Qld 18.3 16.5 -1.8
Tas 12.1 13.2 1.1
Vic 13.8 12.4 -1.4
SA 11.0 11.0 0.0
ACT 11.6 10.7 -0.9
Australia 17.9 16.2 -1.7
Source: ABS (2016), Average Weekly Earnings, May 2016, cat. no. 6302.0, viewed 18 August 2016,
http://www.abs.gov.au/ausstats/[email protected]/mf/6302.0
Note: Based on Full-Time Adult Average Weekly Ordinary Time Earnings with May as the reference period. States and territories are
ranked from highest gender pay gap to lowest gender pay gap in May 2016.
Differences in the gender pay gap across the states and territories may be partly explained by variations in
the composition of the workforce and industry profiles of each state and territory. For example, the Western
Australian full-time workforce has higher concentrations of employment in construction and manufacturing,
where men represent the majority of employees and there are relatively high gender pay gaps. In contrast, a
large proportion of the full-time Australian Capital Territory workforce is in the public administration and
safety sector which has a low gender pay gap.10
Industry In May 2016, the Financial and Insurance services industry had the highest gender pay gap (30.2%),
followed by Rental, Hiring and Real Estate Services (24.6%) and Health Care and Social Assistance
(23.7%). The lowest gender pay gaps were in the Public Administration and Safety (7.1%), Administrative
and Support Services (9.2%) and Other Services (9.5%) industries.
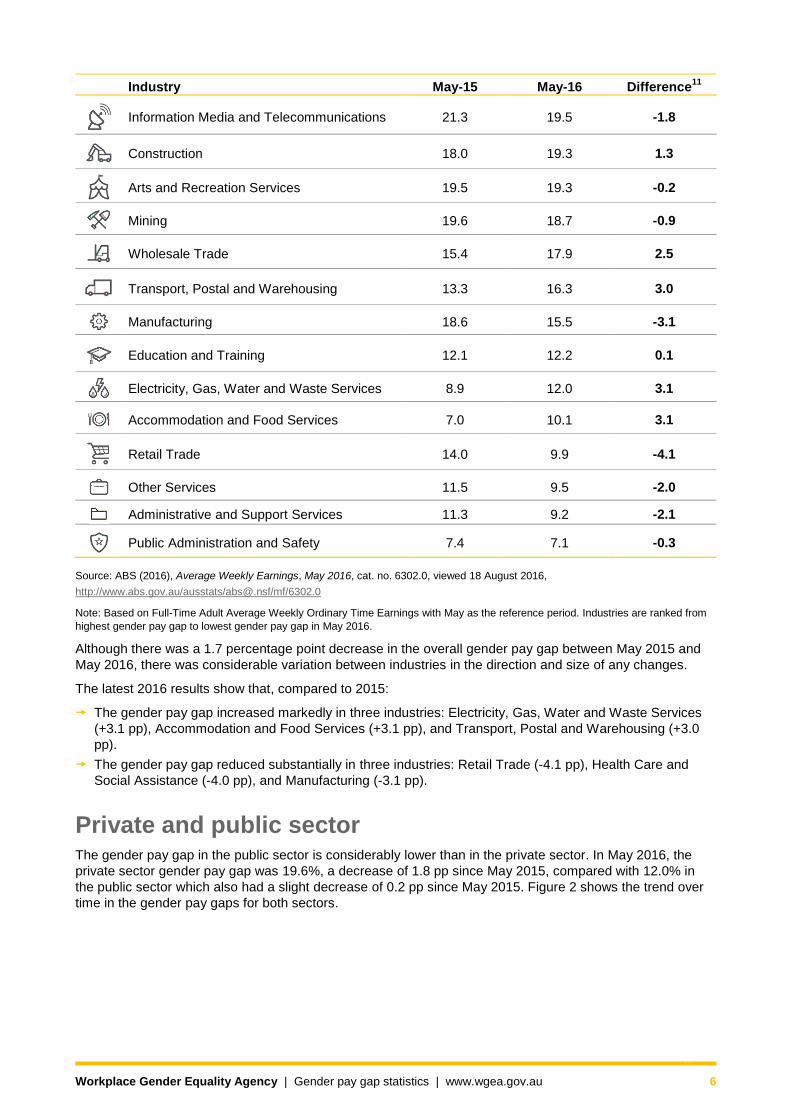
Table 2: Gender pay gap by industry, May 2015 – May 2016
Industry May-15 May-16 Difference11
Financial and Insurance Services 30.5 30.2 -0.3
Rental, Hiring and Real Estate Services
25.9 24.6 -1.3
Health Care and Social Assistance 27.7 23.7 -4.0
Professional, Scientific and Technical
Services 24.4 23.5 -0.9
Workplace Gender Equality Agency | Gender pay gap statistics | www.wgea.gov.au 6
Industry May-15 May-16 Difference11
Information Media and Telecommunications 21.3 19.5 -1.8
Construction 18.0 19.3 1.3
Arts and Recreation Services 19.5 19.3 -0.2
Mining 19.6 18.7 -0.9
Wholesale Trade 15.4 17.9 2.5
Transport, Postal and Warehousing 13.3 16.3 3.0
Manufacturing 18.6 15.5 -3.1
Education and Training 12.1 12.2 0.1
Electricity, Gas, Water and Waste Services 8.9 12.0 3.1
Accommodation and Food Services 7.0 10.1 3.1
Retail Trade 14.0 9.9 -4.1
Other Services 11.5 9.5 -2.0
Administrative and Support Services 11.3 9.2 -2.1
Public Administration and Safety 7.4 7.1 -0.3
Source: ABS (2016), Average Weekly Earnings, May 2016, cat. no. 6302.0, viewed 18 August 2016,
http://www.abs.gov.au/ausstats/[email protected]/mf/6302.0
Note: Based on Full-Time Adult Average Weekly Ordinary Time Earnings with May as the reference period. Industries are ranked from
highest gender pay gap to lowest gender pay gap in May 2016.
Although there was a 1.7 percentage point decrease in the overall gender pay gap between May 2015 and
May 2016, there was considerable variation between industries in the direction and size of any changes.
The latest 2016 results show that, compared to 2015:
The gender pay gap increased markedly in three industries: Electricity, Gas, Water and Waste Services
(+3.1 pp), Accommodation and Food Services (+3.1 pp), and Transport, Postal and Warehousing (+3.0
pp).
The gender pay gap reduced substantially in three industries: Retail Trade (-4.1 pp), Health Care and
Social Assistance (-4.0 pp), and Manufacturing (-3.1 pp).
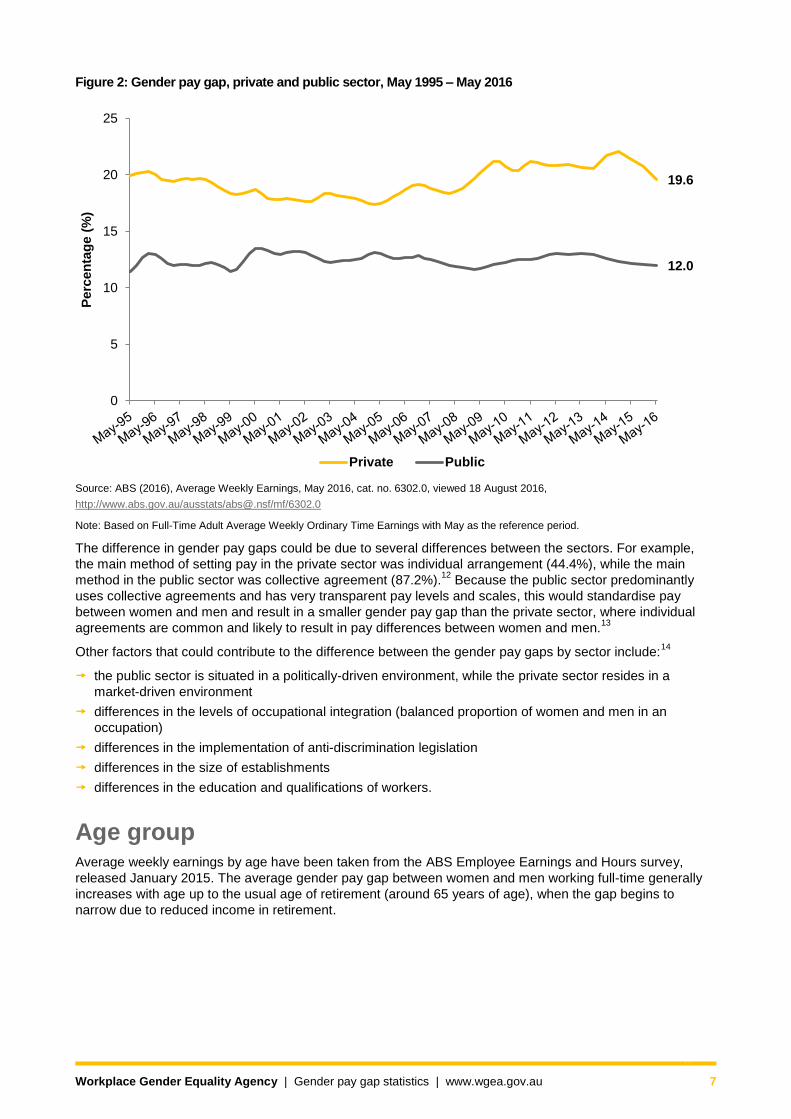
Private and public sector The gender pay gap in the public sector is considerably lower than in the private sector. In May 2016, the
private sector gender pay gap was 19.6%, a decrease of 1.8 pp since May 2015, compared with 12.0% in
the public sector which also had a slight decrease of 0.2 pp since May 2015. Figure 2 shows the trend over
time in the gender pay gaps for both sectors.
Workplace Gender Equality Agency | Gender pay gap statistics | www.wgea.gov.au 7
Figure 2: Gender pay gap, private and public sector, May 1995 – May 2016
Source: ABS (2016), Average Weekly Earnings, May 2016, cat. no. 6302.0, viewed 18 August 2016,
http://www.abs.gov.au/ausstats/[email protected]/mf/6302.0
Note: Based on Full-Time Adult Average Weekly Ordinary Time Earnings with May as the reference period.
The difference in gender pay gaps could be due to several differences between the sectors. For example,
the main method of setting pay in the private sector was individual arrangement (44.4%), while the main
method in the public sector was collective agreement (87.2%).12
Because the public sector predominantly
uses collective agreements and has very transparent pay levels and scales, this would standardise pay
between women and men and result in a smaller gender pay gap than the private sector, where individual
agreements are common and likely to result in pay differences between women and men.13
Other factors that could contribute to the difference between the gender pay gaps by sector include:14
the public sector is situated in a politically-driven environment, while the private sector resides in a
market-driven environment
differences in the levels of occupational integration (balanced proportion of women and men in an
occupation)
differences in the implementation of anti-discrimination legislation
differences in the size of establishments
differences in the education and qualifications of workers.
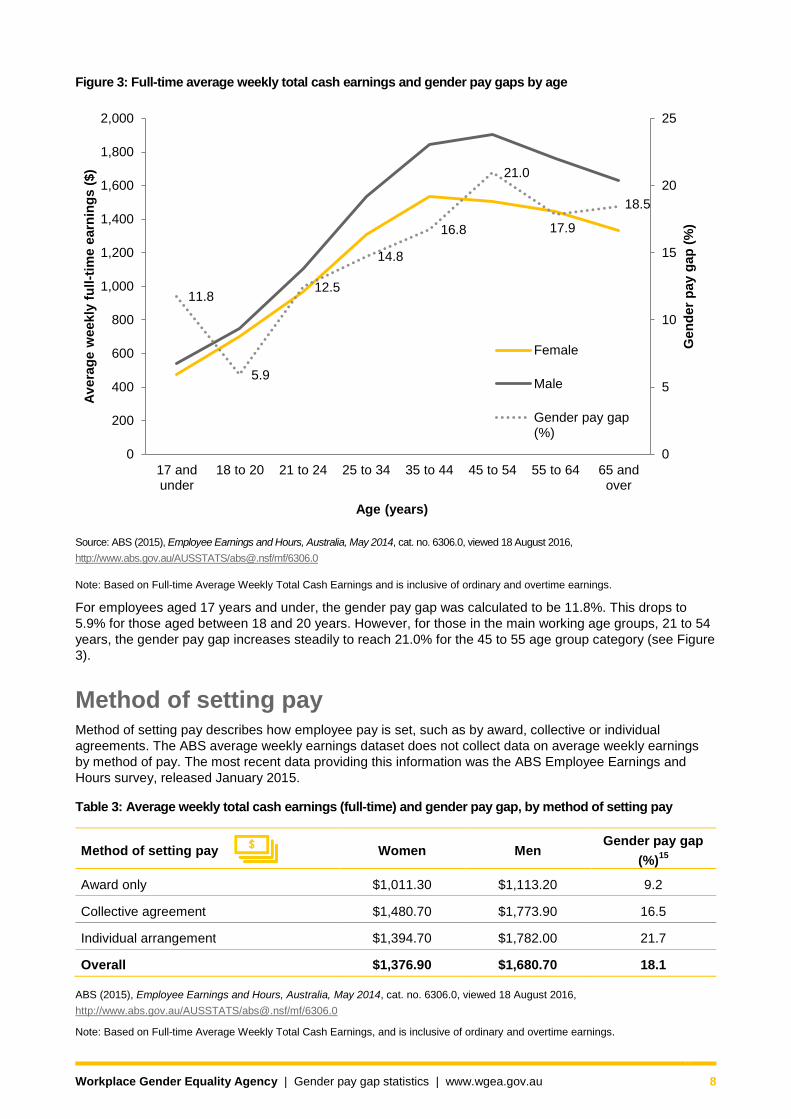
Age group Average weekly earnings by age have been taken from the ABS Employee Earnings and Hours survey,
released January 2015. The average gender pay gap between women and men working full-time generally
increases with age up to the usual age of retirement (around 65 years of age), when the gap begins to
narrow due to reduced income in retirement.
19.6
12.0
0
5
10
15
20
25
Perc
en
tag
e (
%)
Private Public
Workplace Gender Equality Agency | Gender pay gap statistics | www.wgea.gov.au 8
Figure 3: Full-time average weekly total cash earnings and gender pay gaps by age
Source: ABS (2015), Employee Earnings and Hours, Australia, May 2014, cat. no. 6306.0, viewed 18 August 2016,
http://www.abs.gov.au/AUSSTATS/[email protected]/mf/6306.0
Note: Based on Full-time Average Weekly Total Cash Earnings and is inclusive of ordinary and overtime earnings.
For employees aged 17 years and under, the gender pay gap was calculated to be 11.8%. This drops to
5.9% for those aged between 18 and 20 years. However, for those in the main working age groups, 21 to 54
years, the gender pay gap increases steadily to reach 21.0% for the 45 to 55 age group category (see Figure
3).
Method of setting pay Method of setting pay describes how employee pay is set, such as by award, collective or individual
agreements. The ABS average weekly earnings dataset does not collect data on average weekly earnings
by method of pay. The most recent data providing this information was the ABS Employee Earnings and
Hours survey, released January 2015.
Table 3: Average weekly total cash earnings (full-time) and gender pay gap, by method of setting pay
Method of setting pay Women Men Gender pay gap
(%)15
Award only $1,011.30 $1,113.20 9.2
Collective agreement $1,480.70 $1,773.90 16.5
Individual arrangement $1,394.70 $1,782.00 21.7
Overall $1,376.90 $1,680.70 18.1
ABS (2015), Employee Earnings and Hours, Australia, May 2014, cat. no. 6306.0, viewed 18 August 2016,
http://www.abs.gov.au/AUSSTATS/[email protected]/mf/6306.0
Note: Based on Full-time Average Weekly Total Cash Earnings, and is inclusive of ordinary and overtime earnings.
11.8
5.9
12.5
14.8
16.8
21.0
17.9
18.5
0
5
10
15
20
25
0
200
400
600
800
1,000
1,200
1,400
1,600
1,800
2,000
17 andunder
18 to 20 21 to 24 25 to 34 35 to 44 45 to 54 55 to 64 65 andover
Gen
der
pay g
ap
(%
)
Av
era
ge w
eekly
fu
ll-t
ime e
arn
ing
s (
$)
Age (years)
Female
Male
Gender pay gap(%)
Workplace Gender Equality Agency | Gender pay gap statistics | www.wgea.gov.au 9
Among full-time employees:
the average weekly total cash earnings for those who had their pay set by individual arrangement were
substantially higher for men than women, resulting in a gender pay gap of 21.7%
the average weekly total cash earnings for those who had their pay set by collective agreement were also
higher for men than women
the difference in full-time earnings was smaller for those whose pay was set by award only, where men
earned slightly more than women (Table 3).
This indicates that there may be a more equal distribution of pay between women and men when pay is set
by federal or state industrial authorities than when it is set by agreements made collectively between
employees and their employer or by individual agreement with the employer.
Occupation Gender pay gaps by occupation have been taken from the Agency’s data set, and are available in the WGEA
data explorer. Occupation gender pay gap results are based on the annualised total remuneration of full-time
employees who work in non-public sector organisations (with 100 or more employees) that are required to
report to the Agency.
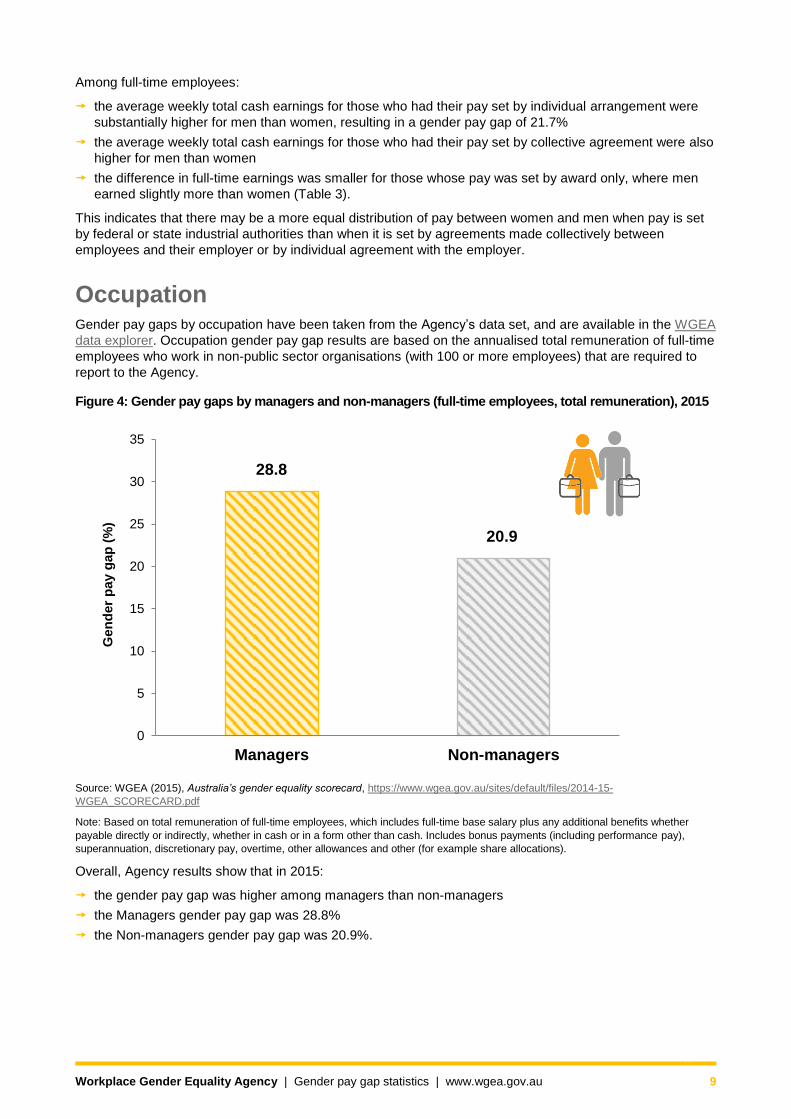
Figure 4: Gender pay gaps by managers and non-managers (full-time employees, total remuneration), 2015
Source: WGEA (2015), Australia’s gender equality scorecard, https://www.wgea.gov.au/sites/default/files/2014-15-
WGEA_SCORECARD.pdf
Note: Based on total remuneration of full-time employees, which includes full-time base salary plus any additional benefits whether
payable directly or indirectly, whether in cash or in a form other than cash. Includes bonus payments (including performance pay),
superannuation, discretionary pay, overtime, other allowances and other (for example share allocations).
Overall, Agency results show that in 2015:
the gender pay gap was higher among managers than non-managers
the Managers gender pay gap was 28.8%
the Non-managers gender pay gap was 20.9%.
28.8
20.9
0
5
10
15
20
25
30
35
Managers Non-managers
Gen
der
pa
y g
ap
(%
)
Workplace Gender Equality Agency | Gender pay gap statistics | www.wgea.gov.au 10
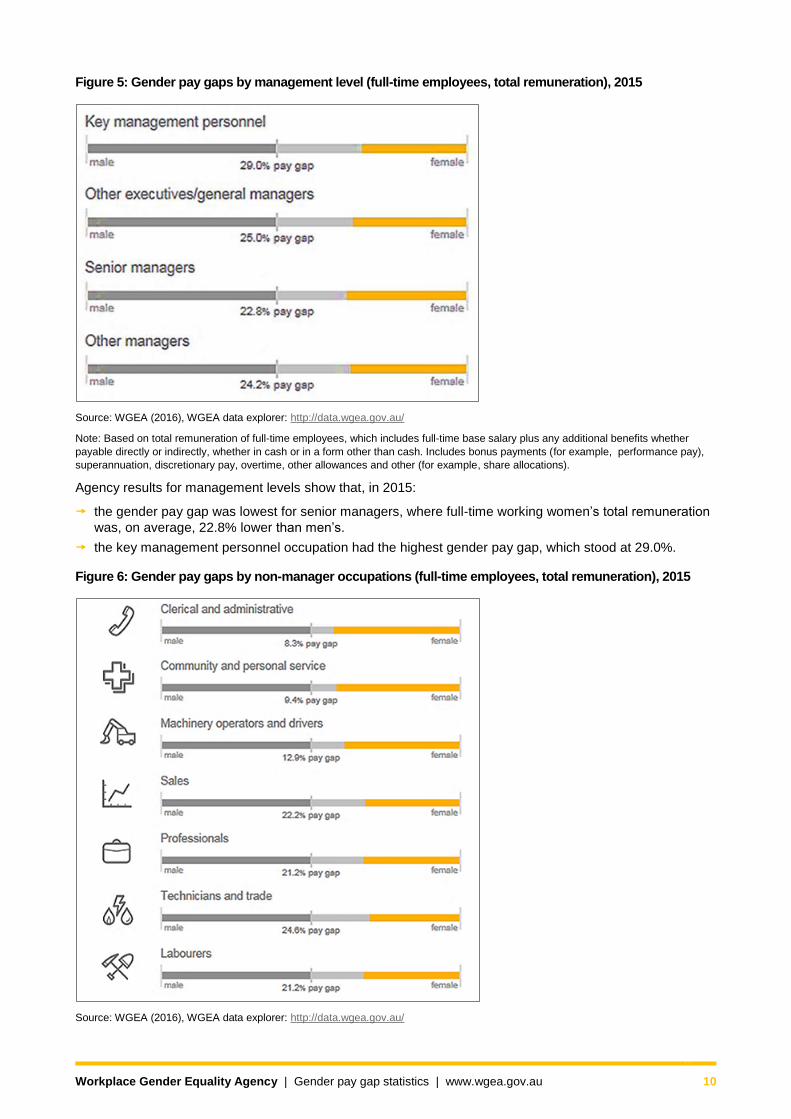
Figure 5: Gender pay gaps by management level (full-time employees, total remuneration), 2015
Source: WGEA (2016), WGEA data explorer: http://data.wgea.gov.au/
Note: Based on total remuneration of full-time employees, which includes full-time base salary plus any additional benefits whether
payable directly or indirectly, whether in cash or in a form other than cash. Includes bonus payments (for example, performance pay),
superannuation, discretionary pay, overtime, other allowances and other (for example, share allocations).
Agency results for management levels show that, in 2015:
the gender pay gap was lowest for senior managers, where full-time working women’s total remuneration
was, on average, 22.8% lower than men’s.
the key management personnel occupation had the highest gender pay gap, which stood at 29.0%.
Figure 6: Gender pay gaps by non-manager occupations (full-time employees, total remuneration), 2015
Source: WGEA (2016), WGEA data explorer: http://data.wgea.gov.au/
Workplace Gender Equality Agency | Gender pay gap statistics | www.wgea.gov.au 11
Note: Based on total remuneration of full-time employees, which includes full-time base salary plus any additional benefits whether
payable directly or indirectly, whether in cash or in a form other than cash. Includes bonus payments (for example, performance pay),
superannuation, discretionary pay, overtime, other allowances and other (for example, share allocations).
Agency results for non-manager occupations show that, in 2015:
the highest non-manager occupation gender pay gap was for Technicians and Trade, which stood at
24.6%.
the lowest non-manager occupation gender pay gap was for Clerical and Administrative, with full-time
working women’s total remuneration being 8.3% less than men’s.
the Professionals and Labourers occupations had the same gender pay gap of 21.2%.
Organisational gender pay gap analysis An organisational gender pay gap analysis compares the remuneration data for women and men to identify
gaps based on full-time equivalent annualised average salaries. It then investigates the causes of any
identified gaps to determine what needs to be done to correct them. The Agency extracts this information
from the reporting questionnaire, which includes questions relating to whether a gender pay gap analysis has
been undertaken and when it was undertaken (Question 4), and if actions were taken to address the gender
pay gap (Question 4.1).
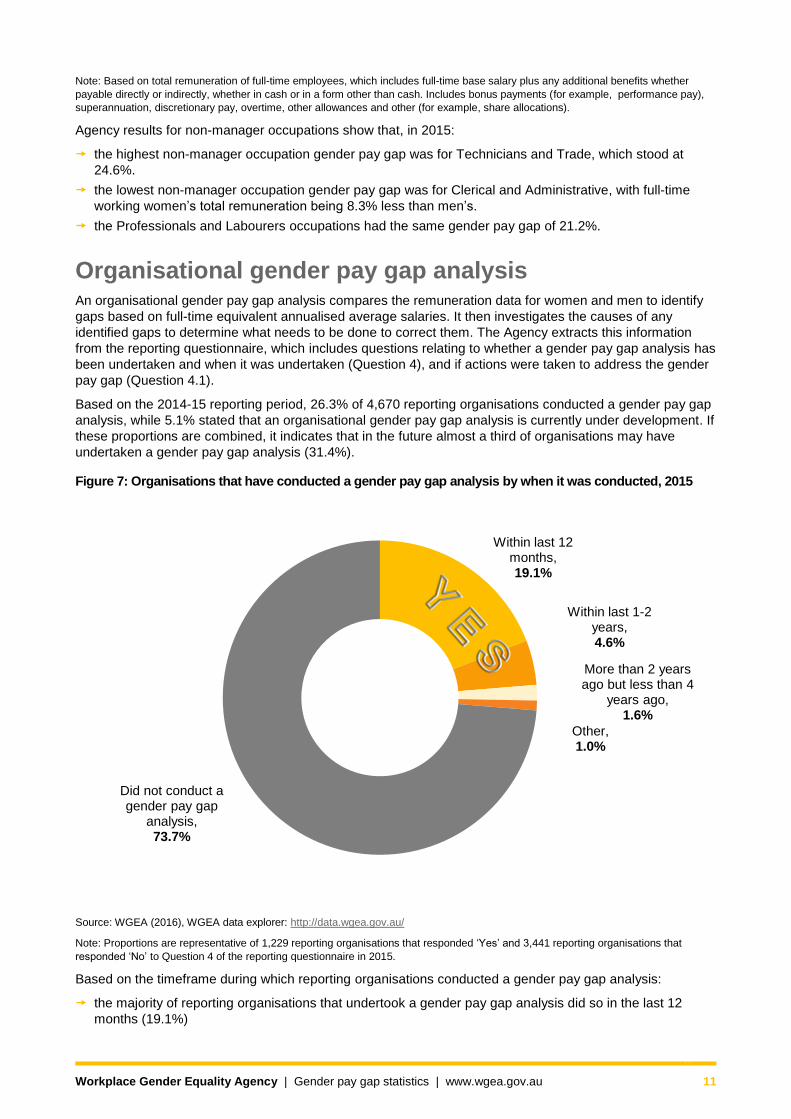
Based on the 2014-15 reporting period, 26.3% of 4,670 reporting organisations conducted a gender pay gap
analysis, while 5.1% stated that an organisational gender pay gap analysis is currently under development. If
these proportions are combined, it indicates that in the future almost a third of organisations may have
undertaken a gender pay gap analysis (31.4%).
Figure 7: Organisations that have conducted a gender pay gap analysis by when it was conducted, 2015
Source: WGEA (2016), WGEA data explorer: http://data.wgea.gov.au/
Note: Proportions are representative of 1,229 reporting organisations that responded ‘Yes’ and 3,441 reporting organisations that
responded ‘No’ to Question 4 of the reporting questionnaire in 2015.
Based on the timeframe during which reporting organisations conducted a gender pay gap analysis:
the majority of reporting organisations that undertook a gender pay gap analysis did so in the last 12
months (19.1%)
Within last 12 mo19
nths, .1%
Withiy
Mag
n last 1-2 ears, 4.6%
ore than 2 years o but less than 4
years ago, 1.6%
Other, 1.0%
Did not conduct a gender pay gap
analysis, 73.7%
Workplace Gender Equality Agency | Gender pay gap statistics | www.wgea.gov.au 12
a further 4.6% conducted a gender pay gap analysis in the past one to two years, while 1.6% conducted a
gender pay gap analysis in over two but less than four years nearly three-quarters of reporting
organisations did not conduct a gender pay gap analysis (73.7%).
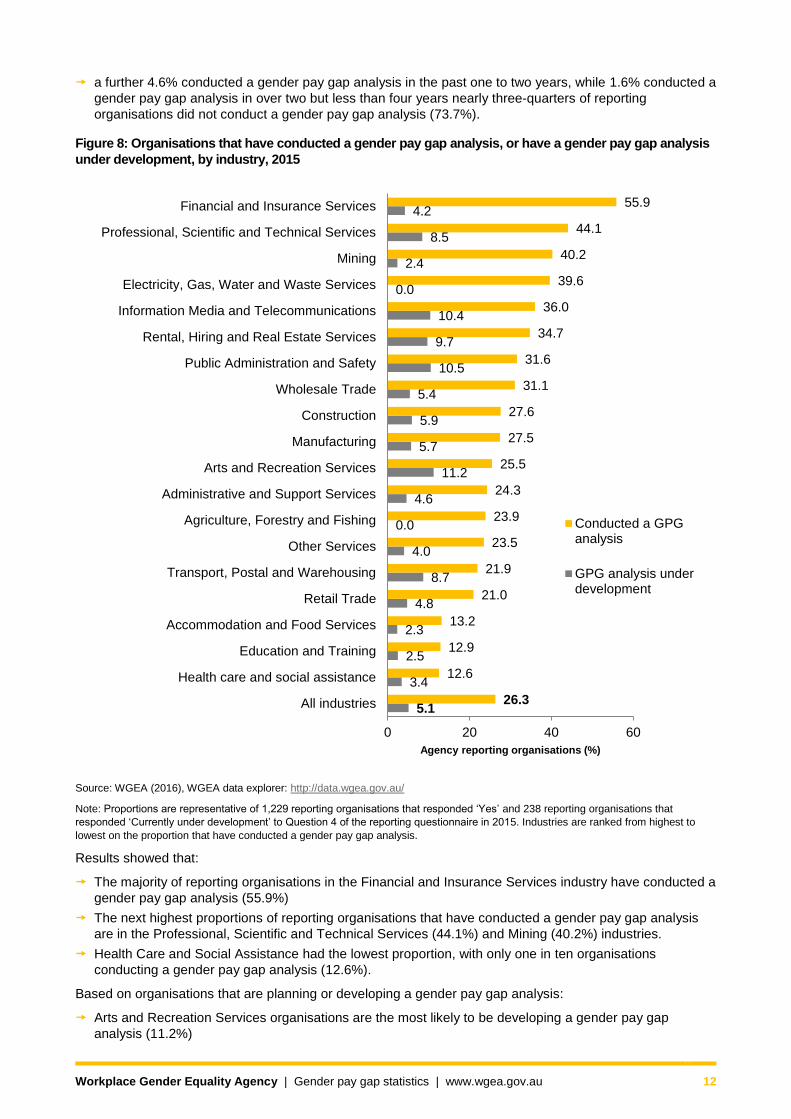
Figure 8: Organisations that have conducted a gender pay gap analysis, or have a gender pay gap analysis
under development, by industry, 2015
Source: WGEA (2016), WGEA data explorer: http://data.wgea.gov.au/
Note: Proportions are representative of 1,229 reporting organisations that responded ‘Yes’ and 238 reporting organisations that
responded ‘Currently under development’ to Question 4 of the reporting questionnaire in 2015. Industries are ranked from highest to
lowest on the proportion that have conducted a gender pay gap analysis.
Results showed that:
The majority of reporting organisations in the Financial and Insurance Services industry have conducted a
gender pay gap analysis (55.9%)
The next highest proportions of reporting organisations that have conducted a gender pay gap analysis
are in the Professional, Scientific and Technical Services (44.1%) and Mining (40.2%) industries.
Health Care and Social Assistance had the lowest proportion, with only one in ten organisations
conducting a gender pay gap analysis (12.6%).
Based on organisations that are planning or developing a gender pay gap analysis:
Arts and Recreation Services organisations are the most likely to be developing a gender pay gap
analysis (11.2%)
5.1
3.4
2.5
2.3
4.8
8.7
4.0
0.0
4.6
11.2
5.7
5.9
5.4
10.5
9.7
10.4
0.0
2.4
8.5
4.2
26.3
12.6
12.9
13.2
21.0
21.9
23.5
23.9
24.3
25.5
27.5
27.6
31.1
31.6
34.7
36.0
39.6
40.2
44.1
55.9
0 20 40 60
All industries
Health care and social assistance
Education and Training
Accommodation and Food Services
Retail Trade
Transport, Postal and Warehousing
Other Services
Agriculture, Forestry and Fishing
Administrative and Support Services
Arts and Recreation Services
Manufacturing
Construction
Wholesale Trade
Public Administration and Safety
Rental, Hiring and Real Estate Services
Information Media and Telecommunications
Electricity, Gas, Water and Waste Services
Mining
Professional, Scientific and Technical Services
Financial and Insurance Services
Agency reporting organisations (%)
Conducted a GPGanalysis
GPG analysis underdevelopment
Workplace Gender Equality Agency | Gender pay gap statistics | www.wgea.gov.au 13
organisations in the Public Administration and Safety industry (10.5%) are the second-most likely, and
those in Information Media and Telecommunications industry (10.4%) are the third-most likely employers
to be developing a gender pay gap analysis
no organisations in Agriculture, Forestry and Fishing are developing a gender pay gap analysis (Figure
5).
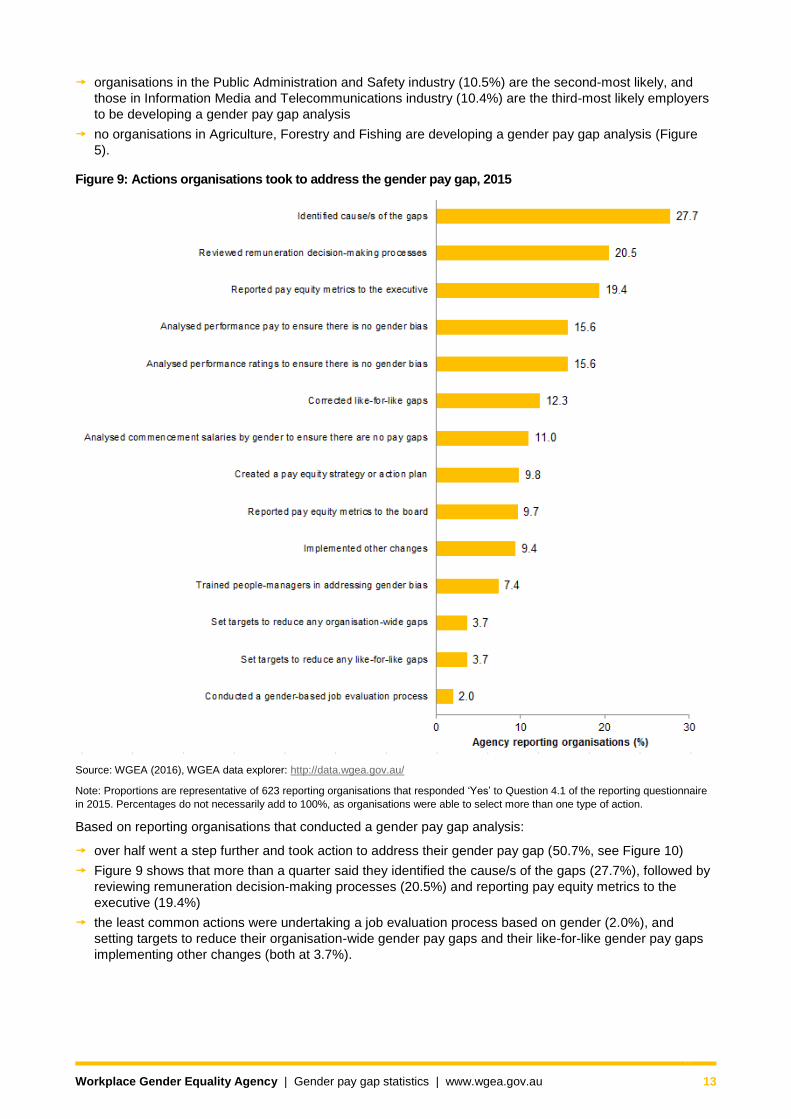
Figure 9: Actions organisations took to address the gender pay gap, 2015
Source: WGEA (2016), WGEA data explorer: http://data.wgea.gov.au/
Note: Proportions are representative of 623 reporting organisations that responded ‘Yes’ to Question 4.1 of the reporting questionnaire
in 2015. Percentages do not necessarily add to 100%, as organisations were able to select more than one type of action.
Based on reporting organisations that conducted a gender pay gap analysis:
over half went a step further and took action to address their gender pay gap (50.7%, see Figure 10)
Figure 9 shows that more than a quarter said they identified the cause/s of the gaps (27.7%), followed by
reviewing remuneration decision-making processes (20.5%) and reporting pay equity metrics to the
executive (19.4%)
the least common actions were undertaking a job evaluation process based on gender (2.0%), and
setting targets to reduce their organisation-wide gender pay gaps and their like-for-like gender pay gaps
implementing other changes (both at 3.7%).
Workplace Gender Equality Agency | Gender pay gap statistics | www.wgea.gov.au 14
To find out more about the different data sets that can be used to understand gender pay gaps in the Australian workplace and understand what each of these measures show, please refer to the WGEA’s Differences between
the full-time gender pay gap infographic at the end of this fact sheet.
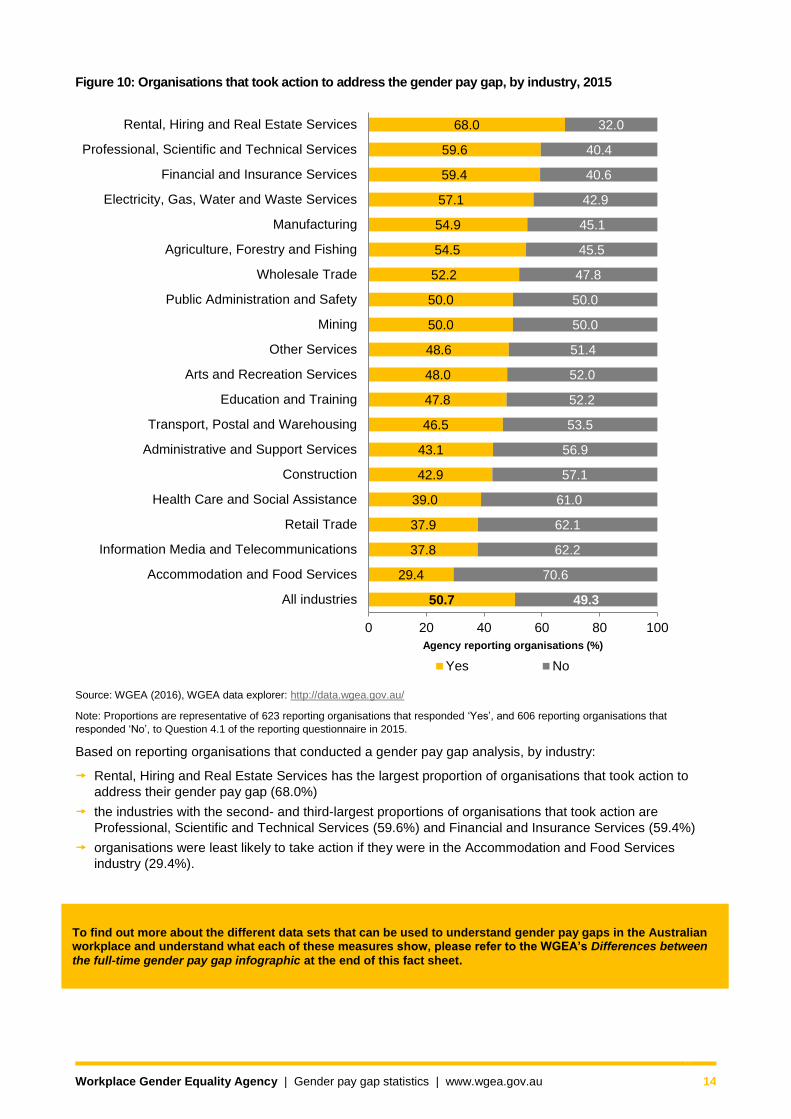
Figure 10: Organisations that took action to address the gender pay gap, by industry, 2015
Source: WGEA (2016), WGEA data explorer: http://data.wgea.gov.au/
Note: Proportions are representative of 623 reporting organisations that responded ‘Yes’, and 606 reporting organisations that
responded ‘No’, to Question 4.1 of the reporting questionnaire in 2015.
Based on reporting organisations that conducted a gender pay gap analysis, by industry:
Rental, Hiring and Real Estate Services has the largest proportion of organisations that took action to
address their gender pay gap (68.0%)
the industries with the second- and third-largest proportions of organisations that took action are
Professional, Scientific and Technical Services (59.6%) and Financial and Insurance Services (59.4%)
organisations were least likely to take action if they were in the Accommodation and Food Services
industry (29.4%).
50.7
29.4
37.8
37.9
39.0
42.9
43.1
46.5
47.8
48.0
48.6
50.0
50.0
52.2
54.5
54.9
57.1
59.4
59.6
68.0
49.3
70.6
62.2
62.1
61.0
57.1
56.9
53.5
52.2
52.0
51.4
50.0
50.0
47.8
45.5
45.1
42.9
40.6
40.4
32.0
0 20 40 60 80 100
All industries
Accommodation and Food Services
Information Media and Telecommunications
Retail Trade
Health Care and Social Assistance
Construction
Administrative and Support Services
Transport, Postal and Warehousing
Education and Training
Arts and Recreation Services
Other Services
Mining
Public Administration and Safety
Wholesale Trade
Agriculture, Forestry and Fishing
Manufacturing
Electricity, Gas, Water and Waste Services
Financial and Insurance Services
Professional, Scientific and Technical Services
Rental, Hiring and Real Estate Services
Agency reporting organisations (%)
Yes No
Workplace Gender Equality Agency | Gender pay gap statistics | www.wgea.gov.au 15
1 ABS (2016), Average Weekly Earnings, May 2016, cat. no. 6302.0, viewed 18 August 2016,
http://www.abs.gov.au/ausstats/[email protected]/mf/6302.0
2 Ibid.
3 ABS (2015), Employee Earnings and Hours, Australia, May 2014, cat. no. 6306.0, viewed 18 August 2016,
http://www.abs.gov.au/AUSSTATS/[email protected]/mf/6306.0
4 WGEA (2016), WGEA data explorer: http://data.wgea.gov.au/
5 Since 2001, the Agency has conducted annual voluntary telephone surveys of reporting organisations. From 2014, the new reporting
requirements of the Workplace Gender Equality Act 2012 came into effect. As part of the new reporting regime, reporting organisations
are required to complete a workplace profile and an online reporting questionnaire. The questionnaire includes questions relating to
whether a gender pay gap analysis has been undertaken and when it was undertaken (Question 4), and if actions were taken to
address the gender pay gap (Question 4.1).
6 Unless otherwise stated, all measures of the gender pay gap are expressed as a percentage (%) based on average weekly ordinary
time earnings for full-time employees (trend data), with changes over time provided as the percentage point (pp) difference. The release
frequency changed from quarterly to bi-annual in November 2012.
7 The release frequency changed from quarterly to bi-annual in November 2012.
8 Government policies such as Baby Bonus (Maternity payment) and Work Choices.
9 A minus sign indicates that the gender pay gap has decreased from the previous period.
10 ABS (2016), Labour Force, Australia, Detailed, Quarterly, May 2016, cat. no. 6291.0.55.003, viewed 18 August 2016,
http://www.abs.gov.au/ausstats/[email protected]/mf/6291.0.55.003
11 A minus sign indicates that the gender pay gap has decreased from the previous period.
12 ABS (2015), Employee Earnings and Hours, Australia, May 2014, cat. no. 6306.0, viewed 18 August 2016,
http://www.abs.gov.au/AUSSTATS/[email protected]/mf/6306.0
13 Ibid.
14 Baron J.D. & Cobb-Clark D.A. (2010), Occupational Segregation and the Gender Wage Gap in Private- and Public-Sector
Employment: A Distributional Analysis. The Economic Society of Australia, The Economic Record, Vol. 86, No. 273, June 2010, pp 337-
246.
15 A minus sign indicates that the average weekly earnings for women is greater than that for men.
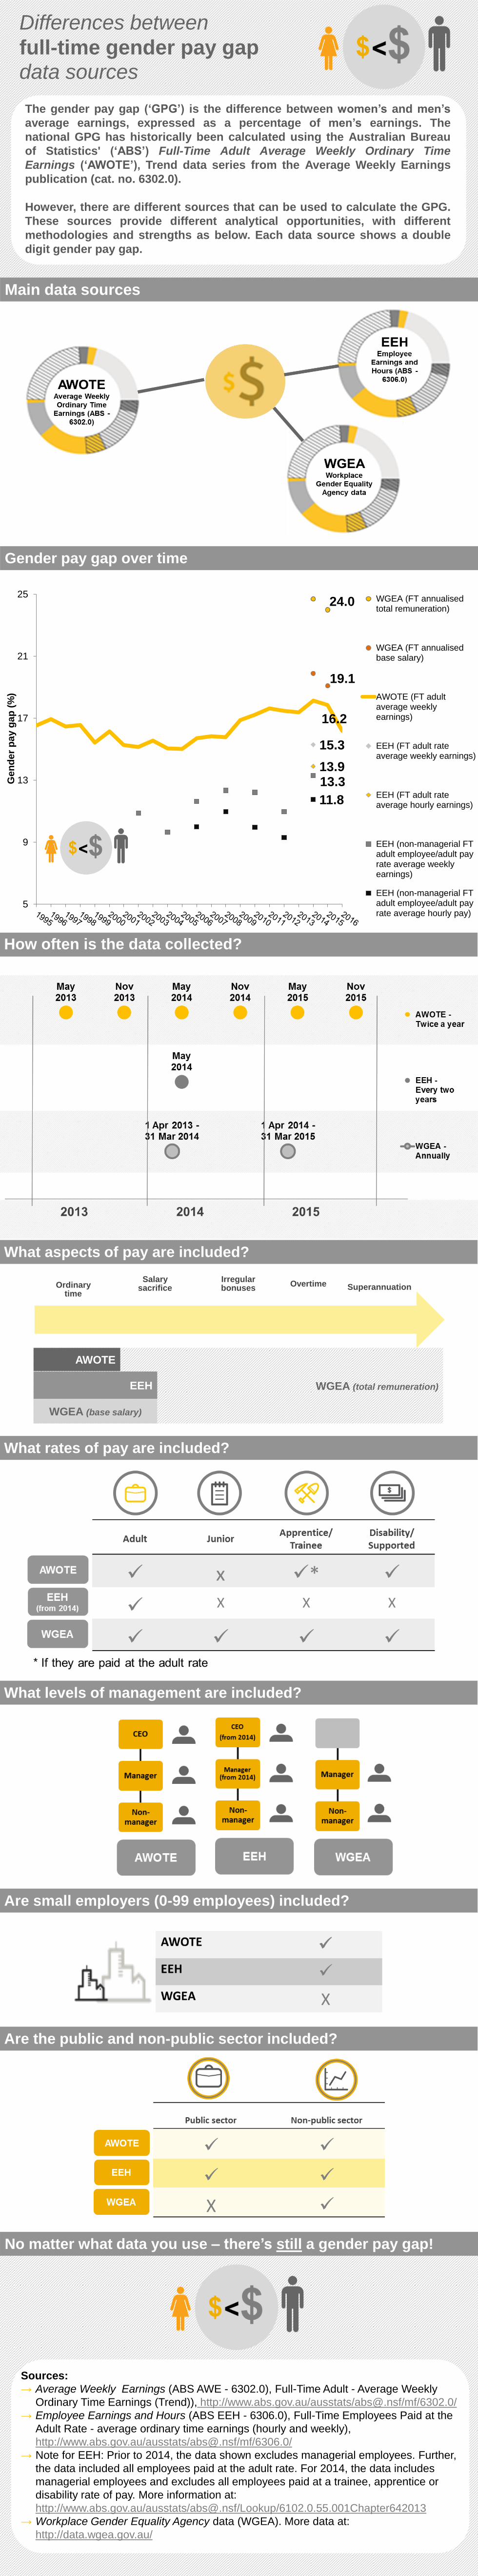
The gender pay gap (‘GPG’) is the difference between women’s and men’s
average earnings, expressed as a percentage of men’s earnings. The
national GPG has historically been calculated using the Australian Bureau
of Statistics' (‘ABS’) Full-Time Adult Average Weekly Ordinary Time
Earnings (‘AWOTE’), Trend data series from the Average Weekly Earnings
publication (cat. no. 6302.0).
However, there are different sources that can be used to calculate the GPG.
These sources provide different analytical opportunities, with different
methodologies and strengths as below. Each data source shows a double
digit gender pay gap.
Main data sources
Gender pay gap over time
Sources:
→ Average Weekly Earnings (ABS AWE - 6302.0), Full-Time Adult - Average Weekly
Ordinary Time Earnings (Trend)), http://www.abs.gov.au/ausstats/[email protected]/mf/6302.0/
→ Employee Earnings and Hours (ABS EEH - 6306.0), Full-Time Employees Paid at the
Adult Rate - average ordinary time earnings (hourly and weekly),
http://www.abs.gov.au/ausstats/[email protected]/mf/6306.0/
→ Note for EEH: Prior to 2014, the data shown excludes managerial employees. Further,
the data included all employees paid at the adult rate. For 2014, the data includes
managerial employees and excludes all employees paid at a trainee, apprentice or
disability rate of pay. More information at:
http://www.abs.gov.au/ausstats/[email protected]/Lookup/6102.0.55.001Chapter642013
→ Workplace Gender Equality Agency data (WGEA). More data at:
http://data.wgea.gov.au/
WGEA (total remuner
Ordinary time
Salary sacrifice
Overtime Superannuation Irregular bonuses
EEH
AWOTE
ation)
WGEA (base salary)
What aspects of pay are included?
How often is the data collected?
What levels of management are included?
What rates of pay are included?
Are small employers (0-99 employees) included?
Are the public and non-public sector included?
Differences between
full-time gender pay gap data sources
No matter what data you use – there’s still a gender pay gap!
24.0
19.1
16.2
15.3
13.9 13.3
11.8
5
9
13
17
21
25
Ge
nd
er
pa
y g
ap
(%
)
WGEA (FT annualisedtotal remuneration)
WGEA (FT annualisedbase salary)
AWOTE (FT adultaverage weeklyearnings)
EEH (FT adult rateaverage weekly earnings)
EEH (FT adult rateaverage hourly earnings)
EEH (non-managerial FTadult employee/adult payrate average weeklyearnings)
EEH (non-managerial FTadult employee/adult payrate average hourly pay)