Embed Size (px)
Citation preview
DI
SC
US
SI
ON
P
AP
ER
S
ER
IE
S
Forschungsinstitut zur Zukunft der ArbeitInstitute for the Study of Labor
Gender Earnings Gaps in the World
IZA DP No. 5736
May 2011
Hugo ÑopoNancy DazaJohanna Ramos
Gender Earnings Gaps in the World
Hugo Ñopo Inter-American Development Bank
and IZA
Nancy Daza National Planning Department, Colombia
Johanna Ramos
National Planning Department, Colombia
Discussion Paper No. 5736 May 2011
IZA
P.O. Box 7240 53072 Bonn
Germany
Phone: +49-228-3894-0 Fax: +49-228-3894-180
E-mail: [email protected]
Any opinions expressed here are those of the author(s) and not those of IZA. Research published in this series may include views on policy, but the institute itself takes no institutional policy positions. The Institute for the Study of Labor (IZA) in Bonn is a local and virtual international research center and a place of communication between science, politics and business. IZA is an independent nonprofit organization supported by Deutsche Post Foundation. The center is associated with the University of Bonn and offers a stimulating research environment through its international network, workshops and conferences, data service, project support, research visits and doctoral program. IZA engages in (i) original and internationally competitive research in all fields of labor economics, (ii) development of policy concepts, and (iii) dissemination of research results and concepts to the interested public. IZA Discussion Papers often represent preliminary work and are circulated to encourage discussion. Citation of such a paper should account for its provisional character. A revised version may be available directly from the author.
IZA Discussion Paper No. 5736 May 2011
ABSTRACT
Gender Earnings Gaps in the World* This paper documents gender disparities in labor earnings for sixty-four countries around the world. Disparities are partially attributed to gender differences in observable socio-demographic and job characteristics. These characteristics are used to match males and females such that gender earnings disparities are computed only among individuals with the same characteristics, as in Ñopo (2008). After comparing males and females with the same characteristics we found that the earnings gap falls within a range between 8% and 48% of average females’ earnings, being more pronounced in South Asia and Sub-Saharan Africa. The unexplained earnings gaps are more pronounced among part-time workers and those with low education. JEL Classification: C14, D31, J16, O57 Keywords: gender, wage gaps, matching Corresponding author: Hugo Ñopo Inter-American Development Bank Colombia Country Office Carrera 7ma 71‐21, Torre B, Piso 19 Bogotá Colombia E-mail: [email protected]
* This paper was prepared for the World Development Report 2012: Gender Equality and Development. Daza and Ramos received financial support from the World Bank for this purpose. The views expressed are those of the authors and do not necessarily reflect the views of neither the World Bank nor the Inter-American Development Bank. The comments of Felipe Balcazar are especially acknowledged.
1. Introduction and Literature Review
The literature on gender disparities has been abundant. Several pieces have
examined not only the magnitude but also the reasons behind earnings gaps
between men and women, its persistence, evolution, and its impact on economic
welfare and development. Among the aspects that have been usually attributed to
explain the differences are the personal and job characteristics of women (age,
education, experience, occupation, working time, job status, type of contract), the
labor market structure (occupational segregation by gender, level of formality),
and institutional, cultural and social norms and traditions. The literature varies
not only in terms of methodologies and results, but also in the policy
recommendations aimed to improve the opportunities and economic participation
of women. This paper pretends to contribute to this literature providing a
comprehensive view of earnings disparities in the world, comparing different
regions with the same methodological approach and attempting to identify
commonalities across the globe.
We made a descriptive analysis of the data set by regions regarding gender
socio-demographic and labor characteristics, then, we use Ñopo (2008) matching
procedure to compute and analyze the wage gap, attributing disparities to these
characteristics. But first, in this section, we briefly summarize the literature by
world’s regions highlighting only some relevant pieces for our endeavor. We also
provide an annex that contains a more comprehensive table (but by no means
exhaustive) of the literature reviewed with summaries for each reviewed paper.
Globally, one of the first patterns that arises is that economic development or
market liberalization does not mean narrower gender differences. Different studies
have shown that there is no relationship between economic growth and the
narrowing of earnings gaps against women (Hertz et al., 2008; Blau and Kahn,
2001; Tzannatos, 1999). This result has been robust to different methodologies and
data sets. Weichselbaumer et al. (2007) report that the unexplained component of
the gender gap, estimated with Oaxaca-Blinder decompositions, has been
negatively related with further liberalization of markets.
Other reasons that have been found to be linked to gender earnings disparities
are: sectorial segregation to lower wage sectors against women (Tzannatos, 1999),
lower female net supply and wage structure (Blau and Kahn, 2001), labor market
liberalization and institutional frame in each country (Weichselbaumer et al., 2007;
Blau and Kahn, 2001; Cornish, 2007 and Tzanatos 1999), among others.
The magnitude and heterogeneity of the gender earnings gap notoriously varies
across studies. Blau et al. (2001) report that the gap is as low as 14.4% for Slovenia
and as high as 85% for Japan. Along with Japan, Switzerland, United States, Great
Britain and Russia also show high gender earnings disparities in this study. On the
lowest extreme of gender gaps, along with Slovenia, many other Eastern European
countries can be found. Fetherolf (2001) reports gender earnings disparities shows
on a range that goes from 53.5% (Rep. of Korea) to 106% (Swaziland), with all other
countries varying in a range between 65 and 92%. The countries in the OECD did
not have a significant narrower wage gap than other countries with similar
development levels. Hausmann et al. (2010) report Oceania as the region with the
lowest gender earnings gap and North America, the United Kingdom and Asia on
the other extreme with the highest gaps. Some brief accounts of the literature by
region are summarized as follows.
Sub-Saharan Africa: Different endowments, different opportunities. Labor force
education, work allocation with gender selection, and different unemployment
rates by gender seem to be the key drivers of gender earnings disparities in this
region. For instance, in Ethiopia, education accounts for around one-fifth of pay
differences and it works as a passport to enter into the public sector, a sector that
offers better wages and labor conditions (Kolev and Suarez, 2010; Suarez, 2005).
For a more comprehensive set of countries, it has been found an important role for
education on reducing wage differences (Kolev and Sirven, 2010). It has been also
reported that women tend to work more hours than men but they tend to be found
more often among unpaid family workers and domestic workers (Suarez, 2005;
Wodon and Ying, 2010). Unemployment is more prevalent among women but the
relationship between education and unemployment has not been conclusive
(Nordman et al., 2010). All in all, almost one-half of observed gender earnings
disparities fail to be explained by observable characteristics.
Europe and Central Asia: transition economies with segregation. The economic
and political transition of last decades has received special attention in the ECA
region. Most studies agree on the relative improvement of females’ wages in most
countries of the region (Brainerd, 2000). Increased wage inequality in Eastern
Europe have worked towards depressing female relative wages, but these losses
have been more than offset by gains in rewards to observed skills and by a decline
in the unobservable component of the earnings gap. Still, female segregation into
low-wage occupations emerges as the main contributor to the gender pay gap
(Simon). Along similar lines, the public-private divide seems to play an important
role as well. When controlling for observed characteristics and sample selection,
public administration wages are higher than private sector wages in the case of
men, except at the university level where the wages are equal. State-owned
enterprises’ wages are higher than those in the private sector. Further, while wages
of men and women are at parity in the public administration sector, there is a large
gender wage-gap in the private sector in favor of men (Tansel, 2004)
East Asia and the Pacific: The impact of the economic and political reforms. It
has been documented that the economic liberalization policies of 1986 did not have
an important effect on reducing the gender wage gap. For the last decades there is
no clear agreement on the tendency that the gender earnings gaps have followed.
The overall difference shave narrowed but the unexplained component of the gap,
overall, has not (Liu, 2001, 2004; Son, 2007). The results seem to show that it has
reduced in some percentiles of the earnings distribution (Pham and Reilly, 2006).
The reduction of the gap, when observed, has been mainly due to a reduction on
observed gender differences in characteristics. However, the unexplained
component of the earnings gap seems to be explaining most of the observed gaps.
Education also plays an important role in explaining wage differentials in this
region. In Indonesia it has been documented that earnings disparities by gender
shows an inverted U profile with respect to education (Pirmana, 2006). The
evidence for Mongolia shows that early career wages are not different between
genders. Despite this, on later stages of their careers women earn less than males,
but higher educated women partially overcome such gap (Pastore, 2010).
Western Europe: Occupational and industry segregation. Part of the literature
shows that wage differentials are mainly explained by the female segregation into
low-wage jobs (Daly et al., 2006), but it has also been documented the existence of
significant inter-industry wage differentials in all countries for both sexes (Gannon
et al., 2006). Other studies support the idea that gender pay gaps are typically
bigger at the top of the wage distribution and that the gender pay gap differs
significantly across the public and private sector wage distribution of each country
(Arulampalam et al., 2004).
This paper presents a comprehensive view of gender earnings gaps in the
world, simultaneously exploring many of the issues highlighted in this brief
literature review. This will be done, however, with the advantage of exploring
them from a comparative perspective, applying the same methods for all data
across the world. In order to perform such world comparison, the data from
different sources (national household surveys) is harmonized first, making them
comparable. This is shown in the next section. After that, the main section of this
paper is devoted to the comparison of unexplained gender earnings gaps for
different world regions. Next, an attempt of linking unexplained gender earnings
gaps to some political and social world indicators is made and finally the paper
closes with some brief concluding remarks.
2. The Data
This exercise of gender earnings gaps decompositions has been performed for 64
countries. The data sources have been any sort of nationally representative
household survey available with information on labor earnings and observable
characteristics of the individuals and their jobs1. The countries have been grouped
into regions: East Asian and Pacific (EAP), Europe and Central Asia (ECA), Middle
East and North Africa (MENA), South Asia (SA), Western Europe and Sub-Saharan
Africa (SSA). Note that this paper does not include the Latin America and the
Caribbean (LAC) regions2. The data from all countries was pooled restricting the
analysis to working individuals between 18 and 65 years old, reporting positive
earnings at their main activity and with no missing information on their
demographic characteristics.
The demographic characteristics considered for the analysis are: age, region
(urban/rural), education (measured in levels), marital status, and presence of
children (younger than 12 years old) at the household, presence of elderly (older)
than 65 years old at the household and presence of other household members who
generate labor income. On top of these demographics, information on job
characteristics has also been used: hours of work per week, employment status,
occupation, economic sector and formality (social security coverage). Labor hourly
earnings have been expressed in constant 2008 dollars using PPP-corrected
exchange rates and GDP deflators. All labor characteristics considered in the
analysis, including earnings, have been considered only for the main occupation.
The expansion factors from each survey have been used such that when pooling all
data the number of expanded observations per country is proportional to their
corresponding population sizes.
Not all the surveys have the same individuals’ information. Hence, the
estimations have been carried out for two groups of countries based on data
availability. The first group, the full set of countries, uses formality as control
variable. This comprises 21 countries from SSA, MENA, ECA and EAP regions.
The second group allows controlling for economic sector; this group comprises 14
1 For more details about the harmonization of the data sets, see Montenegro and Hirn (2009).
2 The gender earnings gaps decomposition for these countries can be found in two companion papers: Atal, Ñopo and
Winder (2009) and Hoyos and Ñopo (2010).
countries from SA and Western Europe regions3. The whole countries in the
analyses allow the inclusion of the hours of work per week and type of
employment and occupation, variables.
Table 1 displays the list of available countries on each group classified by
region, including the number of available observations (that is, those that remain
after dropping observations with missing values, zero labor income, or those out of
the range 18 to 65 years old) after sequentially adding hours of work per week,
type of employment, occupations, economics sector and formality into the analysis.
3 These regions are controlled for economic sector because for the first region all the individuals are informal (that is,
they are not covered by social security) and in the second region all the individuals are formal (covered by social security), in this way social security is not a proper control for informality.
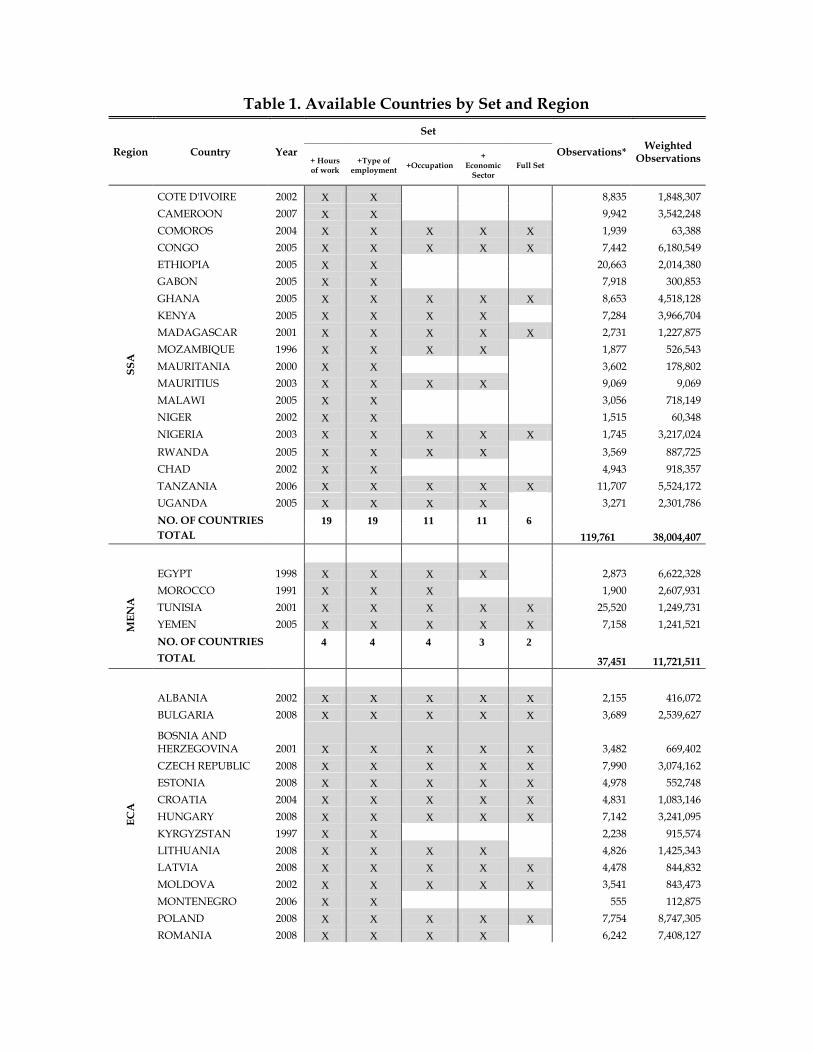
Table 1. Available Countries by Set and Region
Region Country Year
Set
Observations* Weighted
Observations + Hours of work
+Type of employment
+Occupation +
Economic Sector
Full Set
SS
A
COTE D'IVOIRE 2002 X X 8,835 1,848,307
CAMEROON 2007 X X 9,942 3,542,248
COMOROS 2004 X X X X X 1,939 63,388
CONGO 2005 X X X X X 7,442 6,180,549
ETHIOPIA 2005 X X 20,663 2,014,380
GABON 2005 X X 7,918 300,853
GHANA 2005 X X X X X 8,653 4,518,128
KENYA 2005 X X X X 7,284 3,966,704
MADAGASCAR 2001 X X X X X 2,731 1,227,875
MOZAMBIQUE 1996 X X X X 1,877 526,543
MAURITANIA 2000 X X 3,602 178,802
MAURITIUS 2003 X X X X 9,069 9,069
MALAWI 2005 X X 3,056 718,149
NIGER 2002 X X 1,515 60,348
NIGERIA 2003 X X X X X 1,745 3,217,024
RWANDA 2005 X X X X 3,569 887,725
CHAD 2002 X X 4,943 918,357
TANZANIA 2006 X X X X X 11,707 5,524,172
UGANDA 2005 X X X X 3,271 2,301,786
NO. OF COUNTRIES
19 19 11 11 6
TOTAL
119,761 38,004,407
ME
NA
EGYPT 1998 X X X X 2,873 6,622,328
MOROCCO 1991 X X X 1,900 2,607,931
TUNISIA 2001 X X X X X 25,520 1,249,731
YEMEN 2005 X X X X X 7,158 1,241,521
NO. OF COUNTRIES
4 4 4 3 2
TOTAL
37,451 11,721,511
EC
A
ALBANIA 2002 X X X X X 2,155 416,072
BULGARIA 2008 X X X X X 3,689 2,539,627
BOSNIA AND HERZEGOVINA 2001 X X X X X 3,482 669,402
CZECH REPUBLIC 2008 X X X X X 7,990 3,074,162
ESTONIA 2008 X X X X X 4,978 552,748
CROATIA 2004 X X X X X 4,831 1,083,146
HUNGARY 2008 X X X X X 7,142 3,241,095
KYRGYZSTAN 1997 X X 2,238 915,574
LITHUANIA 2008 X X X X 4,826 1,425,343
LATVIA 2008 X X X X X 4,478 844,832
MOLDOVA 2002 X X X X X 3,541 843,473
MONTENEGRO 2006 X X 555 112,875
POLAND 2008 X X X X X 7,754 8,747,305
ROMANIA 2008 X X X X 6,242 7,408,127

RUSIA 2003 X X X X 28,219 36,900,000
SLOVAKIA 2008 X X X X X 6,480 2,120,510
TAJIKISTAN 2003 X X X X X 4,664 1,202,027
TURKEY 2005 X X 70,785 70,785
NO. OF COUNTRIES
18 18 15 15 12
TOTAL
174,049 72,167,103
SA
MALDIVES 2004 X 1,427 25,808
NEPAL 2003 X X X X
442 537,722
NO. OF COUNTRIES
2 1 1 1
TOTAL
1,869 563,530
EA
P
MICRONESIA 2000 X X 12,330 12,330
INDONESIA 2002 X X 104,811 28,200,000
CAMBODIA 2004 X X X X 7,466 1,238,972
MONGOLIA 2002 X X X X X 2,631 403,883
VIETNAM 2002 X X X X 24,502 14,800,000
NO. OF COUNTRIES
5 5 3 3 1
TOTAL
151,740 44,655,185
WE
ST
ER
N E
UR
OP
E
AUSTRIA 2008 X X X X
5,243 3,289,700
BELGIUM 2008 X X X X
5,732 4,031,928
CYPRUS 2008 X X X X
4,091 350,609
GERMANY 2008 X X X X
11,324 33,800,000
DENMARK 2008 X X X
11,324 33,800,000
SPAIN 2008 X X X X
13,025 18,000,000
FINLAND 2008 X X X X
11,913 2,240,843
GREECE 2008 X X X X
5,820 4,113,921
IRELAND 2008 X X X X
4,124 1,671,177
ICELAND 2008 X X X X
4,079 143,664
ITALY 2008 X X X X
18,605 21,700,000
LUXEMBOURG 2008 X X X X
4,310 198,882
NORWAY 2008 X X X
6,350 2,077,142
PORTUGAL 2008 X X X X
3,966 4,012,968
SWEDEN 2008 X X X
8,443 4,074,758
UNITED KINGDOM 2008 X X X X
7,585 23,100,000
NO. OF COUNTRIES
16 16 16 13
TOTAL
125,934 156,605,592
Source: Authors’ calculations using Household Surveys (World Bank)
Tables 2a and 2b show descriptive statistics by region. Table 2a presents the
descriptive statistics regarding the demographic set of variables; Table 2b presents
the job-related variables. In most cases the descriptive statistics are shown for the
full set of variables. The descriptive statistics obtained for the more restricted sets
of variables (that is, those including more comprehensive sets of countries) depict
similar results.4
Regarding the gender composition of the labor force it is possible to distinguish
three groups of regions. First, MENA and SA show more than seventy percent of
males on their active labor force; second, SSA have around sixty percent of males;
third, ECA and Western Europe have only slightly more males than females; and
fourth EAP show slightly less males than females on their labor force. Regarding
the urban/rural split and gender composition MENA highlights. While almost half
of working males in this region are located in urban areas, it is nine out of ten
females who do so. In all other regions of the world the urban/rural split does not
differ much between males and females.
Educational differences are also interesting to highlight. SSA, MENA and SA
show a high fraction of females with no education or primary incomplete,
although in MENA the corresponding percentage of males is even higher. On the
other extreme of the educational distribution, in all regions but SA the percentage
of females achieving post secondary education surpasses that of males.
The gender differences in marital status and household composition are also
salient. In all regions the proportion of married males surpasses that of females. In
SSA and SA the proportion of widowed females is around 10%. In SSA, ECA and
Western Europe it is interesting to highlight that also around 10% of females are
divorced. The proportion of never married among working women in MENA is
interestingly higher than the corresponding proportion for males. ECA highlights
as the region of the world with the lowest presence of children in the workers’
households (such indicator cannot be computed for Western Europe). SSA in turn
highlights as the region of the world with the highest presence on elderly in the
workers’ households, slightly higher for males than for females. In all regions of
the world the proportion of females living with another labor-income-generator at
home is higher than that of males.
The job-related differences by gender, depicted in Table 2b for all regions under
analysis, are also salient. Part-time work (defined in this paper as working 20
hours or less per week) is more prevalent among females than males across the
globe, but this is especially the case in Western Europe. Also, SSA and SA highlight
as having a high proportion of males doing part-time work.
Self-employment is prevalent in SSA both for males and females, but especially
for the latter (although it is important to note that this is not possible to identify in
4 Using Kolmogorov-Smirnov tests we conclude at the 90% confidence that the distributions of characteristics do not
differ across the sets of variables, for both males and females. That is, restricting the dataset due to data availability does not bias the sample.
MENA and SA). Regarding occupations and economic sectors, all regions show
some degree of segregation by gender but it is ECA the region that shows it the
highest occupational segregation. In this region ―Professionals and technicians‖
and ―Service workers‖ are clearly segments with higher female prevalence;
contrasting ―Administrative personnel and intermediary level‖ and ―Machine
operators‖ which are male-dominated occupations. EAP and Western Europe
show the lowest fraction of the labor force working on elementary occupations.
Regarding formality, Sub-Saharan Africa show a higher fraction of formal working
males than formal working females but in MENA, ECA and EAP the situation is
reversed (in SA and Western Europe it is not possible to measure formality).
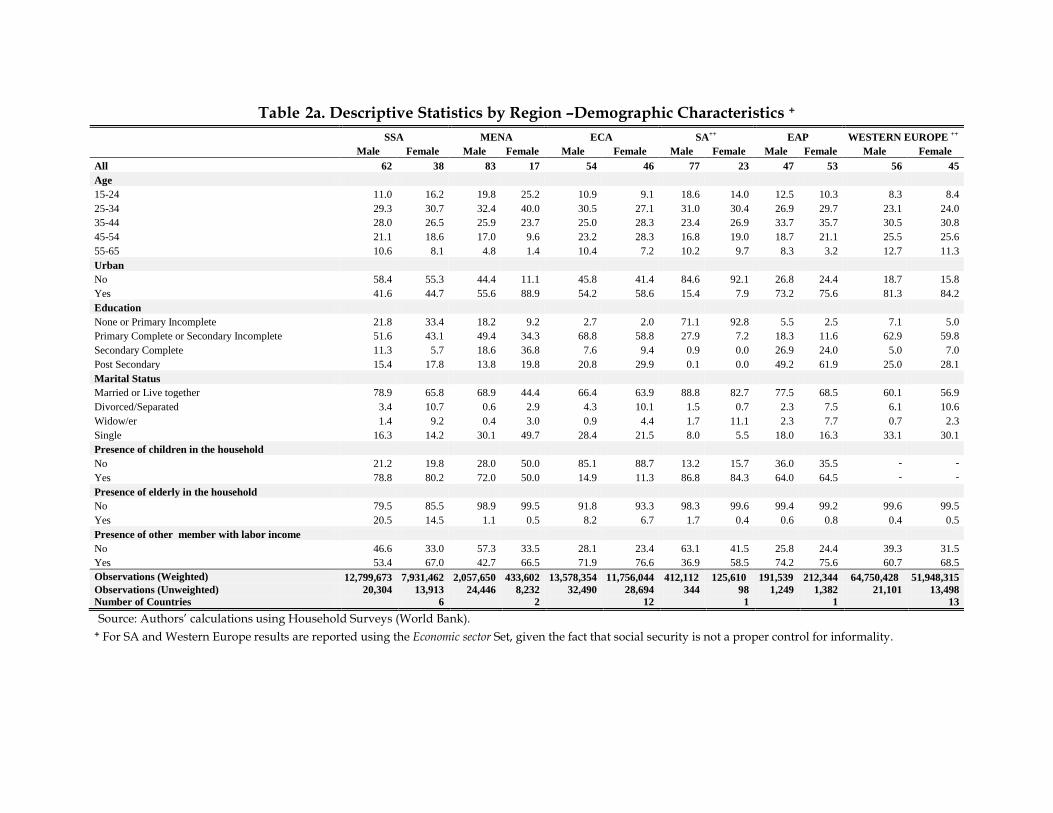
Table 2a. Descriptive Statistics by Region –Demographic Characteristics +
SSA MENA ECA SA++ EAP WESTERN EUROPE ++
Male Female Male Female Male Female Male Female Male Female Male Female
All 62 38 83 17 54 46 77 23 47 53 56 45
Age
15-24 11.0 16.2 19.8 25.2 10.9 9.1 18.6 14.0 12.5 10.3 8.3 8.4
25-34 29.3 30.7 32.4 40.0 30.5 27.1 31.0 30.4 26.9 29.7 23.1 24.0
35-44 28.0 26.5 25.9 23.7 25.0 28.3 23.4 26.9 33.7 35.7 30.5 30.8
45-54 21.1 18.6 17.0 9.6 23.2 28.3 16.8 19.0 18.7 21.1 25.5 25.6
55-65 10.6 8.1 4.8 1.4 10.4 7.2 10.2 9.7 8.3 3.2 12.7 11.3
Urban
No 58.4 55.3 44.4 11.1 45.8 41.4 84.6 92.1 26.8 24.4 18.7 15.8
Yes 41.6 44.7 55.6 88.9 54.2 58.6 15.4 7.9 73.2 75.6 81.3 84.2
Education
None or Primary Incomplete 21.8 33.4 18.2 9.2 2.7 2.0 71.1 92.8 5.5 2.5 7.1 5.0
Primary Complete or Secondary Incomplete 51.6 43.1 49.4 34.3 68.8 58.8 27.9 7.2 18.3 11.6 62.9 59.8
Secondary Complete 11.3 5.7 18.6 36.8 7.6 9.4 0.9 0.0 26.9 24.0 5.0 7.0
Post Secondary 15.4 17.8 13.8 19.8 20.8 29.9 0.1 0.0 49.2 61.9 25.0 28.1
Marital Status
Married or Live together 78.9 65.8 68.9 44.4 66.4 63.9 88.8 82.7 77.5 68.5 60.1 56.9
Divorced/Separated 3.4 10.7 0.6 2.9 4.3 10.1 1.5 0.7 2.3 7.5 6.1 10.6
Widow/er 1.4 9.2 0.4 3.0 0.9 4.4 1.7 11.1 2.3 7.7 0.7 2.3
Single 16.3 14.2 30.1 49.7 28.4 21.5 8.0 5.5 18.0 16.3 33.1 30.1
Presence of children in the household
No 21.2 19.8 28.0 50.0 85.1 88.7 13.2 15.7 36.0 35.5 - -
Yes 78.8 80.2 72.0 50.0 14.9 11.3 86.8 84.3 64.0 64.5 - -
Presence of elderly in the household
No 79.5 85.5 98.9 99.5 91.8 93.3 98.3 99.6 99.4 99.2 99.6 99.5
Yes 20.5 14.5 1.1 0.5 8.2 6.7 1.7 0.4 0.6 0.8 0.4 0.5
Presence of other member with labor income
No 46.6 33.0 57.3 33.5 28.1 23.4 63.1 41.5 25.8 24.4 39.3 31.5
Yes 53.4 67.0 42.7 66.5 71.9 76.6 36.9 58.5 74.2 75.6 60.7 68.5
Observations (Weighted) 12,799,673 7,931,462 2,057,650 433,602 13,578,354 11,756,044 412,112 125,610 191,539 212,344 64,750,428 51,948,315
Observations (Unweighted)
Number of Countries
20,304
13,913
6
24,446
8,232
2
32,490
28,694
12
344
98
1
1,249
1,382
1
21,101
13,498
13
Source: Authors’ calculations using Household Surveys (World Bank). + For SA and Western Europe results are reported using the Economic sector Set, given the fact that social security is not a proper control for informality.
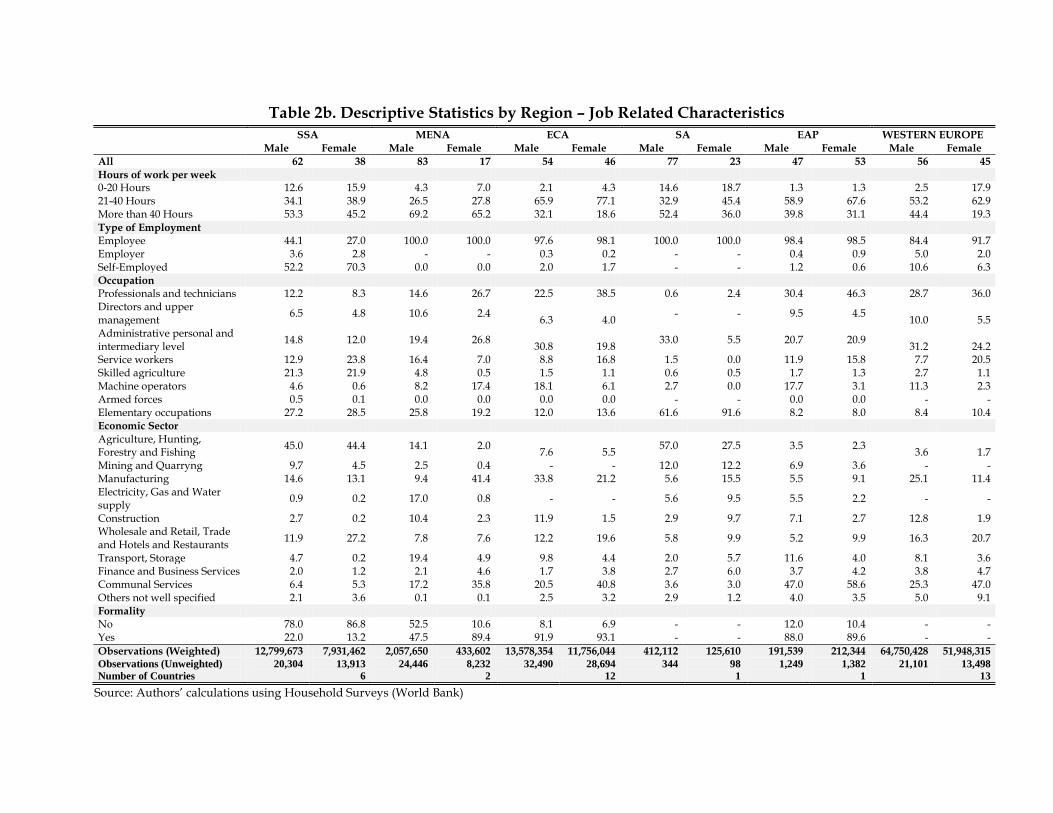
Table 2b. Descriptive Statistics by Region – Job Related Characteristics
SSA MENA ECA SA EAP WESTERN EUROPE Male Female Male Female Male Female Male Female Male Female Male Female
All 62 38 83 17 54 46 77 23 47 53 56 45 Hours of work per week 0-20 Hours 12.6 15.9 4.3 7.0 2.1 4.3 14.6 18.7 1.3 1.3 2.5 17.9 21-40 Hours 34.1 38.9 26.5 27.8 65.9 77.1 32.9 45.4 58.9 67.6 53.2 62.9 More than 40 Hours 53.3 45.2 69.2 65.2 32.1 18.6 52.4 36.0 39.8 31.1 44.4 19.3 Type of Employment Employee 44.1 27.0 100.0 100.0 97.6 98.1 100.0 100.0 98.4 98.5 84.4 91.7 Employer 3.6 2.8 - - 0.3 0.2 - - 0.4 0.9 5.0 2.0 Self-Employed 52.2 70.3 0.0 0.0 2.0 1.7 - - 1.2 0.6 10.6 6.3 Occupation Professionals and technicians 12.2 8.3 14.6 26.7 22.5 38.5 0.6 2.4 30.4 46.3 28.7 36.0 Directors and upper management
6.5 4.8 10.6 2.4 6.3 4.0
- - 9.5 4.5 10.0 5.5
Administrative personal and intermediary level
14.8 12.0 19.4 26.8 30.8 19.8
33.0 5.5 20.7 20.9 31.2 24.2
Service workers 12.9 23.8 16.4 7.0 8.8 16.8 1.5 0.0 11.9 15.8 7.7 20.5 Skilled agriculture 21.3 21.9 4.8 0.5 1.5 1.1 0.6 0.5 1.7 1.3 2.7 1.1 Machine operators 4.6 0.6 8.2 17.4 18.1 6.1 2.7 0.0 17.7 3.1 11.3 2.3 Armed forces 0.5 0.1 0.0 0.0 0.0 0.0 - - 0.0 0.0 - - Elementary occupations 27.2 28.5 25.8 19.2 12.0 13.6 61.6 91.6 8.2 8.0 8.4 10.4 Economic Sector Agriculture, Hunting, Forestry and Fishing
45.0 44.4 14.1 2.0 7.6 5.5
57.0 27.5 3.5 2.3 3.6 1.7
Mining and Quarryng 9.7 4.5 2.5 0.4 - - 12.0 12.2 6.9 3.6 - - Manufacturing 14.6 13.1 9.4 41.4 33.8 21.2 5.6 15.5 5.5 9.1 25.1 11.4 Electricity, Gas and Water supply
0.9 0.2 17.0 0.8 - - 5.6 9.5 5.5 2.2 - -
Construction 2.7 0.2 10.4 2.3 11.9 1.5 2.9 9.7 7.1 2.7 12.8 1.9 Wholesale and Retail, Trade and Hotels and Restaurants
11.9 27.2 7.8 7.6 12.2 19.6 5.8 9.9 5.2 9.9 16.3 20.7
Transport, Storage 4.7 0.2 19.4 4.9 9.8 4.4 2.0 5.7 11.6 4.0 8.1 3.6 Finance and Business Services 2.0 1.2 2.1 4.6 1.7 3.8 2.7 6.0 3.7 4.2 3.8 4.7 Communal Services 6.4 5.3 17.2 35.8 20.5 40.8 3.6 3.0 47.0 58.6 25.3 47.0 Others not well specified 2.1 3.6 0.1 0.1 2.5 3.2 2.9 1.2 4.0 3.5 5.0 9.1 Formality No 78.0 86.8 52.5 10.6 8.1 6.9 - - 12.0 10.4 - - Yes 22.0 13.2 47.5 89.4 91.9 93.1 - - 88.0 89.6 - -
Observations (Weighted) 12,799,673 7,931,462 2,057,650 433,602 13,578,354 11,756,044 412,112 125,610 191,539 212,344 64,750,428 51,948,315 Observations (Unweighted)
Number of Countries
20,304
13,913
6
24,446
8,232
2
32,490
28,694
12
344
98
1
1,249
1,382
1
21,101
13,498
13
Source: Authors’ calculations using Household Surveys (World Bank)
Tables 3a and 3b show additional descriptive statistics. In this case these
statistics are earnings averages for different segments of the labor markets. As
before, the first table uses the demographic set of variables and the second the job-
related characteristics. Both tables correspond to measures of hourly labor
earnings, normalized such that the average of females’ earnings in each region is
set equal to 100.
SA highlights as the region with the highest earnings disparities as males earn
on average 48% more than females. On the other extreme are EAP and MENA with
gender earnings gaps of 10% and 8% of average females’ earnings respectively.
Note that these are simple comparison of average earnings for all working males
and females. These gaps are not taking into account the gender differences in
observable characteristics yet. That will be analyzed in the next section.
The earnings pattern over the life cycle shows no surprise. Younger workers (15-
24) tend to earn less than prime-agers. When getting close to retirement age (55-
65), females’ earnings decrease more than those of males. The earnings patterns
with respect to education show no surprises as well. Higher educated workers
earn more than those with lower education. The gender differences across those
patterns, however, differ (and this will be analyzed latter after the earnings gaps
decompositions).
Individuals’ earnings in urban areas tend to be higher than those in rural areas.
Married males tend to earn higher than the rest of the population. Those with no
elderly at home tend to earn higher than their counterparts with at least one
elderly at home. The only exception to that happens among females in SSA (recall
that SSA is also the region of the world where workers tend to live more with their
elderly relatives).
Regarding occupations, is no surprise that ―Directors and upper management‖
and ―Professionals and technicians‖ tend to have higher earnings than those at
other occupations. Interestingly, ―Armed forces‖ are also a high-paying occupation
for women in Sub-Saharan Africa. This may reflect that females who join the army,
generally, do not do so in lower-hierarchy positions. Regarding economic sectors,
it is also no surprising to verify that finance and business services are at the top
earnings.
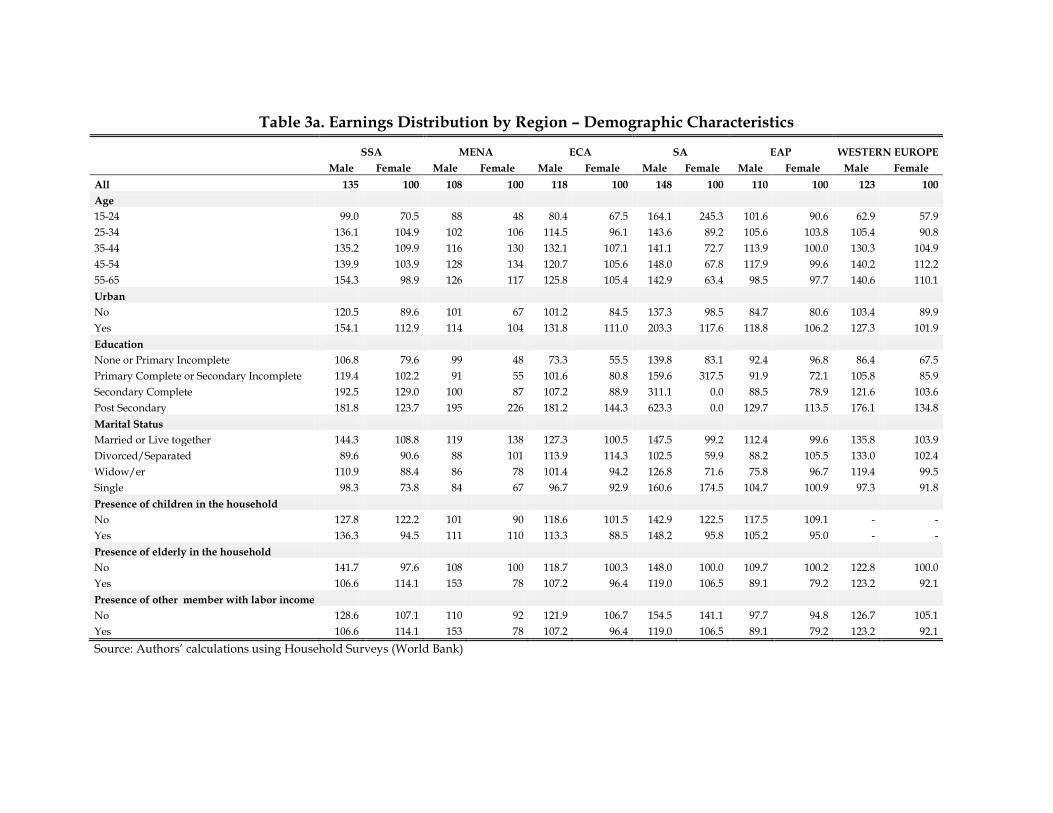
Table 3a. Earnings Distribution by Region – Demographic Characteristics
SSA MENA ECA SA EAP WESTERN EUROPE
Male Female Male Female Male Female Male Female Male Female Male Female
All 135 100 108 100 118 100 148 100 110 100 123 100
Age
15-24 99.0 70.5 88 48 80.4 67.5 164.1 245.3 101.6 90.6 62.9 57.9
25-34 136.1 104.9 102 106 114.5 96.1 143.6 89.2 105.6 103.8 105.4 90.8
35-44 135.2 109.9 116 130 132.1 107.1 141.1 72.7 113.9 100.0 130.3 104.9
45-54 139.9 103.9 128 134 120.7 105.6 148.0 67.8 117.9 99.6 140.2 112.2
55-65 154.3 98.9 126 117 125.8 105.4 142.9 63.4 98.5 97.7 140.6 110.1
Urban
No 120.5 89.6 101 67 101.2 84.5 137.3 98.5 84.7 80.6 103.4 89.9
Yes 154.1 112.9 114 104 131.8 111.0 203.3 117.6 118.8 106.2 127.3 101.9
Education
None or Primary Incomplete 106.8 79.6 99 48 73.3 55.5 139.8 83.1 92.4 96.8 86.4 67.5
Primary Complete or Secondary Incomplete 119.4 102.2 91 55 101.6 80.8 159.6 317.5 91.9 72.1 105.8 85.9
Secondary Complete 192.5 129.0 100 87 107.2 88.9 311.1 0.0 88.5 78.9 121.6 103.6
Post Secondary 181.8 123.7 195 226 181.2 144.3 623.3 0.0 129.7 113.5 176.1 134.8
Marital Status
Married or Live together 144.3 108.8 119 138 127.3 100.5 147.5 99.2 112.4 99.6 135.8 103.9
Divorced/Separated 89.6 90.6 88 101 113.9 114.3 102.5 59.9 88.2 105.5 133.0 102.4
Widow/er 110.9 88.4 86 78 101.4 94.2 126.8 71.6 75.8 96.7 119.4 99.5
Single 98.3 73.8 84 67 96.7 92.9 160.6 174.5 104.7 100.9 97.3 91.8
Presence of children in the household
No 127.8 122.2 101 90 118.6 101.5 142.9 122.5 117.5 109.1 - -
Yes 136.3 94.5 111 110 113.3 88.5 148.2 95.8 105.2 95.0 - -
Presence of elderly in the household
No 141.7 97.6 108 100 118.7 100.3 148.0 100.0 109.7 100.2 122.8 100.0
Yes 106.6 114.1 153 78 107.2 96.4 119.0 106.5 89.1 79.2 123.2 92.1
Presence of other member with labor income
No 128.6 107.1 110 92 121.9 106.7 154.5 141.1 97.7 94.8 126.7 105.1
Yes 106.6 114.1 153 78 107.2 96.4 119.0 106.5 89.1 79.2 123.2 92.1
Source: Authors’ calculations using Household Surveys (World Bank)
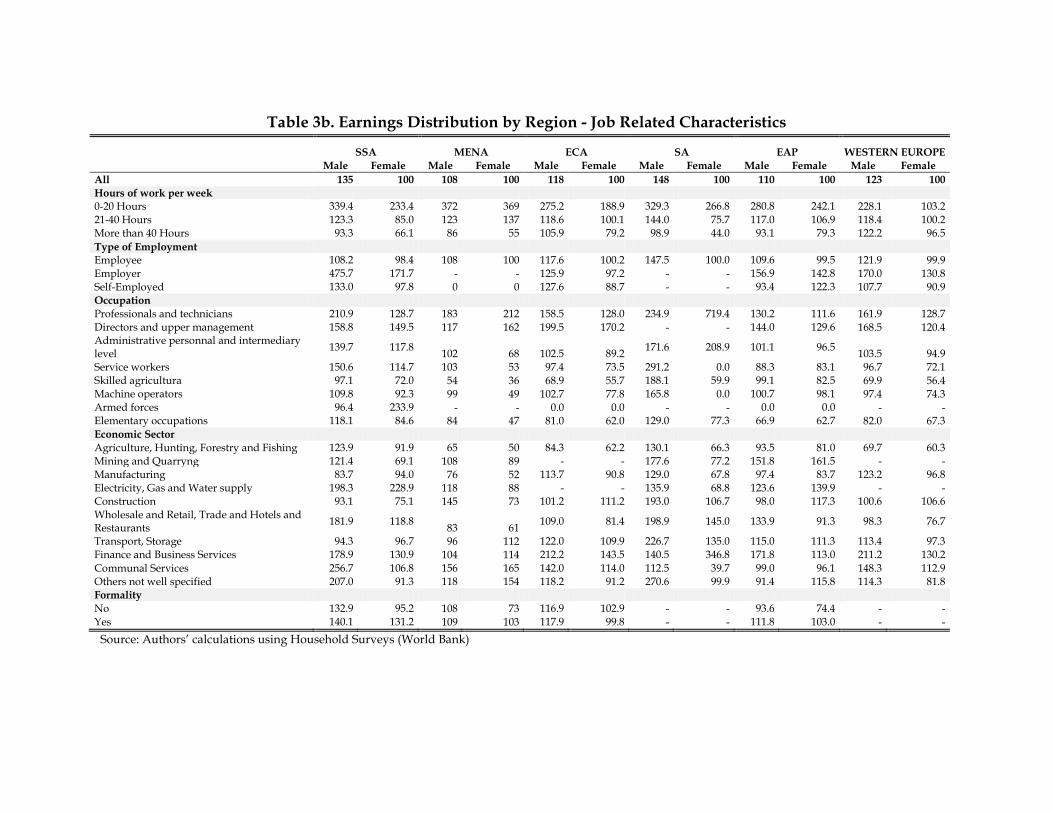
Table 3b. Earnings Distribution by Region - Job Related Characteristics
SSA MENA ECA SA EAP WESTERN EUROPE Male Female Male Female Male Female Male Female Male Female Male Female
All 135 100 108 100 118 100 148 100 110 100 123 100
Hours of work per week 0-20 Hours 339.4 233.4 372 369 275.2 188.9 329.3 266.8 280.8 242.1 228.1 103.2 21-40 Hours 123.3 85.0 123 137 118.6 100.1 144.0 75.7 117.0 106.9 118.4 100.2 More than 40 Hours 93.3 66.1 86 55 105.9 79.2 98.9 44.0 93.1 79.3 122.2 96.5
Type of Employment
Employee 108.2 98.4 108 100 117.6 100.2 147.5 100.0 109.6 99.5 121.9 99.9 Employer 475.7 171.7 - - 125.9 97.2 - - 156.9 142.8 170.0 130.8 Self-Employed 133.0 97.8 0 0 127.6 88.7 - - 93.4 122.3 107.7 90.9 Occupation Professionals and technicians 210.9 128.7 183 212 158.5 128.0 234.9 719.4 130.2 111.6 161.9 128.7 Directors and upper management 158.8 149.5 117 162 199.5 170.2 - - 144.0 129.6 168.5 120.4 Administrative personnal and intermediary level
139.7 117.8 102 68 102.5 89.2
171.6 208.9 101.1 96.5 103.5 94.9
Service workers 150.6 114.7 103 53 97.4 73.5 291.2 0.0 88.3 83.1 96.7 72.1 Skilled agricultura 97.1 72.0 54 36 68.9 55.7 188.1 59.9 99.1 82.5 69.9 56.4 Machine operators 109.8 92.3 99 49 102.7 77.8 165.8 0.0 100.7 98.1 97.4 74.3 Armed forces 96.4 233.9 - - 0.0 0.0 - - 0.0 0.0 - - Elementary occupations 118.1 84.6 84 47 81.0 62.0 129.0 77.3 66.9 62.7 82.0 67.3 Economic Sector Agriculture, Hunting, Forestry and Fishing 123.9 91.9 65 50 84.3 62.2 130.1 66.3 93.5 81.0 69.7 60.3 Mining and Quarryng 121.4 69.1 108 89 - - 177.6 77.2 151.8 161.5 - - Manufacturing 83.7 94.0 76 52 113.7 90.8 129.0 67.8 97.4 83.7 123.2 96.8 Electricity, Gas and Water supply 198.3 228.9 118 88 - - 135.9 68.8 123.6 139.9 - - Construction 93.1 75.1 145 73 101.2 111.2 193.0 106.7 98.0 117.3 100.6 106.6 Wholesale and Retail, Trade and Hotels and Restaurants
181.9 118.8 83 61
109.0 81.4 198.9 145.0 133.9 91.3 98.3 76.7
Transport, Storage 94.3 96.7 96 112 122.0 109.9 226.7 135.0 115.0 111.3 113.4 97.3 Finance and Business Services 178.9 130.9 104 114 212.2 143.5 140.5 346.8 171.8 113.0 211.2 130.2
Communal Services 256.7 106.8 156 165 142.0 114.0 112.5 39.7 99.0 96.1 148.3 112.9 Others not well specified 207.0 91.3 118 154 118.2 91.2 270.6 99.9 91.4 115.8 114.3 81.8 Formality No 132.9 95.2 108 73 116.9 102.9 - - 93.6 74.4 - - Yes 140.1 131.2 109 103 117.9 99.8 - - 111.8 103.0 - -
Source: Authors’ calculations using Household Surveys (World Bank)
3. Gender Earnings Gap Decompositions
Tables 4a and 4b show the decompositions for the gender gaps in hourly
earnings (at the main occupation), measured as a percentage of the average
females’ earnings. SSA, MENA and ECA are shown in Table 4a, while SA, EAP
and Western Europe are in Table 5b. The structure of the tables is the same across
regions. The components of the gender earnings gaps are shown in columns
(labeled as Delta 0, Delta M, Delta F and Delta X) , together with the percentages of
males and females in the common support (labeled as CSF and CSM).5
The matching variables that are sequentially added are shown as consecutive
lines. First, the “Demographic set” of variables is added: age, urban status,
education, marital status, presence of child in the household, presence of an elder
in the household and presence of other income-generator in the household (the
first and obvious matching variable within the pooled data set is ―country‖). As
mentioned, these are sequentially added as matching variables to measure the
extent to which the observed gender earnings gaps can be attributed to gender
differences in observed characteristics. On top of the “Demographic set” some job-
related variables are added, but with replacement. That is, first the number of
hours per week is added as a matching variable to the “Demographic set”; then the
type of employment variable replaces the number of hour per week as a matching
variable; then the occupation variable takes the place type of employment and so
on with economic sector and formality. Last, the ―All variables‖ line includes all
demographic and job-related variables in the matching.
It can be noted that the most comprehensive set of matching variables is the one
that shows the lowest measures of common support for both males and females.
These are particularly low for SA. This is a common feature of all non-parametric
methods (the curse of dimensionality). The inclusion of a comprehensive set of
variables may constraint the comparison of males and females to a small (and
perhaps non-representative) set of individuals. For that reason, the discussion of
the results below will be done considering the demographic set of variables first
and all variables afterwards.
In ECA, EAP and Western Europe, the gender earnings gap that remains after
matching on demographic characteristics (that is, after comparing males and
females with the same observable characteristics regarding the demographic set)
are higher than their corresponding original earnings gap (the one that does not
account for gender differences in characteristics). This is also the case for the LAC
5 See Ñopo (2008) for a detailed description of the components and the common supports.
region (Atal et al., 2009). Women show observable characteristics that would make
them more attractable to the labor markets (and hence, better paid), but this is
actually not the case. In the other three regions under analysis, SSA, MENA and
SA, the unexplained gender earnings gap that remain after matching on
demographic characteristics are below their corresponding original gap.
When analyzing the role of each particular variable on the explanation of the
earnings gaps, it is interesting to note that age moves down the unexplained wage
gap in MENA, reflecting that males tend to inhabit the prime-age segments of the
distribution in greater proportion than women. The inclusion of education as a
matching variable moves up the counterfactual earnings gaps in MENA, ECA and
EAP, reflecting that higher school achievements for females are not necessarily
compensated in the labor markets. In contrast, the inclusion of education moves
down the counterfactual earnings gap in SA. Marital status is a variable that
substantially contributes to the explanation of the earnings gap. The inclusion of
such variable in the matching reduces the counterfactual earnings gap in SSA, SA
and EAP.
The further inclusion of job-related characteristics move the unexplained
component of the earnings gaps up and down, with variability depending on the
variable to include on the matching and the region of the world. The inclusion of
hours of work per week moves up the counterfactual earnings gaps in all regions
under analysis. Including type of employment leaves the gap unaltered with
respect to the demographic set in all regions but SSA where it drops. Adding
occupation as a matching variable increases the counterfactual gap in SSA in SA
leaving it almost unaltered in the rest of the regions. In no region, however, the
unexplained gender earnings gaps show a reduction after introducing occupation
as a matching variable. This apparently paradoxical result, which has also been
found for Latin America, suggest that the reduction of gender occupational
segregation is a wrong target when trying to reduce gender earnings disparities
(Calonico and Ñopo, 2009). A slightly similar story can be depicted for economic
sectors. The inclusion of formality, in those regions where the data allows it, leaves
the counterfactual earnings gap almost unaltered. All in all, the inclusion of all job-
related characteristics moves the unexplained component of the earnings gaps
down in two regions (SA and Western Europe) and up in the other four (SSA,
MENA, ECA and EAP).
A related feature is that the Delta F and Delta M components of the earnings gap
also have the potential to increase. Delta M, the component of the earnings gap
that can be attributed to the existence of certain combination of observable
characteristics to which males reach but females do not, is positive in two regions
(SSA and SA), negative in MENA and statistically zero the other regions. Females
in SSA and SA suffer from a sort of glass-ceiling or barriers to the access to certain
well paid segments of the labor markets which males can access. Interestingly, the
same two regions show display a negative measure of Delta F, suggesting that
there are also some other well paid segments of the labor markets to which females
access and males not. The access barriers in these two regions work for both, males
and females, but females suffer from barriers that imply higher earnings
limitations for them. Regarding Delta F as well it is interesting to note that EAP
and to a lesser extent Western Europe display a positive component. This may be
an indication of the existence of certain females’ confinements within the labor
markets with earnings that are below the average of the rest of the markets.
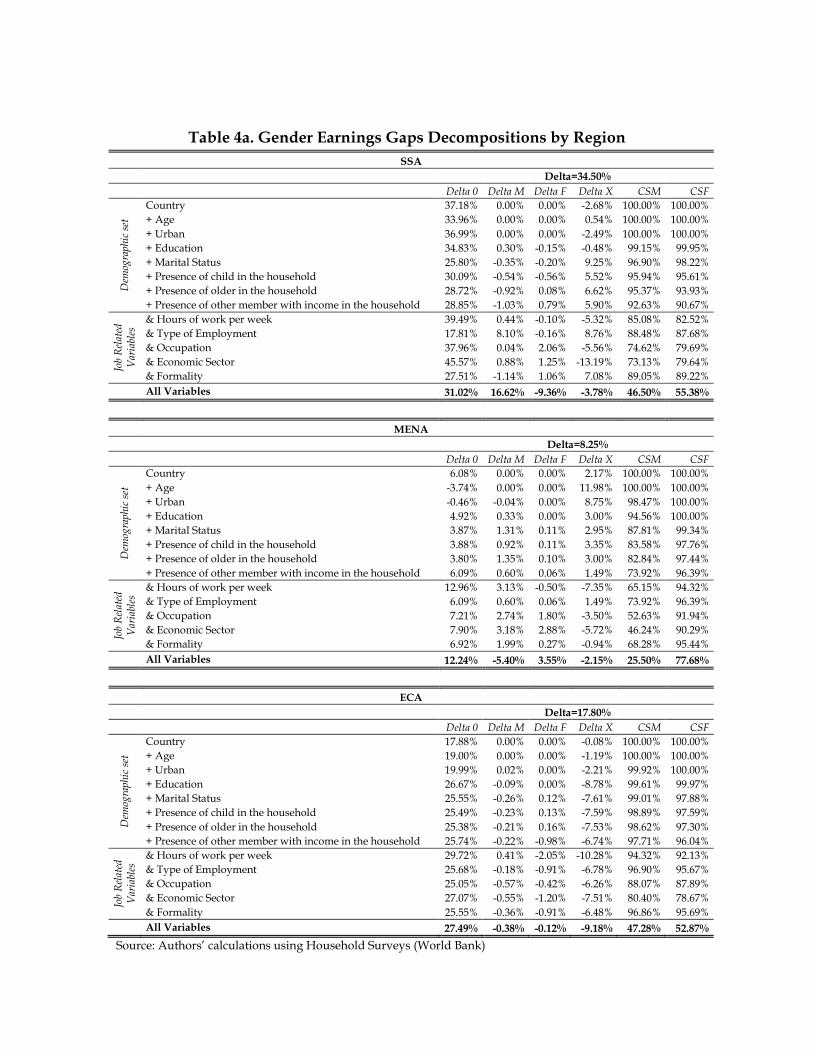
Table 4a. Gender Earnings Gaps Decompositions by Region
SSA
Delta=34.50%
Delta 0 Delta M Delta F Delta X CSM CSF
Dem
ogra
phi
c se
t
Country 37.18% 0.00% 0.00% -2.68% 100.00% 100.00%
+ Age 33.96% 0.00% 0.00% 0.54% 100.00% 100.00%
+ Urban 36.99% 0.00% 0.00% -2.49% 100.00% 100.00%
+ Education 34.83% 0.30% -0.15% -0.48% 99.15% 99.95%
+ Marital Status 25.80% -0.35% -0.20% 9.25% 96.90% 98.22%
+ Presence of child in the household 30.09% -0.54% -0.56% 5.52% 95.94% 95.61%
+ Presence of older in the household 28.72% -0.92% 0.08% 6.62% 95.37% 93.93%
+ Presence of other member with income in the household 28.85% -1.03% 0.79% 5.90% 92.63% 90.67%
Job
Rel
ated
V
aria
bles
& Hours of work per week 39.49% 0.44% -0.10% -5.32% 85.08% 82.52%
& Type of Employment 17.81% 8.10% -0.16% 8.76% 88.48% 87.68%
& Occupation 37.96% 0.04% 2.06% -5.56% 74.62% 79.69%
& Economic Sector 45.57% 0.88% 1.25% -13.19% 73.13% 79.64%
& Formality 27.51% -1.14% 1.06% 7.08% 89.05% 89.22%
All Variables 31.02% 16.62% -9.36% -3.78% 46.50% 55.38%
MENA
Delta=8.25%
Delta 0 Delta M Delta F Delta X CSM CSF
Dem
ogra
phi
c se
t
Country 6.08% 0.00% 0.00% 2.17% 100.00% 100.00%
+ Age -3.74% 0.00% 0.00% 11.98% 100.00% 100.00%
+ Urban -0.46% -0.04% 0.00% 8.75% 98.47% 100.00%
+ Education 4.92% 0.33% 0.00% 3.00% 94.56% 100.00%
+ Marital Status 3.87% 1.31% 0.11% 2.95% 87.81% 99.34%
+ Presence of child in the household 3.88% 0.92% 0.11% 3.35% 83.58% 97.76%
+ Presence of older in the household 3.80% 1.35% 0.10% 3.00% 82.84% 97.44%
+ Presence of other member with income in the household 6.09% 0.60% 0.06% 1.49% 73.92% 96.39%
Job
Rel
ated
V
aria
bles
& Hours of work per week 12.96% 3.13% -0.50% -7.35% 65.15% 94.32%
& Type of Employment 6.09% 0.60% 0.06% 1.49% 73.92% 96.39%
& Occupation 7.21% 2.74% 1.80% -3.50% 52.63% 91.94%
& Economic Sector 7.90% 3.18% 2.88% -5.72% 46.24% 90.29%
& Formality 6.92% 1.99% 0.27% -0.94% 68.28% 95.44%
All Variables 12.24% -5.40% 3.55% -2.15% 25.50% 77.68%
ECA
Delta=17.80%
Delta 0 Delta M Delta F Delta X CSM CSF
Dem
ogra
phi
c se
t
Country 17.88% 0.00% 0.00% -0.08% 100.00% 100.00%
+ Age 19.00% 0.00% 0.00% -1.19% 100.00% 100.00%
+ Urban 19.99% 0.02% 0.00% -2.21% 99.92% 100.00%
+ Education 26.67% -0.09% 0.00% -8.78% 99.61% 99.97%
+ Marital Status 25.55% -0.26% 0.12% -7.61% 99.01% 97.88%
+ Presence of child in the household 25.49% -0.23% 0.13% -7.59% 98.89% 97.59%
+ Presence of older in the household 25.38% -0.21% 0.16% -7.53% 98.62% 97.30%
+ Presence of other member with income in the household 25.74% -0.22% -0.98% -6.74% 97.71% 96.04%
Job
Rel
ated
V
aria
bles
& Hours of work per week 29.72% 0.41% -2.05% -10.28% 94.32% 92.13%
& Type of Employment 25.68% -0.18% -0.91% -6.78% 96.90% 95.67%
& Occupation 25.05% -0.57% -0.42% -6.26% 88.07% 87.89%
& Economic Sector 27.07% -0.55% -1.20% -7.51% 80.40% 78.67%
& Formality 25.55% -0.36% -0.91% -6.48% 96.86% 95.69%
All Variables 27.49% -0.38% -0.12% -9.18% 47.28% 52.87%
Source: Authors’ calculations using Household Surveys (World Bank)
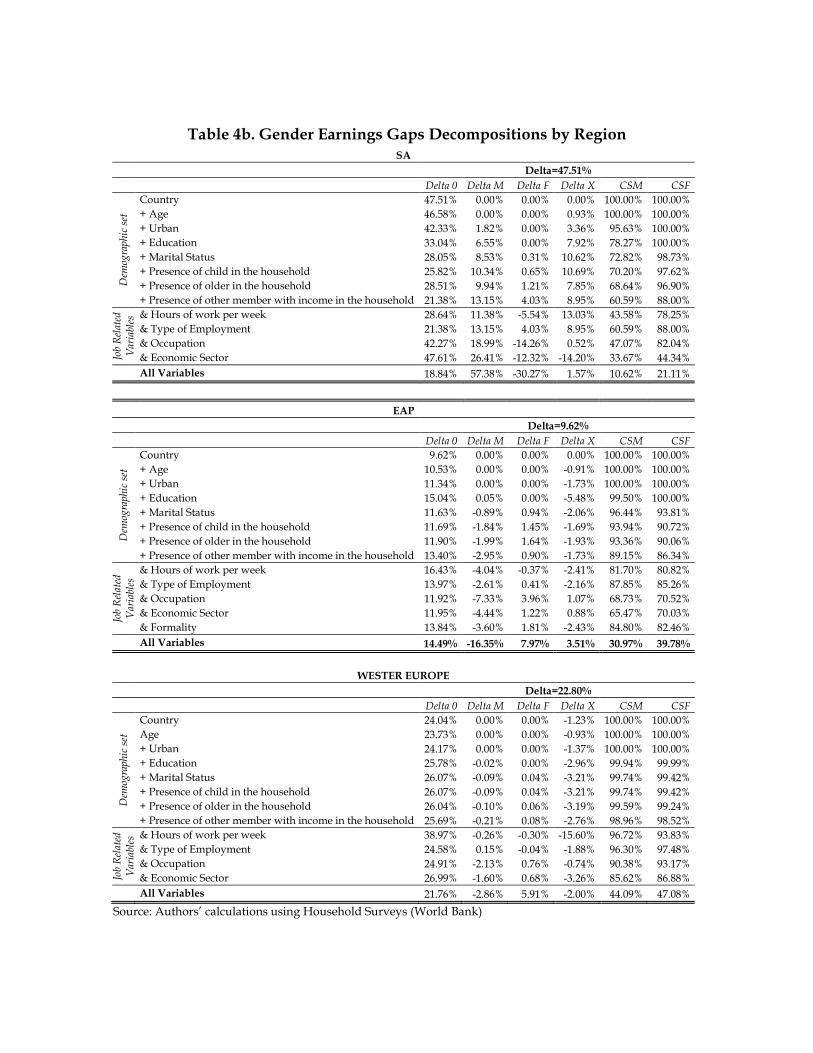
Table 4b. Gender Earnings Gaps Decompositions by Region SA
Delta=47.51%
Delta 0 Delta M Delta F Delta X CSM CSF
Dem
ogra
phi
c se
t
Country 47.51% 0.00% 0.00% 0.00% 100.00% 100.00%
+ Age 46.58% 0.00% 0.00% 0.93% 100.00% 100.00%
+ Urban 42.33% 1.82% 0.00% 3.36% 95.63% 100.00%
+ Education 33.04% 6.55% 0.00% 7.92% 78.27% 100.00%
+ Marital Status 28.05% 8.53% 0.31% 10.62% 72.82% 98.73%
+ Presence of child in the household 25.82% 10.34% 0.65% 10.69% 70.20% 97.62%
+ Presence of older in the household 28.51% 9.94% 1.21% 7.85% 68.64% 96.90%
+ Presence of other member with income in the household 21.38% 13.15% 4.03% 8.95% 60.59% 88.00%
Job
Rel
ated
V
aria
bles
& Hours of work per week 28.64% 11.38% -5.54% 13.03% 43.58% 78.25%
& Type of Employment 21.38% 13.15% 4.03% 8.95% 60.59% 88.00%
& Occupation 42.27% 18.99% -14.26% 0.52% 47.07% 82.04%
& Economic Sector 47.61% 26.41% -12.32% -14.20% 33.67% 44.34%
All Variables 18.84% 57.38% -30.27% 1.57% 10.62% 21.11%
EAP
Delta=9.62%
Delta 0 Delta M Delta F Delta X CSM CSF
Dem
ogra
phi
c se
t
Country 9.62% 0.00% 0.00% 0.00% 100.00% 100.00%
+ Age 10.53% 0.00% 0.00% -0.91% 100.00% 100.00%
+ Urban 11.34% 0.00% 0.00% -1.73% 100.00% 100.00%
+ Education 15.04% 0.05% 0.00% -5.48% 99.50% 100.00%
+ Marital Status 11.63% -0.89% 0.94% -2.06% 96.44% 93.81%
+ Presence of child in the household 11.69% -1.84% 1.45% -1.69% 93.94% 90.72%
+ Presence of older in the household 11.90% -1.99% 1.64% -1.93% 93.36% 90.06%
+ Presence of other member with income in the household 13.40% -2.95% 0.90% -1.73% 89.15% 86.34%
Job
Rel
ated
V
aria
bles
& Hours of work per week 16.43% -4.04% -0.37% -2.41% 81.70% 80.82%
& Type of Employment 13.97% -2.61% 0.41% -2.16% 87.85% 85.26%
& Occupation 11.92% -7.33% 3.96% 1.07% 68.73% 70.52%
& Economic Sector 11.95% -4.44% 1.22% 0.88% 65.47% 70.03%
& Formality 13.84% -3.60% 1.81% -2.43% 84.80% 82.46%
All Variables 14.49% -16.35% 7.97% 3.51% 30.97% 39.78%
WESTER EUROPE
Delta=22.80%
Delta 0 Delta M Delta F Delta X CSM CSF
Dem
ogra
phi
c se
t
Country 24.04% 0.00% 0.00% -1.23% 100.00% 100.00%
Age 23.73% 0.00% 0.00% -0.93% 100.00% 100.00%
+ Urban 24.17% 0.00% 0.00% -1.37% 100.00% 100.00%
+ Education 25.78% -0.02% 0.00% -2.96% 99.94% 99.99%
+ Marital Status 26.07% -0.09% 0.04% -3.21% 99.74% 99.42%
+ Presence of child in the household 26.07% -0.09% 0.04% -3.21% 99.74% 99.42%
+ Presence of older in the household 26.04% -0.10% 0.06% -3.19% 99.59% 99.24%
+ Presence of other member with income in the household 25.69% -0.21% 0.08% -2.76% 98.96% 98.52%
Job
Rel
ated
V
aria
bles
& Hours of work per week 38.97% -0.26% -0.30% -15.60% 96.72% 93.83%
& Type of Employment 24.58% 0.15% -0.04% -1.88% 96.30% 97.48%
& Occupation 24.91% -2.13% 0.76% -0.74% 90.38% 93.17%
& Economic Sector 26.99% -1.60% 0.68% -3.26% 85.62% 86.88%
All Variables 21.76% -2.86% 5.91% -2.00% 44.09% 47.08%
Source: Authors’ calculations using Household Surveys (World Bank)
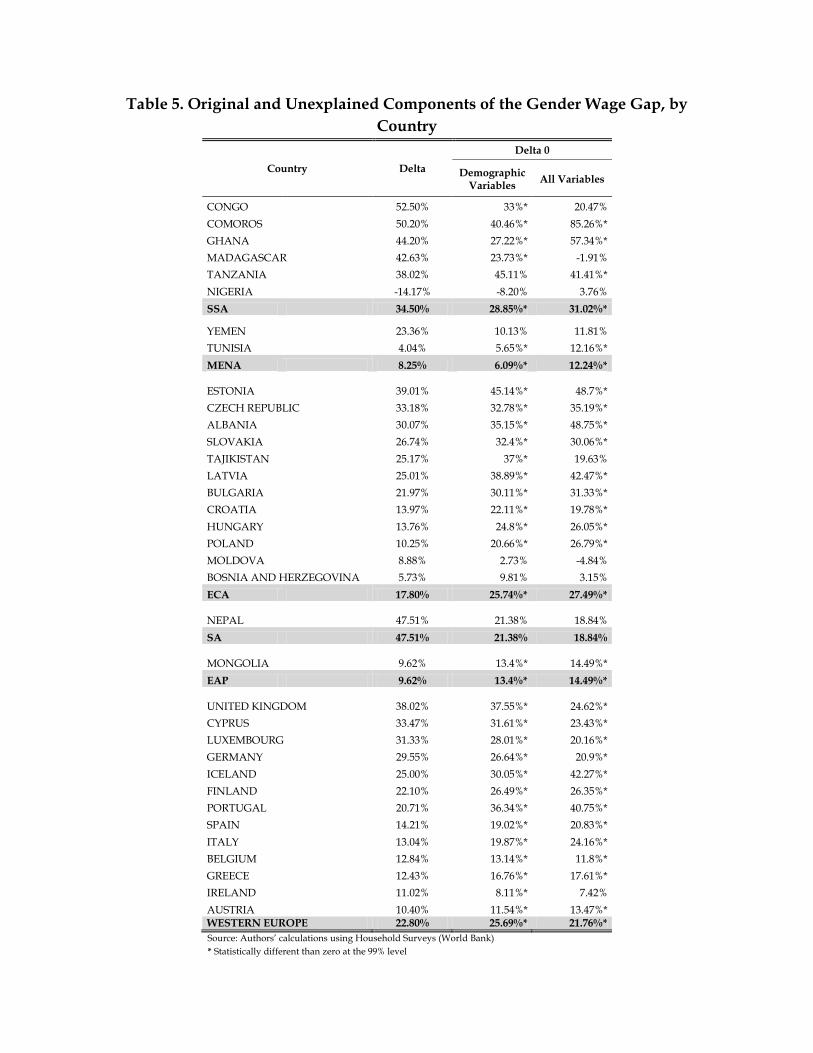
Table 5. Original and Unexplained Components of the Gender Wage Gap, by
Country
Country Delta
Delta 0
Demographic Variables
All Variables
CONGO 52.50% 33%* 20.47%
COMOROS 50.20% 40.46%* 85.26%*
GHANA 44.20% 27.22%* 57.34%*
MADAGASCAR 42.63% 23.73%* -1.91%
TANZANIA 38.02% 45.11% 41.41%*
NIGERIA -14.17% -8.20% 3.76%
SSA 34.50% 28.85%* 31.02%*
YEMEN 23.36% 10.13% 11.81%
TUNISIA 4.04% 5.65%* 12.16%*
MENA 8.25% 6.09%* 12.24%*
ESTONIA 39.01% 45.14%* 48.7%*
CZECH REPUBLIC 33.18% 32.78%* 35.19%*
ALBANIA 30.07% 35.15%* 48.75%*
SLOVAKIA 26.74% 32.4%* 30.06%*
TAJIKISTAN 25.17% 37%* 19.63%
LATVIA 25.01% 38.89%* 42.47%*
BULGARIA 21.97% 30.11%* 31.33%*
CROATIA 13.97% 22.11%* 19.78%*
HUNGARY 13.76% 24.8%* 26.05%*
POLAND 10.25% 20.66%* 26.79%*
MOLDOVA 8.88% 2.73% -4.84%
BOSNIA AND HERZEGOVINA 5.73% 9.81% 3.15%
ECA 17.80% 25.74%* 27.49%*
NEPAL 47.51% 21.38% 18.84%
SA 47.51% 21.38% 18.84%
MONGOLIA 9.62% 13.4%* 14.49%*
EAP 9.62% 13.4%* 14.49%*
UNITED KINGDOM 38.02% 37.55%* 24.62%*
CYPRUS 33.47% 31.61%* 23.43%*
LUXEMBOURG 31.33% 28.01%* 20.16%*
GERMANY 29.55% 26.64%* 20.9%*
ICELAND 25.00% 30.05%* 42.27%*
FINLAND 22.10% 26.49%* 26.35%*
PORTUGAL 20.71% 36.34%* 40.75%*
SPAIN 14.21% 19.02%* 20.83%*
ITALY 13.04% 19.87%* 24.16%*
BELGIUM 12.84% 13.14%* 11.8%*
GREECE 12.43% 16.76%* 17.61%*
IRELAND 11.02% 8.11%* 7.42%
AUSTRIA 10.40% 11.54%* 13.47%* WESTERN EUROPE 22.80% 25.69%* 21.76%*
Source: Authors’ calculations using Household Surveys (World Bank)
* Statistically different than zero at the 99% level
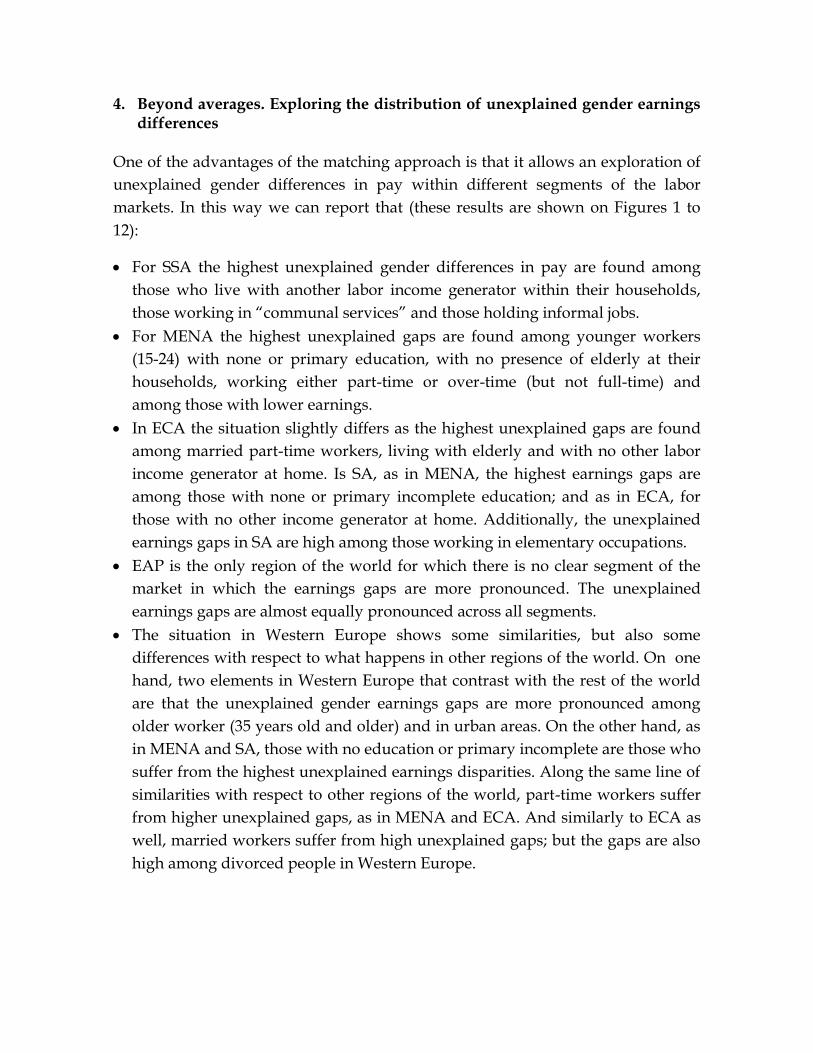
4. Beyond averages. Exploring the distribution of unexplained gender earnings differences
One of the advantages of the matching approach is that it allows an exploration of
unexplained gender differences in pay within different segments of the labor
markets. In this way we can report that (these results are shown on Figures 1 to
12):
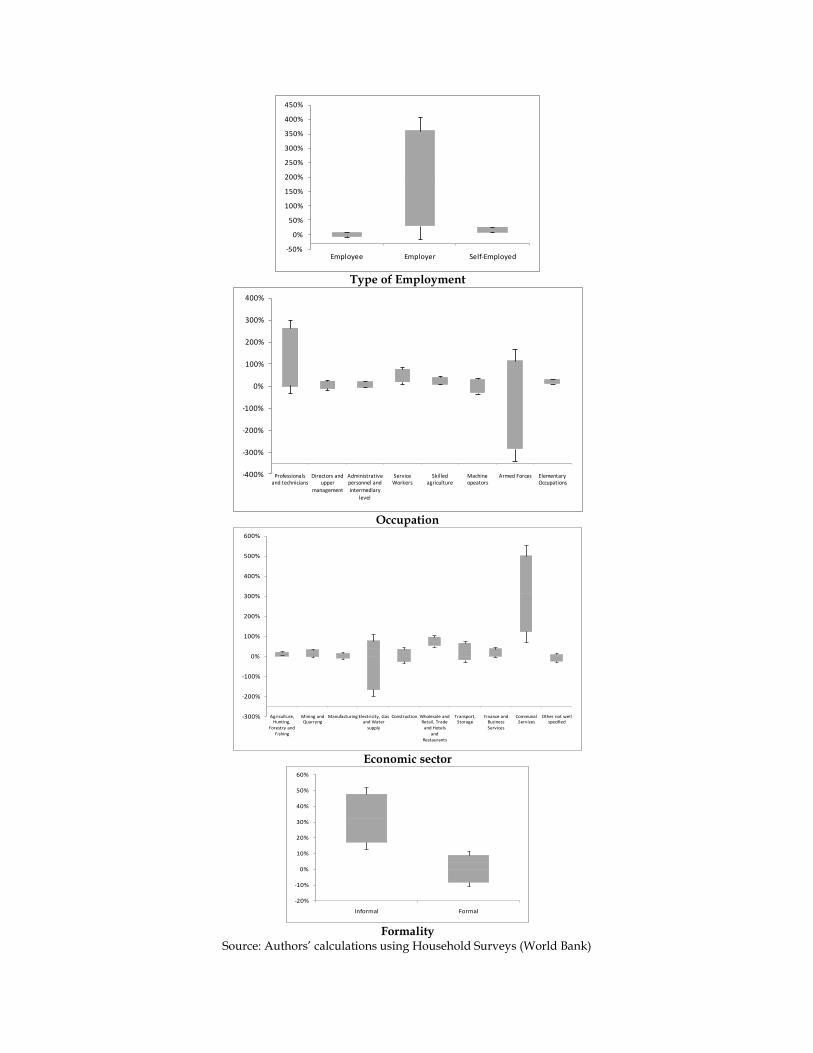
For SSA the highest unexplained gender differences in pay are found among
those who live with another labor income generator within their households,
those working in ―communal services‖ and those holding informal jobs.
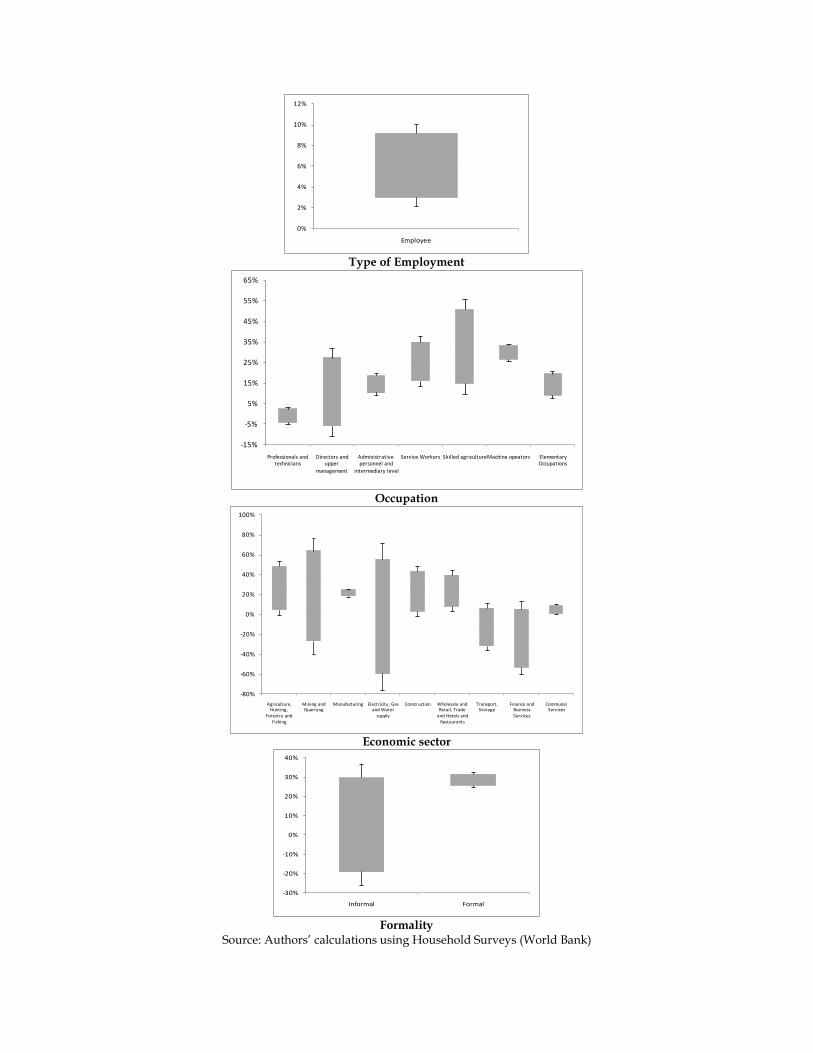
For MENA the highest unexplained gaps are found among younger workers
(15-24) with none or primary education, with no presence of elderly at their
households, working either part-time or over-time (but not full-time) and
among those with lower earnings.
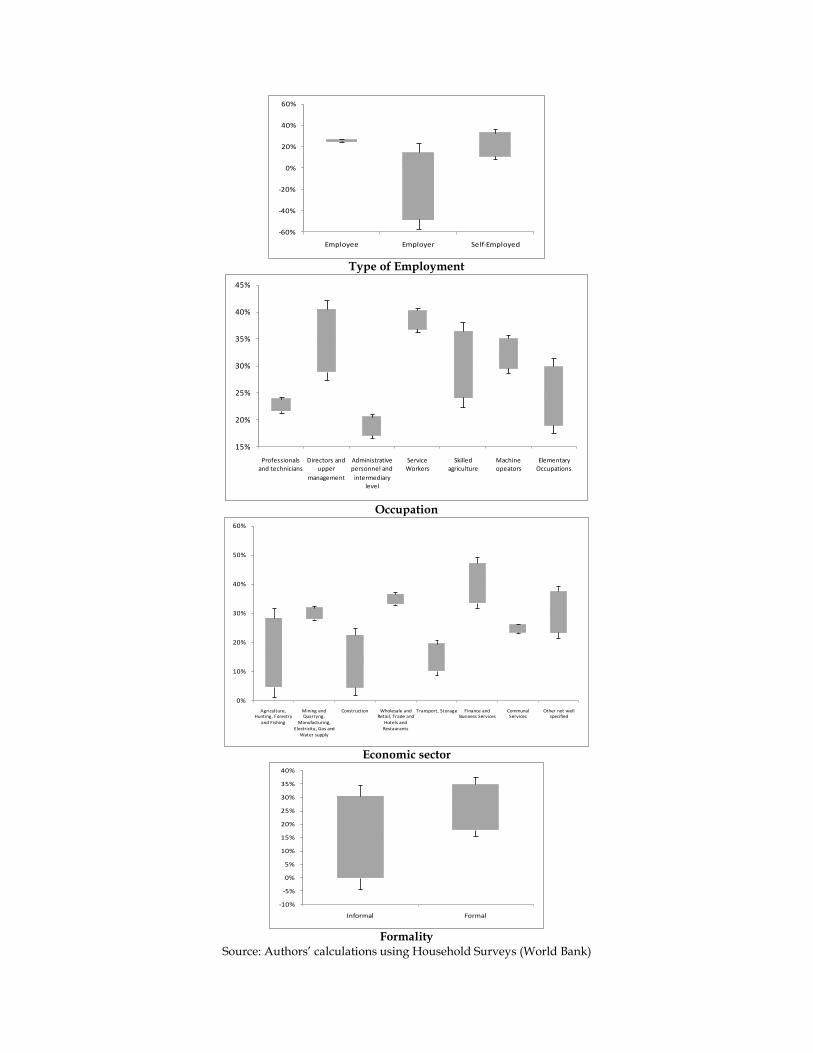
In ECA the situation slightly differs as the highest unexplained gaps are found
among married part-time workers, living with elderly and with no other labor
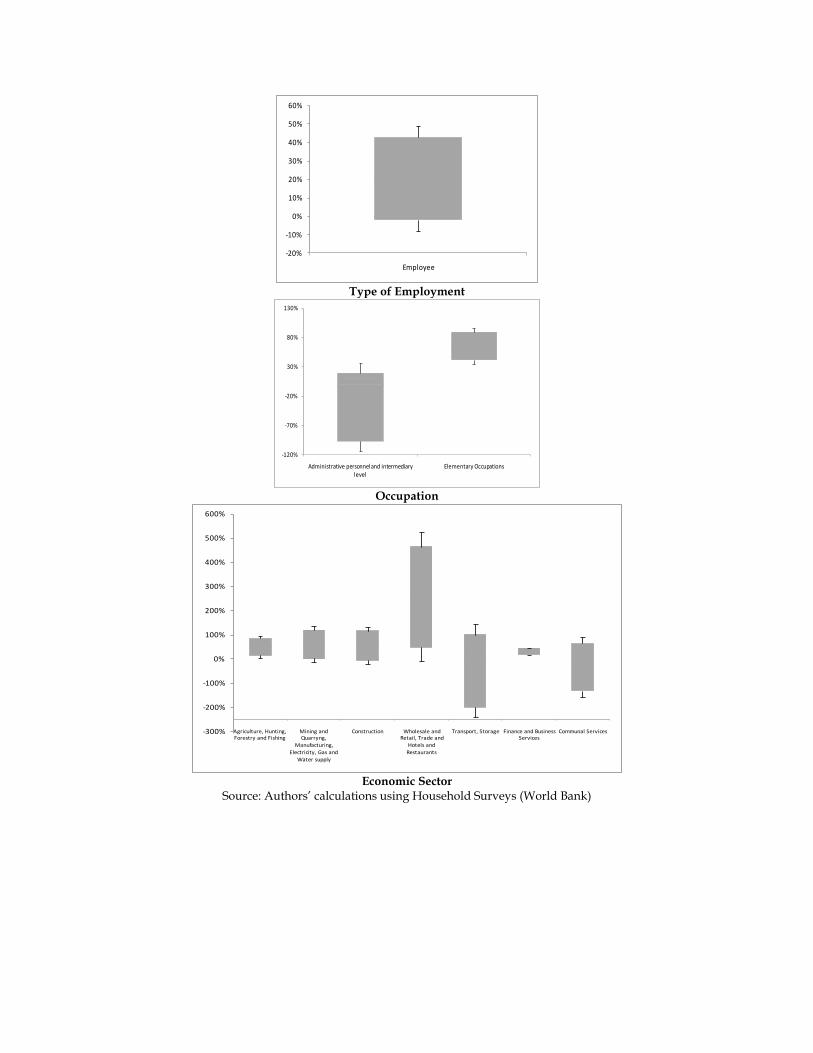
income generator at home. Is SA, as in MENA, the highest earnings gaps are
among those with none or primary incomplete education; and as in ECA, for
those with no other income generator at home. Additionally, the unexplained
earnings gaps in SA are high among those working in elementary occupations.
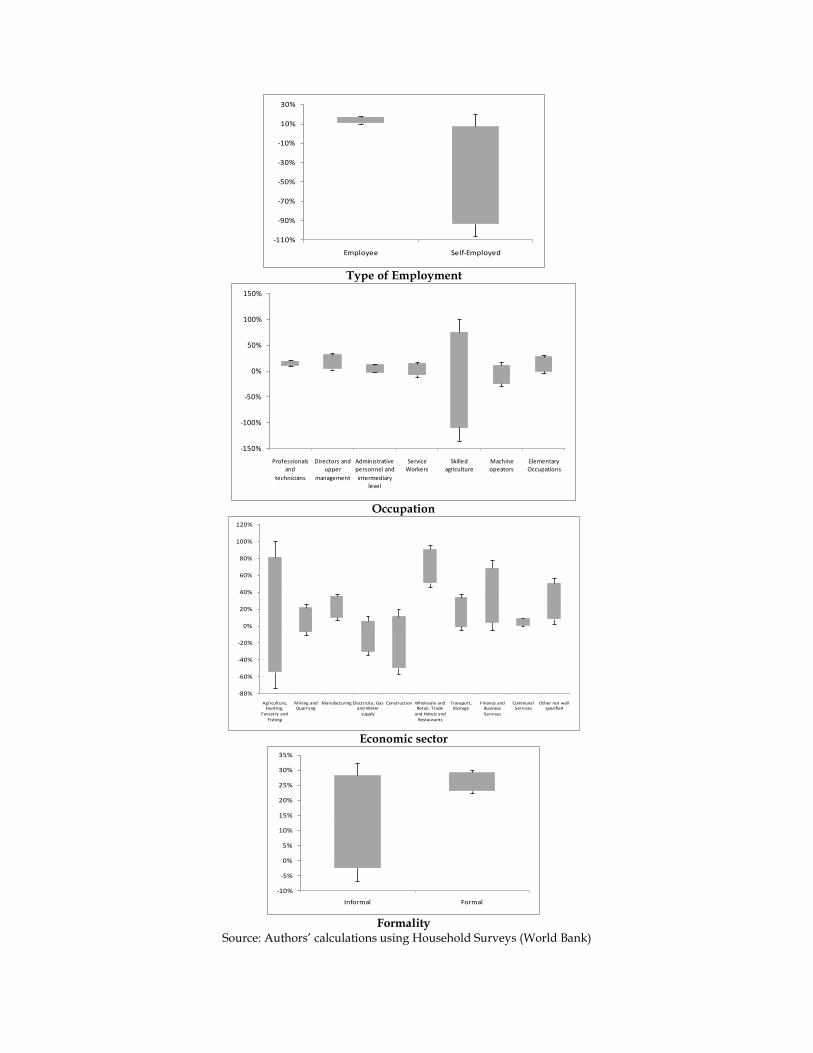
EAP is the only region of the world for which there is no clear segment of the
market in which the earnings gaps are more pronounced. The unexplained
earnings gaps are almost equally pronounced across all segments.
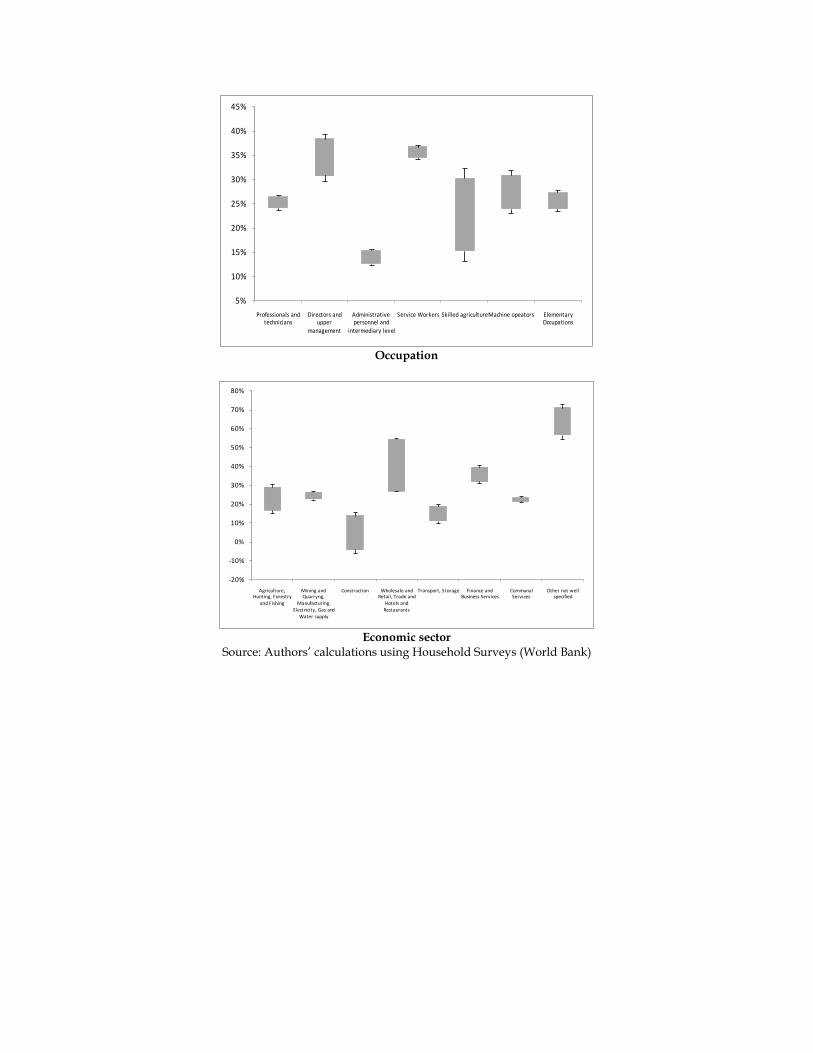
The situation in Western Europe shows some similarities, but also some
differences with respect to what happens in other regions of the world. On one
hand, two elements in Western Europe that contrast with the rest of the world
are that the unexplained gender earnings gaps are more pronounced among
older worker (35 years old and older) and in urban areas. On the other hand, as
in MENA and SA, those with no education or primary incomplete are those who
suffer from the highest unexplained earnings disparities. Along the same line of
similarities with respect to other regions of the world, part-time workers suffer
from higher unexplained gaps, as in MENA and ECA. And similarly to ECA as
well, married workers suffer from high unexplained gaps; but the gaps are also
high among divorced people in Western Europe.
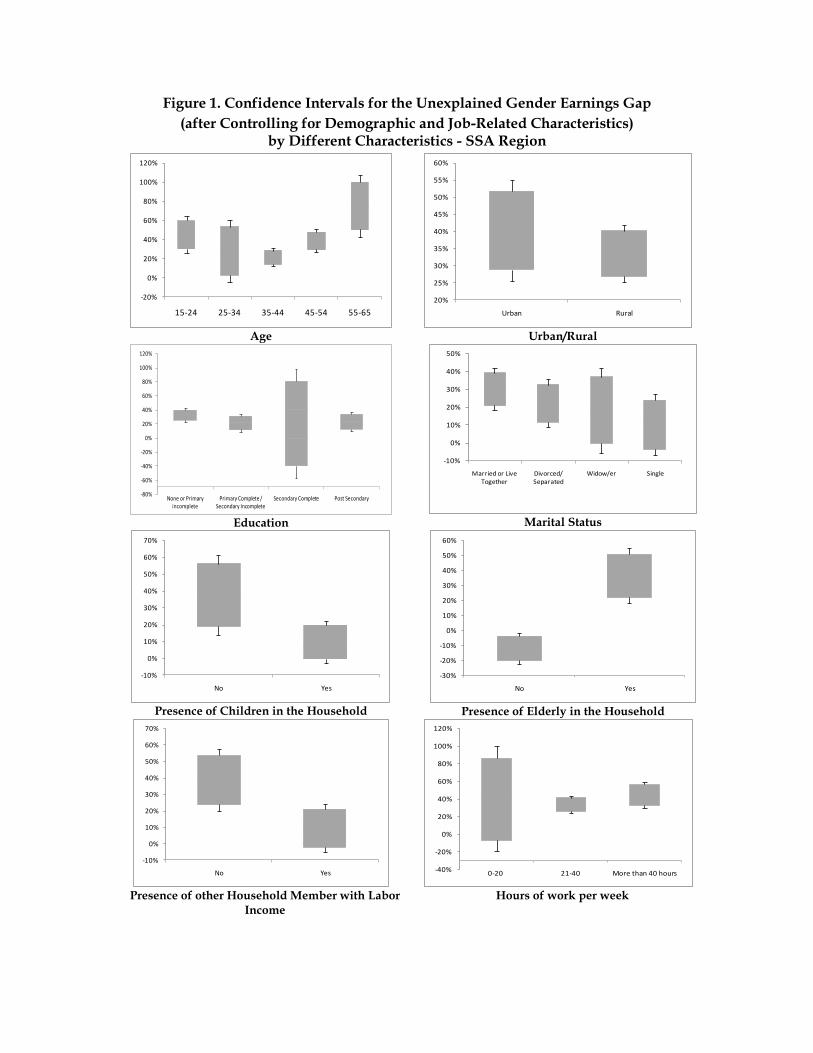
Figure 1. Confidence Intervals for the Unexplained Gender Earnings Gap
(after Controlling for Demographic and Job-Related Characteristics) by Different Characteristics - SSA Region
-20%
0%
20%
40%
60%
80%
100%
120%
15-24 25-34 35-44 45-54 55-65
Age
20%
25%
30%
35%
40%
45%
50%
55%
60%
Urban Rural
Urban/Rural
-80%
-60%
-40%
-20%
0%
20%
40%
60%
80%
100%
120%
None or Primary incomplete
Primary Complete / Secondary Incomplete
Secondary Complete Post Secondary
Education
-10%
0%
10%
20%
30%
40%
50%
Married or Live Together
Divorced/ Separated
Widow/er Single
Marital Status
-10%
0%
10%
20%
30%
40%
50%
60%
70%
No Yes
Presence of Children in the Household
-30%
-20%
-10%
0%
10%
20%
30%
40%
50%
60%
No Yes
Presence of Elderly in the Household
-10%
0%
10%
20%
30%
40%
50%
60%
70%
No Yes
Presence of other Household Member with Labor
Income
-40%
-20%
0%
20%
40%
60%
80%
100%
120%
0-20 21-40 More than 40 hours
Hours of work per week
-50%
0%
50%
100%
150%
200%
250%
300%
350%
400%
450%
Employee Employer Self-Employed
Type of Employment
-400%
-300%
-200%
-100%
0%
100%
200%
300%
400%
Professionals and technicians
Directors and upper
management
Administrative personnel and intermediary
level
Service Workers
Skilled agriculture
Machine opeators
Armed Forces Elementary Occupations
Occupation
-300%
-200%
-100%
0%
100%
200%
300%
400%
500%
600%
Agriculture, Hunting,
Forestry and Fishing
Mining and Quarryng
Manufacturing Electricity, Gas and Water
supply
Construction Wholesale and Retail, Trade
and Hotels and
Restaurants
Transport, Storage
Finance and Business Services
Communal Services
Other not well specified
Economic sector
-20%
-10%
0%
10%
20%
30%
40%
50%
60%
Informal Formal
Formality
Source: Authors’ calculations using Household Surveys (World Bank)
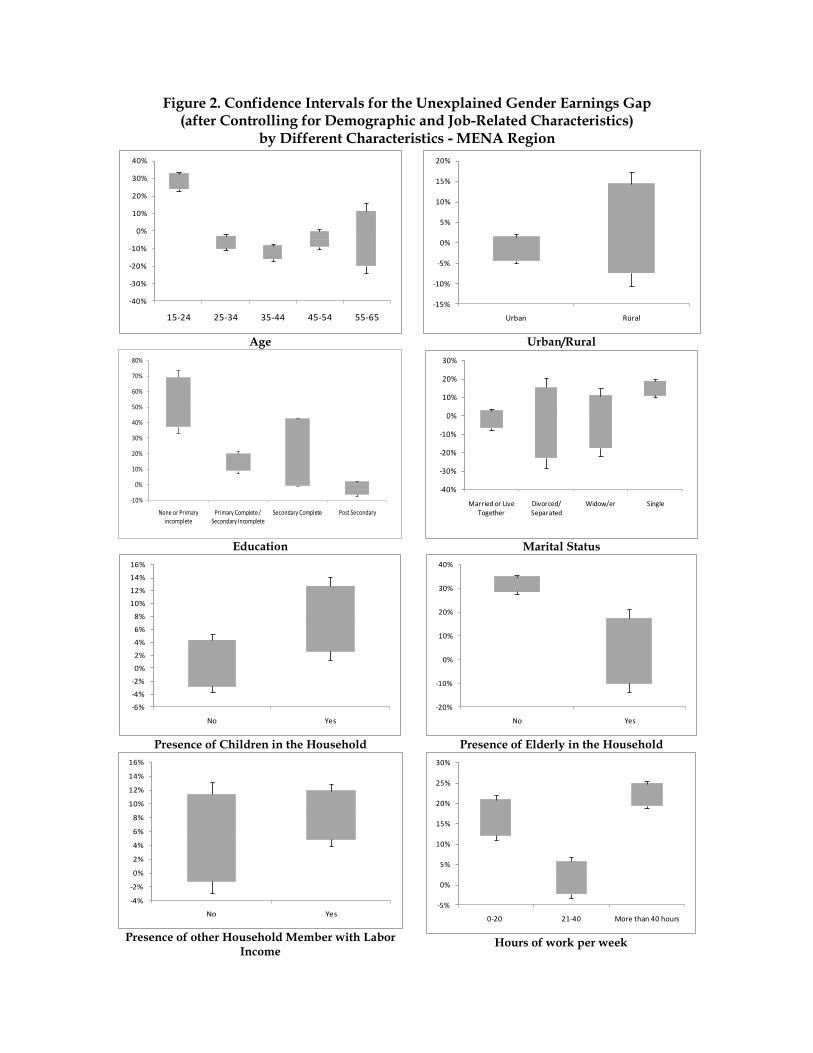
Figure 2. Confidence Intervals for the Unexplained Gender Earnings Gap (after Controlling for Demographic and Job-Related Characteristics)
by Different Characteristics - MENA Region
-40%
-30%
-20%
-10%
0%
10%
20%
30%
40%
15-24 25-34 35-44 45-54 55-65
Age
-15%
-10%
-5%
0%
5%
10%
15%
20%
Urban Rural
Urban/Rural
-10%
0%
10%
20%
30%
40%
50%
60%
70%
80%
None or Primary incomplete
Primary Complete / Secondary Incomplete
Secondary Complete Post Secondary
Education
-40%
-30%
-20%
-10%
0%
10%
20%
30%
Married or Live Together
Divorced/ Separated
Widow/er Single
Marital Status
-6%
-4%
-2%
0%
2%
4%
6%
8%
10%
12%
14%
16%
No Yes
Presence of Children in the Household
-20%
-10%
0%
10%
20%
30%
40%
No Yes
Presence of Elderly in the Household
-4%
-2%
0%
2%
4%
6%
8%
10%
12%
14%
16%
No Yes
Presence of other Household Member with Labor
Income
-5%
0%
5%
10%
15%
20%
25%
30%
0-20 21-40 More than 40 hours
Hours of work per week
0%
2%
4%
6%
8%
10%
12%
Employee
Type of Employment
-15%
-5%
5%
15%
25%
35%
45%
55%
65%
Professionals and technicians
Directors and upper
management
Administrative personnel and
intermediary level
Service Workers Skilled agricultureMachine opeators Elementary Occupations
Occupation
-80%
-60%
-40%
-20%
0%
20%
40%
60%
80%
100%
Agriculture, Hunting,
Forestry and Fishing
Mining and Quarryng
Manufacturing Electricity, Gas and Water
supply
Construction Wholesale and Retail, Trade
and Hotels and Restaurants
Transport, Storage
Finance and Business
Services
Communal Services
Economic sector
-30%
-20%
-10%
0%
10%
20%
30%
40%
Informal Formal
Formality
Source: Authors’ calculations using Household Surveys (World Bank)
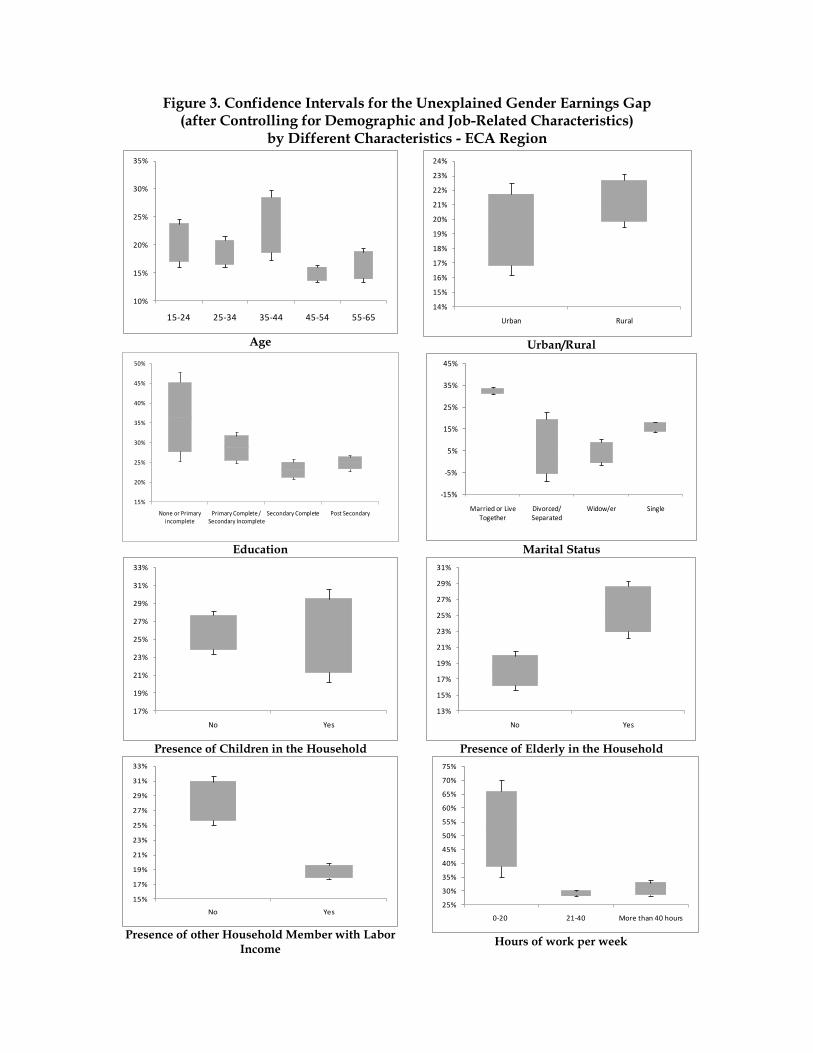
Figure 3. Confidence Intervals for the Unexplained Gender Earnings Gap (after Controlling for Demographic and Job-Related Characteristics)
by Different Characteristics - ECA Region
10%
15%
20%
25%
30%
35%
15-24 25-34 35-44 45-54 55-65
Age
14%
15%
16%
17%
18%
19%
20%
21%
22%
23%
24%
Urban Rural
Urban/Rural
15%
20%
25%
30%
35%
40%
45%
50%
None or Primary incomplete
Primary Complete / Secondary Incomplete
Secondary Complete Post Secondary
Education
-15%
-5%
5%
15%
25%
35%
45%
Married or Live Together
Divorced/ Separated
Widow/er Single
Marital Status
17%
19%
21%
23%
25%
27%
29%
31%
33%
No Yes
Presence of Children in the Household
13%
15%
17%
19%
21%
23%
25%
27%
29%
31%
No Yes
Presence of Elderly in the Household
15%
17%
19%
21%
23%
25%
27%
29%
31%
33%
No Yes
Presence of other Household Member with Labor
Income
25%
30%
35%
40%
45%
50%
55%
60%
65%
70%
75%
0-20 21-40 More than 40 hours
Hours of work per week
-60%
-40%
-20%
0%
20%
40%
60%
Employee Employer Self-Employed
Type of Employment
15%
20%
25%
30%
35%
40%
45%
Professionals and technicians
Directors and upper
management
Administrative personnel and
intermediary level
Service Workers
Skilled agriculture
Machine opeators
Elementary Occupations
Occupation
0%
10%
20%
30%
40%
50%
60%
Agriculture, Hunting, Forestry
and Fishing
Mining and Quarryng,
Manufacturing,
Electricity, Gas and Water supply
Construction Wholesale and Retail, Trade and
Hotels and
Restaurants
Transport, Storage Finance and Business Services
Communal Services
Other not well specified
Economic sector
-10%
-5%
0%
5%
10%
15%
20%
25%
30%
35%
40%
Informal Formal
Formality
Source: Authors’ calculations using Household Surveys (World Bank)
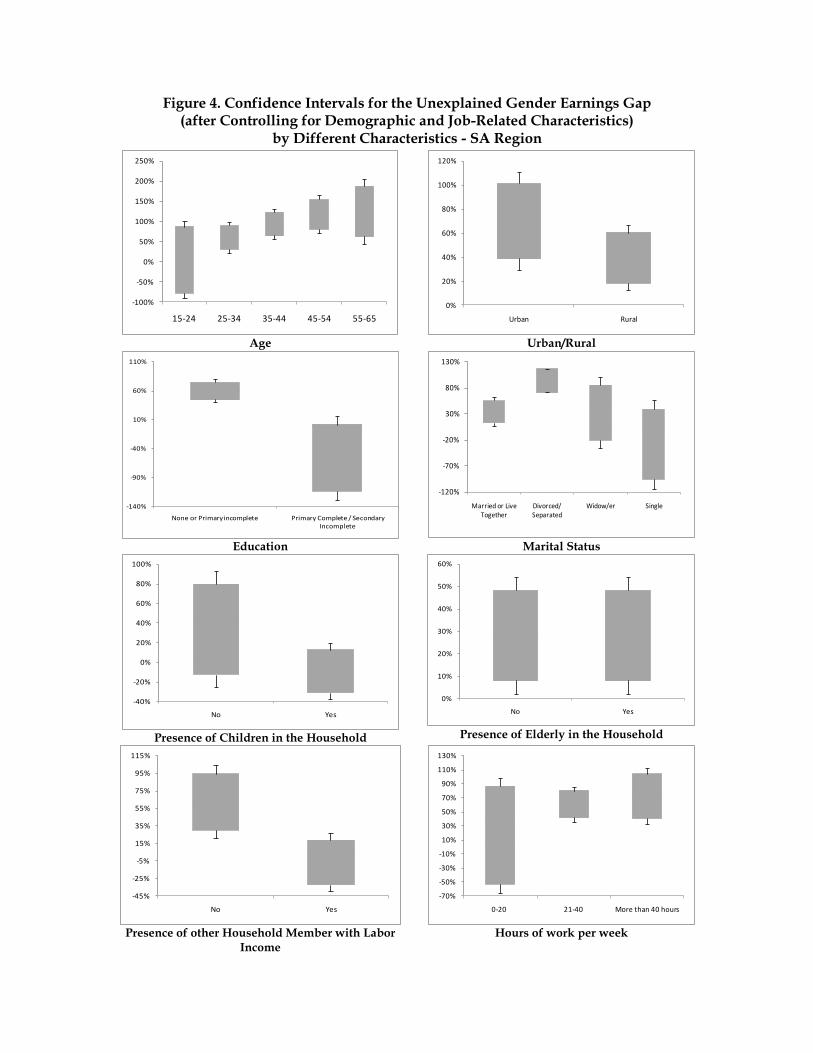
Figure 4. Confidence Intervals for the Unexplained Gender Earnings Gap (after Controlling for Demographic and Job-Related Characteristics)
by Different Characteristics - SA Region
-100%
-50%
0%
50%
100%
150%
200%
250%
15-24 25-34 35-44 45-54 55-65
Age
0%
20%
40%
60%
80%
100%
120%
Urban Rural
Urban/Rural
-140%
-90%
-40%
10%
60%
110%
None or Primary incomplete Primary Complete / Secondary Incomplete
Education
-120%
-70%
-20%
30%
80%
130%
Married or Live Together
Divorced/ Separated
Widow/er Single
Marital Status
-40%
-20%
0%
20%
40%
60%
80%
100%
No Yes
Presence of Children in the Household
0%
10%
20%
30%
40%
50%
60%
No Yes
Presence of Elderly in the Household
-45%
-25%
-5%
15%
35%
55%
75%
95%
115%
No Yes
Presence of other Household Member with Labor
Income
-70%
-50%
-30%
-10%
10%
30%
50%
70%
90%
110%
130%
0-20 21-40 More than 40 hours
Hours of work per week
-20%
-10%
0%
10%
20%
30%
40%
50%
60%
Employee
Type of Employment
-120%
-70%
-20%
30%
80%
130%
Administrative personnel and intermediary level
Elementary Occupations
Occupation
-300%
-200%
-100%
0%
100%
200%
300%
400%
500%
600%
Agriculture, Hunting, Forestry and Fishing
Mining and Quarryng,
Manufacturing, Electricity, Gas and
Water supply
Construction Wholesale and Retail, Trade and
Hotels and Restaurants
Transport, Storage Finance and Business Services
Communal Services
Economic Sector
Source: Authors’ calculations using Household Surveys (World Bank)
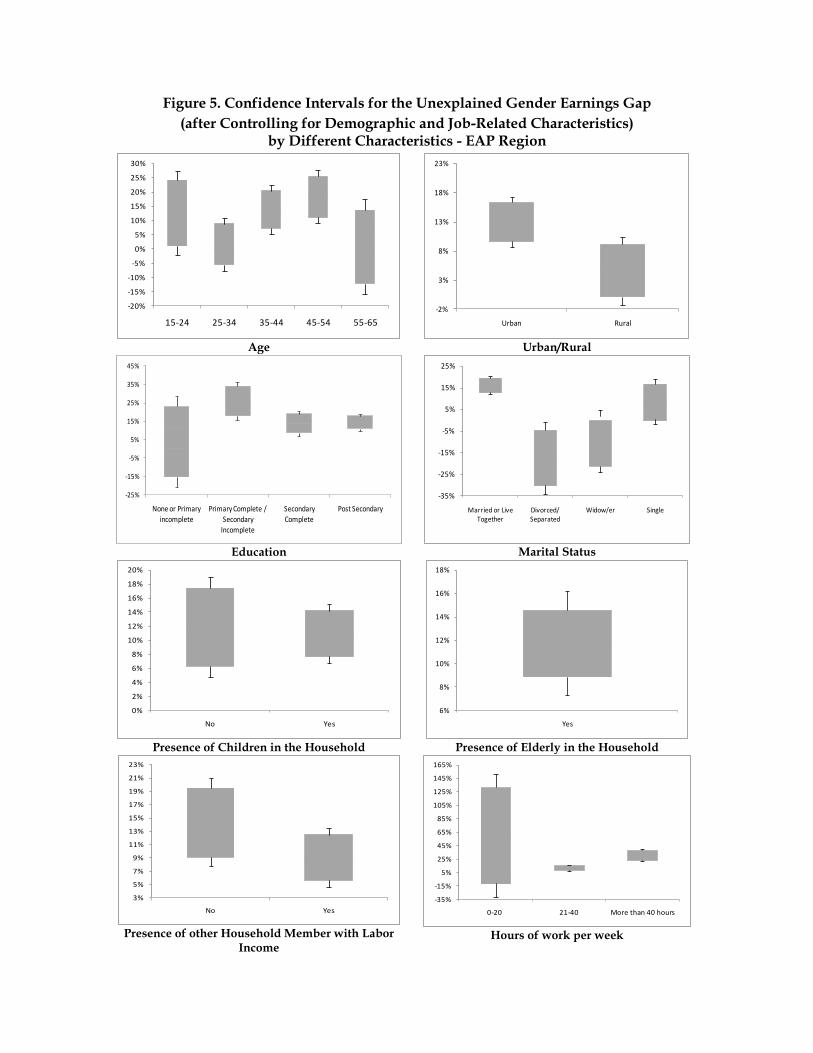
Figure 5. Confidence Intervals for the Unexplained Gender Earnings Gap
(after Controlling for Demographic and Job-Related Characteristics) by Different Characteristics - EAP Region
-20%
-15%
-10%
-5%
0%
5%
10%
15%
20%
25%
30%
15-24 25-34 35-44 45-54 55-65
Age
-2%
3%
8%
13%
18%
23%
Urban Rural
Urban/Rural
-25%
-15%
-5%
5%
15%
25%
35%
45%
None or Primary
incomplete
Primary Complete /
Secondary Incomplete
Secondary
Complete
Post Secondary
Education
-35%
-25%
-15%
-5%
5%
15%
25%
Married or Live Together
Divorced/ Separated
Widow/er Single
Marital Status
0%
2%
4%
6%
8%
10%
12%
14%
16%
18%
20%
No Yes
Presence of Children in the Household
6%
8%
10%
12%
14%
16%
18%
Yes
Presence of Elderly in the Household
3%
5%
7%
9%
11%
13%
15%
17%
19%
21%
23%
No Yes
Presence of other Household Member with Labor
Income
-35%
-15%
5%
25%
45%
65%
85%
105%
125%
145%
165%
0-20 21-40 More than 40 hours
Hours of work per week
-110%
-90%
-70%
-50%
-30%
-10%
10%
30%
Employee Self-Employed
Type of Employment
-150%
-100%
-50%
0%
50%
100%
150%
Professionals and
technicians
Directors and upper
management
Administrative personnel and
intermediary level
Service Workers
Skilled agriculture
Machine opeators
Elementary Occupations
Occupation
-80%
-60%
-40%
-20%
0%
20%
40%
60%
80%
100%
120%
Agriculture, Hunting,
Forestry and Fishing
Mining and Quarryng
Manufacturing Electricity, Gas and Water
supply
Construction Wholesale and Retail, Trade
and Hotels and Restaurants
Transport, Storage
Finance and Business
Services
Communal Services
Other not well specified
Economic sector
-10%
-5%
0%
5%
10%
15%
20%
25%
30%
35%
Informal Formal
Formality
Source: Authors’ calculations using Household Surveys (World Bank)
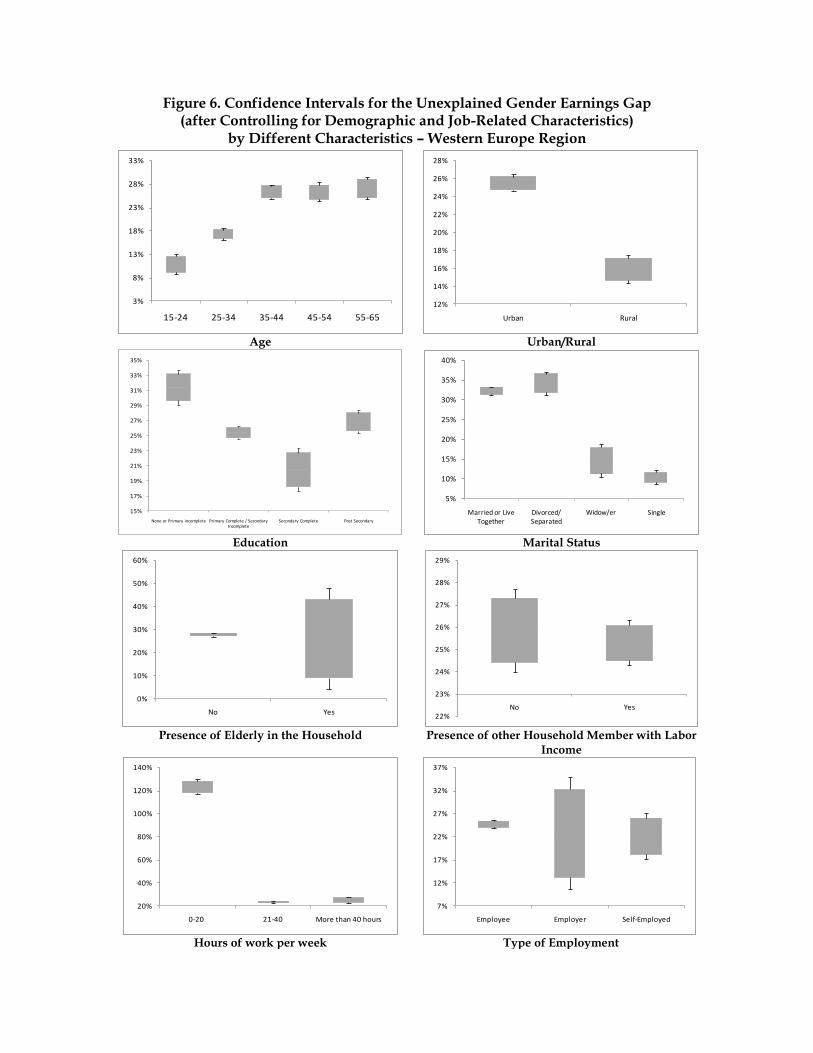
Figure 6. Confidence Intervals for the Unexplained Gender Earnings Gap (after Controlling for Demographic and Job-Related Characteristics)
by Different Characteristics – Western Europe Region
3%
8%
13%
18%
23%
28%
33%
15-24 25-34 35-44 45-54 55-65
Age
12%
14%
16%
18%
20%
22%
24%
26%
28%
Urban Rural
Urban/Rural
15%
17%
19%
21%
23%
25%
27%
29%
31%
33%
35%
None or Primary incomplete Primary Complete / Secondary Incomplete
Secondary Complete Post Secondary
Education
5%
10%
15%
20%
25%
30%
35%
40%
Married or Live Together
Divorced/ Separated
Widow/er Single
Marital Status
0%
10%
20%
30%
40%
50%
60%
No Yes
Presence of Elderly in the Household
22%
23%
24%
25%
26%
27%
28%
29%
No Yes
Presence of other Household Member with Labor
Income
20%
40%
60%
80%
100%
120%
140%
0-20 21-40 More than 40 hours
Hours of work per week
7%
12%
17%
22%
27%
32%
37%
Employee Employer Self-Employed
Type of Employment
5%
10%
15%
20%
25%
30%
35%
40%
45%
Professionals and technicians
Directors and upper
management
Administrative personnel and
intermediary level
Service Workers Skilled agricultureMachine opeators Elementary Occupations
Occupation
-20%
-10%
0%
10%
20%
30%
40%
50%
60%
70%
80%
Agriculture, Hunting, Forestry
and Fishing
Mining and Quarryng,
Manufacturing,
Electricity, Gas and Water supply
Construction Wholesale and Retail, Trade and
Hotels and
Restaurants
Transport, Storage Finance and Business Services
Communal Services
Other not well specified
Economic sector
Source: Authors’ calculations using Household Surveys (World Bank)
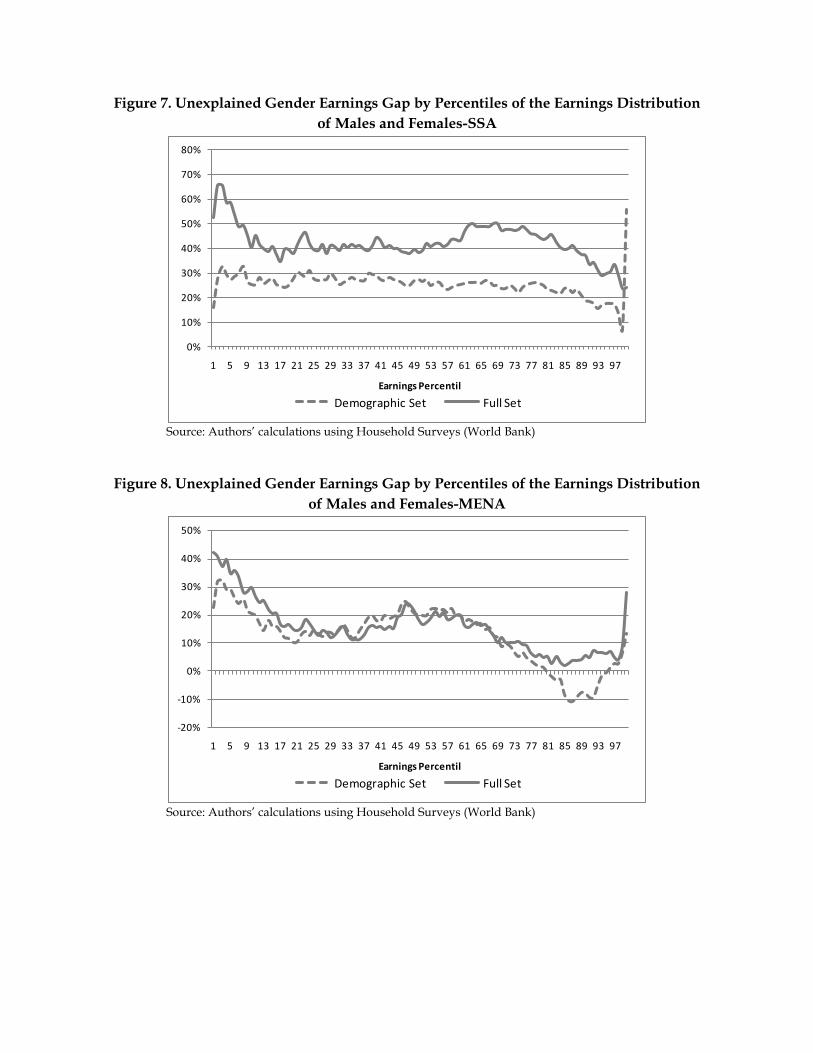
Figure 7. Unexplained Gender Earnings Gap by Percentiles of the Earnings Distribution
of Males and Females-SSA
0%
10%
20%
30%
40%
50%
60%
70%
80%
1 5 9 13 17 21 25 29 33 37 41 45 49 53 57 61 65 69 73 77 81 85 89 93 97
Earnings Percentil
Demographic Set Full Set
Source: Authors’ calculations using Household Surveys (World Bank)
Figure 8. Unexplained Gender Earnings Gap by Percentiles of the Earnings Distribution
of Males and Females-MENA
-20%
-10%
0%
10%
20%
30%
40%
50%
1 5 9 13 17 21 25 29 33 37 41 45 49 53 57 61 65 69 73 77 81 85 89 93 97
Earnings Percentil
Demographic Set Full Set
Source: Authors’ calculations using Household Surveys (World Bank)
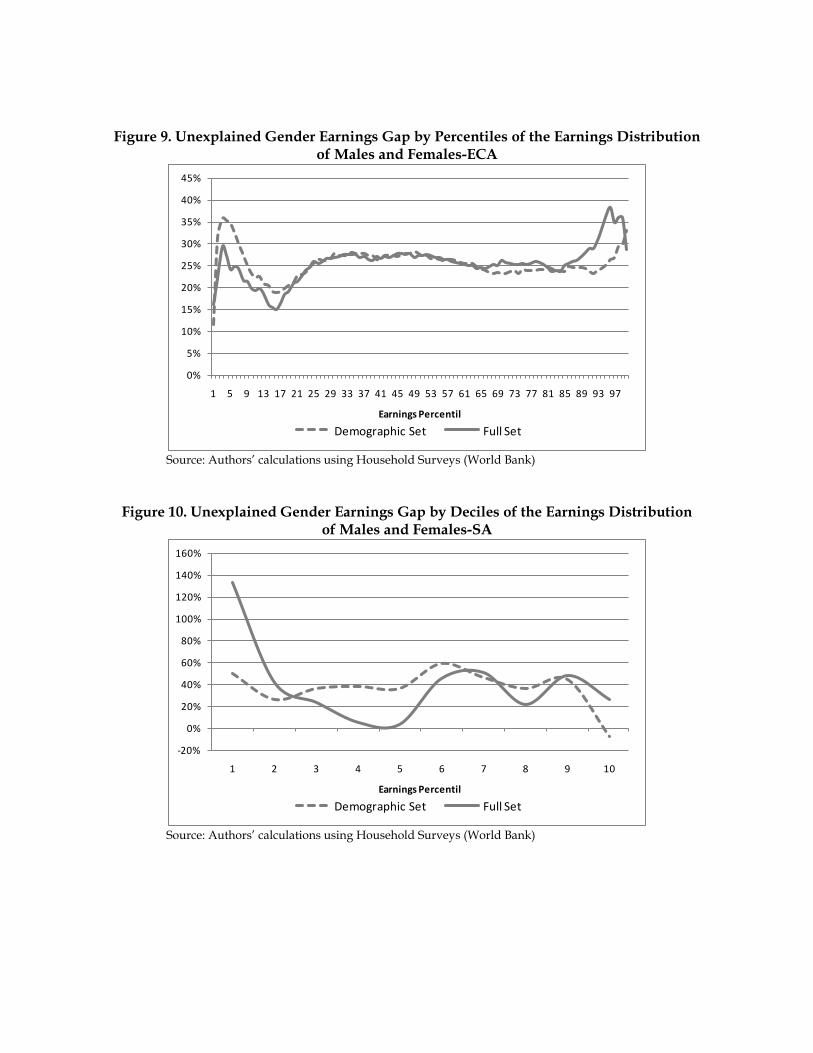
Figure 9. Unexplained Gender Earnings Gap by Percentiles of the Earnings Distribution of Males and Females-ECA
0%
5%
10%
15%
20%
25%
30%
35%
40%
45%
1 5 9 13 17 21 25 29 33 37 41 45 49 53 57 61 65 69 73 77 81 85 89 93 97
Earnings Percentil
Demographic Set Full Set
Source: Authors’ calculations using Household Surveys (World Bank)
Figure 10. Unexplained Gender Earnings Gap by Deciles of the Earnings Distribution of Males and Females-SA
-20%
0%
20%
40%
60%
80%
100%
120%
140%
160%
1 2 3 4 5 6 7 8 9 10
Earnings Percentil
Demographic Set Full Set
Source: Authors’ calculations using Household Surveys (World Bank)
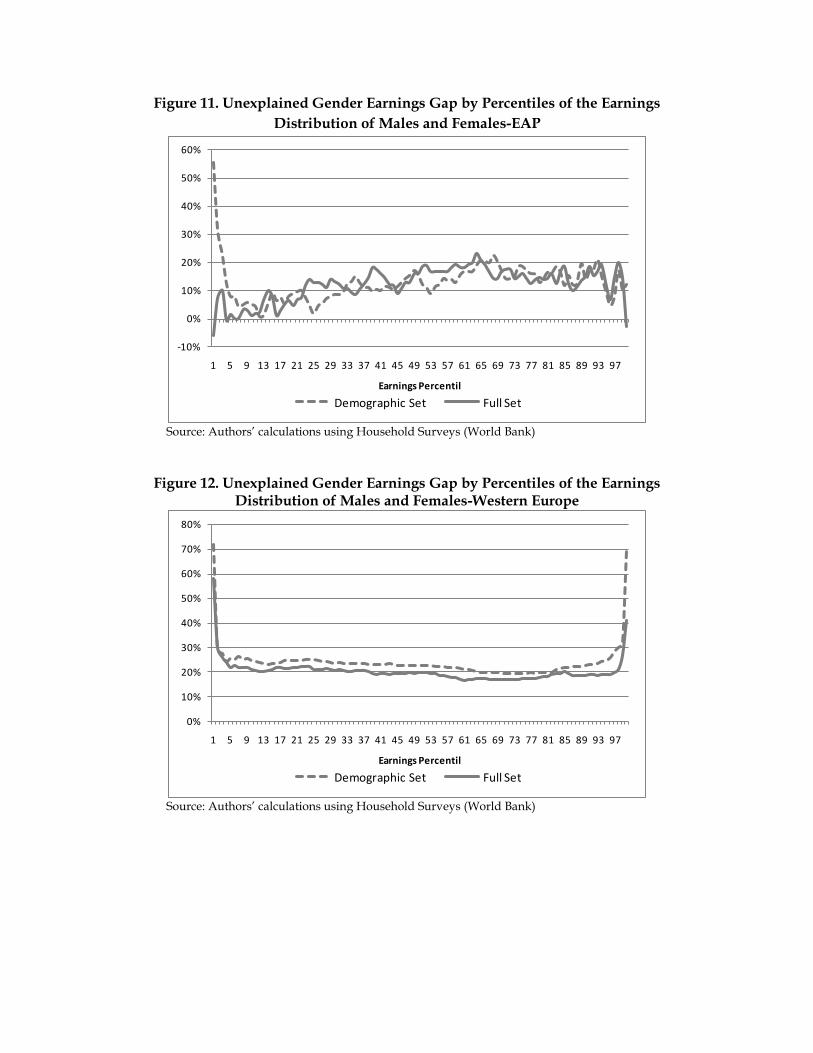
Figure 11. Unexplained Gender Earnings Gap by Percentiles of the Earnings
Distribution of Males and Females-EAP
-10%
0%
10%
20%
30%
40%
50%
60%
1 5 9 13 17 21 25 29 33 37 41 45 49 53 57 61 65 69 73 77 81 85 89 93 97
Earnings Percentil
Demographic Set Full Set
Source: Authors’ calculations using Household Surveys (World Bank)
Figure 12. Unexplained Gender Earnings Gap by Percentiles of the Earnings Distribution of Males and Females-Western Europe
0%
10%
20%
30%
40%
50%
60%
70%
80%
1 5 9 13 17 21 25 29 33 37 41 45 49 53 57 61 65 69 73 77 81 85 89 93 97
Earnings Percentil
Demographic Set Full Set
Source: Authors’ calculations using Household Surveys (World Bank)
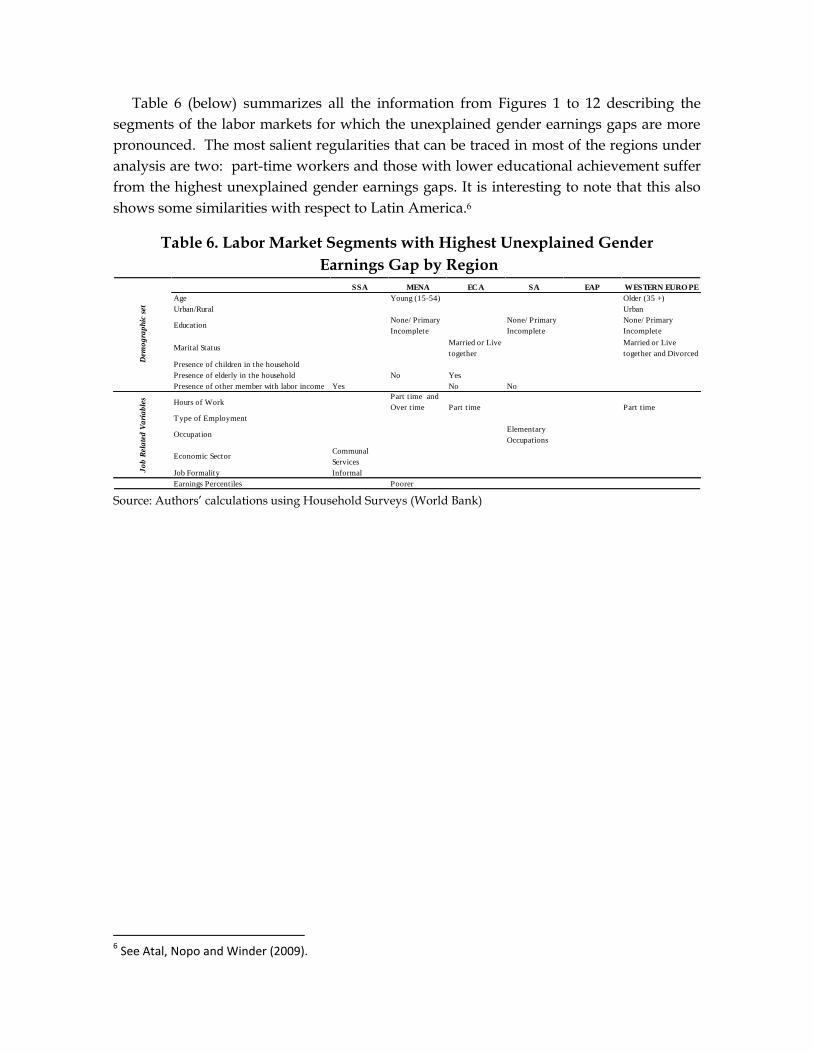
Table 6 (below) summarizes all the information from Figures 1 to 12 describing the
segments of the labor markets for which the unexplained gender earnings gaps are more
pronounced. The most salient regularities that can be traced in most of the regions under
analysis are two: part-time workers and those with lower educational achievement suffer
from the highest unexplained gender earnings gaps. It is interesting to note that this also
shows some similarities with respect to Latin America.6
Table 6. Labor Market Segments with Highest Unexplained Gender
Earnings Gap by Region
SSA MENA ECA SA EAP WESTERN EURO PE
Age Young (15-54) Older (35 +)
Urban/Rural Urban
EducationNone/ Primary
Incomplete
None/ Primary
Incomplete
None/ Primary
Incomplete
Marital StatusMarried or Live
together
Married or Live
together and Divorced
Presence of children in the household
Presence of elderly in the household No Yes
Presence of other member with labor income Yes No No
Hours of WorkPart time and
Over time Part time Part time
Type of Employment
OccupationElementary
Occupations
Economic SectorCommunal
Services
Job Formality Informal
Earnings Percentiles Poorer
Dem
og
rap
hic
set
Jo
b R
ela
ted
Va
ria
ble
s
Source: Authors’ calculations using Household Surveys (World Bank)
6 See Atal, Nopo and Winder (2009).
5. Gender Earnings Gap and the Economic, Cultural and Political Characteristics.
Having shown the heterogeneity on unexplained gender earnings gaps across the world, this section will explore the cross-country linkages of these disparities and other socio-economic and political variables. Figures 13 through 15 illustrate the correlation between the unexplained gender earnings gaps (the one that remains after controlling for the full set of matching variables described above) and GDP per-Capita, Institutionalized democracy and Predominant religion respectively.
Figure 13 plots GDP per capita, measured in 2005 PPP terms, against the unexplained component of the wage gap. The negative relationship between the two variables that the figure depicts is weak, as judged by the R-squared coefficient (0.0066). Without considering Luxemburg within the analysis the R-squared would increase (0.0377). Bigger economies tend to show smaller gender disparities, but the relationship is not too strong.
Figure 14 plots Institutionalized Democracy against the unexplained component of the wage gap, showing a positive relationship between both. Countries with more institutionalized democracies tend to show bigger unexplained gender disparities, although, as above, the relationship is not too strong.
Figure 15 show bar diagrams of the unexplained component of the gender earnings gaps groups by the predominant religion in the countries. The results show no clear pattern. If any, the unexplained gender earnings gaps are slightly higher in Muslim countries than in the rest of the world.
The results from comparing the unconditional gender earnings gaps with the same socio-economic and political indicators (available upon request) deliver similar results.

Figure 13. Unexplained Component of the Gender Earnings Gap against GDP per capita
Source: Authors’ calculations using World Bank Indicators.
Figure 14. Unexplained Component of the Gender Earnings Gap against Democracy Level
Source: Authors’ calculations using Policy IV Indicators. The Institutionalized Democracy indicator is an eleven-point scale (0-10) derived from indicators on the competitiveness of political participation, the openness and competitiveness of executive recruitment and constraints on the chief executive (See Annex 2 for details)
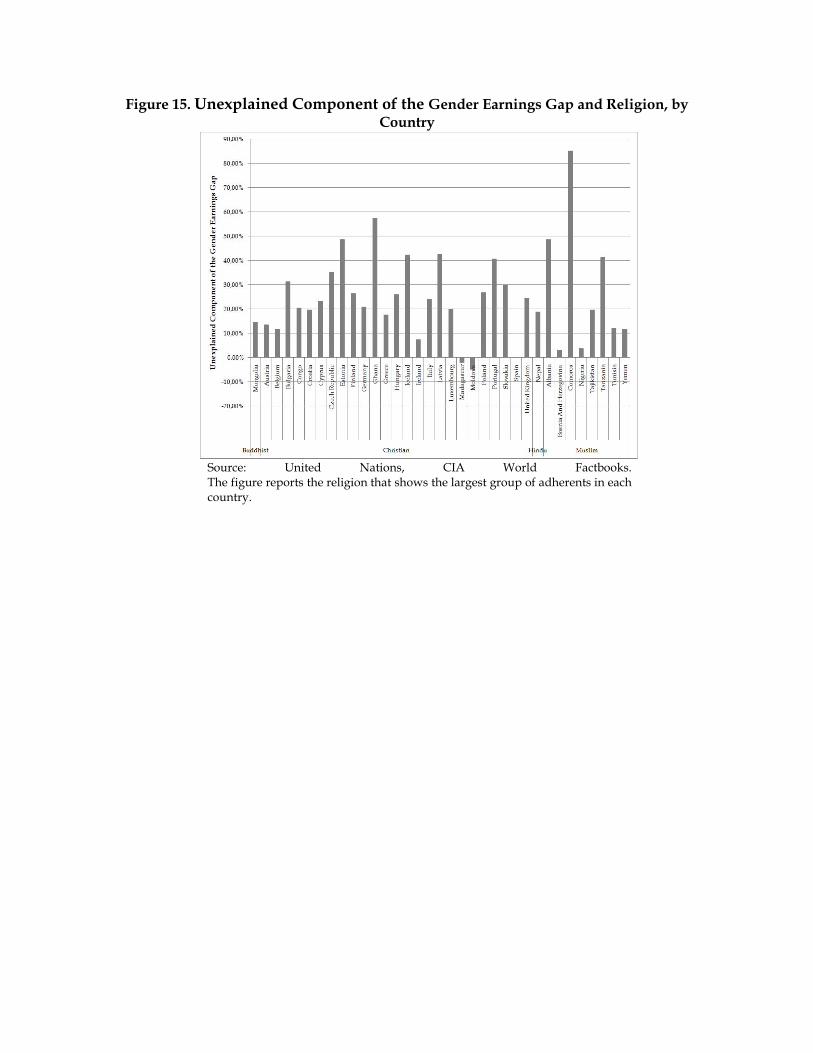
Figure 15. Unexplained Component of the Gender Earnings Gap and Religion, by Country
Source: United Nations, CIA World Factbooks. The figure reports the religion that shows the largest group of adherents in each country.
Concluding Remarks
This paper has presented gender earnings disparities for an as comprehensive as possible list of countries. A prominent result is the vast heterogeneity of gender differentials. An important component of those earnings differentials cannot be explained on the basis of gender differences in observable characteristics that the labor markets rewards. At a cross-country level, the gaps cannot be completely linked neither to socio-economic nor to political indicators. Much of the earnings gaps are yet to be explained.
Among the regularities that can be observed across the globe highlights the role of part-time work, a predominantly female way of participating in the labor markets which particularly suffers from higher unexplained gender disparities in pay. Another regularity, seen in most of the regions, is the fact that unexplained gender earnings disparities tend to be more pronounced among low-educated workers, and part-time workers. These regularities on the descriptive statistics of gender earnings gaps may serve as indications of areas for which more analytical work, with a stronger emphasis on causality, is needed for advancing the understanding of gender disparities.
References
Amuedo-Dorantes, C. and S. de la Rica. 2005. ―The Impact of Gender Segregation on Male-
Female Wage Differentials: Evidence from Matched Employer-Employee Data for
Spain.‖ IZA Discussion Paper No. 1742. Bonn, Germany: Institute for the Study of
Labor (IZA).
Angel-Urdinola, D. and Q. Wodon. Income Generation and Intra-Household Decision
Making: A Gender Analysis for Nigeria. En: World Bank. Gender Disparities in
Africa’s Labor Market. Washington, D.C, United States. World Bank. 2010. p. 381-
406.
Arumpalam, W., A. L. Booth., & M. L. Bryan. 2004. ―Is There a Glass Ceiling over Europe?
Exploring the Gender Wage Gap across the Wages Distribution.‖IZA Discussion
Paper No. 1373. Bonn, Germany: Institute for the Study of Labor (IZA).
Atal, J.P., H. Ñopo and N. Winder. 2009. ―New Century, Old Disparities. Gender and
Ethnic Wage Gaps in Latin America‖. Research Department Working Paper 109.
Washington, DC, United States: Inter-American Development Bank.
Backiny-Yetna, P. and Q. Wodon. Gender Labor Income Shares and Human Capital
Investment in the Republic of Congo. En: World Bank. Gender Disparities in Africa’s
Labor Market. Washington, D.C, United States. World Bank. 2010. p. 359-379.
Blau F. and L. Kahn. 2001. ―Understanding International Difference in the Gender Pay
Gap‖. National Bureau of Economic Research. Working paper 8200.
Brainerd, E. 2000. ―Women in Transition: Changes in Gender Wage Differentials in Eastern
Europe and then Former Soviet Union‖. Industrial and Labor Relations Review, Vol. 54,
No. 1 (Oct., 2000), pp. 138-162. Cornell University, School of Industrial & Labor
Relations. http://www.jstor.org/stable/2696036.
Calonico, Sebastian and Hugo Ñopo. 2009. ―Gender segregation in the workplace and
wage gaps: evidence from urban Mexico 1994–2004‖ in Research on Economic
Inequality. Vol 17 Editor(s): Yves Flückiger, Sean F. Reardon, Jacques Silber ISBN:
978-1-84855-786-4
Cornish, M. 2007. ―Closing The Global Gender Pay Gap: Securing Justice for Women’s
Work‖. Comparative Labor Law & Policy Journal 28(2), p. 220
Daly, A. et al. 2006. ―The Gender Wage Gap in Four Countries.‖ IZA Discussion Paper No.
1921. Bonn, Germany: Institute for the Study of Labor (IZA).
Dimova, R and I.N. Gang. 2004. ―Self-Selection and Earnings During Volatile Transition‖.
IZA Discussion Paper 1158. Bonn, Germany: Institute for the Study of Labor (IZA).
Dolado, J. J., V. Llorens., S. de la Rica. 2005. ―Ceiling and Floors: Gender Wage Gaps by
Education in Spain.‖ IZA Discussion Paper No. 1483. Bonn, Germany: Institute for
the Study of Labor (IZA).
El-Haddad, A. 2009. ―Labor Market Gender Discrimination under Structural Adjustment:
The Case of Egypt‖. SRC/CIDA Research Program on Gender and Work, Working Paper
series 003. Social Research Center, American University in Cairo, New Cairo
Campus. Cairo, Egipto.
Fafchamps, M., M. Sodelbom and N. Benhassine. 2008. ―Wage Gaps and Job Sorting in
African Manufacturing‖. ESRC Global Poverty Research Group. United Kingdom.
Hoyos, A. and H. Ñopo. 2010. ―Evolution of Gender Gaps in Latin America at the Turn of
the Twentieth Century: An addendum to ―New Century, Old Disparities‖‖.
Research Department Working Paper 176. Washington, DC, United States: Inter-
American Development Bank.
Imbert Clément. 2010. ―Decomposing Wage Inequality: Public and Private Sectors in
Vietnam 1993-2006‖. Paris, France: Paris School of Economics.
International Labour Organization (ILO). 2001. Women, Gender and Work. Geneve,
Switzerland:ILO.
Kandil Lamia, E. 2009. ―Gender Wage Discrimination in Egypt: A Quantile Regression
Analysis‖. Paris: Université Paris I Panthéon-Sorbonne.
Kolev, A. and N. Sirven. Gender Disparities in Africa’s Labor Markets: A Cross-Country
Comparison Using Standardized Survey Data. En: World Bank. Gender Disparities
in Africa’s Labor Market. Washington, D.C, United States. World Bank. 2010. p. 23-
53.
Kolev, A. and P. Suarez Robles. Exploring the Gender Pay Gap Through Different Age
Cohorts: The Case of Ethiopia. En: World Bank. Gender Disparities in Africa’s Labor
Market. Washington, D.C, United States. World Bank. 2010. p. 57-85.
Lehmann, H. and J. Wadsworth. 2001. ―Wage Arrears and the Distribution of Earnings in
Russia‖. IZA Discussion Paper 410. Bonn, Germany: Institute for the Study of Labor
(IZA).
Liu, A. Y. C. 2001. ―Gender Wage Gap in Transition in Vietnam.‖ International and
Development Economics Working Papers idec01-3. Canberra, Australia: The
Australian National University.
----. 2003. ―Gender Wage Gap in Vietnam.‖ International and Development Economics
Working Papers idec03-5. Canberra, Australia: The Australian National University.
Meng, X. 1998. ―The Economic Position of Women in Asia‖. CLARA Working Paper, No.
4. Amsterdam, Holanda: IIAS/IISG.
Montenegro, C. and Hirn M.L. 2008. ―A New Disaggregated Set of Labor Market
Indicators Using Standardized Household Surveys from Around the World‖.
Background paper, World Development Report. Washington DC, World Bank.
Newell, A. and R. Barry. 2001. ―The Gender Pay Gap in the Transition from Communism:
Some Empirical Evidence‖. IZA Discussion Paper 268. Bonn, Germany: Institute for
the Study of Labor (IZA).
Niimi, Y. 2009. ―Gender Equality and Inclusive Growth in Developing Asia‖. ADB
Economics Working Paper Series No. 186. Metro Manila, Philippines: Asian
Development Bank.
Niimi, Yoko. 2009. ―Gender Equality and Inclusive Growthin Developing Asia.‖
Economics Working Paper Series No. 186. Mandaluyong City, Phillipinnes: Asian
Development Bank.
Nordman, C.J., F. Rakotomanana and A.S. Robilliard. Gender Disparities in the Malagasy
Labor Market. En: World Bank. Gender Disparities in Africa’s Labor Market.
Washington, D.C, United States. World Bank. 2010. p. 87-153.
Nordman, C. and F.C. Wolff . 2006. ―Is There a Glass Ceiling in Morocco? Evidence from
Matched Worker-Firm Data‖. Paris, France: LEN, Faculté des Sciences Économiques,
Université de Nantes.
Nordman, C.J. and F. C. Wolff. Gender Differences in Pay in African Manufacturing Firms.
En: World Bank. Gender Disparities in Africa’s Labor Market. Washington, D.C,
United States. World Bank. 2010. p. 155-191.
Ñopo, H. 2006. ―The Gender Wage Gap in Chile 1992-2003 from a Matching Comparisons
Perspective.‖ Research Department Working Paper 562. Washington, DC, United
States: Inter-American Development Bank.
----. 2008. ―Matching as a Tool to Decompose Wage Gaps.‖ Review of Economics and
Statistics 90(2): 290-299.
Olivetti, C. and B. Petrongolo. 2006. ―Unequal Pay or Unequal Unemployment? A Cross-
Country Analysis of Gender Gaps. IZA Discussion Paper No. 1941. Bonn, Germany:
Institute for the Study of Labor (IZA).
Ostendorp, R. H. et al. 2006. ―Returns to Education and the Gender Wage Gap in
Vietnam.‖ Amsterdam, The Netherlands: Free University Amsterdam, Tinbergen
Institute.
Parra Osorio, J. P. and Q. Wodon. Gender, Time Use, and Labor Income in Guinea: Micro
and Macro Analyses. En: World Bank. Gender Disparities in Africa’s Labor Market.
Washington, D.C, United States. World Bank. 2010. p. 231-271.
----. How Does Growth Affect Labor Income by Gender? A Structural Path Analysis for
Tanzania. En: World Bank. Gender Disparities in Africa’s Labor Market.
Washington, D.C, United States. World Bank. 2010. p. 273-296.
Pastore, Francesco. 2010. ―The Gender Gap in Early Career in Mongolia.‖ International
Journal of Manpower 31(2):188-207.
Pham, T. H., B. Reilly. 2006. ―The Gender Pay Gap in Vietnam, 1993-2002: A Quantile
Regression Approach.‖ PRUS Working Paper No. 34.
Plasman, R. and S. Sissoko. 2004. ―Comparing Apples with Oranges: Revisiting the Gender
Gap in an International Perspective.‖ IZA Discussion Paper No. 1449. Bonn,
Germany: Institute for the Study of Labor (IZA).
Ricardo Hausmann, L. D. Tyson and S. Zahidi. 2010. ―The Global Gender Gap Report‖
World Economic Forum. Geneva, Switzerland.
Rückert, E. 2002. ―Decomposing Estonian Wages by Gender: A Quantile Regression
Approach of the Juhn, Murphy and Pierce Methodology‖. Centre for Economic
Reform and Transformation. Edinburgh: Heriot-Watt University School of
Management.
Ruggeri Laderchi, C., H. Lofgren and R. Abdula. Addressing Gender Inequality in
Ethiopia: Trends, Impacts, and the Way Forward. En: World Bank. Gender
Disparities in Africa’s Labor Market. Washington, D.C, United States. World Bank.
2010. p. 193-227.
Simón, H. 2007. ―The Gender Pay Gap in Europe: An International Comparison with
Matched Employer-Employee Data.‖ Alicante, Spain: Universidad de Alicante.
Son, H. H. 2007. ―Occupational Segregation and Gender Discrimination in Labor Markets:
Thailand and Viet Nam‖. Working Paper Series No. 108. Mandaluyong City,
Phillipinnes: Economics and Research Department, Asian Development Bank.
Suárez Robles, P. Gender Disparities in Time Allocation, Time Poverty, and Labor
Allocation Across Employment Sectors in Ethiopia. En: World Bank. Gender
Disparities in Africa’s Labor Market. Washington, D.C, United States. World Bank.
2010. p. 299-332.
Tansel. A. 2004. ―Public-Private Employment Choice, Wage Differentials and Gender in
Turkey‖. IZA Discussion Paper 1262. Bonn, Germany: Institute for the Study of
Labor (IZA).
Thomas Hertz, Paul Winters, A. P. de la O, E. J. Quiñones, B. Davis and A. Zezza. 2008.
―Wage Inequality In International Perspective: Effects of Location, Sector, And
Gender‖ ESA Working Paper No. 08-08.
Tzannatos, Z. 1999. ―Women And Labor Market Changes In The Global Economy: Growth
Helps, Inequalities Hurt and Public Policy Matters‖. The World Bank. Elsevier
Science.
Wagle Udaya, R. 2007 ―Are Economic Liberalization and Equality Compatible? Evidence
from South Asia‖. World Development Vol. 35, No. 11, pp. 1836–1857. Michigan,
USA: Western Michigan University, Kalamazoo.
Weichselbaumer, D., R. Winter-Ebmer and M. Zweimüller. 2007. ―Market Orientation and
Gender Wage Gaps: An International Study‖. Department of Economics Johannes
Kepler University of Linz.
Wodon, Q and Y. Ying. Domestic Work Time in Sierra Leone. En: World Bank. Gender
Disparities in Africa’s Labor Market. Washington, D.C, United States. World Bank.
2010. p. 333-356.
World Bank. Gender Equality in East Asia: Progress, and the Challenges of Economic
Growth and Political Change. East Asia Update. Washington, D.C, United States:
World Bank. Availabe at:
http://siteresources.worldbank.org/INTEAPHALFYEARLYUPDATE/Resources/g
enderequality.pdf.

Zweimüller, M., R. Winter-Ebmer and D. Weichselbaumer. 2007. ―Market Orientation and
Gender Wage Gaps: An International Study‖. Department of Economics Johannes Kepler
University of Linz. Working Paper No. 0712.
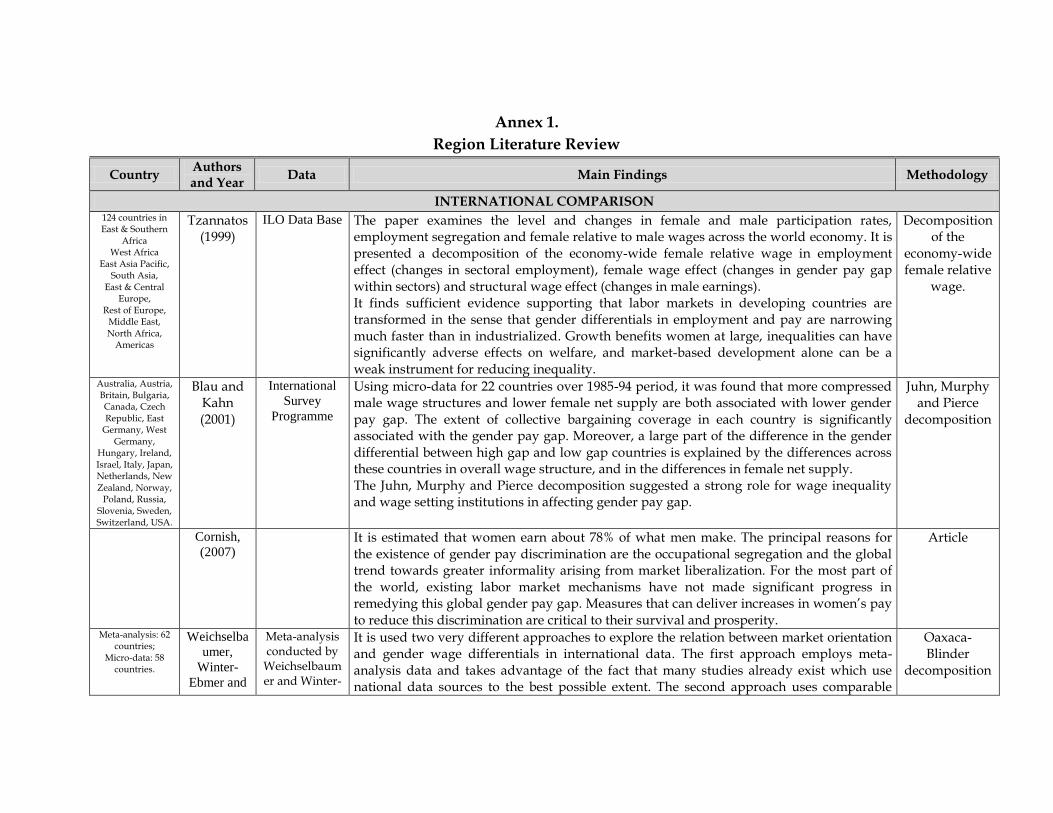
Annex 1.
Region Literature Review
Country Authors and Year
Data Main Findings Methodology
INTERNATIONAL COMPARISON 124 countries in East & Southern
Africa West Africa
East Asia Pacific, South Asia,
East & Central Europe,
Rest of Europe, Middle East, North Africa,
Americas
Tzannatos (1999)
ILO Data Base The paper examines the level and changes in female and male participation rates, employment segregation and female relative to male wages across the world economy. It is presented a decomposition of the economy-wide female relative wage in employment effect (changes in sectoral employment), female wage effect (changes in gender pay gap within sectors) and structural wage effect (changes in male earnings). It finds sufficient evidence supporting that labor markets in developing countries are transformed in the sense that gender differentials in employment and pay are narrowing much faster than in industrialized. Growth benefits women at large, inequalities can have significantly adverse effects on welfare, and market-based development alone can be a weak instrument for reducing inequality.
Decomposition of the
economy-wide female relative
wage.
Australia, Austria, Britain, Bulgaria, Canada, Czech Republic, East
Germany, West
Germany, Hungary, Ireland, Israel, Italy, Japan, Netherlands, New Zealand, Norway,
Poland, Russia, Slovenia, Sweden, Switzerland, USA.
Blau and Kahn (2001)
International
Survey
Programme
Using micro-data for 22 countries over 1985-94 period, it was found that more compressed male wage structures and lower female net supply are both associated with lower gender pay gap. The extent of collective bargaining coverage in each country is significantly associated with the gender pay gap. Moreover, a large part of the difference in the gender differential between high gap and low gap countries is explained by the differences across these countries in overall wage structure, and in the differences in female net supply. The Juhn, Murphy and Pierce decomposition suggested a strong role for wage inequality and wage setting institutions in affecting gender pay gap.
Juhn, Murphy and Pierce
decomposition
Cornish,
(2007) It is estimated that women earn about 78% of what men make. The principal reasons for
the existence of gender pay discrimination are the occupational segregation and the global trend towards greater informality arising from market liberalization. For the most part of the world, existing labor market mechanisms have not made significant progress in remedying this global gender pay gap. Measures that can deliver increases in women’s pay to reduce this discrimination are critical to their survival and prosperity.
Article
Meta-analysis: 62 countries;
Micro-data: 58 countries.
Weichselba
umer,
Winter-
Ebmer and
Meta-analysis conducted by
Weichselbaumer and Winter-
It is used two very different approaches to explore the relation between market orientation and gender wage differentials in international data. The first approach employs meta-analysis data and takes advantage of the fact that many studies already exist which use national data sources to the best possible extent. The second approach uses comparable
Oaxaca- Blinder
decomposition
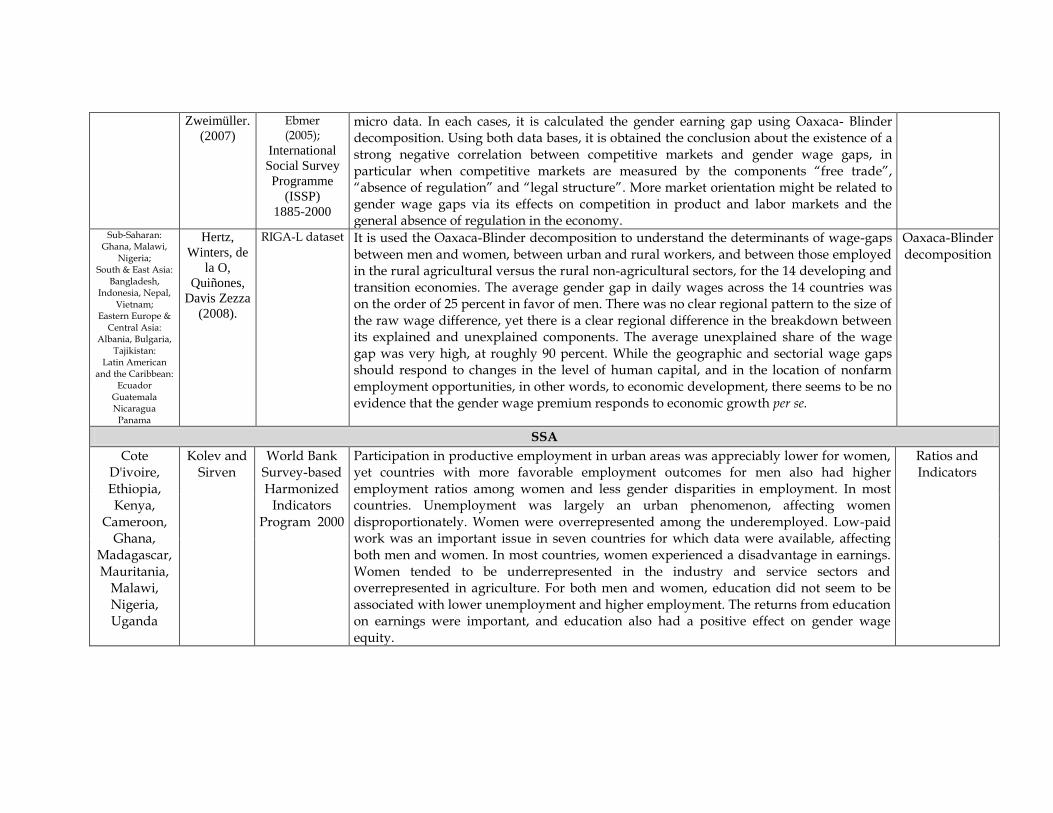
Zweimüller.
(2007)
Ebmer (2005);
International
Social Survey
Programme
(ISSP)
1885-2000
micro data. In each cases, it is calculated the gender earning gap using Oaxaca- Blinder decomposition. Using both data bases, it is obtained the conclusion about the existence of a strong negative correlation between competitive markets and gender wage gaps, in particular when competitive markets are measured by the components ―free trade‖, ―absence of regulation‖ and ―legal structure‖. More market orientation might be related to gender wage gaps via its effects on competition in product and labor markets and the general absence of regulation in the economy.
Sub‐Saharan: Ghana, Malawi,
Nigeria; South & East Asia:
Bangladesh, Indonesia, Nepal,
Vietnam; Eastern Europe &
Central Asia: Albania, Bulgaria,
Tajikistan: Latin American
and the Caribbean: Ecuador
Guatemala Nicaragua
Panama
Hertz,
Winters, de
la O,
Quiñones,
Davis Zezza
(2008).
RIGA-L dataset It is used the Oaxaca-Blinder decomposition to understand the determinants of wage-gaps between men and women, between urban and rural workers, and between those employed in the rural agricultural versus the rural non-agricultural sectors, for the 14 developing and transition economies. The average gender gap in daily wages across the 14 countries was on the order of 25 percent in favor of men. There was no clear regional pattern to the size of the raw wage difference, yet there is a clear regional difference in the breakdown between its explained and unexplained components. The average unexplained share of the wage gap was very high, at roughly 90 percent. While the geographic and sectorial wage gaps should respond to changes in the level of human capital, and in the location of nonfarm employment opportunities, in other words, to economic development, there seems to be no evidence that the gender wage premium responds to economic growth per se.
Oaxaca-Blinder decomposition
SSA
Cote D'ivoire, Ethiopia, Kenya,
Cameroon, Ghana,
Madagascar, Mauritania,
Malawi, Nigeria, Uganda
Kolev and Sirven
World Bank Survey-based Harmonized
Indicators Program 2000
Participation in productive employment in urban areas was appreciably lower for women, yet countries with more favorable employment outcomes for men also had higher employment ratios among women and less gender disparities in employment. In most countries. Unemployment was largely an urban phenomenon, affecting women disproportionately. Women were overrepresented among the underemployed. Low-paid work was an important issue in seven countries for which data were available, affecting both men and women. In most countries, women experienced a disadvantage in earnings. Women tended to be underrepresented in the industry and service sectors and overrepresented in agriculture. For both men and women, education did not seem to be associated with lower unemployment and higher employment. The returns from education on earnings were important, and education also had a positive effect on gender wage equity.
Ratios and Indicators
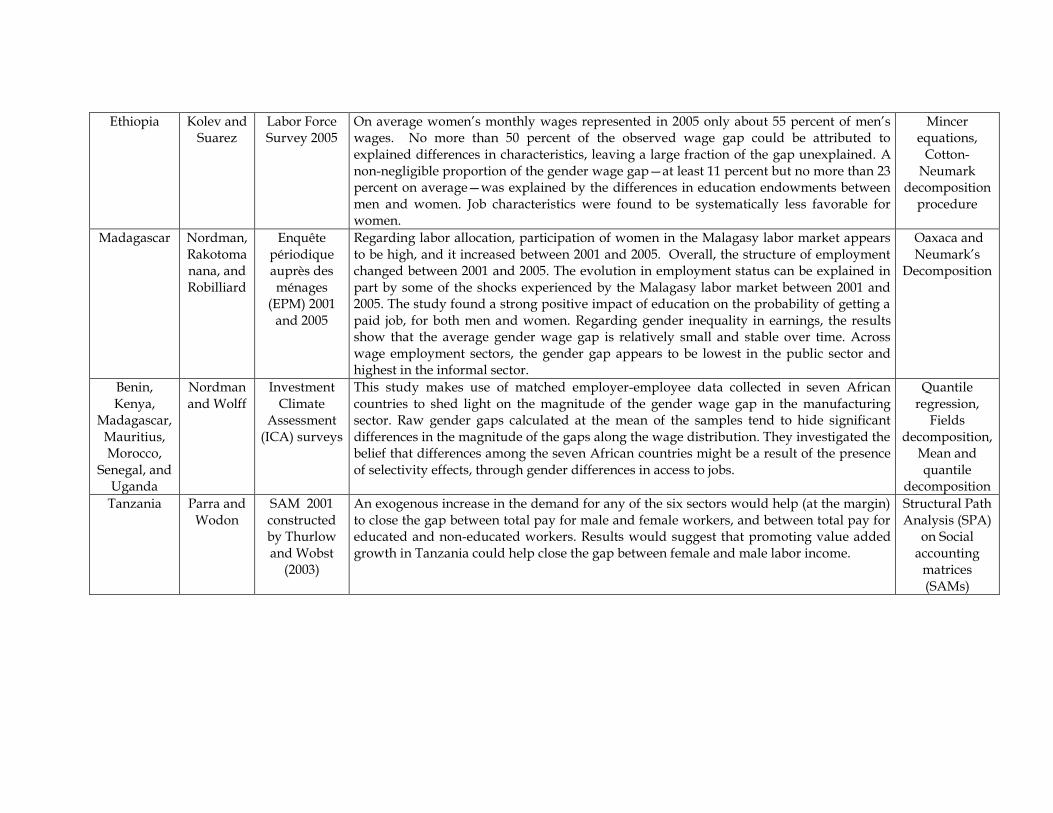
Ethiopia Kolev and Suarez
Labor Force Survey 2005
On average women’s monthly wages represented in 2005 only about 55 percent of men’s wages. No more than 50 percent of the observed wage gap could be attributed to explained differences in characteristics, leaving a large fraction of the gap unexplained. A non-negligible proportion of the gender wage gap—at least 11 percent but no more than 23 percent on average—was explained by the differences in education endowments between men and women. Job characteristics were found to be systematically less favorable for women.
Mincer equations,
Cotton-Neumark
decomposition procedure
Madagascar Nordman, Rakotomanana, and Robilliard
Enquête périodique auprès des ménages
(EPM) 2001 and 2005
Regarding labor allocation, participation of women in the Malagasy labor market appears to be high, and it increased between 2001 and 2005. Overall, the structure of employment changed between 2001 and 2005. The evolution in employment status can be explained in part by some of the shocks experienced by the Malagasy labor market between 2001 and 2005. The study found a strong positive impact of education on the probability of getting a paid job, for both men and women. Regarding gender inequality in earnings, the results show that the average gender wage gap is relatively small and stable over time. Across wage employment sectors, the gender gap appears to be lowest in the public sector and highest in the informal sector.
Oaxaca and Neumark’s
Decomposition
Benin, Kenya,
Madagascar, Mauritius, Morocco,
Senegal, and Uganda
Nordman and Wolff
Investment Climate
Assessment (ICA) surveys
This study makes use of matched employer-employee data collected in seven African countries to shed light on the magnitude of the gender wage gap in the manufacturing sector. Raw gender gaps calculated at the mean of the samples tend to hide significant differences in the magnitude of the gaps along the wage distribution. They investigated the belief that differences among the seven African countries might be a result of the presence of selectivity effects, through gender differences in access to jobs.
Quantile regression,
Fields decomposition,
Mean and quantile
decomposition
Tanzania Parra and Wodon
SAM 2001 constructed by Thurlow and Wobst
(2003)
An exogenous increase in the demand for any of the six sectors would help (at the margin) to close the gap between total pay for male and female workers, and between total pay for educated and non-educated workers. Results would suggest that promoting value added growth in Tanzania could help close the gap between female and male labor income.
Structural Path Analysis (SPA)
on Social accounting
matrices (SAMs)
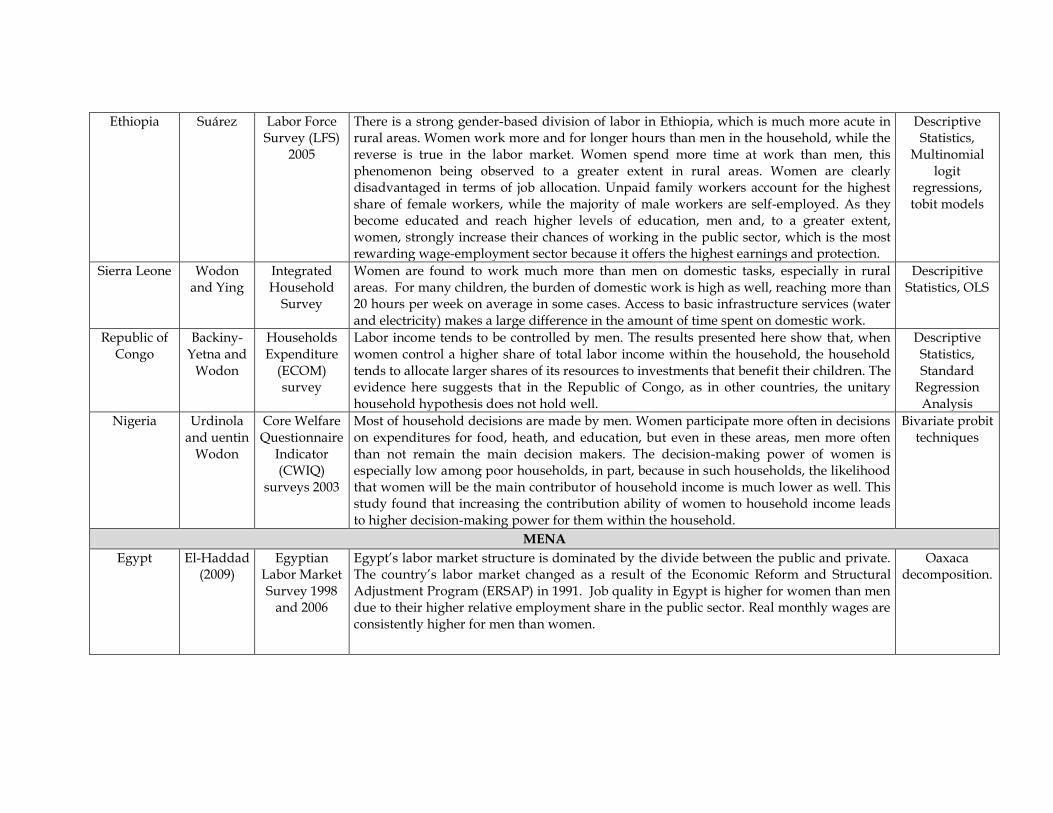
Ethiopia Suárez Labor Force Survey (LFS)
2005
There is a strong gender-based division of labor in Ethiopia, which is much more acute in rural areas. Women work more and for longer hours than men in the household, while the reverse is true in the labor market. Women spend more time at work than men, this phenomenon being observed to a greater extent in rural areas. Women are clearly disadvantaged in terms of job allocation. Unpaid family workers account for the highest share of female workers, while the majority of male workers are self-employed. As they become educated and reach higher levels of education, men and, to a greater extent, women, strongly increase their chances of working in the public sector, which is the most rewarding wage-employment sector because it offers the highest earnings and protection.
Descriptive Statistics,
Multinomial logit
regressions, tobit models
Sierra Leone Wodon and Ying
Integrated Household
Survey
Women are found to work much more than men on domestic tasks, especially in rural areas. For many children, the burden of domestic work is high as well, reaching more than 20 hours per week on average in some cases. Access to basic infrastructure services (water and electricity) makes a large difference in the amount of time spent on domestic work.
Descripitive Statistics, OLS
Republic of Congo
Backiny-Yetna and
Wodon
Households Expenditure
(ECOM) survey
Labor income tends to be controlled by men. The results presented here show that, when women control a higher share of total labor income within the household, the household tends to allocate larger shares of its resources to investments that benefit their children. The evidence here suggests that in the Republic of Congo, as in other countries, the unitary household hypothesis does not hold well.
Descriptive Statistics, Standard
Regression Analysis
Nigeria Urdinola and uentin
Wodon
Core Welfare Questionnaire
Indicator (CWIQ)
surveys 2003
Most of household decisions are made by men. Women participate more often in decisions on expenditures for food, heath, and education, but even in these areas, men more often than not remain the main decision makers. The decision-making power of women is especially low among poor households, in part, because in such households, the likelihood that women will be the main contributor of household income is much lower as well. This study found that increasing the contribution ability of women to household income leads to higher decision-making power for them within the household.
Bivariate probit techniques
MENA
Egypt El-Haddad (2009)
Egyptian Labor Market Survey 1998
and 2006
Egypt’s labor market structure is dominated by the divide between the public and private. The country’s labor market changed as a result of the Economic Reform and Structural Adjustment Program (ERSAP) in 1991. Job quality in Egypt is higher for women than men due to their higher relative employment share in the public sector. Real monthly wages are consistently higher for men than women.
Oaxaca decomposition.
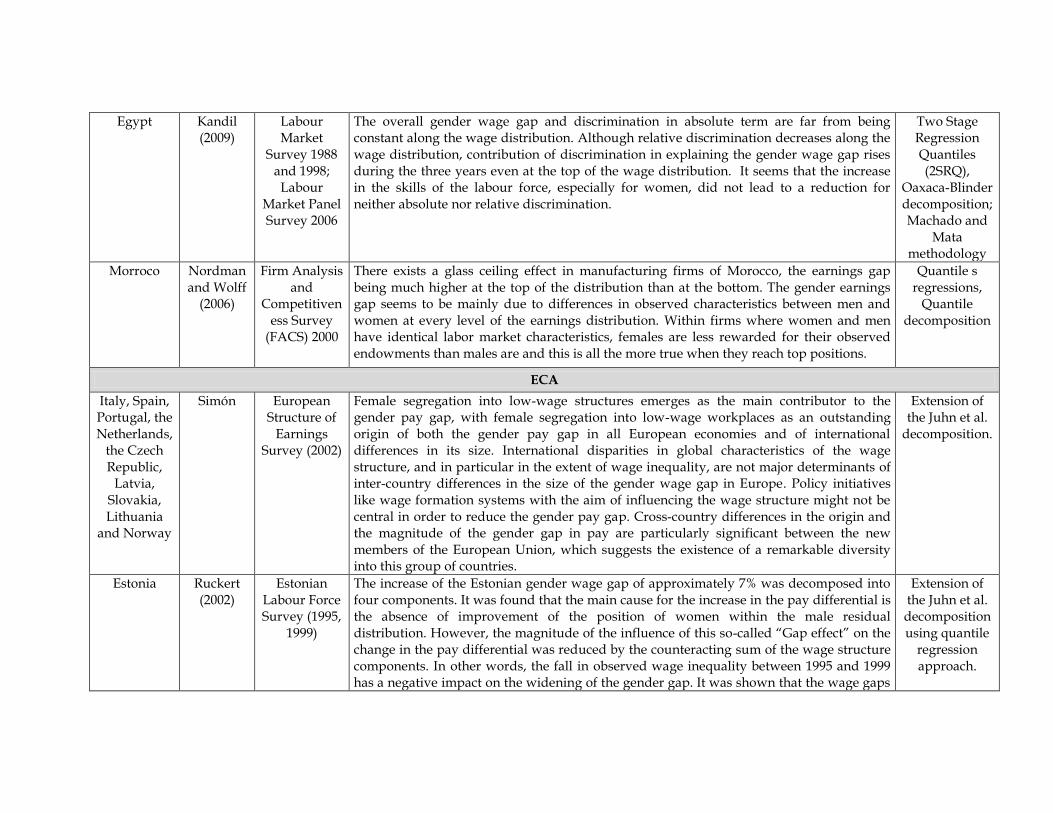
Egypt Kandil (2009)
Labour Market
Survey 1988 and 1998; Labour
Market Panel Survey 2006
The overall gender wage gap and discrimination in absolute term are far from being constant along the wage distribution. Although relative discrimination decreases along the wage distribution, contribution of discrimination in explaining the gender wage gap rises during the three years even at the top of the wage distribution. It seems that the increase in the skills of the labour force, especially for women, did not lead to a reduction for neither absolute nor relative discrimination.
Two Stage Regression Quantiles (2SRQ),
Oaxaca-Blinder decomposition; Machado and
Mata methodology
Morroco Nordman and Wolff
(2006)
Firm Analysis and
Competitiveness Survey
(FACS) 2000
There exists a glass ceiling effect in manufacturing firms of Morocco, the earnings gap being much higher at the top of the distribution than at the bottom. The gender earnings gap seems to be mainly due to differences in observed characteristics between men and women at every level of the earnings distribution. Within firms where women and men have identical labor market characteristics, females are less rewarded for their observed endowments than males are and this is all the more true when they reach top positions.
Quantile s regressions,
Quantile decomposition
ECA
Italy, Spain, Portugal, the Netherlands,
the Czech Republic,
Latvia, Slovakia, Lithuania
and Norway
Simón European Structure of
Earnings Survey (2002)
Female segregation into low-wage structures emerges as the main contributor to the gender pay gap, with female segregation into low-wage workplaces as an outstanding origin of both the gender pay gap in all European economies and of international differences in its size. International disparities in global characteristics of the wage structure, and in particular in the extent of wage inequality, are not major determinants of inter-country differences in the size of the gender wage gap in Europe. Policy initiatives like wage formation systems with the aim of influencing the wage structure might not be central in order to reduce the gender pay gap. Cross-country differences in the origin and the magnitude of the gender gap in pay are particularly significant between the new members of the European Union, which suggests the existence of a remarkable diversity into this group of countries.
Extension of the Juhn et al.
decomposition.
Estonia Ruckert (2002)
Estonian Labour Force Survey (1995,
1999)
The increase of the Estonian gender wage gap of approximately 7% was decomposed into four components. It was found that the main cause for the increase in the pay differential is the absence of improvement of the position of women within the male residual distribution. However, the magnitude of the influence of this so-called ―Gap effect‖ on the change in the pay differential was reduced by the counteracting sum of the wage structure components. In other words, the fall in observed wage inequality between 1995 and 1999 has a negative impact on the widening of the gender gap. It was shown that the wage gaps
Extension of the Juhn et al. decomposition using quantile
regression approach.
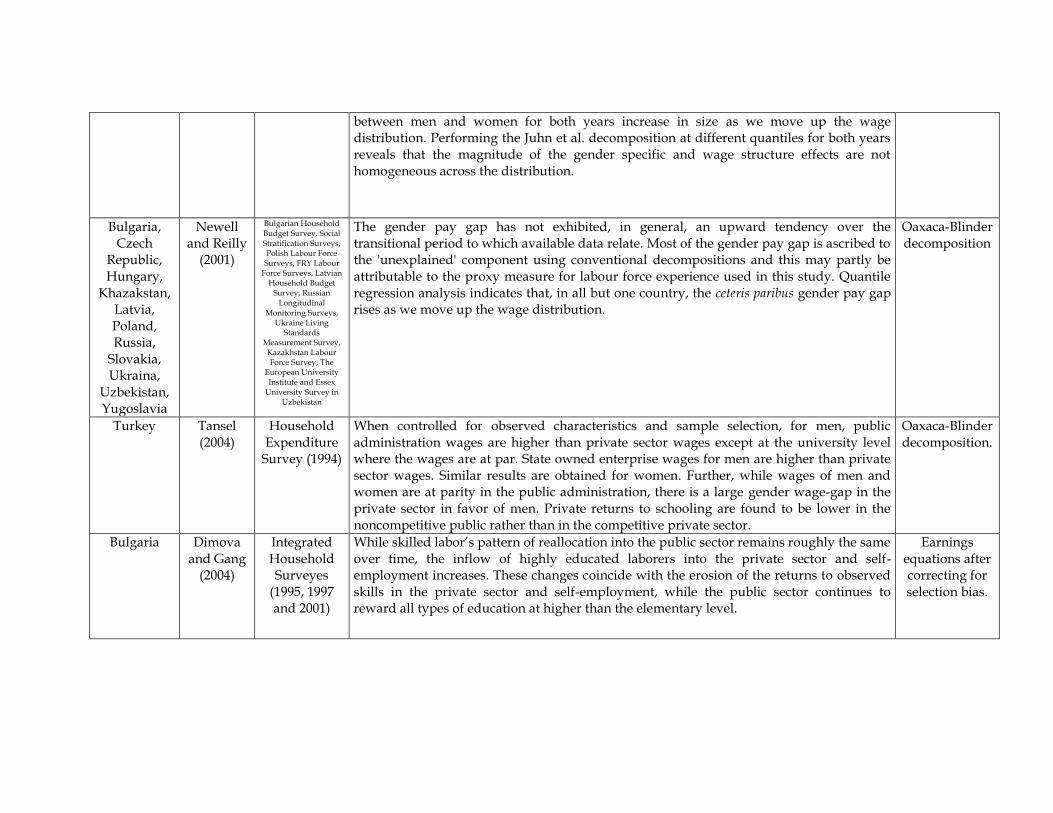
between men and women for both years increase in size as we move up the wage distribution. Performing the Juhn et al. decomposition at different quantiles for both years reveals that the magnitude of the gender specific and wage structure effects are not homogeneous across the distribution.
Bulgaria, Czech
Republic, Hungary,
Khazakstan, Latvia, Poland, Russia,
Slovakia, Ukraina,
Uzbekistan, Yugoslavia
Newell and Reilly
(2001)
Bulgarian Household Budget Survey, Social Stratification Surveys, Polish Labour Force
Surveys, FRY Labour Force Surveys, Latvian
Household Budget Survey, Russian
Longitudinal Monitoring Surveys,
Ukraine Living Standards
Measurement Survey, Kazakhstan Labour Force Survey, The
European University Institute and Essex
University Survey in Uzbekistan
The gender pay gap has not exhibited, in general, an upward tendency over the transitional period to which available data relate. Most of the gender pay gap is ascribed to the 'unexplained' component using conventional decompositions and this may partly be attributable to the proxy measure for labour force experience used in this study. Quantile regression analysis indicates that, in all but one country, the ceteris paribus gender pay gap rises as we move up the wage distribution.
Oaxaca-Blinder decomposition
Turkey Tansel (2004)
Household Expenditure
Survey (1994)
When controlled for observed characteristics and sample selection, for men, public administration wages are higher than private sector wages except at the university level where the wages are at par. State owned enterprise wages for men are higher than private sector wages. Similar results are obtained for women. Further, while wages of men and women are at parity in the public administration, there is a large gender wage-gap in the private sector in favor of men. Private returns to schooling are found to be lower in the noncompetitive public rather than in the competitive private sector.
Oaxaca-Blinder decomposition.
Bulgaria Dimova and Gang
(2004)
Integrated Household Surveyes
(1995, 1997 and 2001)
While skilled labor’s pattern of reallocation into the public sector remains roughly the same over time, the inflow of highly educated laborers into the private sector and self-employment increases. These changes coincide with the erosion of the returns to observed skills in the private sector and self-employment, while the public sector continues to reward all types of education at higher than the elementary level.
Earnings equations after correcting for selection bias.
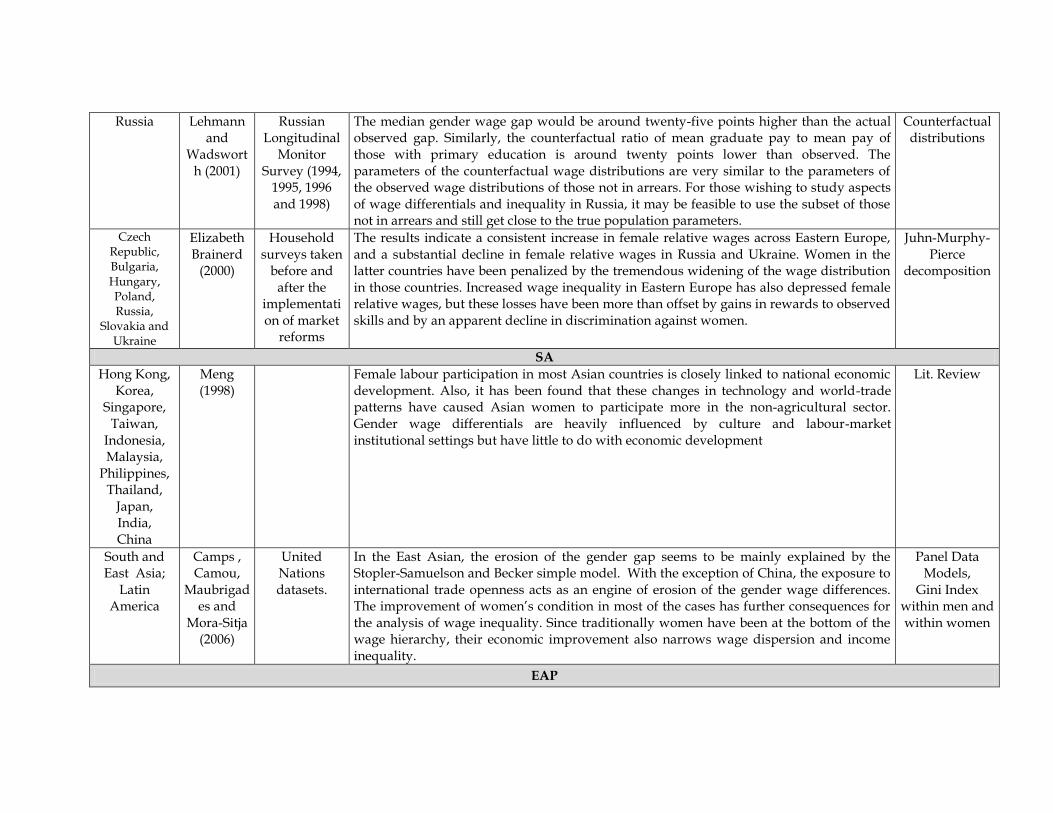
Russia Lehmann and
Wadsworth (2001)
Russian Longitudinal
Monitor Survey (1994,
1995, 1996 and 1998)
The median gender wage gap would be around twenty-five points higher than the actual observed gap. Similarly, the counterfactual ratio of mean graduate pay to mean pay of those with primary education is around twenty points lower than observed. The parameters of the counterfactual wage distributions are very similar to the parameters of the observed wage distributions of those not in arrears. For those wishing to study aspects of wage differentials and inequality in Russia, it may be feasible to use the subset of those not in arrears and still get close to the true population parameters.
Counterfactual distributions
Czech Republic, Bulgaria, Hungary, Poland, Russia,
Slovakia and Ukraine
Elizabeth Brainerd
(2000)
Household surveys taken
before and after the
implementation of market
reforms
The results indicate a consistent increase in female relative wages across Eastern Europe, and a substantial decline in female relative wages in Russia and Ukraine. Women in the latter countries have been penalized by the tremendous widening of the wage distribution in those countries. Increased wage inequality in Eastern Europe has also depressed female relative wages, but these losses have been more than offset by gains in rewards to observed skills and by an apparent decline in discrimination against women.
Juhn-Murphy-Pierce
decomposition
SA
Hong Kong, Korea,
Singapore, Taiwan,
Indonesia, Malaysia,
Philippines, Thailand,
Japan, India, China
Meng (1998)
Female labour participation in most Asian countries is closely linked to national economic development. Also, it has been found that these changes in technology and world-trade patterns have caused Asian women to participate more in the non-agricultural sector. Gender wage differentials are heavily influenced by culture and labour-market institutional settings but have little to do with economic development
Lit. Review
South and East Asia;
Latin America
Camps , Camou,
Maubrigades and
Mora-Sitja (2006)
United Nations datasets.
In the East Asian, the erosion of the gender gap seems to be mainly explained by the Stopler-Samuelson and Becker simple model. With the exception of China, the exposure to international trade openness acts as an engine of erosion of the gender wage differences. The improvement of women’s condition in most of the cases has further consequences for the analysis of wage inequality. Since traditionally women have been at the bottom of the wage hierarchy, their economic improvement also narrows wage dispersion and income inequality.
Panel Data Models,
Gini Index within men and within women
EAP
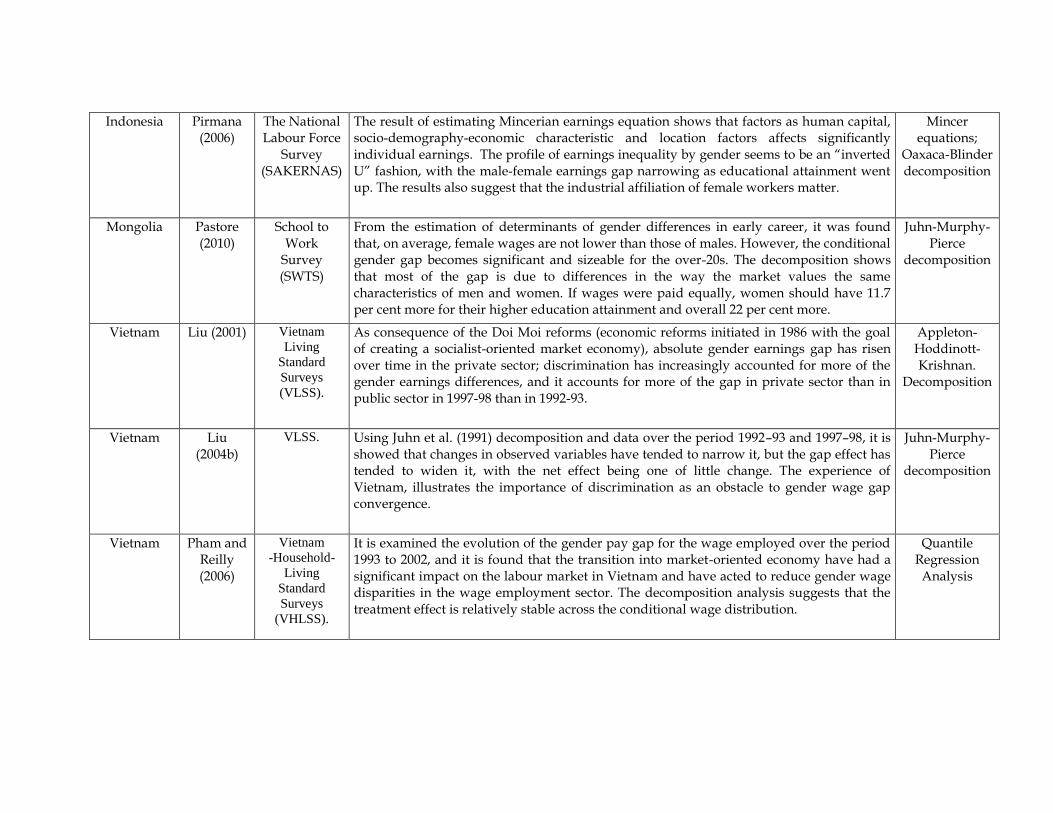
Indonesia Pirmana (2006)
The National Labour Force
Survey (SAKERNAS)
The result of estimating Mincerian earnings equation shows that factors as human capital, socio-demography-economic characteristic and location factors affects significantly individual earnings. The profile of earnings inequality by gender seems to be an ―inverted U‖ fashion, with the male-female earnings gap narrowing as educational attainment went up. The results also suggest that the industrial affiliation of female workers matter.
Mincer equations;
Oaxaca-Blinder decomposition
Mongolia Pastore (2010)
School to Work
Survey (SWTS)
From the estimation of determinants of gender differences in early career, it was found that, on average, female wages are not lower than those of males. However, the conditional gender gap becomes significant and sizeable for the over-20s. The decomposition shows that most of the gap is due to differences in the way the market values the same characteristics of men and women. If wages were paid equally, women should have 11.7 per cent more for their higher education attainment and overall 22 per cent more.
Juhn-Murphy-Pierce
decomposition
Vietnam Liu (2001) Vietnam
Living
Standard
Surveys
(VLSS).
As consequence of the Doi Moi reforms (economic reforms initiated in 1986 with the goal of creating a socialist-oriented market economy), absolute gender earnings gap has risen over time in the private sector; discrimination has increasingly accounted for more of the gender earnings differences, and it accounts for more of the gap in private sector than in public sector in 1997-98 than in 1992-93.
Appleton- Hoddinott- Krishnan.
Decomposition
Vietnam Liu (2004b)
VLSS. Using Juhn et al. (1991) decomposition and data over the period 1992–93 and 1997–98, it is showed that changes in observed variables have tended to narrow it, but the gap effect has tended to widen it, with the net effect being one of little change. The experience of Vietnam, illustrates the importance of discrimination as an obstacle to gender wage gap convergence.
Juhn-Murphy-Pierce
decomposition
Vietnam Pham and Reilly (2006)
Vietnam
-Household-
Living
Standard
Surveys
(VHLSS).
It is examined the evolution of the gender pay gap for the wage employed over the period 1993 to 2002, and it is found that the transition into market-oriented economy have had a significant impact on the labour market in Vietnam and have acted to reduce gender wage disparities in the wage employment sector. The decomposition analysis suggests that the treatment effect is relatively stable across the conditional wage distribution.
Quantile Regression Analysis
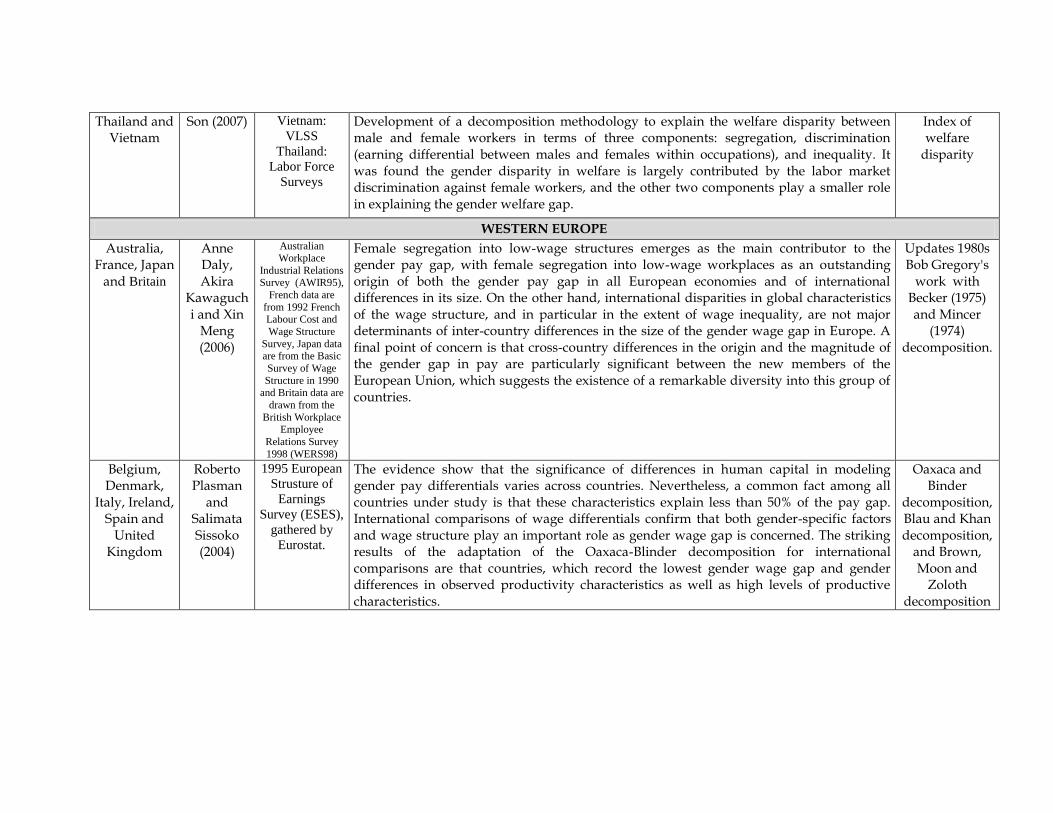
Thailand and Vietnam
Son (2007) Vietnam:
VLSS
Thailand:
Labor Force
Surveys
Development of a decomposition methodology to explain the welfare disparity between male and female workers in terms of three components: segregation, discrimination (earning differential between males and females within occupations), and inequality. It was found the gender disparity in welfare is largely contributed by the labor market discrimination against female workers, and the other two components play a smaller role in explaining the gender welfare gap.
Index of welfare
disparity
WESTERN EUROPE
Australia, France, Japan
and Britain
Anne Daly, Akira
Kawaguchi and Xin
Meng (2006)
Australian Workplace
Industrial Relations Survey (AWIR95),
French data are
from 1992 French Labour Cost and
Wage Structure
Survey, Japan data are from the Basic
Survey of Wage
Structure in 1990 and Britain data are
drawn from the
British Workplace Employee
Relations Survey
1998 (WERS98)
Female segregation into low-wage structures emerges as the main contributor to the gender pay gap, with female segregation into low-wage workplaces as an outstanding origin of both the gender pay gap in all European economies and of international differences in its size. On the other hand, international disparities in global characteristics of the wage structure, and in particular in the extent of wage inequality, are not major determinants of inter-country differences in the size of the gender wage gap in Europe. A final point of concern is that cross-country differences in the origin and the magnitude of the gender gap in pay are particularly significant between the new members of the European Union, which suggests the existence of a remarkable diversity into this group of countries.
Updates 1980s Bob Gregory's
work with Becker (1975) and Mincer
(1974) decomposition.
Belgium, Denmark,
Italy, Ireland, Spain and
United Kingdom
Roberto Plasman
and Salimata Sissoko (2004)
1995 European
Strusture of
Earnings
Survey (ESES),
gathered by
Eurostat.
The evidence show that the significance of differences in human capital in modeling gender pay differentials varies across countries. Nevertheless, a common fact among all countries under study is that these characteristics explain less than 50% of the pay gap. International comparisons of wage differentials confirm that both gender-specific factors and wage structure play an important role as gender wage gap is concerned. The striking results of the adaptation of the Oaxaca-Blinder decomposition for international comparisons are that countries, which record the lowest gender wage gap and gender differences in observed productivity characteristics as well as high levels of productive characteristics.
Oaxaca and Binder
decomposition, Blau and Khan decomposition,
and Brown, Moon and
Zoloth decomposition

Austria, Belgium, Britain,
Denmark, Dinland, France,
Germany, Ireland, Italy, Netherlands and Spain.
Wiji Arulampalam, Alison
L. Booth and Mark L. Bryan
(2004)
European
Community
Household
Panel (ECHP)
The gender pay gaps are typically bigger at the top of the wage distribution, a finding that is consistent with the existence of grass ceilings. For some countries gender pay gaps are also bigger at the bottom of the wage distribution, a finding that is consistent with sticky floors. The gender pay gap is typically higher at the top than the bottom end of the wage distribution, suggesting that glasses ceilings are more prevalent than sticky floors and that these prevail in the majority of our countries. The gender pay gap differs significantly across the public and private sector wage distribution of each country.
Quantile regression Analysis
Spain Catalina Amuedo-Dorantes and Sara de la Rica
(2005)
1995 and 2002
Spanish Wage
Structure
Surveys (EES-
95 and EES-
02)
The raw gender wage gap decreased from 0.26 to 0.22 over the course of seven years. However, even after accounting for workers' human capital, job characteristics, female segregation into lower-paying industries, occupations, establishments, and occupations within establishments, women still earned approximately 13 percent and 16 percent less than similar male counterparts as for 1995 and 2002, respectively. Most of the gender wage gap is attributable to workers’ sex. Yet, female segregation into lower-paying occupations within establishments, establishments and industries accounted for a sizable and growing fraction of the female-male wage differential.
Bayard, Hellerstein,
Neumark and Troske
estimation, pooled OLS, fixed-effects, augmented pooled OLS.
United States, United
Kingdom, Finland,
Denmark, Germany,
Netherlands, Belgium, Austria, Ireland,
France, Italy, Spain,
Portugal and Greece.
Claudia Olivetti
and Barbara
Petrongolo (2006)
Panel Study of
Income
Dynamics
(PSID) for the
US and the
European
Community
Household
Panel Survey
(ECHPS) for
Europe. Period
1994-2001.
Recover information on wages for those not in works in a given year using alternative imputation techniques. Imputation is based on (i) wage observations from other waves in the sample, (ii) observable characteristics of the non-employed and (iii) a statistical repeated-sampling model. The authors estimate median wage gaps on the resulting imputed wage distributions and obtain higher median wage gaps on imputed rather than actual wage distributions for most countries in the sample. Correction for employment selection explains more than a half of the observed correlation between wage and employments gaps.
Heckman's two-stage
parametric approach
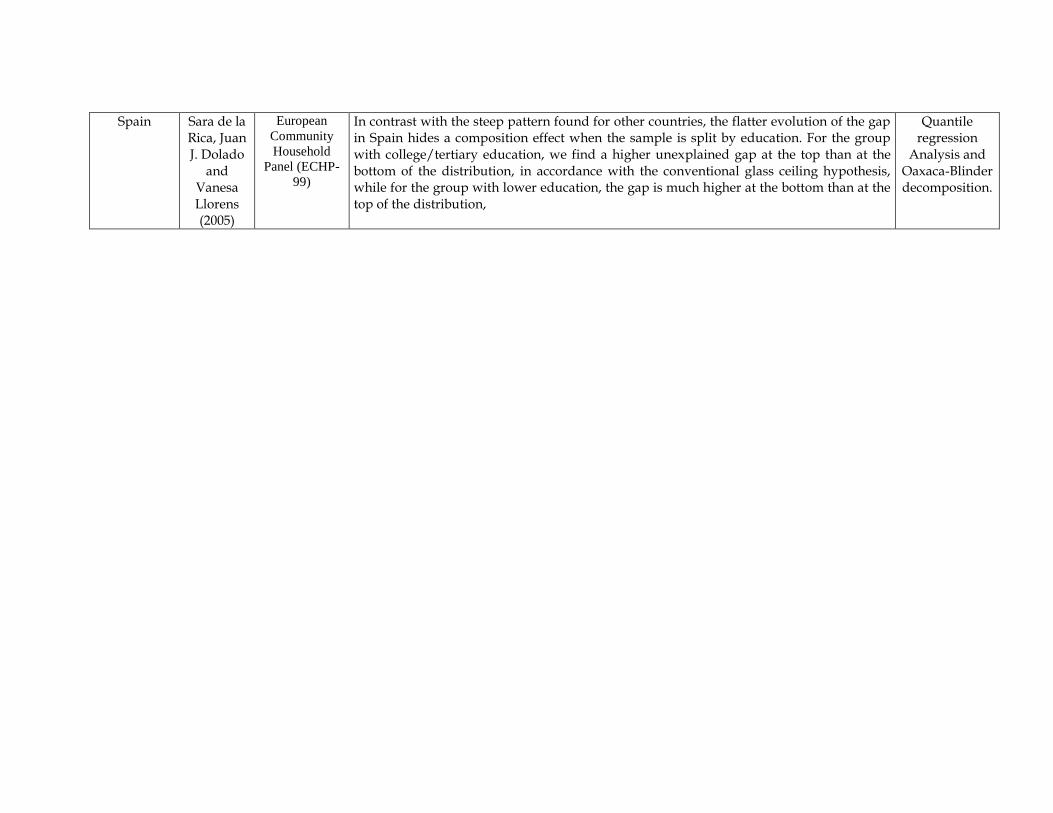
Spain Sara de la Rica, Juan J. Dolado
and Vanesa Llorens (2005)
European
Community
Household
Panel (ECHP-
99)
In contrast with the steep pattern found for other countries, the flatter evolution of the gap in Spain hides a composition effect when the sample is split by education. For the group with college/tertiary education, we find a higher unexplained gap at the top than at the bottom of the distribution, in accordance with the conventional glass ceiling hypothesis, while for the group with lower education, the gap is much higher at the bottom than at the top of the distribution,
Quantile regression
Analysis and Oaxaca-Blinder decomposition.
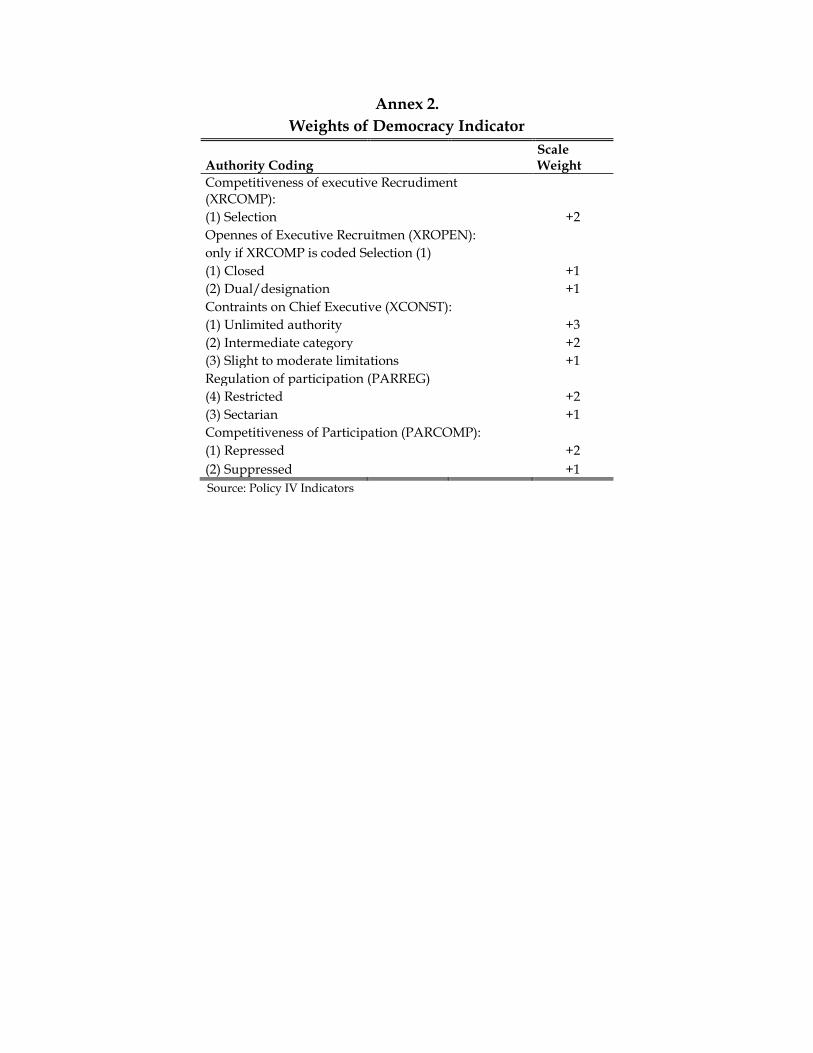
Annex 2.
Weights of Democracy Indicator
Authority Coding Scale Weight
Competitiveness of executive Recrudiment (XRCOMP):
(1) Selection +2
Opennes of Executive Recruitmen (XROPEN):
only if XRCOMP is coded Selection (1)
(1) Closed +1
(2) Dual/designation +1
Contraints on Chief Executive (XCONST):
(1) Unlimited authority +3
(2) Intermediate category +2
(3) Slight to moderate limitations +1
Regulation of participation (PARREG)
(4) Restricted +2
(3) Sectarian +1
Competitiveness of Participation (PARCOMP):
(1) Repressed +2
(2) Suppressed +1
Source: Policy IV Indicators