Embed Size (px)
Citation preview

GENDER BIAS
PREMA RAMACHANDRAN
Director, Nutrition Foundation of India

IS THERE ANY EVIDENCE OF GENDER BIAS FROM
People’s Perception
Demographic Indices
Health Care & Indices Nutrition Indices

Are there any policies& programmes to reduce consequences of gender bias
Advocacy/legislation
Programme interventions in
Maternal and child health
Nutrition

0
10
20
30
40
50
60
70
2 Sons 1 Son No Son
2 Children
Using any modern method
SterilisationSource :NFHS-2
0
10
20
30
40
50
60
70
80
3 Sons 2 Sons 1 Son No Son
3 Children
Using any modern method
SterilisationSource NFHS-2
CONTRACEPTIVE USE – IS THERE A SON PREFERENCE ?

0.0
10.0
20.0
30.0
40.0
50.0
60.0
70.0
80.0
Utta
r Pr.
Goa
Del
hi
Biha
r
Sikk
im
Punj
ab
Raj
asth
an
Oris
sa
ALL
IND
IA
Wes
t Ben
gal
Har
yana
Guj
arat
Kera
la
Mah
aras
htra
Tam
il Nad
u
Karn
atak
a
Andh
ra P
r.
Perc
ent
2 Sons No SonSource: Dept. of FW
SON PREFERENCE -INTERSTATE DIFFERENCES

0.0
20.0
40.0
60.0
80.0
100.0
Perce
nt
3 Sons No SonSource: Dept. of FW
INTERSTATE DIFFERENCES - SON PREFERENCE

GENDER BIAS - IMPACT ON SEX RATIO & 0-6 SEX RATIO
Time trends
Interstate& inter district variations
Interventions to arrest & reverse the trend
Time Trends in Sex Ratio in India
900
910
920
930
940
950
960
970
980
19
01
19
11
19
21
19
31
19
41
19
51
19
61
19
71
19
81
19
91
20
01
Fem
ales
per
10
00
Mal
es
Source: RGI
Census Year
The changes till 1971 are mainly due to higher longevity among men; in 2001 women’s longevity is slightly greater than men’s
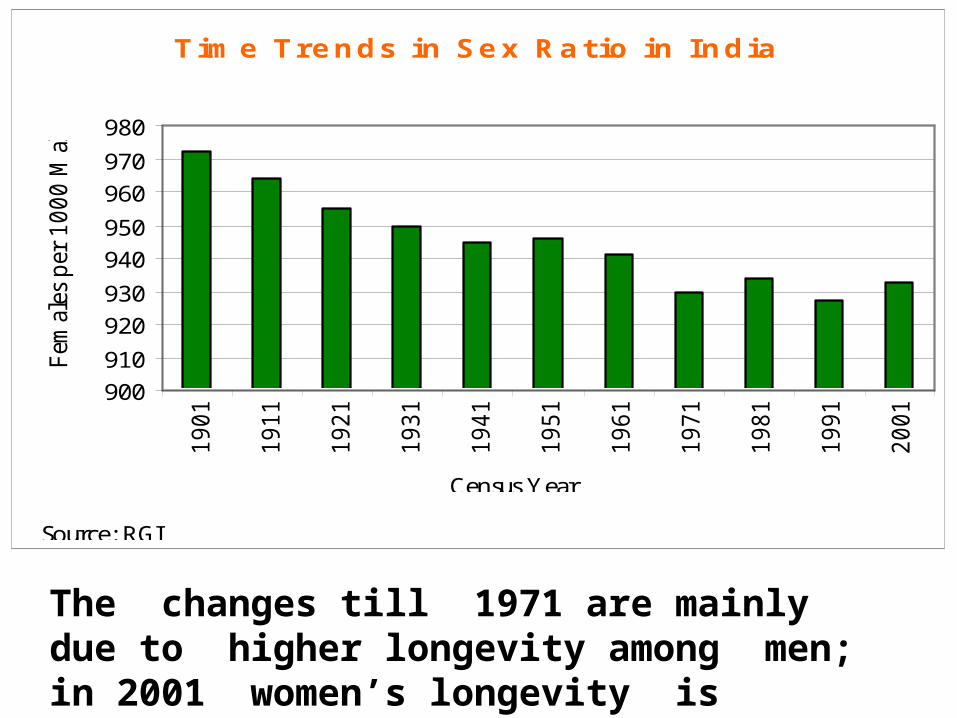
RURAL AND URBAN SEX RATIO: INDIA
820
850
880
910
940
970
10001
90
1
19
11
19
21
19
31
19
41
19
51
19
61
19
71
19
81
19
91
20
01
CENSUS DECADES
FE
MA
LE
S P
ER
10
00
MA
LE
S
Rural Urban
Urban sex ratio is lower partly due to urban migration of men

Sex Ratio Less than 900Number of Districts:
143or 31.6% districts
Total No. of Districts (excl J & K) in 1991:
452
District Map indicating sex ratio (census 2001)

700
750
800
850
900
950
1000
IND
IA
Punja
b
Hary
ana
Guja
rat
Raja
sth
an
UP
Mahara
shtr
a
MP
Bih
ar
Tam
il N
adu
Karn
ata
ka
Orissa
Kera
la
WB
AP
Assam
1991 2001
SR at Birth (International Average) SR at Birth (National Average)
Source: Registrar Genal India
Fem
ale
s/ 1000 M
ale
s Sex ratio 0-6 Years (Females per 1000 Males)
20
01
Cen
sus
Data
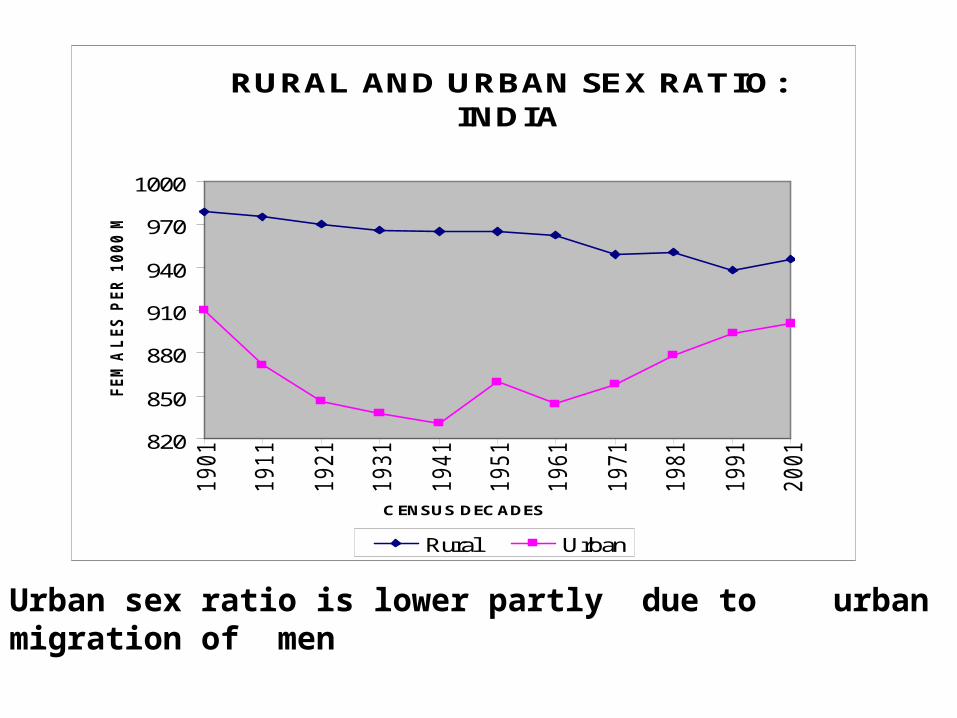
Child Sex Ratio in the Age Group 0 – 6 (1981 to 2001)
Census Year
Total Rural Urban
1981 962 963 931
1991 945 948 935
2001 927 934 903
Decline in child sex ratio in age group 0-6 from 945 in 1991 to 927 in 2001 has activated the socio-political, legal and administrative setup of the country.

Child Sex Ratio 2001(District level)

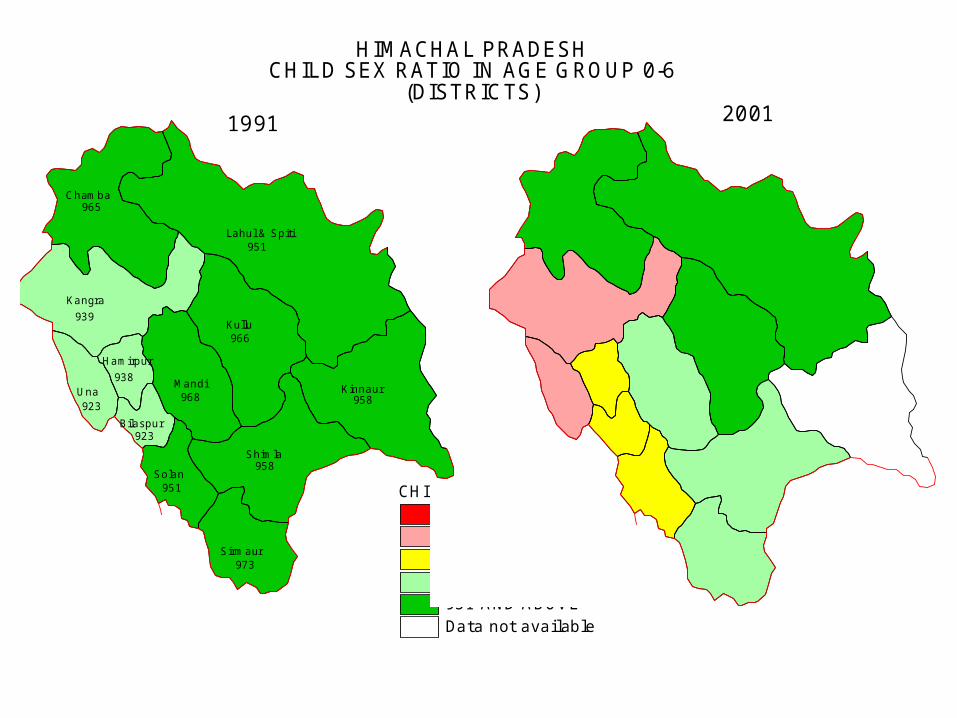
HIMACHAL PRADESHCHILD SEX RATIO IN AGE GROUP 0-6
(DISTRICTS)1991 2001
Lahul & Spiti
Chamba
Kangra
Kullu
Mandi KinnaurUna
Hamirpur
Shimla
Bilaspur
Solan
Sirmaur
HIMACHAL PRADESHCHILD SEX RATIO IN AGE GROUP 0-6
1991(DISTRICTS)
951
958
965
939
966
968
973
923
938
958
951
923
Lahul & Spiti
Chamba
Kangra
Kullu
Mandi KinnaurUna
Hamirpur
Shimla
Bilaspur
Solan
Sirmaur
HIMACHAL PRADESHCHILD SEX RATIO IN AGE GROUP 0-6
2001(DISTRICTS)
986962
836
960
916839
864
930
884
900
940
CHILD SEX RATIO800 AND BELOW801 - 850851 - 900901 - 950951 AND ABOVEData not available

North West
South West
West
East
NorthNorth East
New Delhi
Central
854
845
886
858870
868
867
882
902
South
North West
South West
West
East
NorthNorth East
New Delhi
Central
CHILD SEX RATIO800 AND BELOW801 - 850851 - 900901 - 950951 AND ABOVE
913
904
912
913920
918
917
919
937Central
New Delhi
North EastNorth
East
West
South West
North West
South
DELHICHILD SEX RATIO IN AGE GROUP 0 - 6
(DISTRICT)1991 2001
Gurdaspur
Hoshiarpur
Amritsar
Kapurthala
Jalandhar
Rupnagar
K
Nawanshahr
Firozpur
Moga
Ludhiana
Fatehgarh Sahib
Faridkot
MuktsarPatiala
Bathinda
Mansa
Sangrur
P
887873
861
871
878
877
884
860
886
858
867865
879
900
874
873
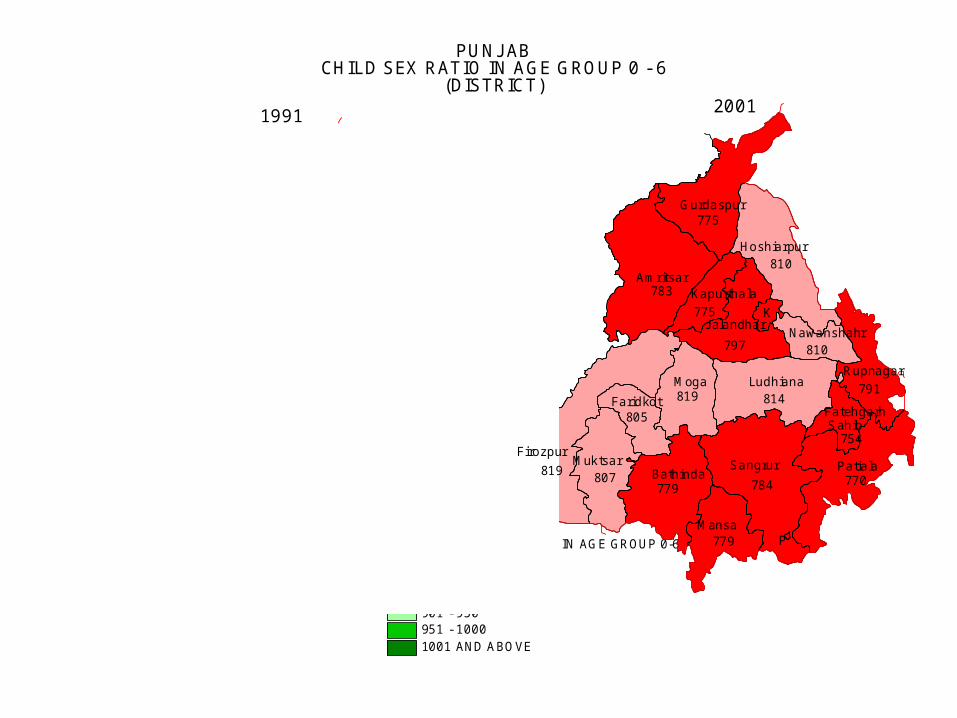
PUNJAB CHILD SEX RATIO IN AGE GROUP 0-6 1991 (DISTRICT)
884
FEMALES PER 1000 MALES IN AGE GROUP 0-6800 AND BELOW801 - 850851 - 900901 - 950951 - 10001001 AND ABOVE
775
810
783
775
797
791
K
810
819
819 814
754
805
807 770779
779
784
P
SangrurFirozpur
Amritsar
Patiala
Moga Ludhiana
Bathinda
Gurdaspur
Hoshiarpur
Mansa
Muktsar
Jalandhar
Rupnagar
Faridkot
Kapurthala
Fatehgarh Sahib
Nawanshahr
PUNJABCHILD SEX RATIO IN AGE GROUP 0-6
2001 (PROVISIONAL)(DISTRICT)
20011991
PUNJ ABCHILD SEX RATIO IN AGE GROUP 0 - 6
(DISTRICT)
Panchkula
Ambala Yamuna-nagar
Kurukshetra
KaithalKarnal
Sirsa
Jind
Fatehabad
HisarPanipat
Sonipat
Rohtak
Bhiwani
Jhajjar
GurgaonFarida-
bad
RewariMahen-dragarh
Sirsa
Hisar
Bhiwani
Karnal
Gurgaon
Kaithal
Sonipat
Jhajjar
Fatehabad
Rohtak
RewariFarida-
bad
Ambala
Panipat
Kurukshetra
Mahen-dragarh
Yamuna-nagar
Panchkula
Jind
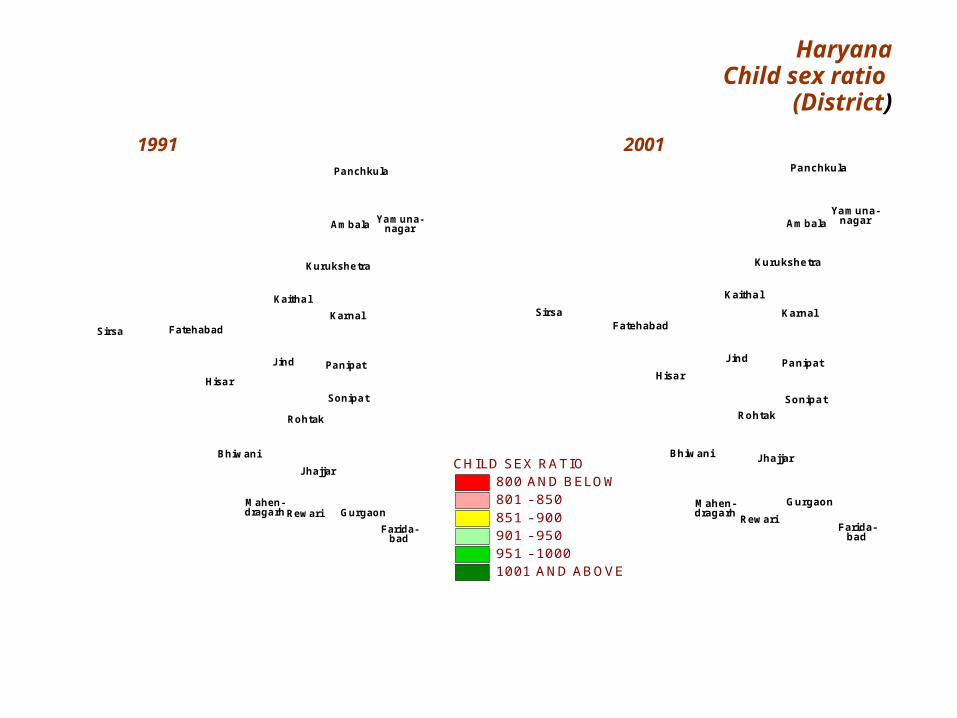
HaryanaChild sex ratio
(District)
1991 2001
CHILD SEX RATIO800 AND BELOW801 - 850851 - 900901 - 950951 - 10001001 AND ABOVE

CHILD SEX RATIO800 AND BELOW801 - 850851 - 900901 - 950951 - 10001001 AND ABOVEDATA NOT AVAILABLE
Child Sex Ratio 2001Gujarat by Tahsils

CHILD SEX RATIO800 AND BELOW801 - 850851 - 900901 - 950951 - 10001001 AND ABOVE
Child Sex Ratio 2001
Tamil Nadu by Tahsils

Sex ratio at birth
98
100
102
104
106
108
110
112
114
116
Sex
ratio
(1981-90)
SRS Estimates-Registrar General, India
Figure 4

INDIASEX RATIO AT BIRTH
1982
19991991
NO. OF MALES PER 100 FEMALES105 AND BELOW106 - 110111 - 115116 AND ABOVE
SOURCE:SAMPLE RAGISTRATION SYSTEM

INDIASEX RATIO AT BIRTH
1991
NO. OF MALES PER 100 FEMALES105 AND BELOW105 - 110110 - 115115 - 120120 AND ABOVE
Source: Census of India

Reported sex ratio at birth – Punjab District level 2000
5060708090
100110120130140150
Am
rits
ar
Bat
hind
a
Far
idko
t
Fat
ehga
rh S
ahib
Fir
ozpu
r
Gur
dasp
ur
Hos
hirp
ur
Jala
ndha
r
Kap
urth
ala
Lud
hian
a
Man
sa
Mog
a
Muk
thas
ar
Naw
ansh
ahar
Pat
iala
Roo
pnag
ar
San
grur
Tot
al
Rural Urban

SOURCE: CIVIL REGISTRATION SYSTEM
HARYANASEX RATIO AT BIRTH
1998
NO. OF MALES PER 100 FEMALES110 AND BELOW111 - 115 (S.A.-113)116 - 120121 AND ABOVE
SOURCE : CIVIL REGISTRATION SYSTEM
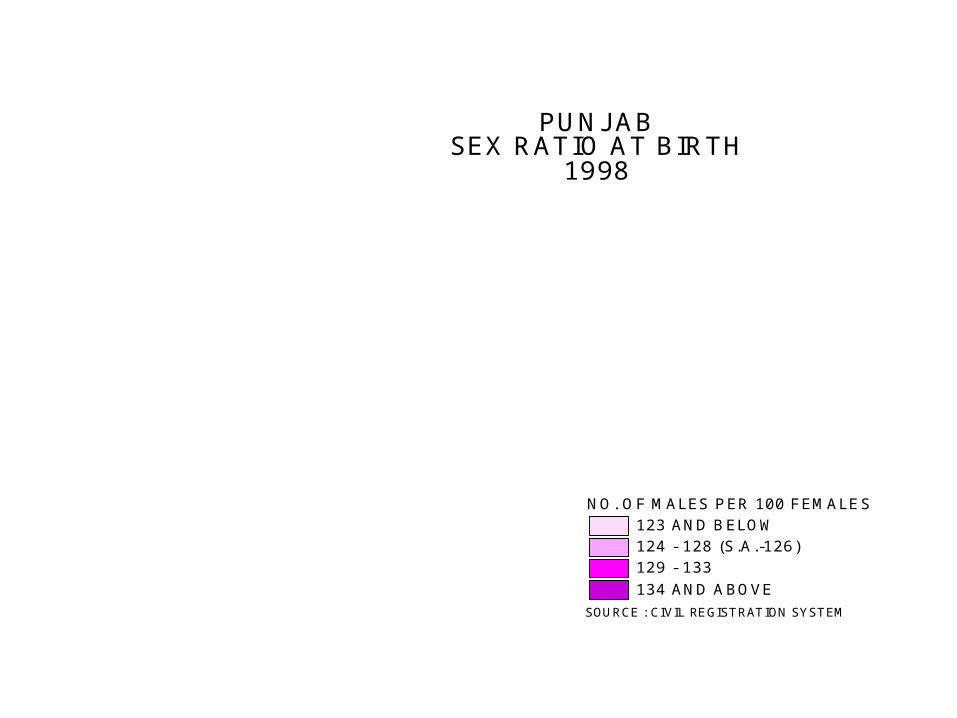
PUNJ ABSEX RATIO AT BIRTH
1998
NO. OF MALES PER 100 FEMALES123 AND BELOW124 - 128 (S.A.-126)129 - 133134 AND ABOVE
GanganagarHanumangarh
BikanerChuru
J hunjhunun
J aisalmer
SikarAlwar
J aipurJ odhpurBharatpurNagaur
Dausa
Ajmer
DhaulpurKarauli
Barmer
Sawai MadhopurTonk
Pali
Rajsamand
Bhilwara
J alor
Ajmer
Bundi
KotaSirohi
Baran
ChittaurgarhUdaipur
Chittaurgarh
J halawar
Dungarpur
Banswara
GanganagarHanumangarh
BikanerChuru
J hunjhunun
J aisalmer
SikarAlwar
J aipurJ odhpurBharatpurNagaur
Dausa
Ajmer
DhaulpurKarauli
Barmer
Sawai MadhopurTonk
Pali
Rajsamand
BhilwaraJ alor
Ajmer
Bundi
KotaSirohi
Baran
ChittaurgarhUdaipur
Chittaurgarh
J halawar
Dungarpur
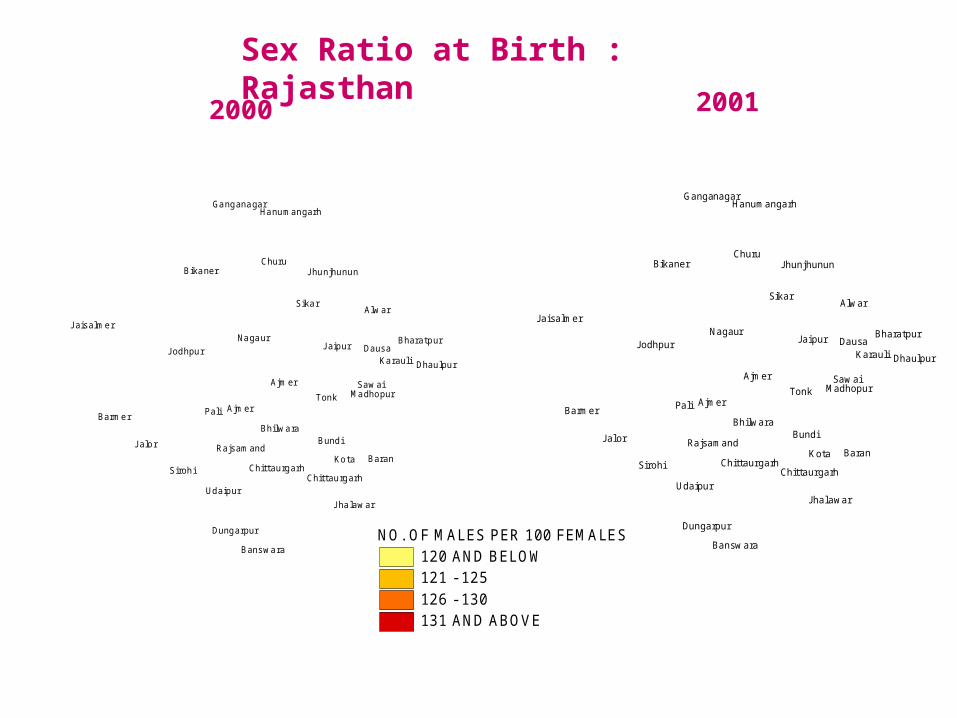
BanswaraNO. OF MALES PER 100 FEMALES
120 AND BELOW121 - 125126 - 130131 AND ABOVE
2000 2001
Sex Ratio at Birth : Rajasthan
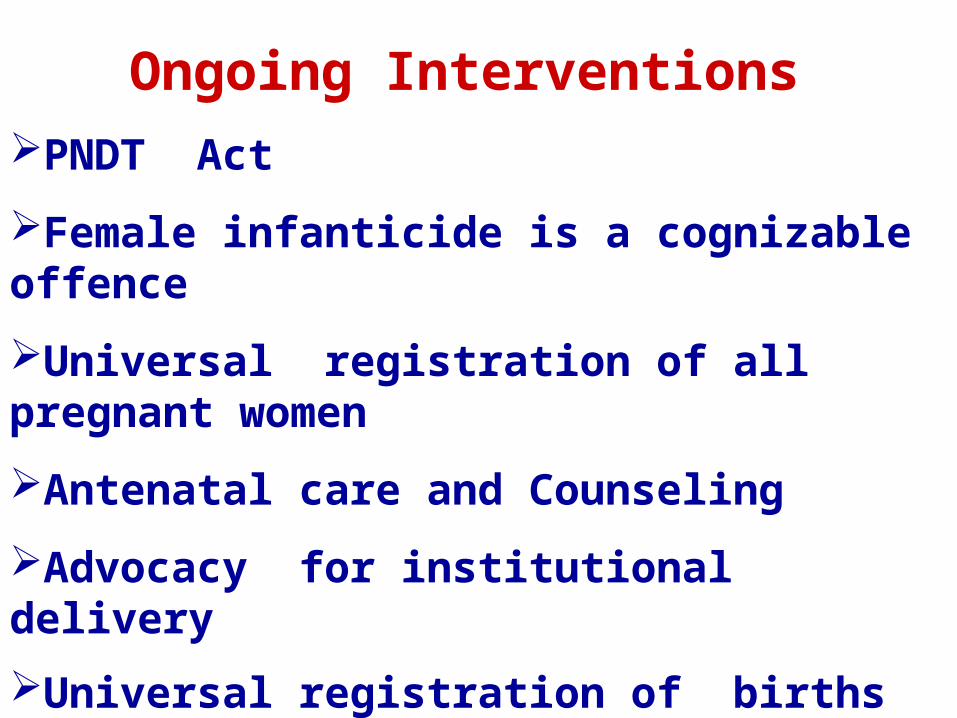
Ongoing Interventions
PNDT Act
Female infanticide is a cognizable offence
Universal registration of all pregnant women
Antenatal care and Counseling
Advocacy for institutional delivery
Universal registration of births and deaths to identify problem areas for focussed intervention
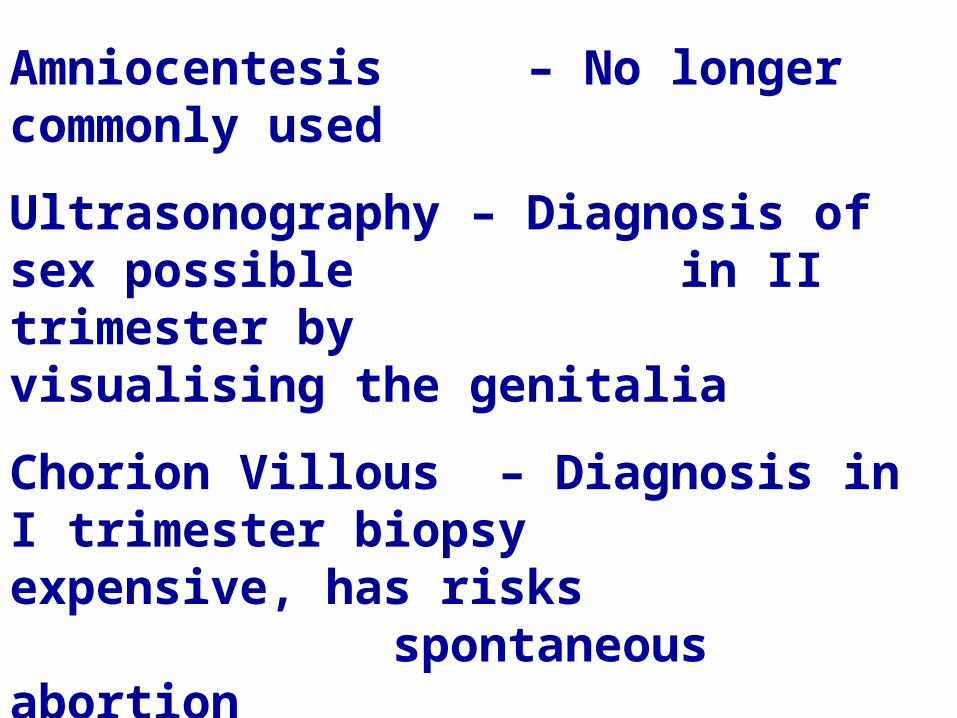
Amniocentesis – No longer commonly used
Ultrasonography – Diagnosis of sex possible in II trimester by visualising the genitalia
Chorion Villous – Diagnosis in I trimester biopsy expensive, has risks
spontaneous abortionPre-conceptional – Developing technology sex selection individual’s choice

PNDT Act can therefore be an enabling tool for achieving social transformation. It can be used as an educational tool to build up awareness among the population. The deterrent punitive measures may reduce abuse of the technology by the clinics for sex selective abortion. However only when the population mind set is changed can manifestations of the gender bias, like female infanticide and sex selective abortions, be eliminated.

Sex Differentials in Infant & Child Mortality
0
20
40
60
80
100
120
NeonatalMortality
Postneonatalmortality
Infant Mortality Under FiveMortality
Male Female Source :NFHS 2

Gender based differentials in IMR & Under 5 MR
108.3146.2
45.5 54.4
110.1
163.9
42.4 54.1
0
50
100
150
200
IMR Under 5 MR
Male Quintiles Poorest Male Quintiles Richest
Female Quintiles Poorest Female Quintiles Richest

Gender Differentials in Immunization Coverage
020
4060
80100
Measles DPT 3 All None
Male Quintiles Poorest Male Quintiles RichestFemale Quintiles Poorest Female Quintiles Richest

Gender Differentials in Treatment of ARI (%)
7.9
68.7
4.7 6
56.8
3.7
77.191.7
0
20
40
60
80
100
Prevalance Seen Medically
Male Quintiles Poorest Male Quintiles RichestFemale Quintiles Poorest Female Quintiles Richest

Mean Energy Consumption- Children / Adolescents and Adults
Age Group
Males Females
Kcals RDI % RDI Kcals RDI % RDI
Pre-school 889 1357 65.5 897 1351 66.4
School Age 1464 1929 75.9 1409 1876 75.1
Adolescents 2065 2441 84.6 1670 1823 91.6
Adults 2226 2425 91.8 1923 1874 102.6
Source NNMB

Time Trends in Nutritional Status of 1-5 years Children
0
10
20
30
40
50
Normal Mild Moderate Severe
perc
ent
1975-79 1988-901996-97 2000-01
Source: NNMB Technical Report No.21
0
10
20
30
40
50
60
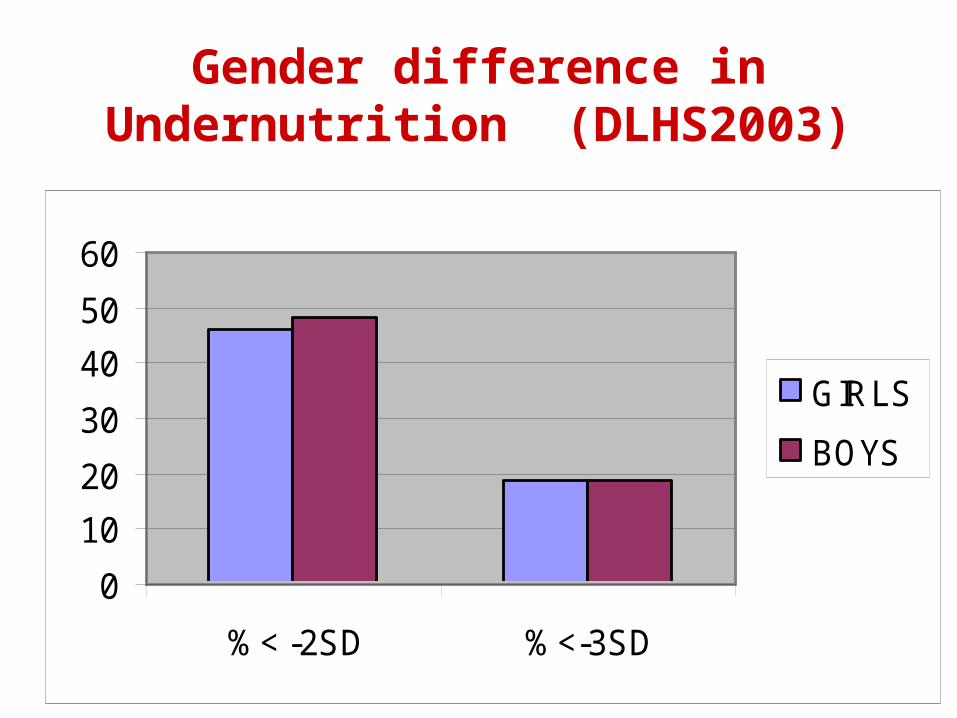
%< -2SD %<-3SD
GIRLS
BOYS
Gender difference in Undernutrition (DLHS2003)

Nutritional Status of Children by Income
0
5
10
15
20
25
30
35
Kerala TamilNadu
Punjab O rissa Uttar Pr. Gujarat
Per
cen
t
Low Medium HighSource: NFHS-II

Anaemia among Adolescents girls age 10-19 years in INDIA
MILD MODERATE
SEVERE NO ANAEMIA
43 Percent
28 Percent24 Percent
5 Percent
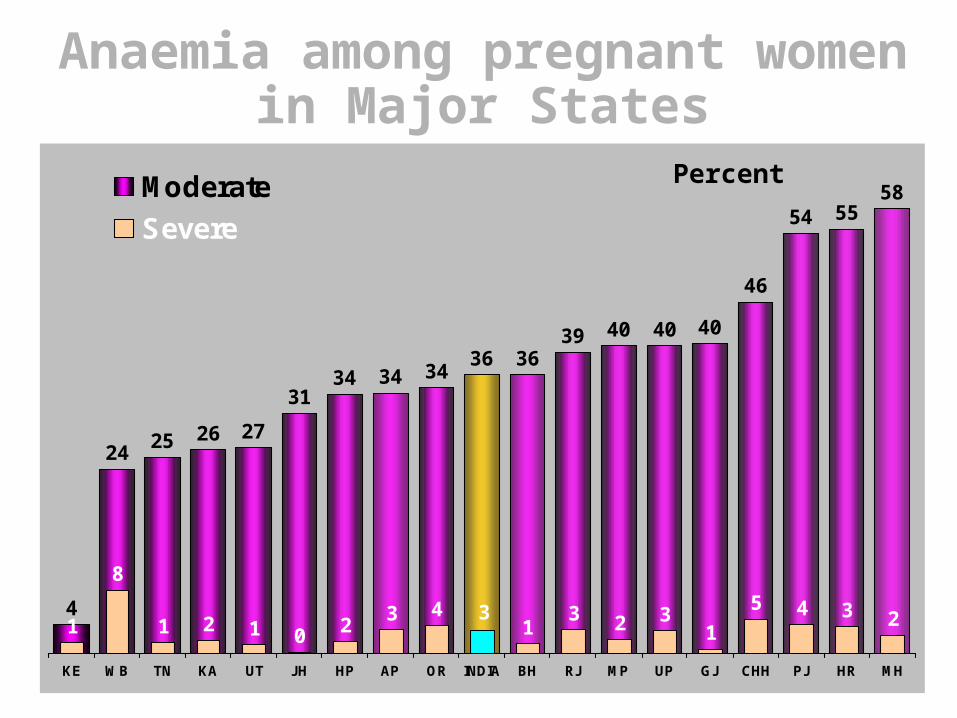
Anaemia among pregnant women in Major States
585554
46
404040393636
34343431
27262524
4 2345
13234
20121
8
1 13 3
MHHRPJCHHGJUPMPRJBHINDIAORAPHPJHUTKATNWBKE
Moderate
Severe
Percent
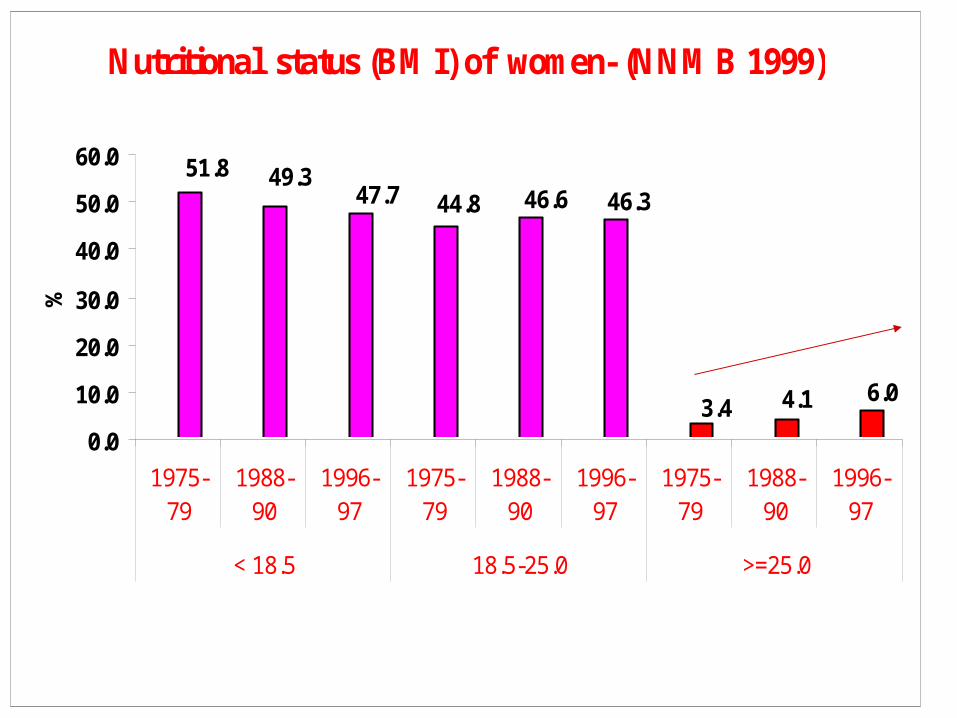
Nutritional status (BMI) of women- (NNMB 1999)
6.04.13.4
46.346.644.847.749.351.8
0.0
10.0
20.0
30.0
40.0
50.0
60.0
1975-79
1988-90
1996-97
1975-79
1988-90
1996-97
1975-79
1988-90
1996-97
< 18.5 18.5-25.0 >=25.0
%

EFFECT OF INCREASE IN LONGEVITY
women live longer more women than men in over 65 years mostly housewives; no assured income poor family support poor health care unneeded; not looked after.
Current Need: Better care for these women who cared for others as long as they could