Embed Size (px)
Citation preview
NREL is a national laboratory of the U.S. Department of Energy Office of Energy Efficiency & Renewable Energy Operated by the Alliance for Sustainable Energy, LLC This report is available at no cost from the National Renewable Energy Laboratory (NREL) at www.nrel.gov/publications.
Contract No. DE-AC36-08GO28308
Gearbox Reliability Collaborative Phase 3 Gearbox 2 Test Report J. Keller and R. Wallen National Renewable Energy Laboratory
Technical Report NREL/TP-5000-63693 June 2015
NREL is a national laboratory of the U.S. Department of Energy Office of Energy Efficiency & Renewable Energy Operated by the Alliance for Sustainable Energy, LLC This report is available at no cost from the National Renewable Energy Laboratory (NREL) at www.nrel.gov/publications.
Contract No. DE-AC36-08GO28308
National Renewable Energy Laboratory 15013 Denver West Parkway Golden, CO 80401 303-275-3000 • www.nrel.gov
Gearbox Reliability Collaborative Phase 3 Gearbox 2 Test Report J. Keller and R. Wallen National Renewable Energy Laboratory
Prepared under Task No. WE14.3A01
Technical Report NREL/TP-5000-63693 June 2015

NOTICE
This report was prepared as an account of work sponsored by an agency of the United States government. Neither the United States government nor any agency thereof, nor any of their employees, makes any warranty, express or implied, or assumes any legal liability or responsibility for the accuracy, completeness, or usefulness of any information, apparatus, product, or process disclosed, or represents that its use would not infringe privately owned rights. Reference herein to any specific commercial product, process, or service by trade name, trademark, manufacturer, or otherwise does not necessarily constitute or imply its endorsement, recommendation, or favoring by the United States government or any agency thereof. The views and opinions of authors expressed herein do not necessarily state or reflect those of the United States government or any agency thereof.
This report is available at no cost from the National Renewable Energy Laboratory (NREL) at www.nrel.gov/publications.
Available electronically at SciTech Connect http:/www.osti.gov/scitech
Available for a processing fee to U.S. Department of Energy and its contractors, in paper, from:
U.S. Department of Energy Office of Scientific and Technical Information P.O. Box 62 Oak Ridge, TN 37831-0062 OSTI http://www.osti.gov Phone: 865.576.8401 Fax: 865.576.5728 Email: [email protected]
Available for sale to the public, in paper, from:
U.S. Department of Commerce National Technical Information Service 5301 Shawnee Road Alexandra, VA 22312 NTIS http://www.ntis.gov Phone: 800.553.6847 or 703.605.6000 Fax: 703.605.6900 Email: [email protected]
Cover Photos by Dennis Schroeder: (left to right) NREL 26173, NREL 18302, NREL 19758, NREL 29642, NREL 19795.
NREL prints on paper that contains recycled content.

iii
This report is available at no cost from the National Renewable Energy Laboratory (NREL) at www.nrel.gov/publications.
Acknowledgments This work was supported by the U.S. Department of Energy under Contract No. DE-AC36-08GO28308 with the National Renewable Energy Laboratory. Funding for the work was provided by the DOE Office of Energy Efficiency and Renewable Energy, Wind and Water Power Technologies Office.
iv
This report is available at no cost from the National Renewable Energy Laboratory (NREL) at www.nrel.gov/publications.
List of Acronyms CRB cylindrical roller bearing
DAS data acquisition system
deg degree of rotation
DW downwind
FO fiber optic
GB gearbox
GRC Gearbox Reliability Collaborative
HSS high-speed shaft
ISS intermediate-speed shaft
kVAR kilovolt-ampere reactive
LSS low-speed shaft
LVDT linear variable displacement transducer
mV/V millivolts per volt
NI National Instruments
NREL National Renewable Energy Laboratory
NTL nontorque load
NWTC National Wind Technology Center
RTD resistance temperature detector
stbd starboard
TRB tapered roller bearing
UW upwind
VDC volts direct current
VFD variable frequency drive
v
This report is available at no cost from the National Renewable Energy Laboratory (NREL) at www.nrel.gov/publications.
Table of Contents List of Figures ............................................................................................................................................ vi List of Tables .............................................................................................................................................. vi 1 Introduction and Background ............................................................................................................. 1 2 Test Article ............................................................................................................................................ 2
2.1 High-Speed Shaft Installation .......................................................................................................... 3 3 Test Environment ................................................................................................................................. 5
3.1 Dynamometer Configuration ........................................................................................................... 5 3.2 Lubrication and Cooling Systems .................................................................................................... 5 3.3 Data Acquisition System .................................................................................................................. 6
4 Instrumentation ..................................................................................................................................... 7 4.1 Main Shaft ........................................................................................................................................ 7 4.2 Gearbox ............................................................................................................................................ 7
4.2.1 Housing ............................................................................................................................. 7 4.2.2 Ring Gear .......................................................................................................................... 8 4.2.3 Planetary Bearings ............................................................................................................ 8 4.2.4 Intermediate Stage ............................................................................................................. 9 4.2.5 High-Speed Shaft .............................................................................................................. 9
4.3 Lubrication System .......................................................................................................................... 9 4.4 Generator ......................................................................................................................................... 9 4.5 Mainframe ........................................................................................................................................ 9 4.6 Condition Monitoring ...................................................................................................................... 9 4.7 Signal List ...................................................................................................................................... 10
5 Test Sequence .................................................................................................................................... 16 5.1 Drivetrain Recommissioning ......................................................................................................... 16
5.1.1 High-Speed Shaft Investigations ..................................................................................... 16 5.2 Nontorque Load Tests .................................................................................................................... 19
5.2.1 Static Bending Moment .................................................................................................. 19 5.2.2 Dynamic Bending Moment ............................................................................................. 20 5.2.3 Static Thrust .................................................................................................................... 21
5.3 Generator Misalignment Tests ....................................................................................................... 21 5.4 Field Representative Tests ............................................................................................................. 23
5.4.1 Normal Power Production ............................................................................................... 23 5.4.2 Shutdown ........................................................................................................................ 24
5.5 Grid Disconnect Tests .................................................................................................................... 25 6 Summary ............................................................................................................................................. 27 References ................................................................................................................................................. 28 Appendix .................................................................................................................................................... 29
vi
This report is available at no cost from the National Renewable Energy Laboratory (NREL) at www.nrel.gov/publications.
List of Figures Figure 1. Drivetrain configuration ............................................................................................................. 2 Figure 2. Gearbox configuration. Illustration by Powertrain Engineers Inc. ........................................ 2 Figure 3. Schematic of HSS installation in the gearbox [6]. Illustration by Powertrain Engineers
Inc. .......................................................................................................................................................... 3 Figure 4. The effect of the deep counterbore in the HSS housing [6] ................................................... 4 Figure 5. GRC setup. Photo by Mark McDade, NREL 32734 ................................................................... 5 Figure 6. Schematic of GRC data acquisition system ............................................................................. 6 Figure 7. Time domain HSS TRB data ..................................................................................................... 17 Figure 8. Frequency domain HSS TRB data ........................................................................................... 17 Figure 9. HSS torque data at 1,200 rpm (left) and 1,800 rpm (right) .................................................... 18 Figure 10. HSS torque data at a range of speeds .................................................................................. 18 Figure 11. Static NTLs for the first (left) and second (right) tests at 100% power ............................. 19 Figure 12. New GRC mainframe-to-dynamometer floor adapter plates. Illustration by Lambert
Engineering ......................................................................................................................................... 20 Figure 13. Dynamic NTLs at 100% power ............................................................................................... 21 Figure 14. Generator shim stack (left) and generator coupling (right) at 3º misalignment. Photos by
Jon Keller, NREL 32491 and 32492 ................................................................................................... 22 Figure 15. Effect of generator misalignment on measured HSS bending moment ............................ 22 Figure 16. Main shaft torque (left) and bending moments (right) for the 25-m/s wind speed case .. 23 Figure 17. GRC braking system hardware. Photo by Joe Verrengia, NREL 16867 ............................ 24 Figure 18. Shutdown event in the field (left) and dynamometer (right) ............................................... 25 Figure 19. Main shaft (left) and HSS (right) response during controlled dynamometer shutdown . 26 Figure 20. GRC electrical interconnection ............................................................................................. 29 Figure 21. Lubrication system schematic .............................................................................................. 30 Figure 22. LSS DAS box configuration ................................................................................................... 31 Figure 23. Port DAS box configuration ................................................................................................... 32 Figure 24. Starboard DAS box configuration ......................................................................................... 33 Figure 25. Main shaft speed and azimuth ............................................................................................... 34 Figure 26. Gearbox motion, ZZ, at trunnion ........................................................................................... 35 Figure 27. Gearbox motion, YY, bottom rotation ................................................................................... 36 Figure 28. Ring gear external face-width load distribution .................................................................. 37 Figure 29. Intermediate-shaft axial motion ............................................................................................. 38 Figure 30. HSS speed and azimuth ......................................................................................................... 39 List of Tables Table 1. Elements of 100-Hz Sample Rate Data ..................................................................................... 10 Table 2. Elements of 2,000-Hz Sample Rate Data .................................................................................. 14
1
This report is available at no cost from the National Renewable Energy Laboratory (NREL) at www.nrel.gov/publications.
1 Introduction and Background Many gearboxes in wind turbines have not been achieving their expected design life [1]; they do, however, commonly meet or exceed the design criteria specified in current standards in the gear, bearing, and wind turbine industry as well as third-party certification criteria. The cost of gearbox replacements and rebuilds, as well as the downtime associated with these failures, has elevated the cost of wind energy. In 2006, the U.S. Department of Energy established the National Renewable Energy Laboratory (NREL) Gearbox Reliability Collaborative (GRC). Its key goal is to understand the root causes of premature gearbox failures and improve their reliability [2]. The GRC is examining a hypothesis that the gap between design-estimated and actual wind turbine gearbox reliability is caused by underestimation of loads, inaccurate design tools, the absence of critical elements in the design process, or insufficient testing.
The GRC uses a combined gearbox testing, modeling, and analysis approach. The collaborative disseminates data and results to the industry, facilitating gearbox reliability improvement. Full-scale dynamometer testing builds an understanding of how selected loads and events translate into gear and bearing response, including reactions, load distributions, displacements, temperatures, stresses, and slip. Ideally, the knowledge gained from the GRC will result in any necessary improvements to gearbox design standards and associated modeling tools.
This test report describes the recent tests of GRC gearbox (GB) 2 in the National Wind Technology Center (NWTC) dynamometer and documents any modifications to the original test plan [3]. In this manner, it serves as a guide for interpreting the publicly released data sets with brief analyses to illustrate the data. Specific objectives of the test were to assess the effect of dynamic nontorque load (NTL) on the planetary section, generator misalignment on the high-speed shaft (HSS), and field representative conditions on the gearbox in general. Detailed analysis of those test objectives will be presented in subsequent publications.
2
This report is available at no cost from the National Renewable Energy Laboratory (NREL) at www.nrel.gov/publications.
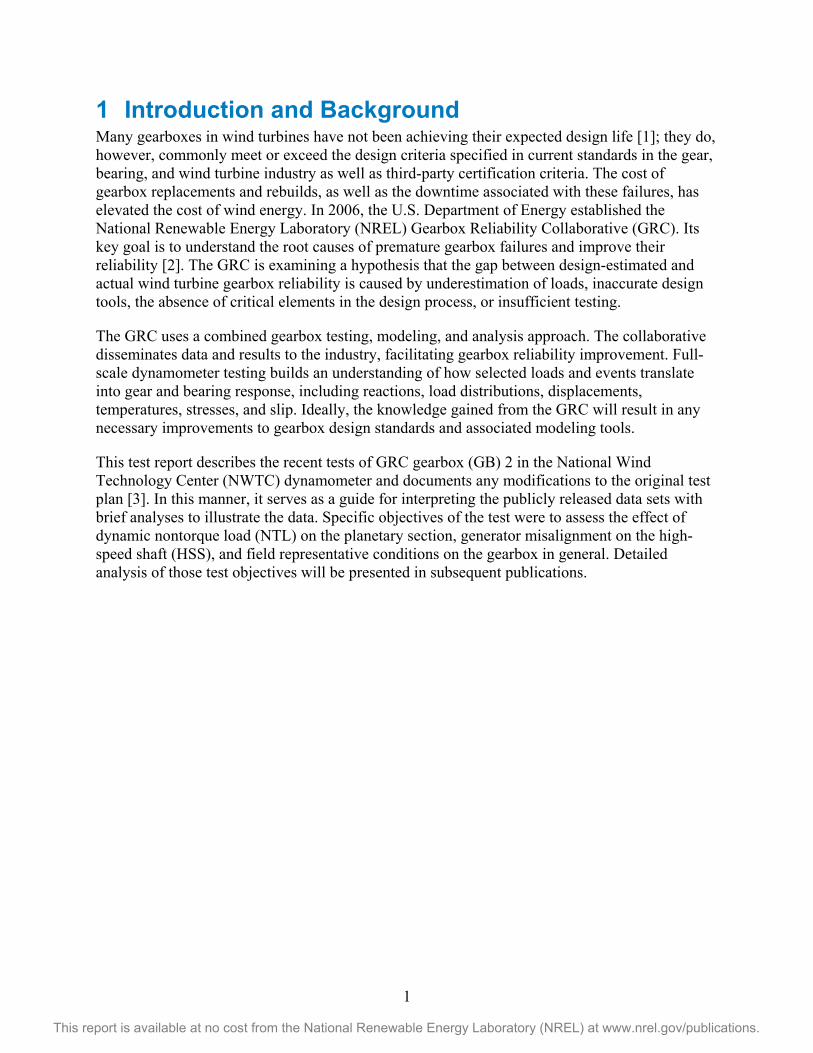
2 Test Article The GRC test article drivetrain was originally designed for a two-speed, stall-controlled, three-bladed upwind turbine with a rated power of 750 kilowatts (kW) [2]. The design follows a conventional configuration in which all the drivetrain components are mounted onto the bed plate. These components include the hub, main bearing, main shaft, gearbox, brake, generator shaft, and generator (see Figure 1). Everything but the hub is included in the dynamometer tests. The drivetrain follows a common configuration of megawatt-scale turbines used in the industry today. The gearbox is mounted with a three-point configuration in which torsional loads are transferred to the main frame through two torque arms, and forces are reacted mostly at the main bearing.
Figure 1. Drivetrain configuration
The gearbox is composed of one low-speed planetary stage that accommodates three planet gears, and two parallel shaft stages (see Figure 2). The gears and bearings were redesigned and have been modified from the original gearbox configuration used in the commercial versions of this wind turbine. From this point forward, the redesigned gearbox is referred to as the “the GRC gearbox.”
Figure 2. Gearbox configuration. Illustration by Powertrain Engineers Inc.
Generator
Main Bearing Main Shaft
Brake Generator Shaft
Gearbox
Bed Plate
Hub
Torque Arms
Planetary gear stage
Sun gear
Sun spline Hollow shaft
HSS
3
This report is available at no cost from the National Renewable Energy Laboratory (NREL) at www.nrel.gov/publications.
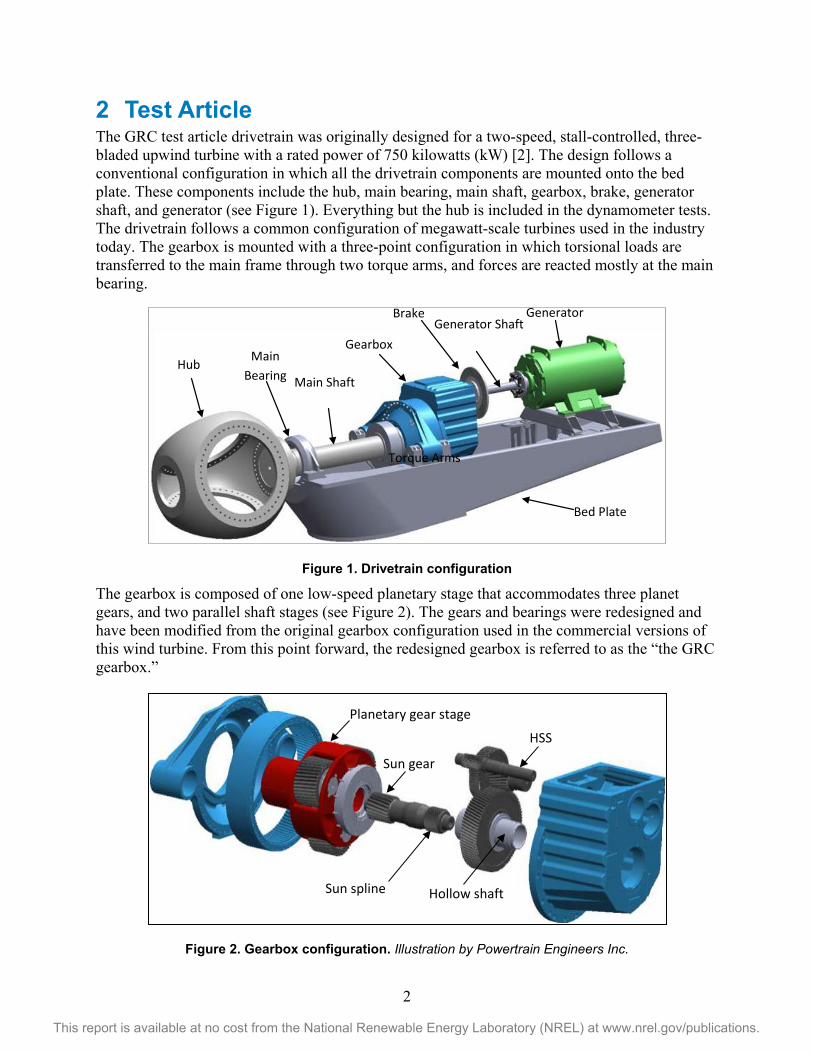
2.1 High-Speed Shaft Installation Feedback from GRC partners highlighted the need for measurements of gear and bearing response on the HSS because of the high rate of failures and subsequent repair costs for these bearings in the industry [1,4]. The reliability of this bearing configuration remains a weak link because of a possible disconnect between the actual loading behavior and the loading behavior assumed by the design. HSS bearings in wind turbine gearboxes can be subject to low loads at high speeds, torque transients, and even torque reversals. When rollers enter and leave the shifting load zone during such events, they are prone to skidding that can lead to surface distress and damage [5].
In the GRC Phase 3, instrumentation was added to measure the HSS bending, torque, pinion tooth load distribution, and radial load distribution and temperature of the locating tapered roller bearing (TRB) pair [3]. One of the main goals of Phase 3 testing is to assess these loads in normal operation, generator misalignment, and simulated stop conditions. As shown in Figure 3, the HSS is supported by a cylindrical roller bearing (CRB) upwind and a close-coupled TRB pair mounted in an O-configuration downwind of the gear mesh.
Figure 3. Schematic of HSS installation in the gearbox [6]. Illustration by Powertrain Engineers Inc.
Because the primary objective of Phase 3 testing of GB2 is to measure HSS, pinion, and bearing loads, it is important to note two important differences between the gearbox drawings and the actual installation [6]. Both of these items have been present since the GB2 was originally built, although they have become relevant only in Phase 3. These two differences follow:
• The baffle (P/N 251559) just upwind of the TRB pair was never installed. The baffle is 5 mm thick, so when it is omitted the TRB pair is 5 mm farther upwind on the shaft itself.
HSS
End Cap
Pinion Upwind
TRB Downwind
TRB
Locknut Housing
Cone
CRB & Baffle Baffle
(not installed)
4
This report is available at no cost from the National Renewable Energy Laboratory (NREL) at www.nrel.gov/publications.
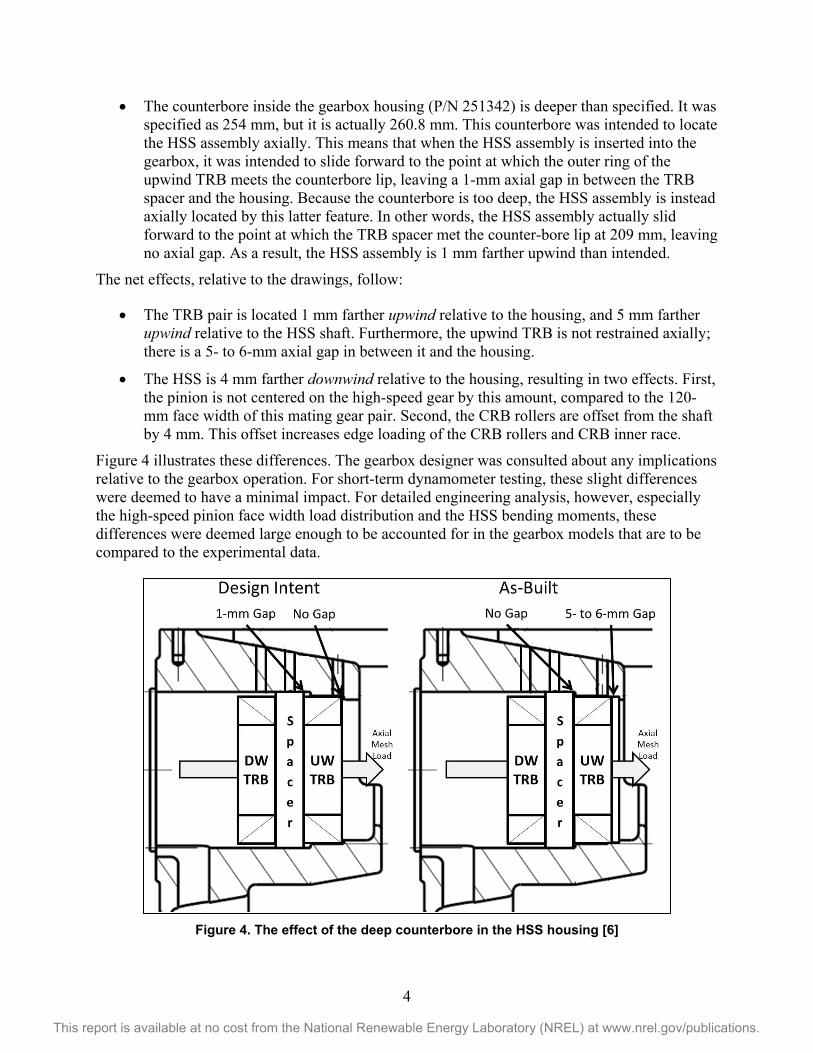
• The counterbore inside the gearbox housing (P/N 251342) is deeper than specified. It was specified as 254 mm, but it is actually 260.8 mm. This counterbore was intended to locate the HSS assembly axially. This means that when the HSS assembly is inserted into the gearbox, it was intended to slide forward to the point at which the outer ring of the upwind TRB meets the counterbore lip, leaving a 1-mm axial gap in between the TRB spacer and the housing. Because the counterbore is too deep, the HSS assembly is instead axially located by this latter feature. In other words, the HSS assembly actually slid forward to the point at which the TRB spacer met the counter-bore lip at 209 mm, leaving no axial gap. As a result, the HSS assembly is 1 mm farther upwind than intended.
The net effects, relative to the drawings, follow:
• The TRB pair is located 1 mm farther upwind relative to the housing, and 5 mm farther upwind relative to the HSS shaft. Furthermore, the upwind TRB is not restrained axially; there is a 5- to 6-mm axial gap in between it and the housing.
• The HSS is 4 mm farther downwind relative to the housing, resulting in two effects. First, the pinion is not centered on the high-speed gear by this amount, compared to the 120-mm face width of this mating gear pair. Second, the CRB rollers are offset from the shaft by 4 mm. This offset increases edge loading of the CRB rollers and CRB inner race.
Figure 4 illustrates these differences. The gearbox designer was consulted about any implications relative to the gearbox operation. For short-term dynamometer testing, these slight differences were deemed to have a minimal impact. For detailed engineering analysis, however, especially the high-speed pinion face width load distribution and the HSS bending moments, these differences were deemed large enough to be accounted for in the gearbox models that are to be compared to the experimental data.
Figure 4. The effect of the deep counterbore in the HSS housing [6]
5
This report is available at no cost from the National Renewable Energy Laboratory (NREL) at www.nrel.gov/publications.
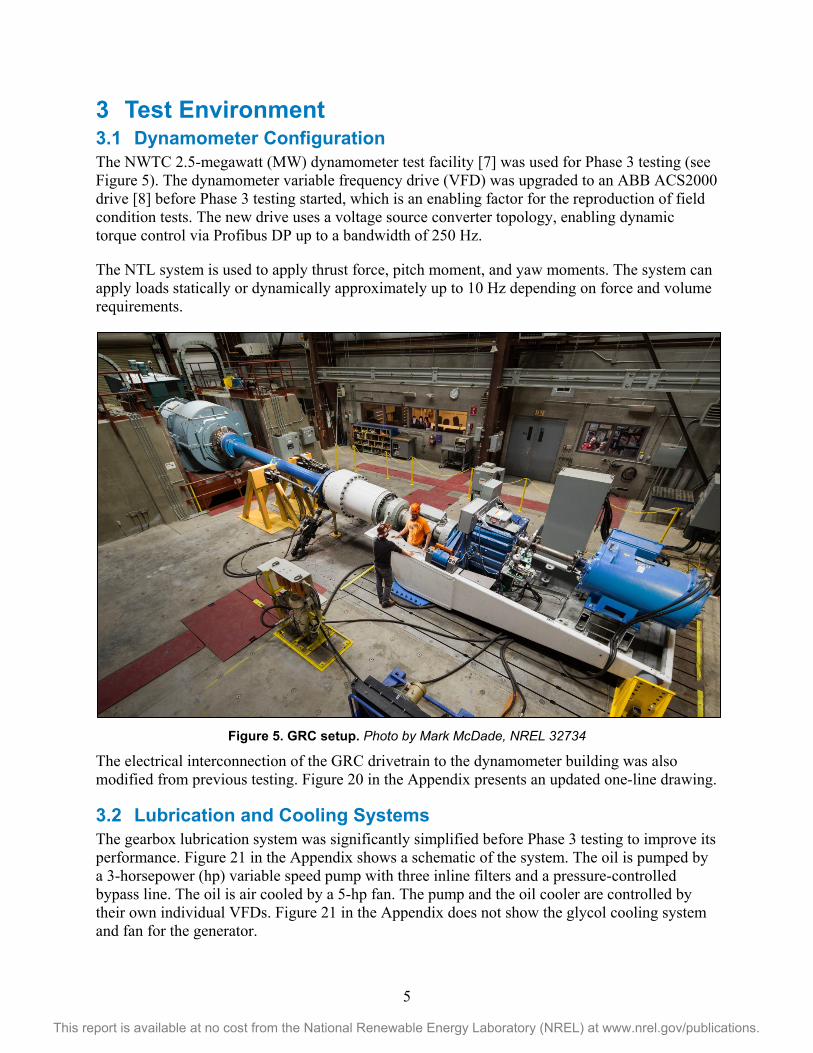
3 Test Environment 3.1 Dynamometer Configuration The NWTC 2.5-megawatt (MW) dynamometer test facility [7] was used for Phase 3 testing (see Figure 5). The dynamometer variable frequency drive (VFD) was upgraded to an ABB ACS2000 drive [8] before Phase 3 testing started, which is an enabling factor for the reproduction of field condition tests. The new drive uses a voltage source converter topology, enabling dynamic torque control via Profibus DP up to a bandwidth of 250 Hz.
The NTL system is used to apply thrust force, pitch moment, and yaw moments. The system can apply loads statically or dynamically approximately up to 10 Hz depending on force and volume requirements.
Figure 5. GRC setup. Photo by Mark McDade, NREL 32734
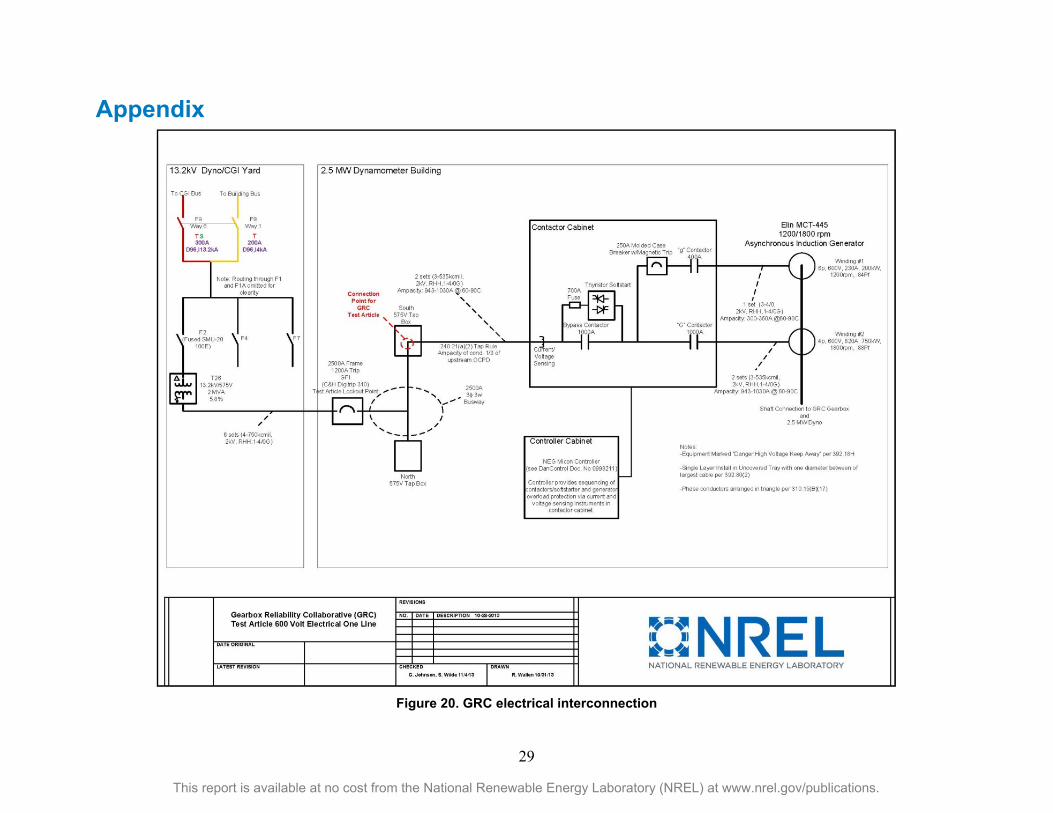
The electrical interconnection of the GRC drivetrain to the dynamometer building was also modified from previous testing. Figure 20 in the Appendix presents an updated one-line drawing.
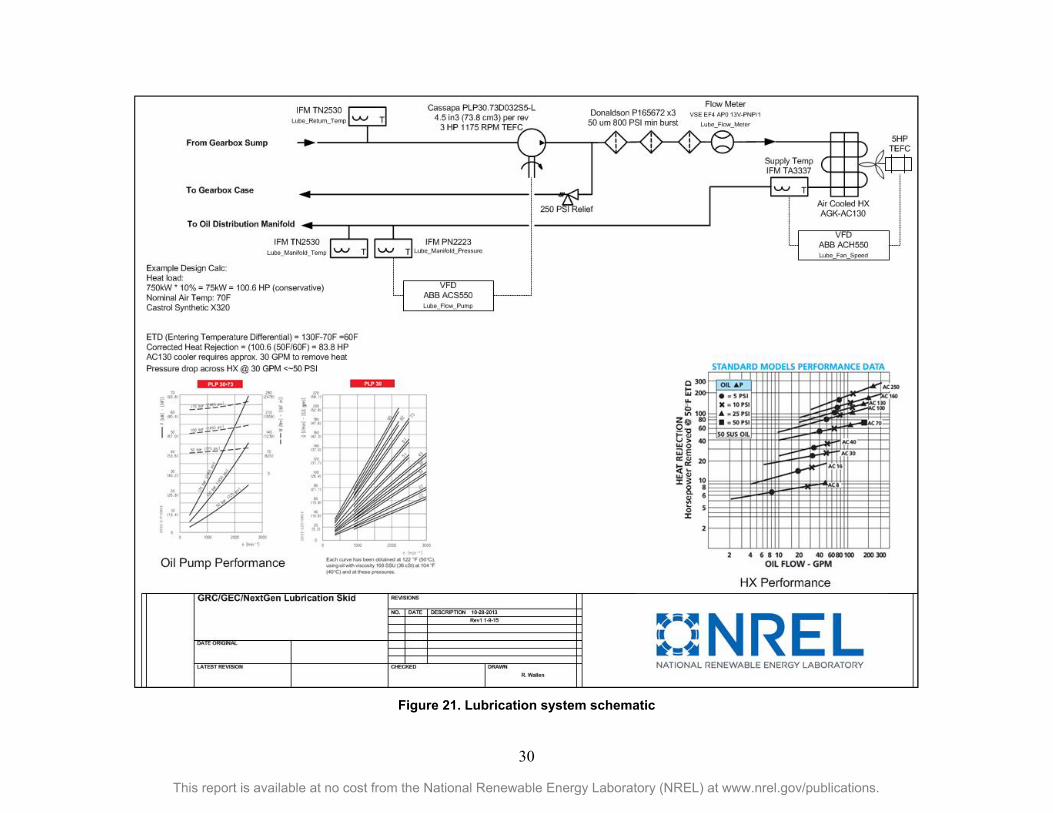
3.2 Lubrication and Cooling Systems The gearbox lubrication system was significantly simplified before Phase 3 testing to improve its performance. Figure 21 in the Appendix shows a schematic of the system. The oil is pumped by a 3-horsepower (hp) variable speed pump with three inline filters and a pressure-controlled bypass line. The oil is air cooled by a 5-hp fan. The pump and the oil cooler are controlled by their own individual VFDs. Figure 21 in the Appendix does not show the glycol cooling system and fan for the generator.
6
This report is available at no cost from the National Renewable Energy Laboratory (NREL) at www.nrel.gov/publications.
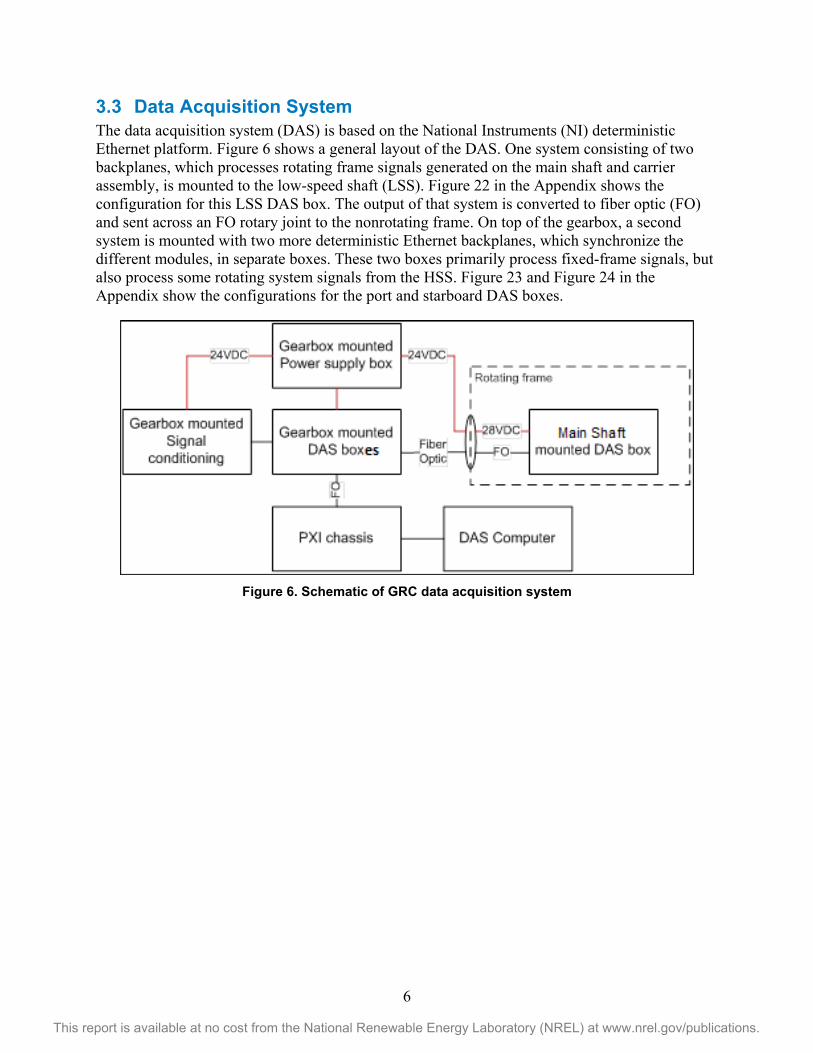
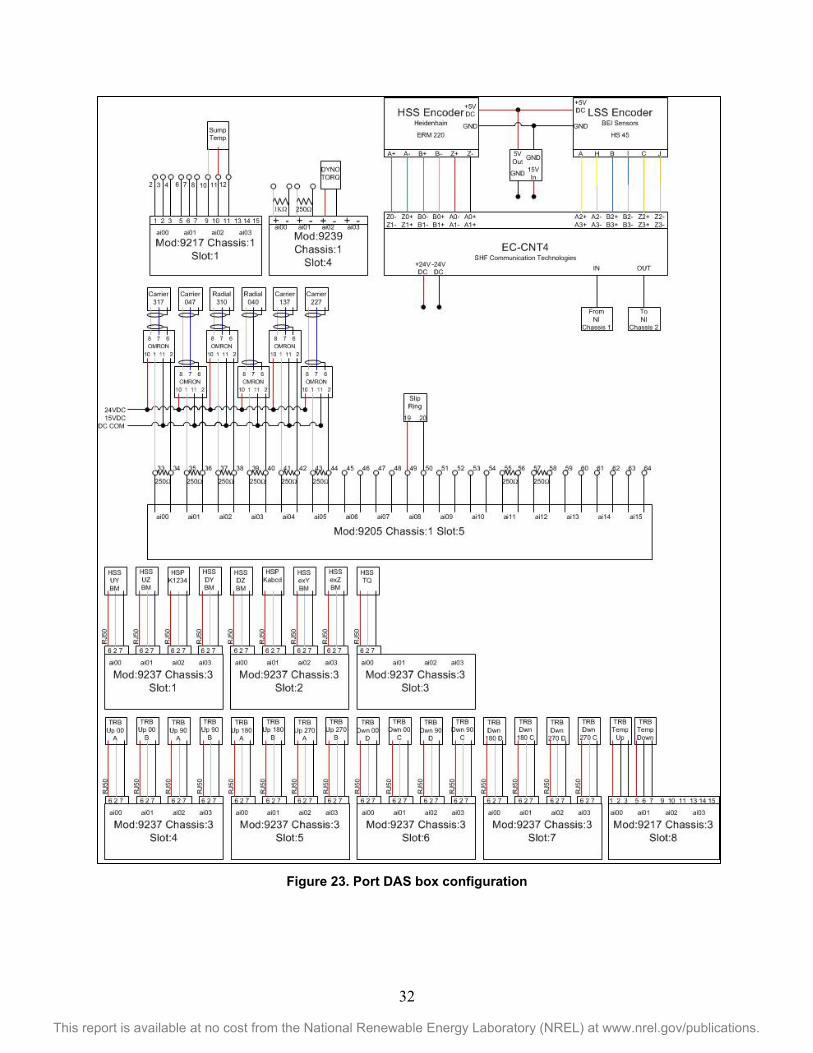
3.3 Data Acquisition System The data acquisition system (DAS) is based on the National Instruments (NI) deterministic Ethernet platform. Figure 6 shows a general layout of the DAS. One system consisting of two backplanes, which processes rotating frame signals generated on the main shaft and carrier assembly, is mounted to the low-speed shaft (LSS). Figure 22 in the Appendix shows the configuration for this LSS DAS box. The output of that system is converted to fiber optic (FO) and sent across an FO rotary joint to the nonrotating frame. On top of the gearbox, a second system is mounted with two more deterministic Ethernet backplanes, which synchronize the different modules, in separate boxes. These two boxes primarily process fixed-frame signals, but also process some rotating system signals from the HSS. Figure 23 and Figure 24 in the Appendix show the configurations for the port and starboard DAS boxes.
Figure 6. Schematic of GRC data acquisition system
7
This report is available at no cost from the National Renewable Energy Laboratory (NREL) at www.nrel.gov/publications.
4 Instrumentation Instrumentation for Phase 3 testing of GB2 was described in detail in the Phase 3 test plan [3]. When the drivetrain was installed and commissioned, however, a number of changes were made for a variety of reasons. Some sensors were found to be nonoperational; others were no longer deemed necessary. The following sections describe these changes. The final section summarizes the signal list.
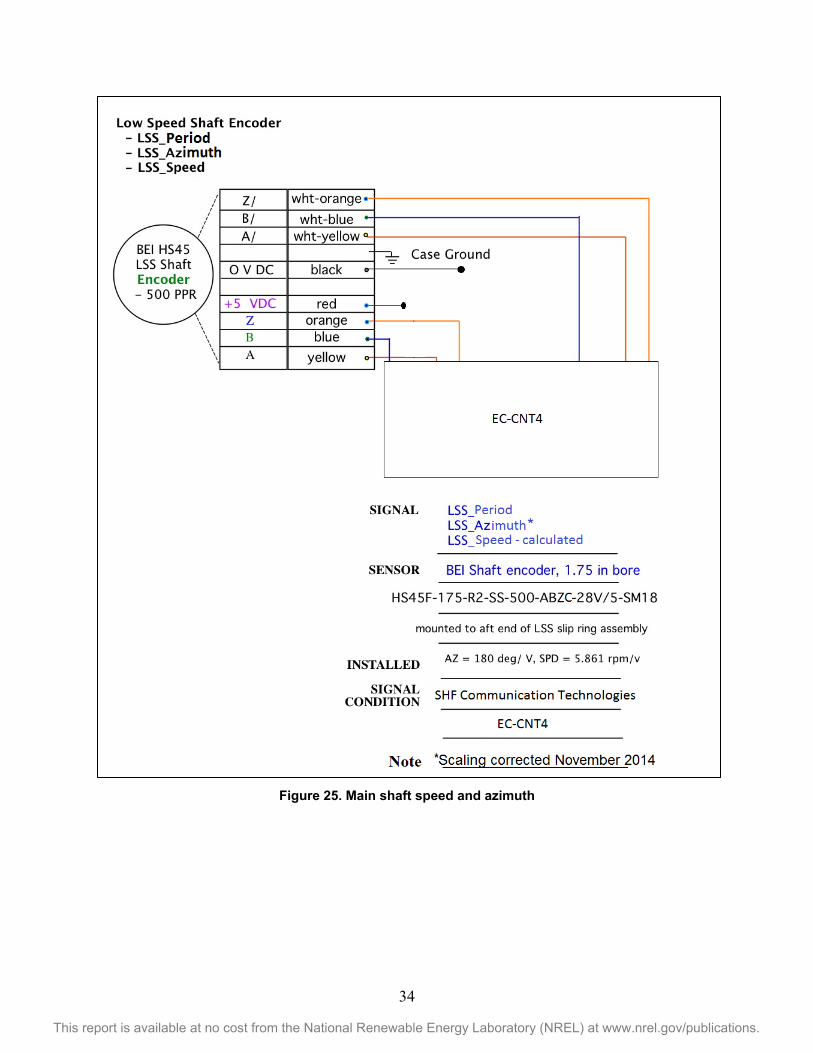
4.1 Main Shaft The main shaft signals measured using the encoder were routed through a new signal conditioning device, as shown in Figure 25 in the Appendix. The DAS was configured to calculate main shaft speed (signal name LSS_Speed), from the measured main shaft period (signal name LSS_Period).
During Phase 3 a scaling error was noted in converting the main shaft azimuth (signal name LSS_Azimuth), to engineering units of degrees. The scale factor was corrected in November 2014 so that the signal ranges from 0º to 360º. Before this, the recorded LSS_Azimuth signals were only scaled to reach just above 351º. LSS_Azimuth values measured before November 2014 can be corrected simply by multiplying by a factor of 1.024. At this point, the DAS was also configured to calculate the total main shaft bending moment (signal name MSBM), and fixed-frame bending moments (signal names MSBM_yy and MSBM_zz), from the measured bending moments in the rotating frame (signal names MSBM_YY and MSBM_ZZ), and the main shaft azimuth. The total and fixed-frame moments were useful to set desired testing conditions using the NTL system.
The main shaft axial proximity sensor referenced in the test plan (signal name MS_Axial), was not installed. This sensor was deemed redundant because the three sensors used to measure the carrier motion could be used to determine the relative motion between the main shaft and gearbox. In addition, the set of six sensors used to measure the gearbox motion described in the next section could also be used to determine the absolute motion of the main shaft relative to the stationary mainframe.
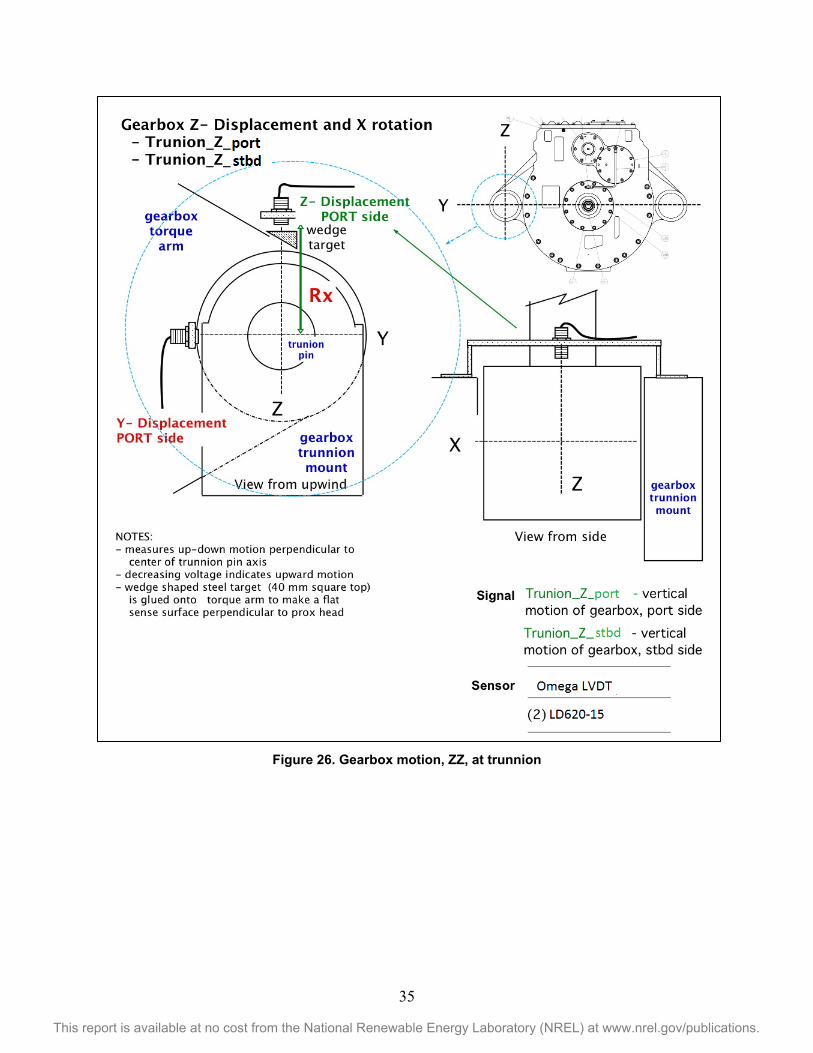
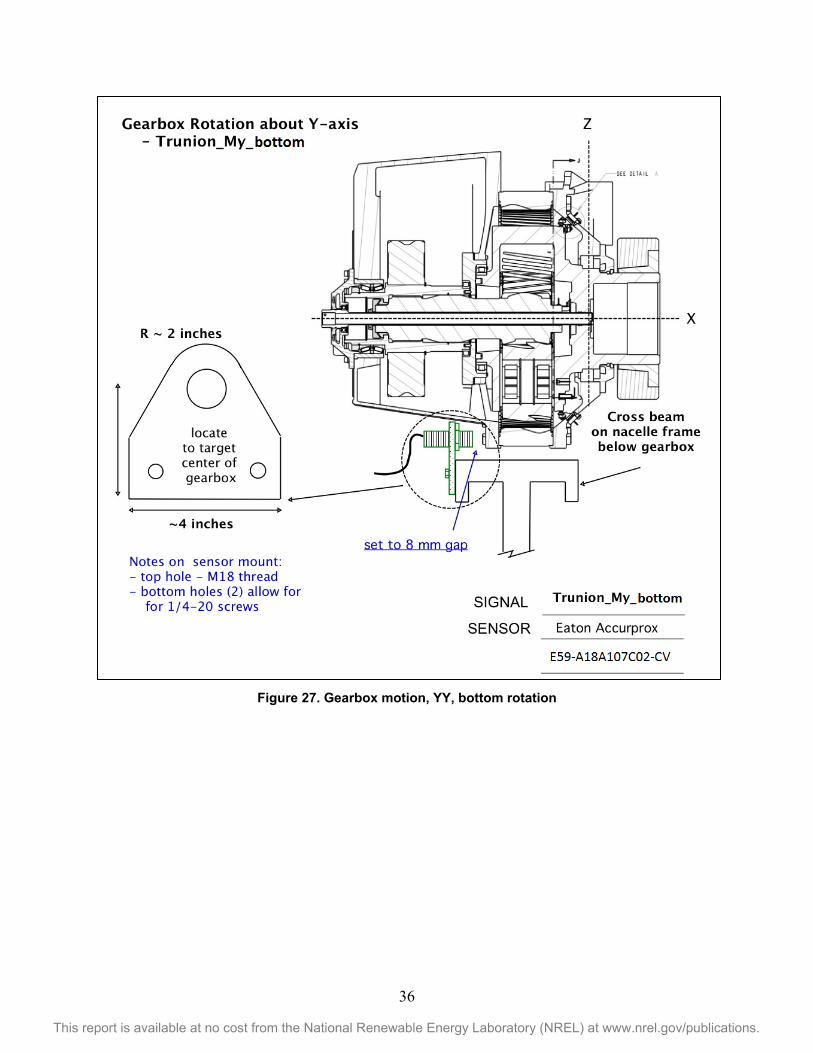
4.2 Gearbox 4.2.1 Housing Motion of the gearbox relative to the mainframe in six degrees of freedom was measured; however, the gearbox vertical motion (signal names Trunion_Z_stbd and Trunion_Z_port), was measured with a linear variable displacement transducer (LVDT) instead of a proximity sensor. The gearbox rotation (signal name Trunion_My_bottom), was measured with a new proximity sensor. Figure 26 and Figure 27 in the Appendix show updated signal sheets for these sensors.
The two triaxial and one uniaxial gearbox accelerometers referenced in the test plan (signal names ACC_port and ACC_stbd), were considered to be redundant with the dedicated condition monitoring accelerometers and were not installed.
8
This report is available at no cost from the National Renewable Energy Laboratory (NREL) at www.nrel.gov/publications.
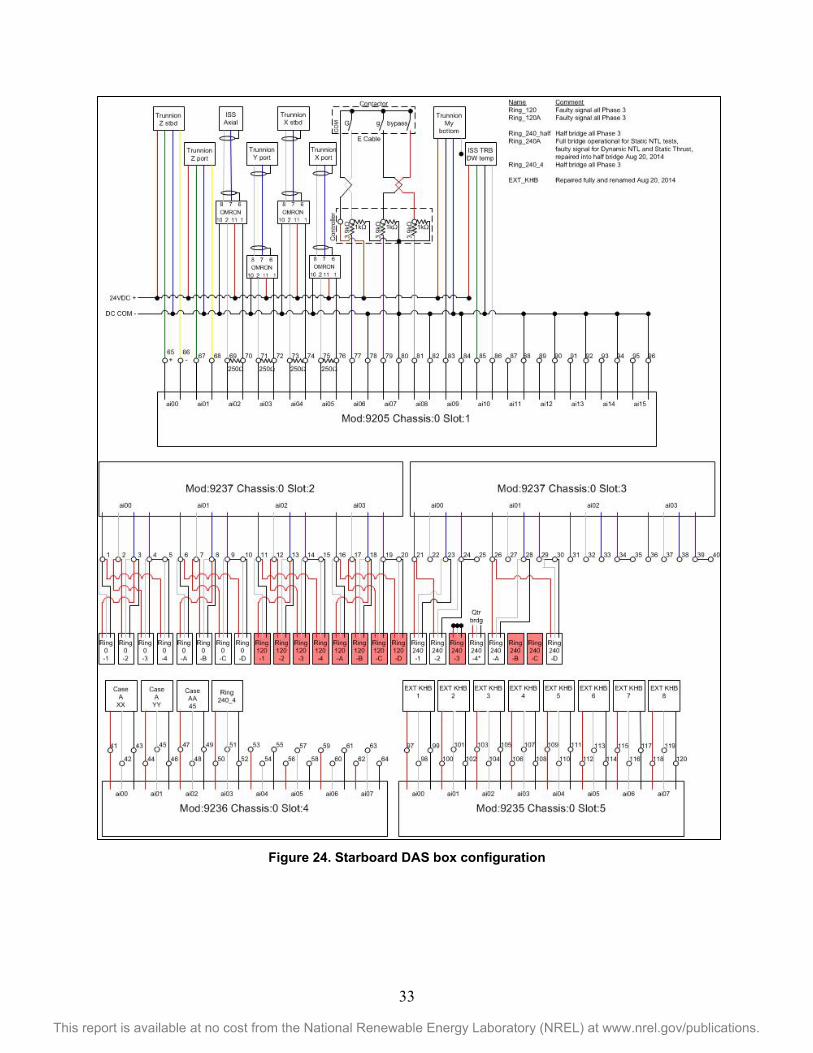
4.2.2 Ring Gear On its inner surface, the ring gear has strain gauges mounted in the root of the internal teeth arranged to sense tooth-bending strain at three circumferential locations. Unfortunately, only the gauges at the top of the gearbox (signal names Ring_0 and Ring_0A) survived all testing entirely intact. Signals Ring_120 and Ring_120A were faulty from the start of Phase 3 testing. Signal Ring_240A ceased to function as a full bridge in April 2014 and was repaired into a half bridge in August 2014 as annotated in Figure 24 in the Appendix.
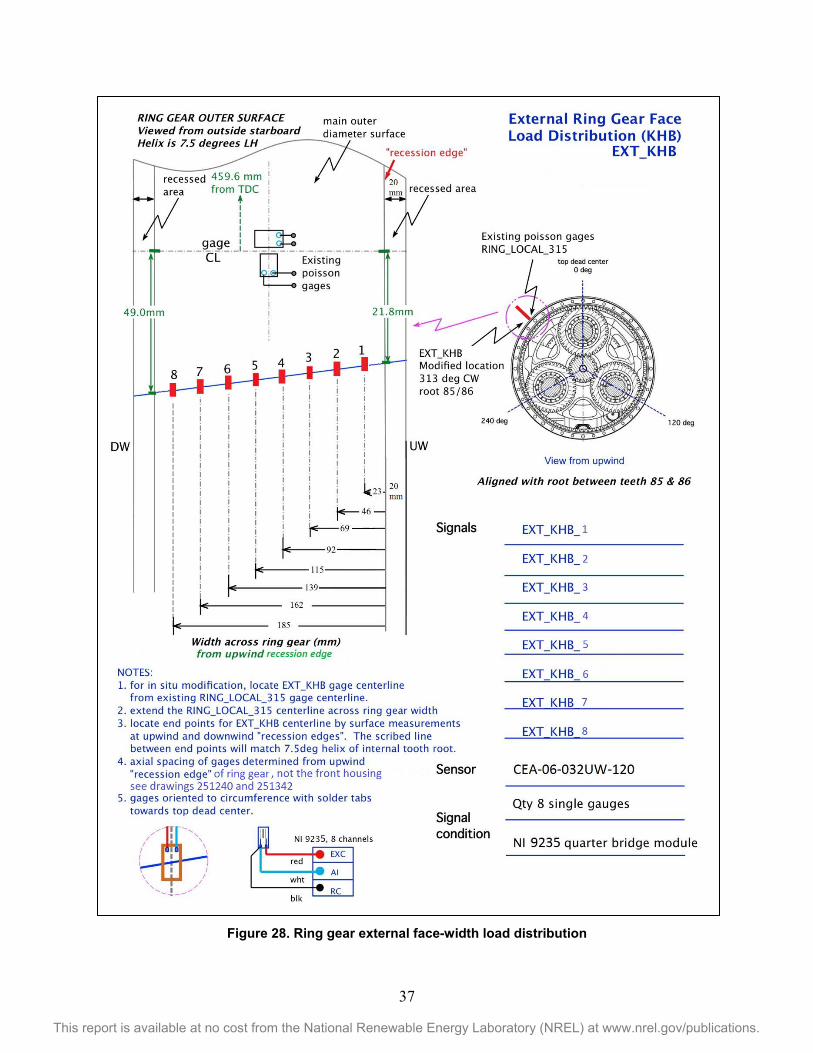
On its external surface, the ring gear had one set of eight strain gauges installed in an arrangement similar to the internal gauges to measure the tooth-face-width load distribution from the exterior of the ring gear. The corresponding signal names are EXT_KHB followed by a numerical position indicator. During testing, it was discovered that these gauges had been installed on a 14° helix angle instead of the proper 7.5° helix angle of the ring gear, and with an incorrect position reference. As a result, all previous data from Phase 1, Phase 2, and the beginning of Phase 3 are invalid. The existing gauges were removed and new gauges were installed and then verified as operational in August 2014. The naming convention for the gauges was changed as shown in the updated signal sheet in Figure 28 in the Appendix. Note that the true axial position of the gauges along the ring gear face width must be determined by adding the dimension of the recessed area of the ring gear (20 mm) to the position of each gauge.
In addition, the four sets of two gauges on the external surface of the ring gear (signal name RING_LOCAL with a corresponding circumferential reference), were discovered to be damaged before Phase 3 testing resumed. They were not repaired because the existing data from Phase 1 and 2 were deemed to be sufficient.
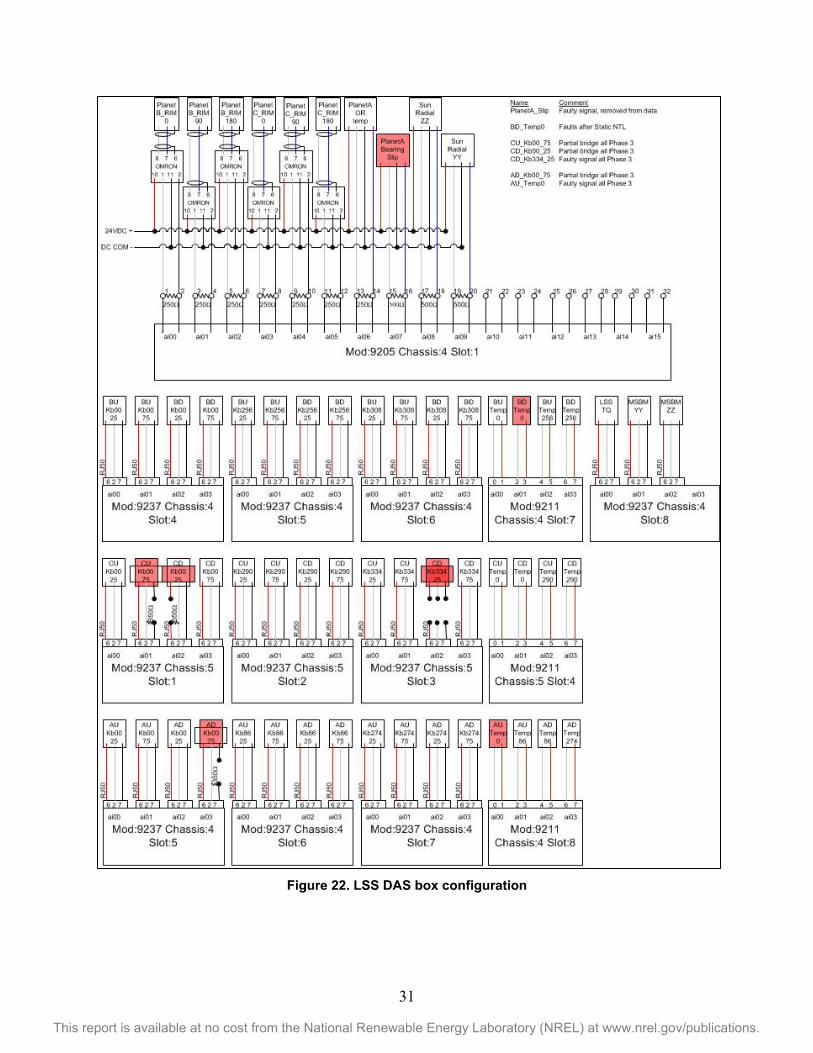
4.2.3 Planetary Bearings Thirty-six strain gauges were mounted in axial grooves in the inner races of the planet bearings to provide information on planet loads and roller contact pressure distribution. Three grooves were machined into each bearing. Each groove has two strain gauge pairs arranged in a Poisson configuration—one pair at 25% and one pair at 75% of the inner ring width. All six bearings have a groove at top dead center, which is in the direction of motion of the planet pin and close to the center of pressure between the pin and the planet. The remaining grooves on each planet are located at different azimuthal locations, as indicated in the signal name. At the start of Phase 3 testing, a few of the planet bearing gauges were found to be damaged as described here and annotated in Figure 22 in the Appendix. Signal CD_Kb334_25 was entirely nonfunctional for all Phase 3 testing. Signals AD_Kb00_75 and CU_Kb00_75 were constituted of only the Poisson gauge; signal CD_Kb00_25 was constituted of only the primary gauge.
Thermocouples were also mounted at the axial midpoint of each groove to measure planet bearing inner race temperatures. Two thermocouples (signals AU_Temp0 and BD_Temp0) were not operational as annotated in Figure 22 in the Appendix.
Finally, the inductive proximity sensor intended to sense passage of the 18 rivets in the roller cage of planet A (signal name PlanetA_bearing_slip), was not operational as annotated in Figure 22 in the Appendix. It was removed from the data stream.
9
This report is available at no cost from the National Renewable Energy Laboratory (NREL) at www.nrel.gov/publications.
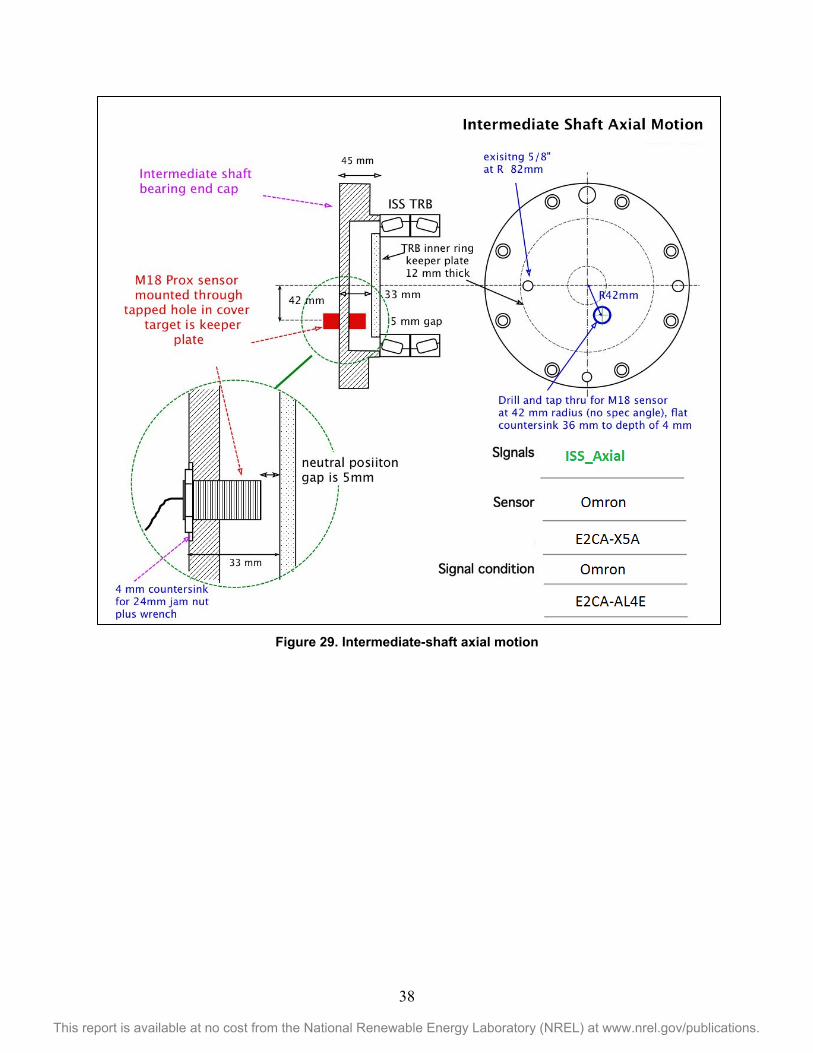
4.2.4 Intermediate Stage Figure 29 in the Appendix shows an updated signal sheet for the intermediate shaft axial position relative to the gearbox housing (signal name ISS_Axial), with the correct sensor type.
4.2.5 High-Speed Shaft In Phase 3, the HSS instrumentation was significantly enhanced to assess HSS, pinion, and bearing loads. The tapered roller bearing strain gauges were calibrated in a special test rig in May 2013 before being installed in the gearbox [9]. The shaft bending and torque strain gauges were calibrated during the initial HSS installation in November 2013 [6].
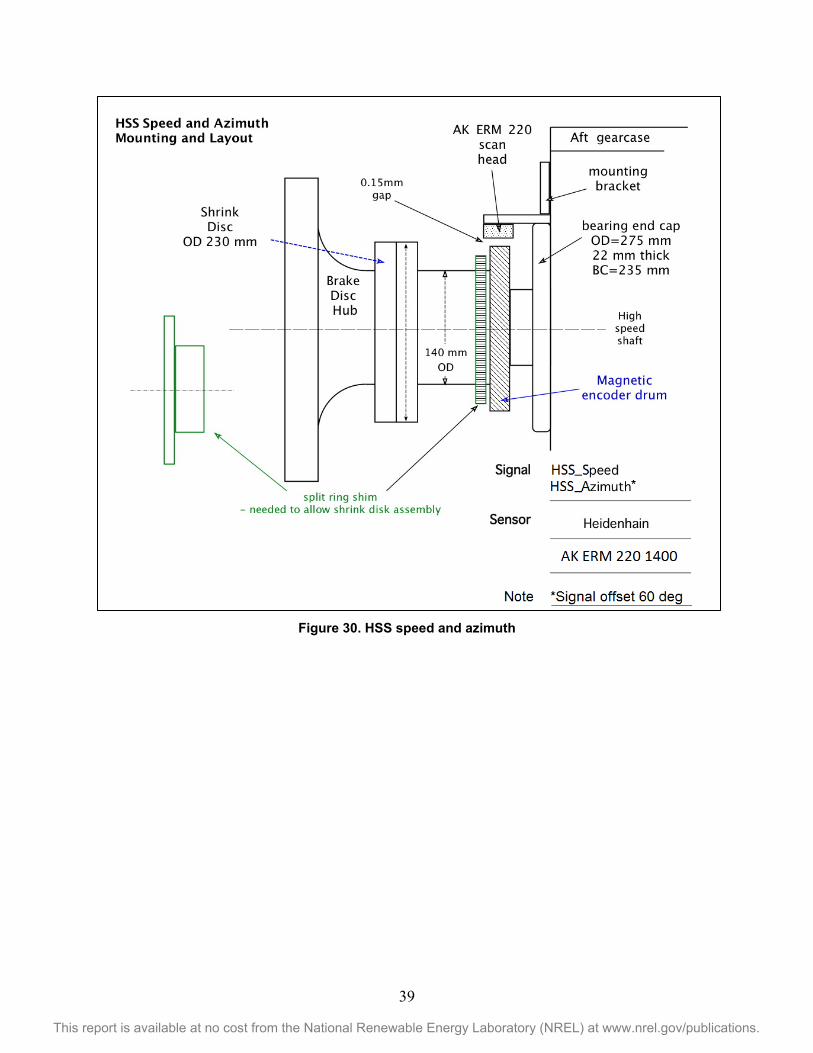
Figure 30 in the Appendix shows an updated signal sheet for the HSS encoder. The DAS was configured to calculate the HSS speed (signal name HSS_Speed), from the measured HSS period (signal name HSS_Period). During Phase 3 testing, it was noted that the measured shaft position (signal name HSS_Azimuth), has a 60º offset in it because of the position of the mounting bracket. This offset should be subtracted from all measured HSS_Azimuth values to align with the reference shown in Figure 30 in the Appendix. In this manner, the reference mark on the HSS is pointing up at a value of 0º.
The five proximity sensors that were used to measure the brake disk position relative to the dynamometer floor in Phase 2 (signal names BRK_ appended with direction and position), were not reinstalled for Phase 3 testing. These measurements were deemed to be superseded by the new direct measurements of the HSS loads.
4.3 Lubrication System The lubrication system is monitored using a variety of sensors. They include the speed of the oil cooler fan (signal name Lube_Fan_Speed); the total flow rate including bypass at the lubrication system pump and flow rate to the gearbox (signal names Lube_Flow_Pump and Lube_Flow_Meter); the pressure at the distribution manifold (signal name Lube_Manifold_Pressure); and the temperatures at the distribution manifold, at the outlet of the oil cooler fan, and at the outlet of the gearbox sump (signal names Lube_Manifold_Temp, Lube_Return_Temp and Sump_Temp).
4.4 Generator The five proximity sensors that were used to measure generator flange position and rotation relative to the dynamometer floor in Phase 2 (signal names GEN_ appended with direction and position), were not reinstalled for Phase 3 testing. In addition, the encoder on the generator and the resistance temperature detector (RTD) on the downwind generator bearing were not installed.
4.5 Mainframe The mainframe displacement measurements (signal names FRAME_Z appended with direction), were also not reinstalled for Phase 3 testing.
4.6 Condition Monitoring The main bearing, gearbox, and lubrication system were also instrumented with various vibration, acoustic emission, and oil analysis condition monitoring systems [10].
10
This report is available at no cost from the National Renewable Energy Laboratory (NREL) at www.nrel.gov/publications.
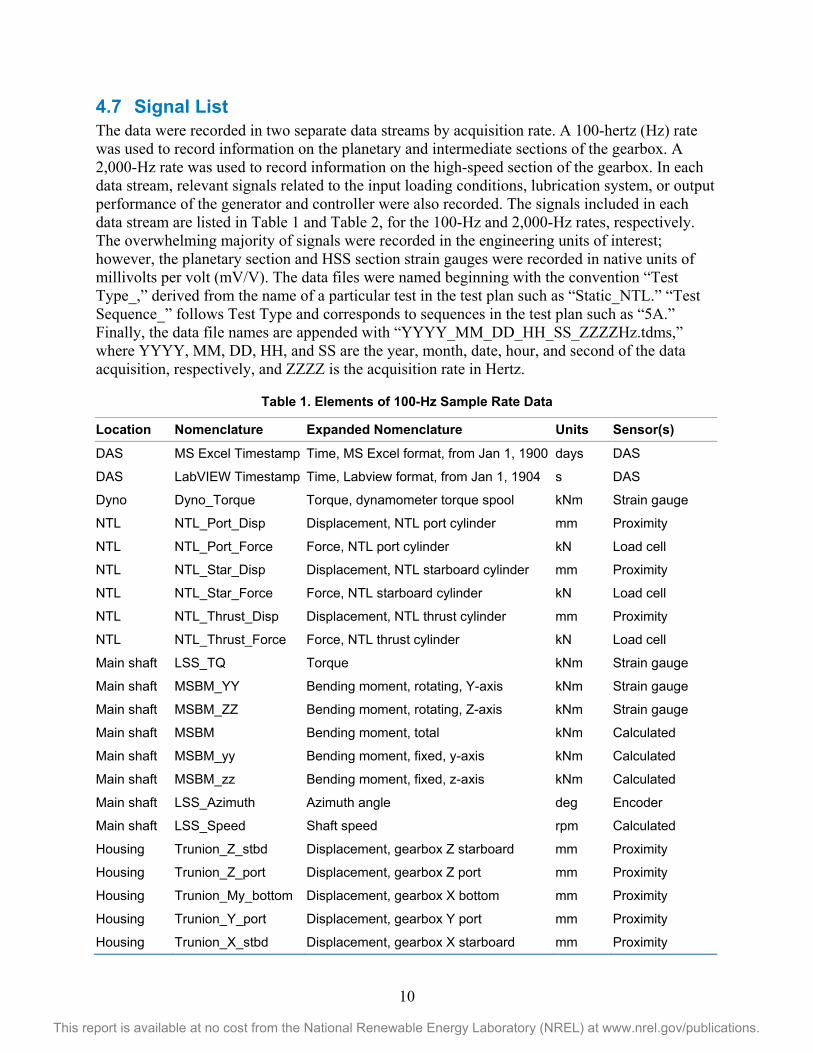
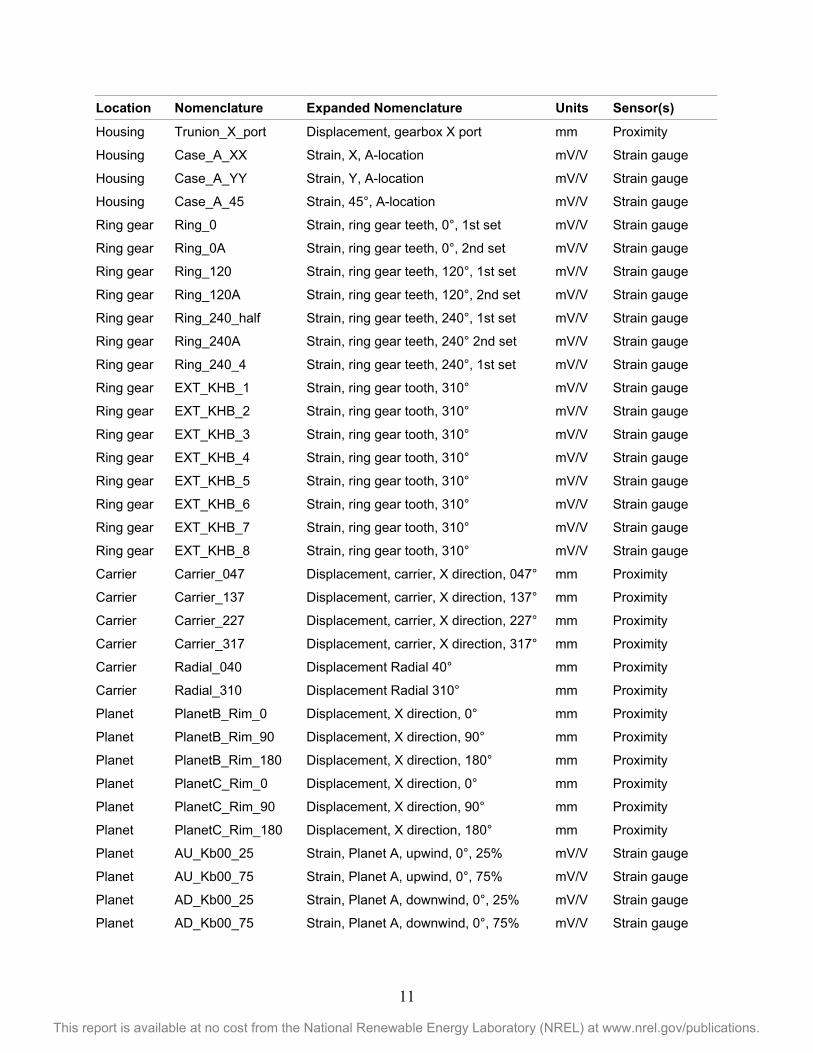
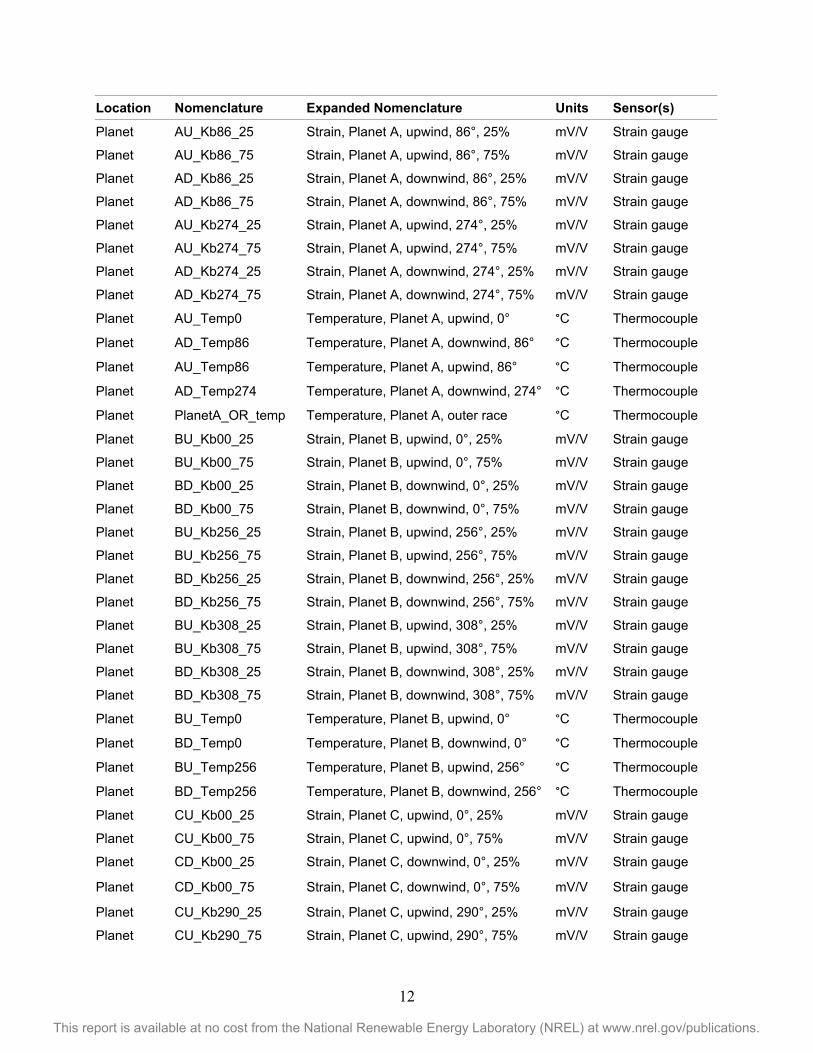
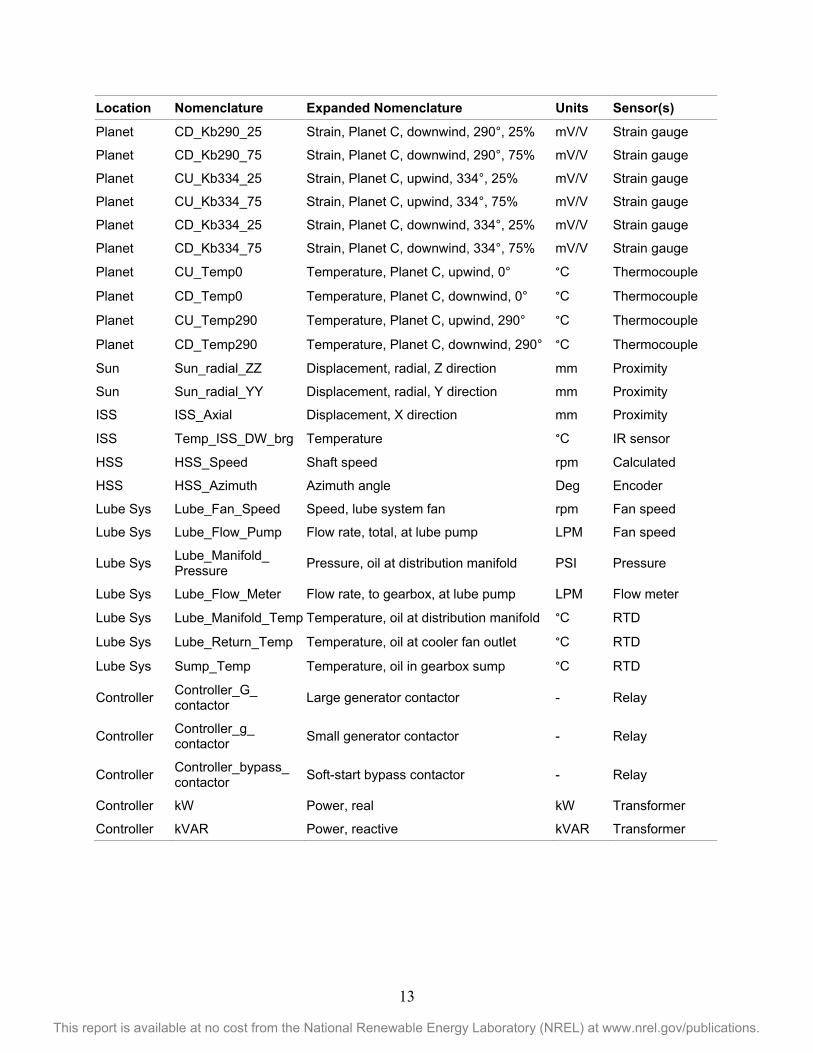
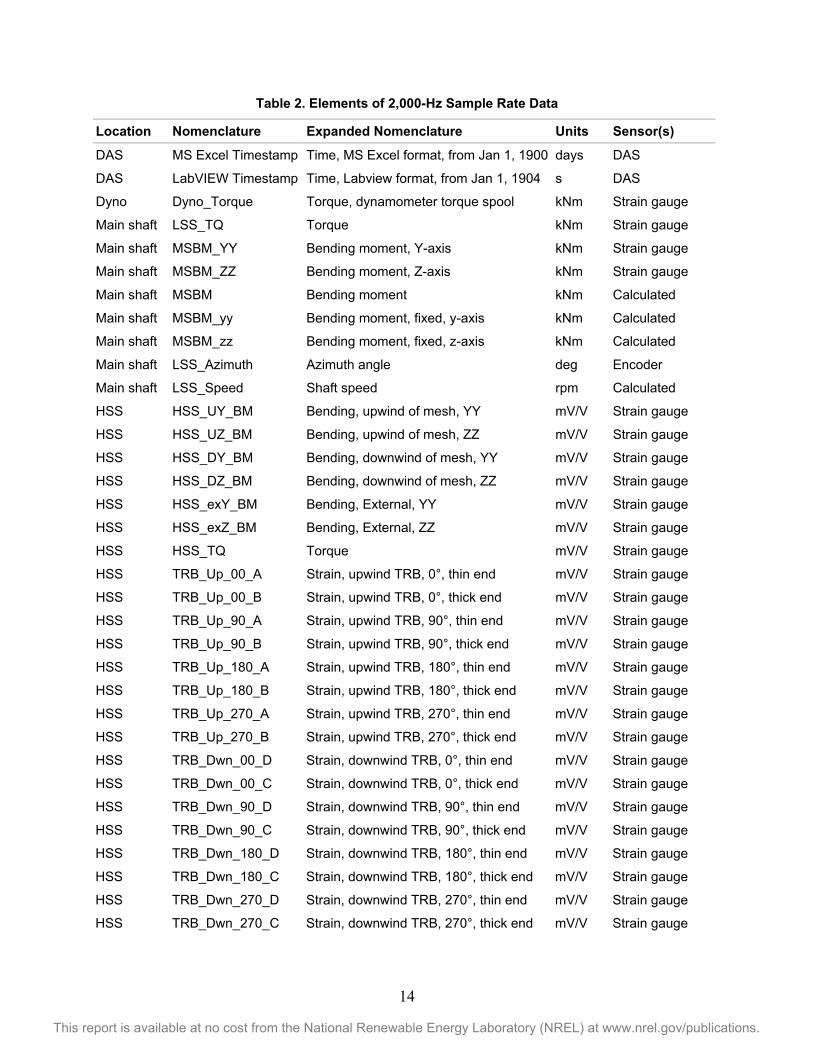
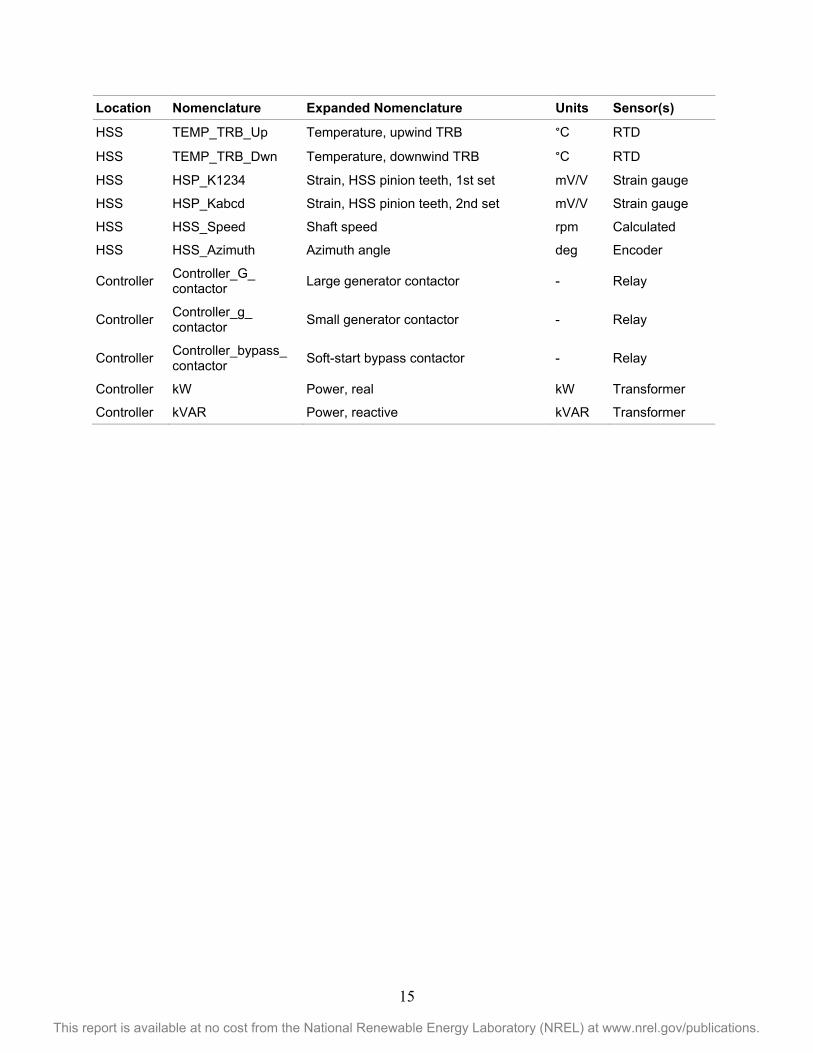
4.7 Signal List The data were recorded in two separate data streams by acquisition rate. A 100-hertz (Hz) rate was used to record information on the planetary and intermediate sections of the gearbox. A 2,000-Hz rate was used to record information on the high-speed section of the gearbox. In each data stream, relevant signals related to the input loading conditions, lubrication system, or output performance of the generator and controller were also recorded. The signals included in each data stream are listed in Table 1 and Table 2, for the 100-Hz and 2,000-Hz rates, respectively. The overwhelming majority of signals were recorded in the engineering units of interest; however, the planetary section and HSS section strain gauges were recorded in native units of millivolts per volt (mV/V). The data files were named beginning with the convention “Test Type_,” derived from the name of a particular test in the test plan such as “Static_NTL.” “Test Sequence_” follows Test Type and corresponds to sequences in the test plan such as “5A.” Finally, the data file names are appended with “YYYY_MM_DD_HH_SS_ZZZZHz.tdms,” where YYYY, MM, DD, HH, and SS are the year, month, date, hour, and second of the data acquisition, respectively, and ZZZZ is the acquisition rate in Hertz.
Table 1. Elements of 100-Hz Sample Rate Data
Location Nomenclature Expanded Nomenclature Units Sensor(s)
DAS MS Excel Timestamp Time, MS Excel format, from Jan 1, 1900 days DAS
DAS LabVIEW Timestamp Time, Labview format, from Jan 1, 1904 s DAS
Dyno Dyno_Torque Torque, dynamometer torque spool kNm Strain gauge
NTL NTL_Port_Disp Displacement, NTL port cylinder mm Proximity
NTL NTL_Port_Force Force, NTL port cylinder kN Load cell
NTL NTL_Star_Disp Displacement, NTL starboard cylinder mm Proximity
NTL NTL_Star_Force Force, NTL starboard cylinder kN Load cell
NTL NTL_Thrust_Disp Displacement, NTL thrust cylinder mm Proximity
NTL NTL_Thrust_Force Force, NTL thrust cylinder kN Load cell
Main shaft LSS_TQ Torque kNm Strain gauge
Main shaft MSBM_YY Bending moment, rotating, Y-axis kNm Strain gauge
Main shaft MSBM_ZZ Bending moment, rotating, Z-axis kNm Strain gauge
Main shaft MSBM Bending moment, total kNm Calculated
Main shaft MSBM_yy Bending moment, fixed, y-axis kNm Calculated
Main shaft MSBM_zz Bending moment, fixed, z-axis kNm Calculated
Main shaft LSS_Azimuth Azimuth angle deg Encoder
Main shaft LSS_Speed Shaft speed rpm Calculated
Housing Trunion_Z_stbd Displacement, gearbox Z starboard mm Proximity
Housing Trunion_Z_port Displacement, gearbox Z port mm Proximity
Housing Trunion_My_bottom Displacement, gearbox X bottom mm Proximity
Housing Trunion_Y_port Displacement, gearbox Y port mm Proximity
Housing Trunion_X_stbd Displacement, gearbox X starboard mm Proximity
11
This report is available at no cost from the National Renewable Energy Laboratory (NREL) at www.nrel.gov/publications.
Location Nomenclature Expanded Nomenclature Units Sensor(s)
Housing Trunion_X_port Displacement, gearbox X port mm Proximity
Housing Case_A_XX Strain, X, A-location mV/V Strain gauge
Housing Case_A_YY Strain, Y, A-location mV/V Strain gauge
Housing Case_A_45 Strain, 45°, A-location mV/V Strain gauge
Ring gear Ring_0 Strain, ring gear teeth, 0°, 1st set mV/V Strain gauge
Ring gear Ring_0A Strain, ring gear teeth, 0°, 2nd set mV/V Strain gauge
Ring gear Ring_120 Strain, ring gear teeth, 120°, 1st set mV/V Strain gauge
Ring gear Ring_120A Strain, ring gear teeth, 120°, 2nd set mV/V Strain gauge
Ring gear Ring_240_half Strain, ring gear teeth, 240°, 1st set mV/V Strain gauge
Ring gear Ring_240A Strain, ring gear teeth, 240° 2nd set mV/V Strain gauge
Ring gear Ring_240_4 Strain, ring gear teeth, 240°, 1st set mV/V Strain gauge
Ring gear EXT_KHB_1 Strain, ring gear tooth, 310° mV/V Strain gauge
Ring gear EXT_KHB_2 Strain, ring gear tooth, 310° mV/V Strain gauge
Ring gear EXT_KHB_3 Strain, ring gear tooth, 310° mV/V Strain gauge
Ring gear EXT_KHB_4 Strain, ring gear tooth, 310° mV/V Strain gauge
Ring gear EXT_KHB_5 Strain, ring gear tooth, 310° mV/V Strain gauge
Ring gear EXT_KHB_6 Strain, ring gear tooth, 310° mV/V Strain gauge
Ring gear EXT_KHB_7 Strain, ring gear tooth, 310° mV/V Strain gauge
Ring gear EXT_KHB_8 Strain, ring gear tooth, 310° mV/V Strain gauge
Carrier Carrier_047 Displacement, carrier, X direction, 047° mm Proximity
Carrier Carrier_137 Displacement, carrier, X direction, 137° mm Proximity
Carrier Carrier_227 Displacement, carrier, X direction, 227° mm Proximity
Carrier Carrier_317 Displacement, carrier, X direction, 317° mm Proximity
Carrier Radial_040 Displacement Radial 40° mm Proximity
Carrier Radial_310 Displacement Radial 310° mm Proximity
Planet PlanetB_Rim_0 Displacement, X direction, 0° mm Proximity
Planet PlanetB_Rim_90 Displacement, X direction, 90° mm Proximity
Planet PlanetB_Rim_180 Displacement, X direction, 180° mm Proximity
Planet PlanetC_Rim_0 Displacement, X direction, 0° mm Proximity
Planet PlanetC_Rim_90 Displacement, X direction, 90° mm Proximity
Planet PlanetC_Rim_180 Displacement, X direction, 180° mm Proximity
Planet AU_Kb00_25 Strain, Planet A, upwind, 0°, 25% mV/V Strain gauge
Planet AU_Kb00_75 Strain, Planet A, upwind, 0°, 75% mV/V Strain gauge
Planet AD_Kb00_25 Strain, Planet A, downwind, 0°, 25% mV/V Strain gauge
Planet AD_Kb00_75 Strain, Planet A, downwind, 0°, 75% mV/V Strain gauge
12
This report is available at no cost from the National Renewable Energy Laboratory (NREL) at www.nrel.gov/publications.
Location Nomenclature Expanded Nomenclature Units Sensor(s)
Planet AU_Kb86_25 Strain, Planet A, upwind, 86°, 25% mV/V Strain gauge
Planet AU_Kb86_75 Strain, Planet A, upwind, 86°, 75% mV/V Strain gauge
Planet AD_Kb86_25 Strain, Planet A, downwind, 86°, 25% mV/V Strain gauge
Planet AD_Kb86_75 Strain, Planet A, downwind, 86°, 75% mV/V Strain gauge
Planet AU_Kb274_25 Strain, Planet A, upwind, 274°, 25% mV/V Strain gauge
Planet AU_Kb274_75 Strain, Planet A, upwind, 274°, 75% mV/V Strain gauge
Planet AD_Kb274_25 Strain, Planet A, downwind, 274°, 25% mV/V Strain gauge
Planet AD_Kb274_75 Strain, Planet A, downwind, 274°, 75% mV/V Strain gauge
Planet AU_Temp0 Temperature, Planet A, upwind, 0° °C Thermocouple
Planet AD_Temp86 Temperature, Planet A, downwind, 86° °C Thermocouple
Planet AU_Temp86 Temperature, Planet A, upwind, 86° °C Thermocouple
Planet AD_Temp274 Temperature, Planet A, downwind, 274° °C Thermocouple
Planet PlanetA_OR_temp Temperature, Planet A, outer race °C Thermocouple
Planet BU_Kb00_25 Strain, Planet B, upwind, 0°, 25% mV/V Strain gauge
Planet BU_Kb00_75 Strain, Planet B, upwind, 0°, 75% mV/V Strain gauge
Planet BD_Kb00_25 Strain, Planet B, downwind, 0°, 25% mV/V Strain gauge
Planet BD_Kb00_75 Strain, Planet B, downwind, 0°, 75% mV/V Strain gauge
Planet BU_Kb256_25 Strain, Planet B, upwind, 256°, 25% mV/V Strain gauge
Planet BU_Kb256_75 Strain, Planet B, upwind, 256°, 75% mV/V Strain gauge
Planet BD_Kb256_25 Strain, Planet B, downwind, 256°, 25% mV/V Strain gauge
Planet BD_Kb256_75 Strain, Planet B, downwind, 256°, 75% mV/V Strain gauge
Planet BU_Kb308_25 Strain, Planet B, upwind, 308°, 25% mV/V Strain gauge
Planet BU_Kb308_75 Strain, Planet B, upwind, 308°, 75% mV/V Strain gauge
Planet BD_Kb308_25 Strain, Planet B, downwind, 308°, 25% mV/V Strain gauge
Planet BD_Kb308_75 Strain, Planet B, downwind, 308°, 75% mV/V Strain gauge
Planet BU_Temp0 Temperature, Planet B, upwind, 0° °C Thermocouple
Planet BD_Temp0 Temperature, Planet B, downwind, 0° °C Thermocouple
Planet BU_Temp256 Temperature, Planet B, upwind, 256° °C Thermocouple
Planet BD_Temp256 Temperature, Planet B, downwind, 256° °C Thermocouple
Planet CU_Kb00_25 Strain, Planet C, upwind, 0°, 25% mV/V Strain gauge
Planet CU_Kb00_75 Strain, Planet C, upwind, 0°, 75% mV/V Strain gauge
Planet CD_Kb00_25 Strain, Planet C, downwind, 0°, 25% mV/V Strain gauge
Planet CD_Kb00_75 Strain, Planet C, downwind, 0°, 75% mV/V Strain gauge
Planet CU_Kb290_25 Strain, Planet C, upwind, 290°, 25% mV/V Strain gauge
Planet CU_Kb290_75 Strain, Planet C, upwind, 290°, 75% mV/V Strain gauge
13
This report is available at no cost from the National Renewable Energy Laboratory (NREL) at www.nrel.gov/publications.
Location Nomenclature Expanded Nomenclature Units Sensor(s)
Planet CD_Kb290_25 Strain, Planet C, downwind, 290°, 25% mV/V Strain gauge
Planet CD_Kb290_75 Strain, Planet C, downwind, 290°, 75% mV/V Strain gauge
Planet CU_Kb334_25 Strain, Planet C, upwind, 334°, 25% mV/V Strain gauge
Planet CU_Kb334_75 Strain, Planet C, upwind, 334°, 75% mV/V Strain gauge
Planet CD_Kb334_25 Strain, Planet C, downwind, 334°, 25% mV/V Strain gauge
Planet CD_Kb334_75 Strain, Planet C, downwind, 334°, 75% mV/V Strain gauge
Planet CU_Temp0 Temperature, Planet C, upwind, 0° °C Thermocouple
Planet CD_Temp0 Temperature, Planet C, downwind, 0° °C Thermocouple
Planet CU_Temp290 Temperature, Planet C, upwind, 290° °C Thermocouple
Planet CD_Temp290 Temperature, Planet C, downwind, 290° °C Thermocouple
Sun Sun_radial_ZZ Displacement, radial, Z direction mm Proximity
Sun Sun_radial_YY Displacement, radial, Y direction mm Proximity
ISS ISS_Axial Displacement, X direction mm Proximity
ISS Temp_ISS_DW_brg Temperature °C IR sensor
HSS HSS_Speed Shaft speed rpm Calculated
HSS HSS_Azimuth Azimuth angle Deg Encoder
Lube Sys Lube_Fan_Speed Speed, lube system fan rpm Fan speed
Lube Sys Lube_Flow_Pump Flow rate, total, at lube pump LPM Fan speed
Lube Sys Lube_Manifold_ Pressure Pressure, oil at distribution manifold PSI Pressure
Lube Sys Lube_Flow_Meter Flow rate, to gearbox, at lube pump LPM Flow meter
Lube Sys Lube_Manifold_Temp Temperature, oil at distribution manifold °C RTD
Lube Sys Lube_Return_Temp Temperature, oil at cooler fan outlet °C RTD
Lube Sys Sump_Temp Temperature, oil in gearbox sump °C RTD
Controller Controller_G_ contactor Large generator contactor - Relay
Controller Controller_g_ contactor Small generator contactor - Relay
Controller Controller_bypass_ contactor Soft-start bypass contactor - Relay
Controller kW Power, real kW Transformer
Controller kVAR Power, reactive kVAR Transformer
14
This report is available at no cost from the National Renewable Energy Laboratory (NREL) at www.nrel.gov/publications.
Table 2. Elements of 2,000-Hz Sample Rate Data
Location Nomenclature Expanded Nomenclature Units Sensor(s)
DAS MS Excel Timestamp Time, MS Excel format, from Jan 1, 1900 days DAS
DAS LabVIEW Timestamp Time, Labview format, from Jan 1, 1904 s DAS
Dyno Dyno_Torque Torque, dynamometer torque spool kNm Strain gauge
Main shaft LSS_TQ Torque kNm Strain gauge
Main shaft MSBM_YY Bending moment, Y-axis kNm Strain gauge
Main shaft MSBM_ZZ Bending moment, Z-axis kNm Strain gauge
Main shaft MSBM Bending moment kNm Calculated
Main shaft MSBM_yy Bending moment, fixed, y-axis kNm Calculated
Main shaft MSBM_zz Bending moment, fixed, z-axis kNm Calculated
Main shaft LSS_Azimuth Azimuth angle deg Encoder
Main shaft LSS_Speed Shaft speed rpm Calculated
HSS HSS_UY_BM Bending, upwind of mesh, YY mV/V Strain gauge
HSS HSS_UZ_BM Bending, upwind of mesh, ZZ mV/V Strain gauge
HSS HSS_DY_BM Bending, downwind of mesh, YY mV/V Strain gauge
HSS HSS_DZ_BM Bending, downwind of mesh, ZZ mV/V Strain gauge
HSS HSS_exY_BM Bending, External, YY mV/V Strain gauge
HSS HSS_exZ_BM Bending, External, ZZ mV/V Strain gauge
HSS HSS_TQ Torque mV/V Strain gauge
HSS TRB_Up_00_A Strain, upwind TRB, 0°, thin end mV/V Strain gauge
HSS TRB_Up_00_B Strain, upwind TRB, 0°, thick end mV/V Strain gauge
HSS TRB_Up_90_A Strain, upwind TRB, 90°, thin end mV/V Strain gauge
HSS TRB_Up_90_B Strain, upwind TRB, 90°, thick end mV/V Strain gauge
HSS TRB_Up_180_A Strain, upwind TRB, 180°, thin end mV/V Strain gauge
HSS TRB_Up_180_B Strain, upwind TRB, 180°, thick end mV/V Strain gauge
HSS TRB_Up_270_A Strain, upwind TRB, 270°, thin end mV/V Strain gauge
HSS TRB_Up_270_B Strain, upwind TRB, 270°, thick end mV/V Strain gauge
HSS TRB_Dwn_00_D Strain, downwind TRB, 0°, thin end mV/V Strain gauge
HSS TRB_Dwn_00_C Strain, downwind TRB, 0°, thick end mV/V Strain gauge
HSS TRB_Dwn_90_D Strain, downwind TRB, 90°, thin end mV/V Strain gauge
HSS TRB_Dwn_90_C Strain, downwind TRB, 90°, thick end mV/V Strain gauge
HSS TRB_Dwn_180_D Strain, downwind TRB, 180°, thin end mV/V Strain gauge
HSS TRB_Dwn_180_C Strain, downwind TRB, 180°, thick end mV/V Strain gauge
HSS TRB_Dwn_270_D Strain, downwind TRB, 270°, thin end mV/V Strain gauge
HSS TRB_Dwn_270_C Strain, downwind TRB, 270°, thick end mV/V Strain gauge
15
This report is available at no cost from the National Renewable Energy Laboratory (NREL) at www.nrel.gov/publications.
Location Nomenclature Expanded Nomenclature Units Sensor(s)
HSS TEMP_TRB_Up Temperature, upwind TRB °C RTD
HSS TEMP_TRB_Dwn Temperature, downwind TRB °C RTD
HSS HSP_K1234 Strain, HSS pinion teeth, 1st set mV/V Strain gauge
HSS HSP_Kabcd Strain, HSS pinion teeth, 2nd set mV/V Strain gauge
HSS HSS_Speed Shaft speed rpm Calculated
HSS HSS_Azimuth Azimuth angle deg Encoder
Controller Controller_G_ contactor Large generator contactor - Relay
Controller Controller_g_ contactor Small generator contactor - Relay
Controller Controller_bypass_ contactor Soft-start bypass contactor - Relay
Controller kW Power, real kW Transformer
Controller kVAR Power, reactive kVAR Transformer
16
This report is available at no cost from the National Renewable Energy Laboratory (NREL) at www.nrel.gov/publications.
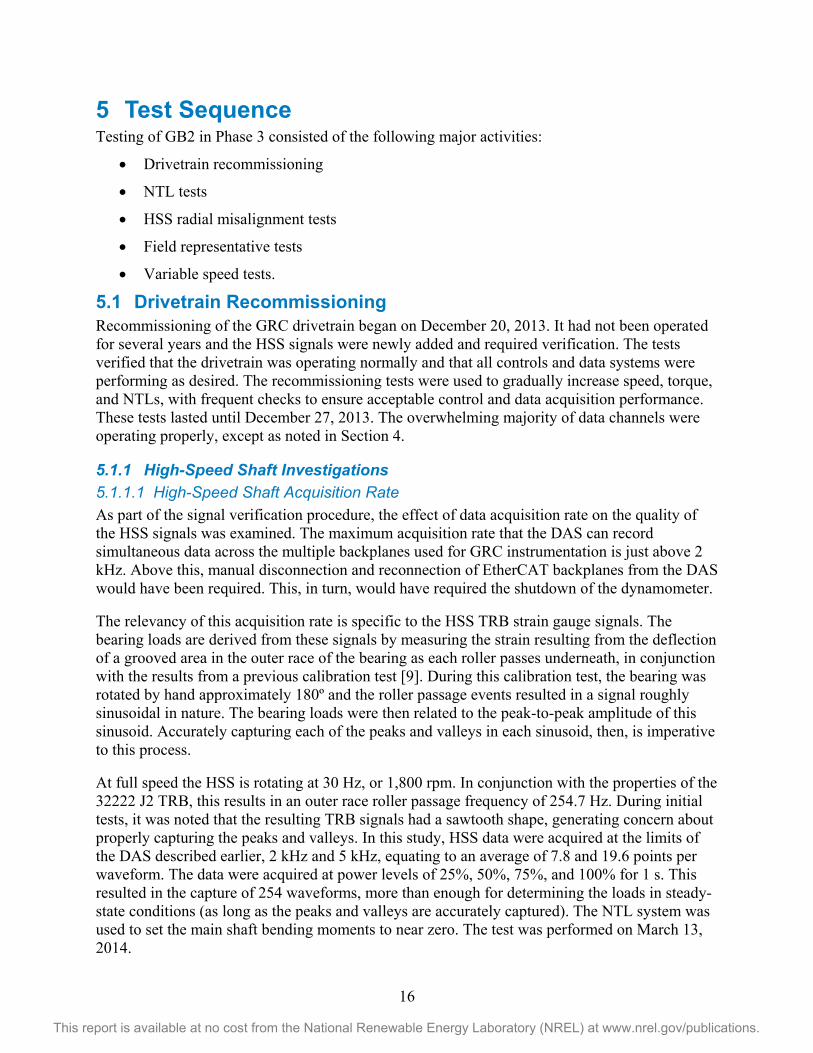
5 Test Sequence Testing of GB2 in Phase 3 consisted of the following major activities:
• Drivetrain recommissioning
• NTL tests
• HSS radial misalignment tests
• Field representative tests
• Variable speed tests.
5.1 Drivetrain Recommissioning Recommissioning of the GRC drivetrain began on December 20, 2013. It had not been operated for several years and the HSS signals were newly added and required verification. The tests verified that the drivetrain was operating normally and that all controls and data systems were performing as desired. The recommissioning tests were used to gradually increase speed, torque, and NTLs, with frequent checks to ensure acceptable control and data acquisition performance. These tests lasted until December 27, 2013. The overwhelming majority of data channels were operating properly, except as noted in Section 4.
5.1.1 High-Speed Shaft Investigations 5.1.1.1 High-Speed Shaft Acquisition Rate As part of the signal verification procedure, the effect of data acquisition rate on the quality of the HSS signals was examined. The maximum acquisition rate that the DAS can record simultaneous data across the multiple backplanes used for GRC instrumentation is just above 2 kHz. Above this, manual disconnection and reconnection of EtherCAT backplanes from the DAS would have been required. This, in turn, would have required the shutdown of the dynamometer.
The relevancy of this acquisition rate is specific to the HSS TRB strain gauge signals. The bearing loads are derived from these signals by measuring the strain resulting from the deflection of a grooved area in the outer race of the bearing as each roller passes underneath, in conjunction with the results from a previous calibration test [9]. During this calibration test, the bearing was rotated by hand approximately 180º and the roller passage events resulted in a signal roughly sinusoidal in nature. The bearing loads were then related to the peak-to-peak amplitude of this sinusoid. Accurately capturing each of the peaks and valleys in each sinusoid, then, is imperative to this process.
At full speed the HSS is rotating at 30 Hz, or 1,800 rpm. In conjunction with the properties of the 32222 J2 TRB, this results in an outer race roller passage frequency of 254.7 Hz. During initial tests, it was noted that the resulting TRB signals had a sawtooth shape, generating concern about properly capturing the peaks and valleys. In this study, HSS data were acquired at the limits of the DAS described earlier, 2 kHz and 5 kHz, equating to an average of 7.8 and 19.6 points per waveform. The data were acquired at power levels of 25%, 50%, 75%, and 100% for 1 s. This resulted in the capture of 254 waveforms, more than enough for determining the loads in steady-state conditions (as long as the peaks and valleys are accurately captured). The NTL system was used to set the main shaft bending moments to near zero. The test was performed on March 13, 2014.
17
This report is available at no cost from the National Renewable Energy Laboratory (NREL) at www.nrel.gov/publications.
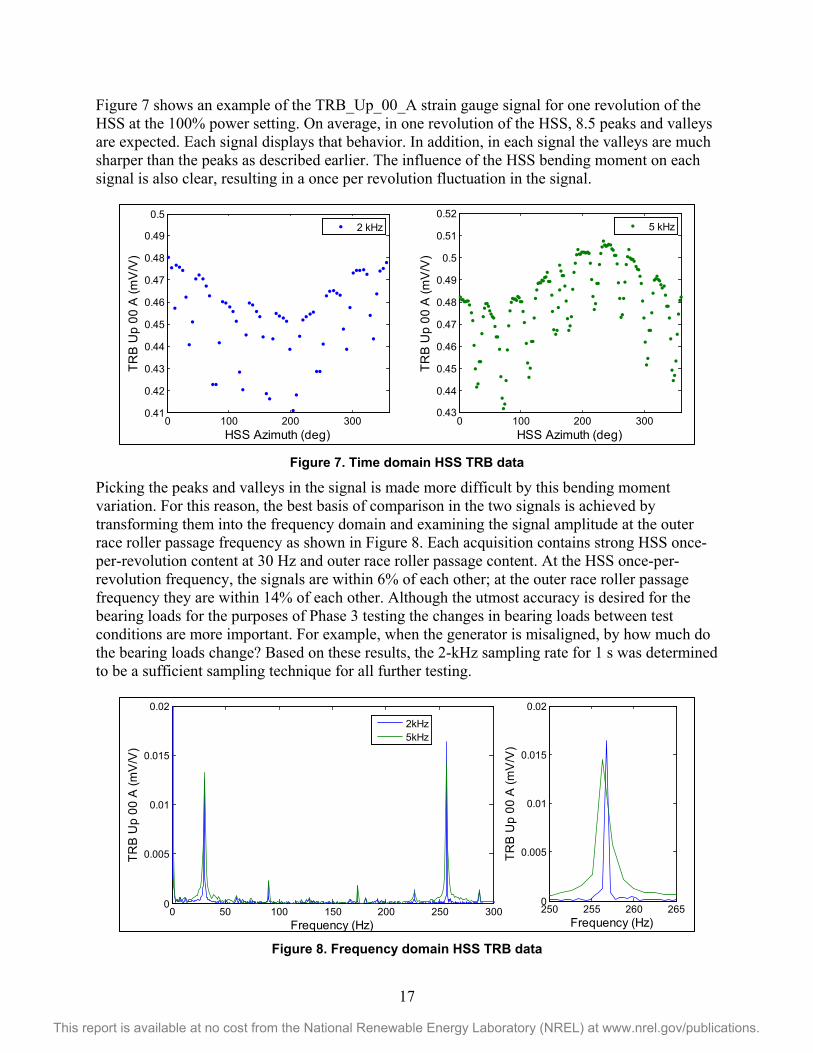
Figure 7 shows an example of the TRB_Up_00_A strain gauge signal for one revolution of the HSS at the 100% power setting. On average, in one revolution of the HSS, 8.5 peaks and valleys are expected. Each signal displays that behavior. In addition, in each signal the valleys are much sharper than the peaks as described earlier. The influence of the HSS bending moment on each signal is also clear, resulting in a once per revolution fluctuation in the signal.
Figure 7. Time domain HSS TRB data
Picking the peaks and valleys in the signal is made more difficult by this bending moment variation. For this reason, the best basis of comparison in the two signals is achieved by transforming them into the frequency domain and examining the signal amplitude at the outer race roller passage frequency as shown in Figure 8. Each acquisition contains strong HSS once-per-revolution content at 30 Hz and outer race roller passage content. At the HSS once-per-revolution frequency, the signals are within 6% of each other; at the outer race roller passage frequency they are within 14% of each other. Although the utmost accuracy is desired for the bearing loads for the purposes of Phase 3 testing the changes in bearing loads between test conditions are more important. For example, when the generator is misaligned, by how much do the bearing loads change? Based on these results, the 2-kHz sampling rate for 1 s was determined to be a sufficient sampling technique for all further testing.
Figure 8. Frequency domain HSS TRB data
0 100 200 3000.41
0.42
0.43
0.44
0.45
0.46
0.47
0.48
0.49
0.5
HSS Azimuth (deg)
TRB
Up
00 A
(mV
/V)
2 kHz
0 100 200 3000.43
0.44
0.45
0.46
0.47
0.48
0.49
0.5
0.51
0.52
HSS Azimuth (deg)TR
B U
p 00
A (m
V/V
)
5 kHz
0 50 100 150 200 250 3000
0.005
0.01
0.015
0.02
Frequency (Hz)
TRB
Up
00 A
(mV
/V)
250 255 260 2650
0.005
0.01
0.015
0.02
Frequency (Hz)
TRB
Up
00 A
(mV
/V)
2kHz5kHz

18
This report is available at no cost from the National Renewable Energy Laboratory (NREL) at www.nrel.gov/publications.
5.1.1.2 High-Speed Shaft Torque Variation As noted in the HSS instrumentation calibration report [6], the HSS torque signal varies in magnitude during each rotation of the HSS by as much as 10% of the rated torque. This variation is much larger than expected, and drives a variation in the measured loads of the bearings [11]. This pattern is very consistent from rotation to rotation and is not affected by change in operational torque, even when the generator is offline as shown in Figure 9. In each case, data for 10 revolutions of the HSS are shown. The torque is most consistent at the lower power settings, whereas at power levels of 75% and 100%, the scatter in the data does increase slightly.
Figure 9. HSS torque data at 1,200 rpm (left) and 1,800 rpm (right)
To investigate this phenomenon, data were acquired at a range of speeds and power settings. Data were acquired on November 20, 2014, in offline conditions at 300, 600, 900, and 1,500 rpm; at 1,200 rpm in offline, 12% power, and 25% power conditions; and at 1,800 rpm in offline, 25% power, 50% power, 75% power, and 100% power conditions. Figure 10 compares the HSS torque in all of the offline conditions. The azimuth and magnitude of the minimum value of torque change with speed. These are lowest and occur at approximately 15º for 300 rpm, 45º for 600 rpm, 75º for 900 rpm, 105º for 1,200 rpm, and 135º for 1,500 rpm. The minimum value of torque is largest at 165º for 1,800 rpm. Several causes for this variation in torque have been proposed, but at this time it is not well understood.
Figure 10. HSS torque data at a range of speeds
19
This report is available at no cost from the National Renewable Energy Laboratory (NREL) at www.nrel.gov/publications.
5.2 Nontorque Load Tests NTL effects were investigated in Phase 2 tests; however, analysis of test data indicated that the test series was not as comprehensive as desired. In Phase 3 tests, the range of static NTLs was expanded, simple dynamic NTL events were applied, and the response of the gearbox and other drivetrain components were measured more completely.
Immediately after the recommissioning tests, the NTL testing described in the test plan was executed [3]. The NTL tests proceeded from simple static bending moments (gradually increasing in NTL magnitude and power), through simple dynamic bending moments, to static thrust load testing. The following sections describe each test.
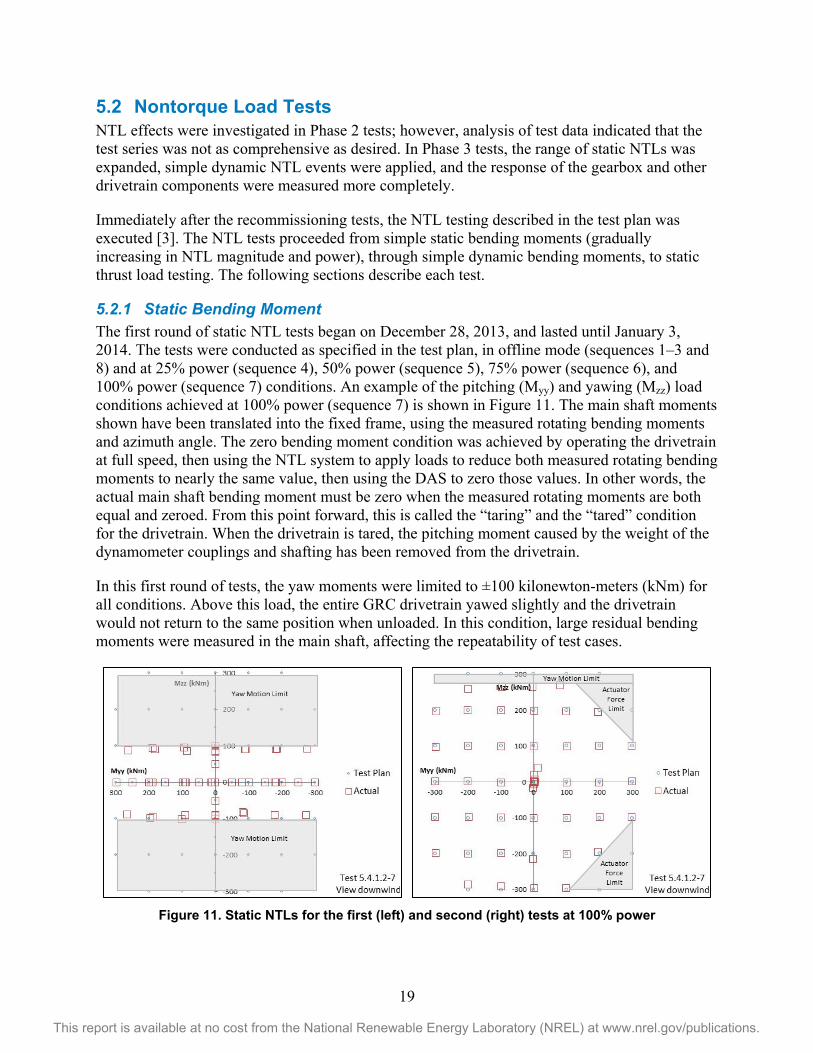
5.2.1 Static Bending Moment The first round of static NTL tests began on December 28, 2013, and lasted until January 3, 2014. The tests were conducted as specified in the test plan, in offline mode (sequences 1–3 and 8) and at 25% power (sequence 4), 50% power (sequence 5), 75% power (sequence 6), and 100% power (sequence 7) conditions. An example of the pitching (Myy) and yawing (Mzz) load conditions achieved at 100% power (sequence 7) is shown in Figure 11. The main shaft moments shown have been translated into the fixed frame, using the measured rotating bending moments and azimuth angle. The zero bending moment condition was achieved by operating the drivetrain at full speed, then using the NTL system to apply loads to reduce both measured rotating bending moments to nearly the same value, then using the DAS to zero those values. In other words, the actual main shaft bending moment must be zero when the measured rotating moments are both equal and zeroed. From this point forward, this is called the “taring” and the “tared” condition for the drivetrain. When the drivetrain is tared, the pitching moment caused by the weight of the dynamometer couplings and shafting has been removed from the drivetrain.
In this first round of tests, the yaw moments were limited to ±100 kilonewton-meters (kNm) for all conditions. Above this load, the entire GRC drivetrain yawed slightly and the drivetrain would not return to the same position when unloaded. In this condition, large residual bending moments were measured in the main shaft, affecting the repeatability of test cases.
Figure 11. Static NTLs for the first (left) and second (right) tests at 100% power
20
This report is available at no cost from the National Renewable Energy Laboratory (NREL) at www.nrel.gov/publications.
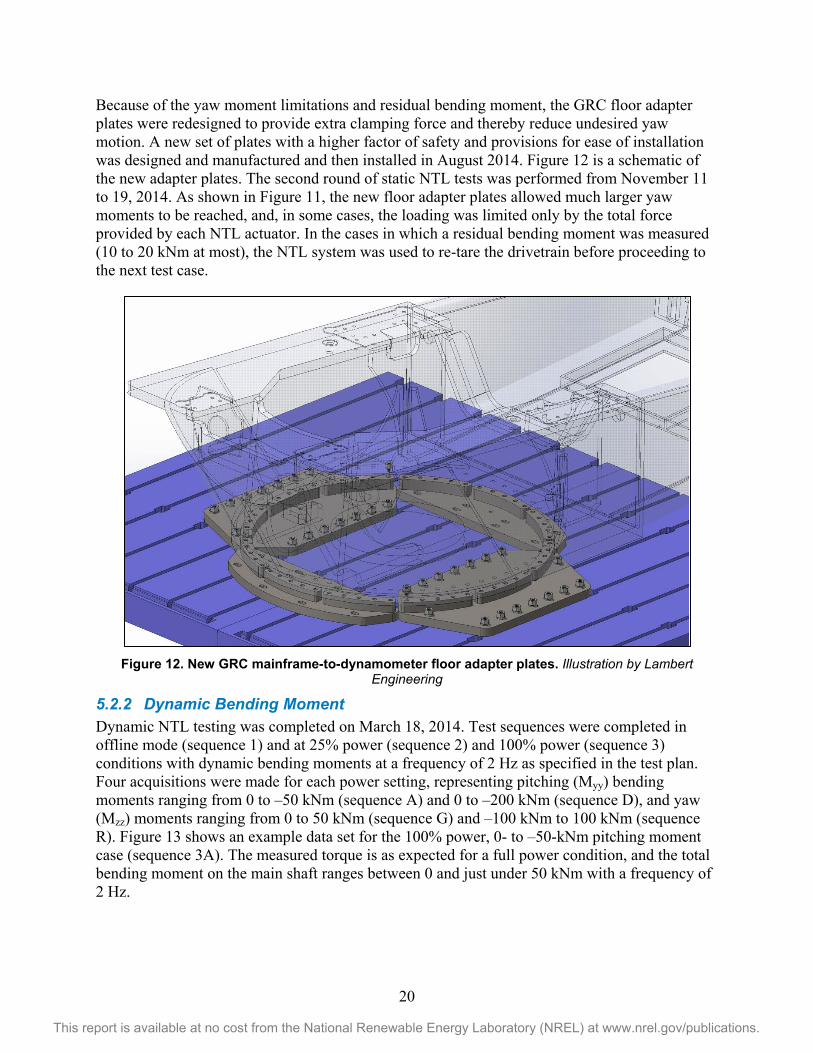
Because of the yaw moment limitations and residual bending moment, the GRC floor adapter plates were redesigned to provide extra clamping force and thereby reduce undesired yaw motion. A new set of plates with a higher factor of safety and provisions for ease of installation was designed and manufactured and then installed in August 2014. Figure 12 is a schematic of the new adapter plates. The second round of static NTL tests was performed from November 11 to 19, 2014. As shown in Figure 11, the new floor adapter plates allowed much larger yaw moments to be reached, and, in some cases, the loading was limited only by the total force provided by each NTL actuator. In the cases in which a residual bending moment was measured (10 to 20 kNm at most), the NTL system was used to re-tare the drivetrain before proceeding to the next test case.
Figure 12. New GRC mainframe-to-dynamometer floor adapter plates. Illustration by Lambert
Engineering
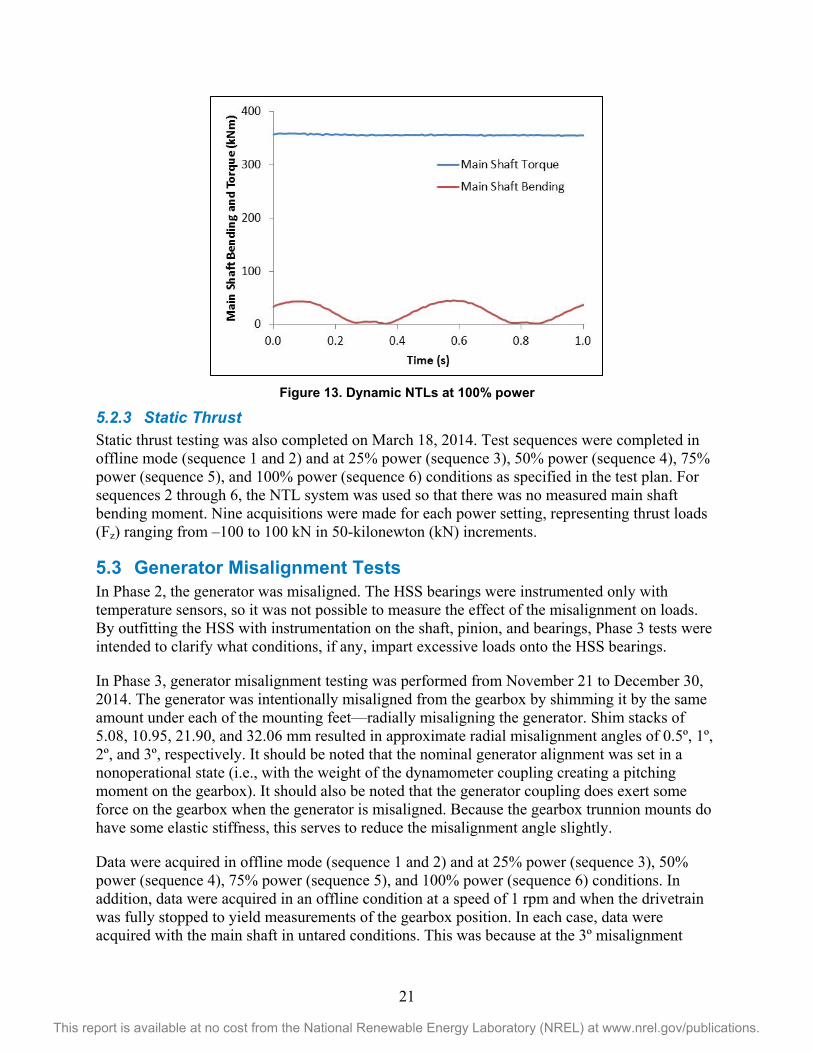
5.2.2 Dynamic Bending Moment Dynamic NTL testing was completed on March 18, 2014. Test sequences were completed in offline mode (sequence 1) and at 25% power (sequence 2) and 100% power (sequence 3) conditions with dynamic bending moments at a frequency of 2 Hz as specified in the test plan. Four acquisitions were made for each power setting, representing pitching (Myy) bending moments ranging from 0 to –50 kNm (sequence A) and 0 to –200 kNm (sequence D), and yaw (Mzz) moments ranging from 0 to 50 kNm (sequence G) and –100 kNm to 100 kNm (sequence R). Figure 13 shows an example data set for the 100% power, 0- to –50-kNm pitching moment case (sequence 3A). The measured torque is as expected for a full power condition, and the total bending moment on the main shaft ranges between 0 and just under 50 kNm with a frequency of 2 Hz.
21
This report is available at no cost from the National Renewable Energy Laboratory (NREL) at www.nrel.gov/publications.
Figure 13. Dynamic NTLs at 100% power
5.2.3 Static Thrust Static thrust testing was also completed on March 18, 2014. Test sequences were completed in offline mode (sequence 1 and 2) and at 25% power (sequence 3), 50% power (sequence 4), 75% power (sequence 5), and 100% power (sequence 6) conditions as specified in the test plan. For sequences 2 through 6, the NTL system was used so that there was no measured main shaft bending moment. Nine acquisitions were made for each power setting, representing thrust loads (Fz) ranging from –100 to 100 kN in 50-kilonewton (kN) increments.
5.3 Generator Misalignment Tests In Phase 2, the generator was misaligned. The HSS bearings were instrumented only with temperature sensors, so it was not possible to measure the effect of the misalignment on loads. By outfitting the HSS with instrumentation on the shaft, pinion, and bearings, Phase 3 tests were intended to clarify what conditions, if any, impart excessive loads onto the HSS bearings.
In Phase 3, generator misalignment testing was performed from November 21 to December 30, 2014. The generator was intentionally misaligned from the gearbox by shimming it by the same amount under each of the mounting feet—radially misaligning the generator. Shim stacks of 5.08, 10.95, 21.90, and 32.06 mm resulted in approximate radial misalignment angles of 0.5º, 1º, 2º, and 3º, respectively. It should be noted that the nominal generator alignment was set in a nonoperational state (i.e., with the weight of the dynamometer coupling creating a pitching moment on the gearbox). It should also be noted that the generator coupling does exert some force on the gearbox when the generator is misaligned. Because the gearbox trunnion mounts do have some elastic stiffness, this serves to reduce the misalignment angle slightly.
Data were acquired in offline mode (sequence 1 and 2) and at 25% power (sequence 3), 50% power (sequence 4), 75% power (sequence 5), and 100% power (sequence 6) conditions. In addition, data were acquired in an offline condition at a speed of 1 rpm and when the drivetrain was fully stopped to yield measurements of the gearbox position. In each case, data were acquired with the main shaft in untared conditions. This was because at the 3º misalignment
22
This report is available at no cost from the National Renewable Energy Laboratory (NREL) at www.nrel.gov/publications.
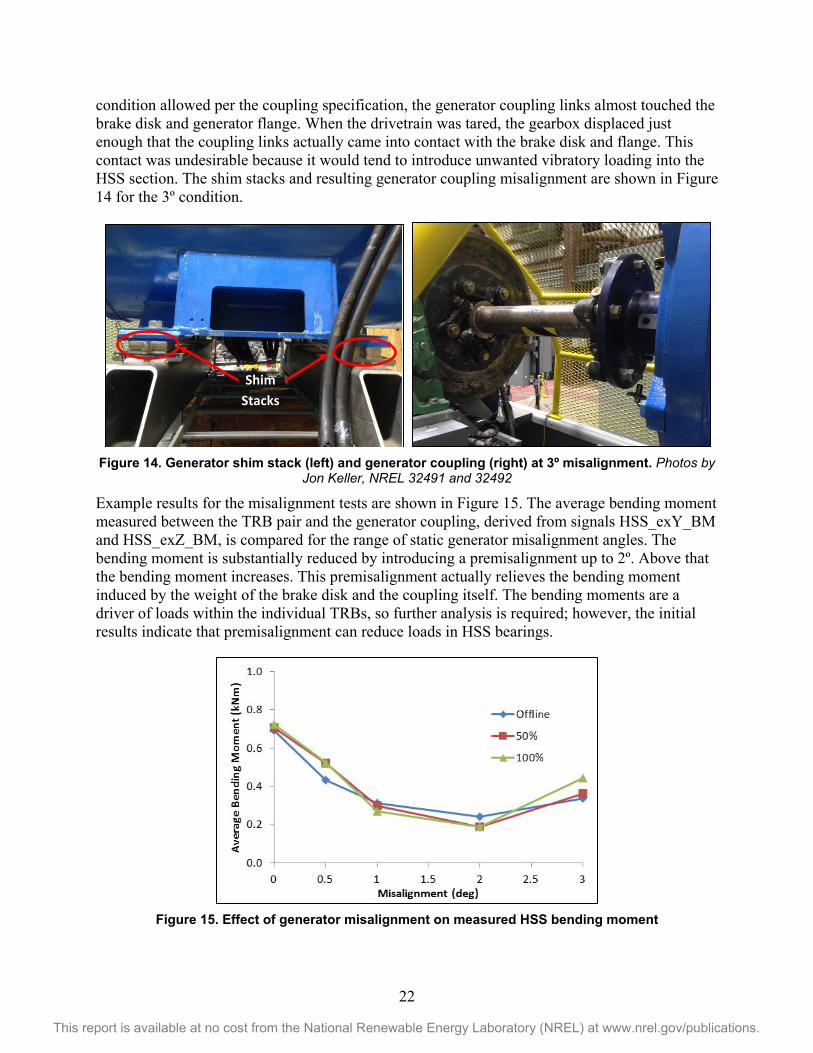
condition allowed per the coupling specification, the generator coupling links almost touched the brake disk and generator flange. When the drivetrain was tared, the gearbox displaced just enough that the coupling links actually came into contact with the brake disk and flange. This contact was undesirable because it would tend to introduce unwanted vibratory loading into the HSS section. The shim stacks and resulting generator coupling misalignment are shown in Figure 14 for the 3º condition.
Figure 14. Generator shim stack (left) and generator coupling (right) at 3º misalignment. Photos by
Jon Keller, NREL 32491 and 32492
Example results for the misalignment tests are shown in Figure 15. The average bending moment measured between the TRB pair and the generator coupling, derived from signals HSS_exY_BM and HSS_exZ_BM, is compared for the range of static generator misalignment angles. The bending moment is substantially reduced by introducing a premisalignment up to 2º. Above that the bending moment increases. This premisalignment actually relieves the bending moment induced by the weight of the brake disk and the coupling itself. The bending moments are a driver of loads within the individual TRBs, so further analysis is required; however, the initial results indicate that premisalignment can reduce loads in HSS bearings.
Figure 15. Effect of generator misalignment on measured HSS bending moment
Shim Stacks
23
This report is available at no cost from the National Renewable Energy Laboratory (NREL) at www.nrel.gov/publications.
5.4 Field Representative Tests Approximately 3 months of field testing occurred during the GRC Phase 1. Among many measurements acquired were the main shaft torque and planetary system loads. The HSS torque or the HSS bearing loads were not measured during the field test. Reproduction of field conditions in the dynamometer was attempted in Phase 2 testing; however, a key shortfall in the NWTC 2.5-MW dynamometer at that time was the limited control bandwidth of the VFD.
As described in Section 3.1, NREL replaced the 2.5-MW dynamometer VFD with a modern and more reliable drive before Phase 3 testing. The test sequence described in this section was enabled by that new capability. Examples of field representative testing completed in Phase 3 testing are discussed in the following sections. These examples correspond to normal power production and shutdown cases, respectively.
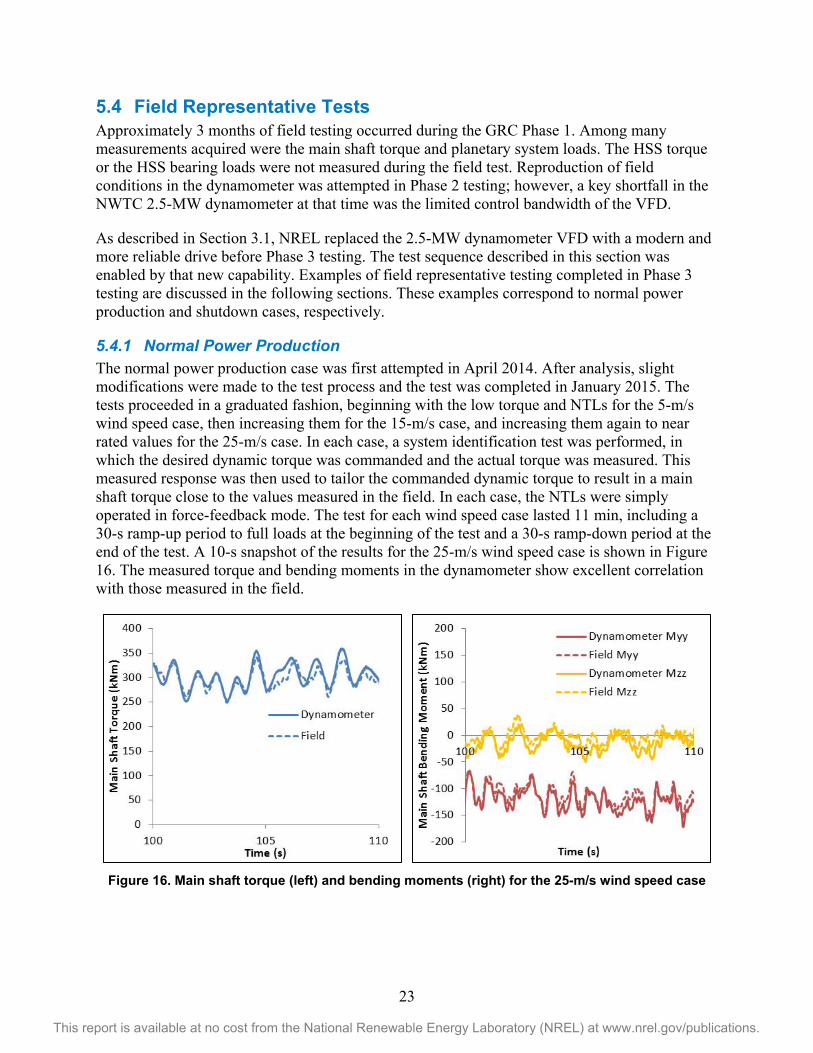
5.4.1 Normal Power Production The normal power production case was first attempted in April 2014. After analysis, slight modifications were made to the test process and the test was completed in January 2015. The tests proceeded in a graduated fashion, beginning with the low torque and NTLs for the 5-m/s wind speed case, then increasing them for the 15-m/s case, and increasing them again to near rated values for the 25-m/s case. In each case, a system identification test was performed, in which the desired dynamic torque was commanded and the actual torque was measured. This measured response was then used to tailor the commanded dynamic torque to result in a main shaft torque close to the values measured in the field. In each case, the NTLs were simply operated in force-feedback mode. The test for each wind speed case lasted 11 min, including a 30-s ramp-up period to full loads at the beginning of the test and a 30-s ramp-down period at the end of the test. A 10-s snapshot of the results for the 25-m/s wind speed case is shown in Figure 16. The measured torque and bending moments in the dynamometer show excellent correlation with those measured in the field.
Figure 16. Main shaft torque (left) and bending moments (right) for the 25-m/s wind speed case
24
This report is available at no cost from the National Renewable Energy Laboratory (NREL) at www.nrel.gov/publications.
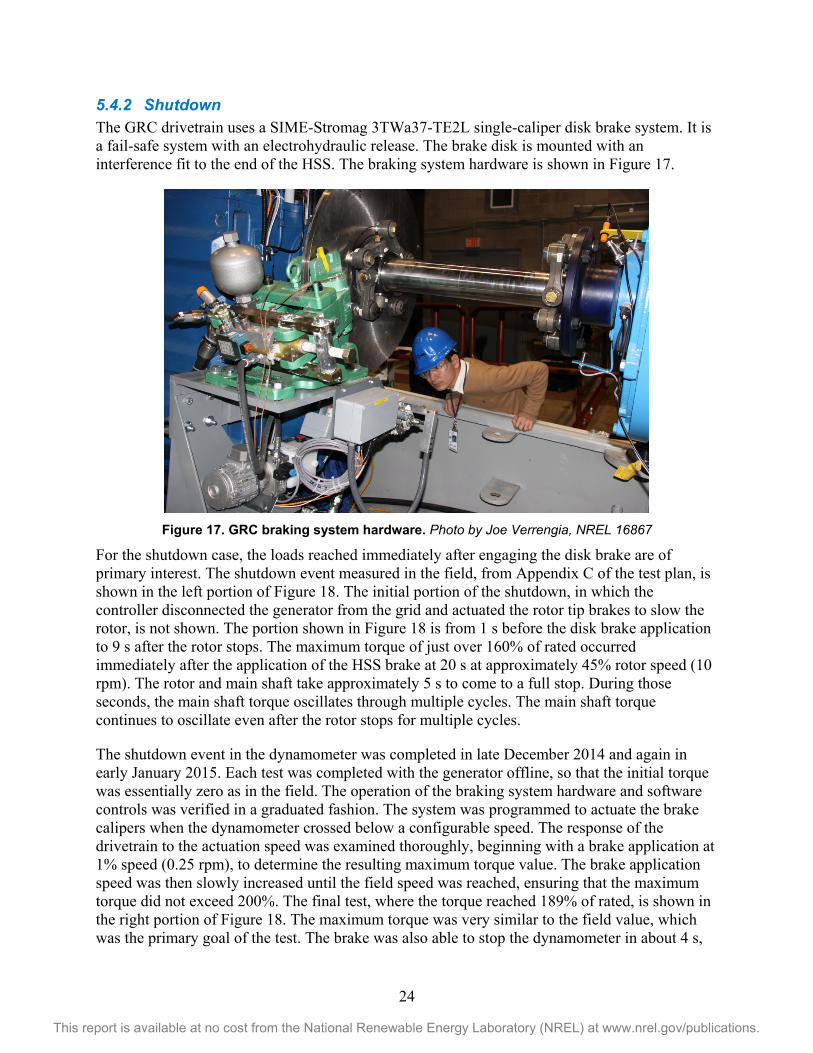
5.4.2 Shutdown The GRC drivetrain uses a SIME-Stromag 3TWa37-TE2L single-caliper disk brake system. It is a fail-safe system with an electrohydraulic release. The brake disk is mounted with an interference fit to the end of the HSS. The braking system hardware is shown in Figure 17.
Figure 17. GRC braking system hardware. Photo by Joe Verrengia, NREL 16867
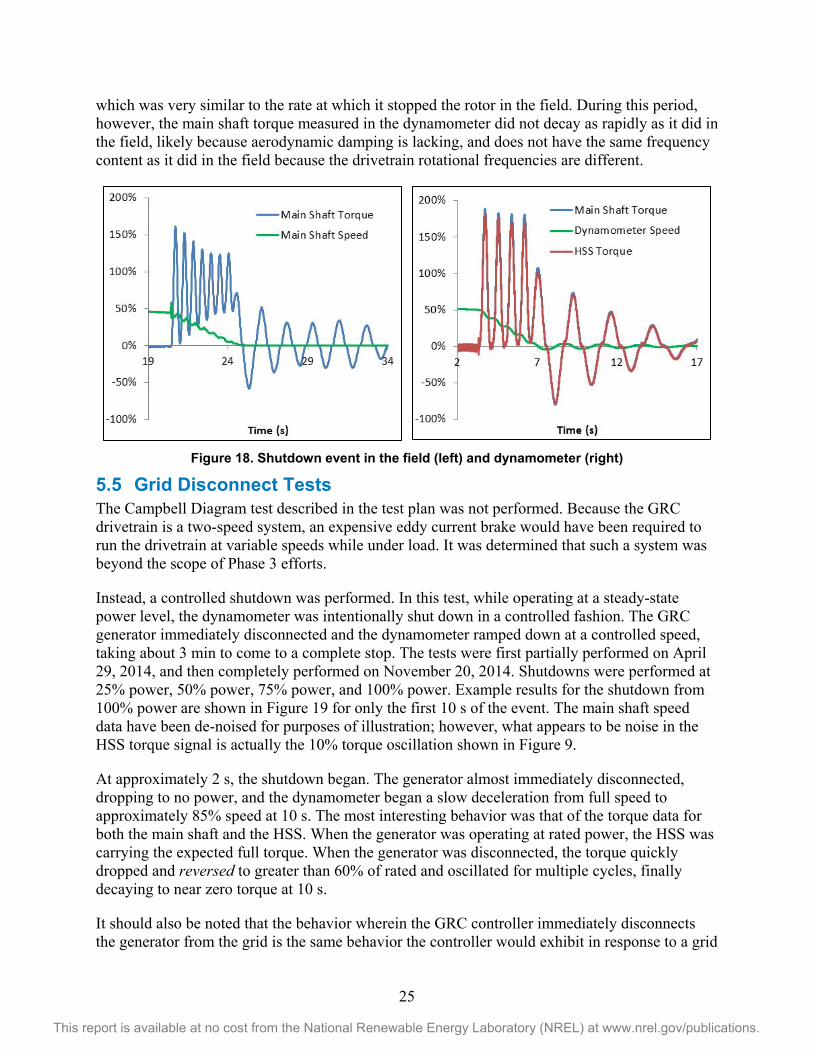
For the shutdown case, the loads reached immediately after engaging the disk brake are of primary interest. The shutdown event measured in the field, from Appendix C of the test plan, is shown in the left portion of Figure 18. The initial portion of the shutdown, in which the controller disconnected the generator from the grid and actuated the rotor tip brakes to slow the rotor, is not shown. The portion shown in Figure 18 is from 1 s before the disk brake application to 9 s after the rotor stops. The maximum torque of just over 160% of rated occurred immediately after the application of the HSS brake at 20 s at approximately 45% rotor speed (10 rpm). The rotor and main shaft take approximately 5 s to come to a full stop. During those seconds, the main shaft torque oscillates through multiple cycles. The main shaft torque continues to oscillate even after the rotor stops for multiple cycles.
The shutdown event in the dynamometer was completed in late December 2014 and again in early January 2015. Each test was completed with the generator offline, so that the initial torque was essentially zero as in the field. The operation of the braking system hardware and software controls was verified in a graduated fashion. The system was programmed to actuate the brake calipers when the dynamometer crossed below a configurable speed. The response of the drivetrain to the actuation speed was examined thoroughly, beginning with a brake application at 1% speed (0.25 rpm), to determine the resulting maximum torque value. The brake application speed was then slowly increased until the field speed was reached, ensuring that the maximum torque did not exceed 200%. The final test, where the torque reached 189% of rated, is shown in the right portion of Figure 18. The maximum torque was very similar to the field value, which was the primary goal of the test. The brake was also able to stop the dynamometer in about 4 s,
25
This report is available at no cost from the National Renewable Energy Laboratory (NREL) at www.nrel.gov/publications.
which was very similar to the rate at which it stopped the rotor in the field. During this period, however, the main shaft torque measured in the dynamometer did not decay as rapidly as it did in the field, likely because aerodynamic damping is lacking, and does not have the same frequency content as it did in the field because the drivetrain rotational frequencies are different.
Figure 18. Shutdown event in the field (left) and dynamometer (right)
5.5 Grid Disconnect Tests The Campbell Diagram test described in the test plan was not performed. Because the GRC drivetrain is a two-speed system, an expensive eddy current brake would have been required to run the drivetrain at variable speeds while under load. It was determined that such a system was beyond the scope of Phase 3 efforts.
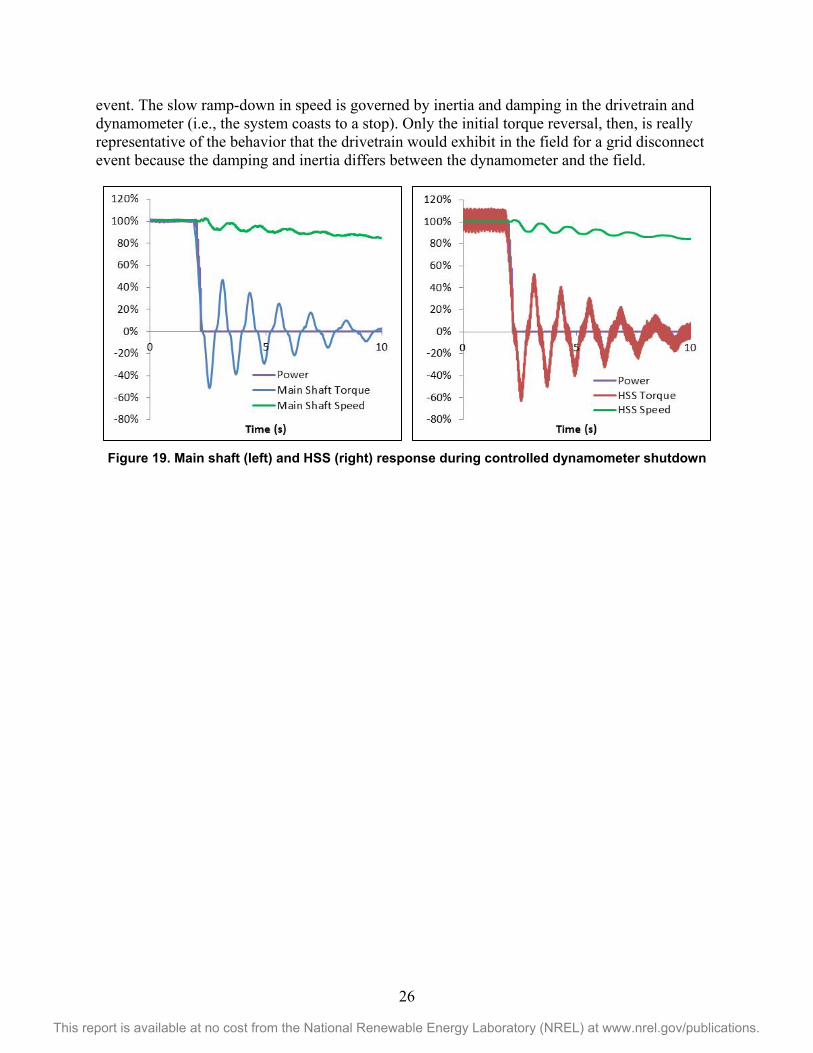
Instead, a controlled shutdown was performed. In this test, while operating at a steady-state power level, the dynamometer was intentionally shut down in a controlled fashion. The GRC generator immediately disconnected and the dynamometer ramped down at a controlled speed, taking about 3 min to come to a complete stop. The tests were first partially performed on April 29, 2014, and then completely performed on November 20, 2014. Shutdowns were performed at 25% power, 50% power, 75% power, and 100% power. Example results for the shutdown from 100% power are shown in Figure 19 for only the first 10 s of the event. The main shaft speed data have been de-noised for purposes of illustration; however, what appears to be noise in the HSS torque signal is actually the 10% torque oscillation shown in Figure 9.
At approximately 2 s, the shutdown began. The generator almost immediately disconnected, dropping to no power, and the dynamometer began a slow deceleration from full speed to approximately 85% speed at 10 s. The most interesting behavior was that of the torque data for both the main shaft and the HSS. When the generator was operating at rated power, the HSS was carrying the expected full torque. When the generator was disconnected, the torque quickly dropped and reversed to greater than 60% of rated and oscillated for multiple cycles, finally decaying to near zero torque at 10 s.
It should also be noted that the behavior wherein the GRC controller immediately disconnects the generator from the grid is the same behavior the controller would exhibit in response to a grid
26
This report is available at no cost from the National Renewable Energy Laboratory (NREL) at www.nrel.gov/publications.
event. The slow ramp-down in speed is governed by inertia and damping in the drivetrain and dynamometer (i.e., the system coasts to a stop). Only the initial torque reversal, then, is really representative of the behavior that the drivetrain would exhibit in the field for a grid disconnect event because the damping and inertia differs between the dynamometer and the field.
Figure 19. Main shaft (left) and HSS (right) response during controlled dynamometer shutdown
27
This report is available at no cost from the National Renewable Energy Laboratory (NREL) at www.nrel.gov/publications.
6 Summary The GRC uses a combined gearbox testing, modeling, and analysis approach to investigate gearbox responses to specified loading conditions. Knowledge gained by comparing publicly available engineering models to measured data is disseminated to the industry, which facilitates gearbox reliability improvements. Ideally, the knowledge gained from the GRC will result in improvements to gearbox design standards and associated modeling tools.
This report describes the recent tests of GRC GB2 in the NWTC 2.5-MW dynamometer conducted during a few periods from December 2013 to early January 2015. Specific objectives of the test were to assess the effect of static and dynamic NTLs on the planetary section, generator misalignment on the HSS section, and field representative conditions on the gearbox in general. The report serves as a guide for interpreting the publicly available data sets with brief analyses to illustrate the data. The data and engineering details of the gearbox are publicly available [12].
28
This report is available at no cost from the National Renewable Energy Laboratory (NREL) at www.nrel.gov/publications.
References 1. Sheng, S. (2013). Report on Wind Turbine Subsystem Reliability—A Survey of Various
Databases. NREL/PR-5000-59111. Golden, CO: NREL.
2. Link, H.; LaCava, W.; van Dam, J.; McNiff, B.; Sheng, S.; Wallen, R.; McDade, M.; Lambert, S.; Butterfield, S.; Oyague, F. (2011). Gearbox Reliability Collaborative Project Report: Findings from Phase 1 and Phase 2 Testing. NREL/TP-5000-51885. Golden, CO: NREL.
3. Link, H.; Keller, J.; Guo, Y.; McNiff, B. (2013). Gearbox Reliability Collaborative Phase 3 Gearbox 2 Test Plan. NREL/TP-5000-58190. Golden, CO: NREL.
4. Scott, K.G.; Infield, D.; Barltrop, N.; Coultate, J.K.; Shahaj, A. (2012). “Effects of Extreme and Transient Loads on Wind Turbine Drive Trains.” 50th AIAA Aerospace Sciences Meeting Including the New Horizons Forum and Aerospace Exposition. Reston, VA: The American Institute of Aeronautics and Astronautics. doi: 10.2514/6.2012-1293.
5. Jain, S.; Hunt, H.E.M. (2011). “A Dynamic Model to Predict the Occurrence of Skidding in Wind-Turbine Bearings.” Journal of Physics: Conference Series 305. Philadelphia, PA: IOP Publishing. doi:10.1088/1742-6596/305/1/012027.
6. Keller, J.; McNiff, B. (2014). Gearbox Reliability Collaborative High Speed Shaft Calibration. NREL/TP-5000-62373. Golden, CO: NREL.
7. “Dynamometer Testing.” (2010). NREL/FS-5000-45649. Golden, CO: NREL, Accessed November 20, 2012: http://www.nrel.gov/docs/fy11osti/45649.pdf.
8. ACS2000 (Medium Voltage AC Drive). “Flexible and Reliable: Technology Leading Medium Voltage Drives for a Wide Variety of Applications.” Zurich, Switzerland: ABB. Accessed February 12, 2015: http://new.abb.com/drives/medium-voltage-ac-drives/acs2000.
9. Keller, J.; Guo, Y.; McNiff, B. (2013). Gearbox Reliability Collaborative High Speed Shaft Tapered Roller Bearing Calibration. NREL/TP-5000-60319. Golden, CO: NREL.
10. Sheng, S.; Wallen, R. (2014). Wind Turbine Gearbox Condition Monitoring Based on GRC Phase 3 Gearbox 2 Testing. NREL/TP-5000-61748. Golden, CO: NREL.
11. McNiff, B.; Guo, Y.; Keller, J.; Sethuraman, L. (2014). High-Speed Shaft Bearing Loads Testing and Modeling in the NREL Gearbox Reliability Collaborative: Preprint. NREL/CP-5000-63277. Golden, CO: NREL.
12. NREL Data Catalog. “Gearbox Reliability Collaborative Phase 3 Gearbox 2 Test.” https://doi.org/10.7799/1254154.
29
This report is available at no cost from the National Renewable Energy Laboratory (NREL) at www.nrel.gov/publications.
Appendix
Figure 20. GRC electrical interconnection
30
This report is available at no cost from the National Renewable Energy Laboratory (NREL) at www.nrel.gov/publications.
Figure 21. Lubrication system schematic
31
This report is available at no cost from the National Renewable Energy Laboratory (NREL) at www.nrel.gov/publications.
Figure 22. LSS DAS box configuration
32
This report is available at no cost from the National Renewable Energy Laboratory (NREL) at www.nrel.gov/publications.
Figure 23. Port DAS box configuration
33
This report is available at no cost from the National Renewable Energy Laboratory (NREL) at www.nrel.gov/publications.
Figure 24. Starboard DAS box configuration
34
This report is available at no cost from the National Renewable Energy Laboratory (NREL) at www.nrel.gov/publications.
Figure 25. Main shaft speed and azimuth
35
This report is available at no cost from the National Renewable Energy Laboratory (NREL) at www.nrel.gov/publications.
Figure 26. Gearbox motion, ZZ, at trunnion
36
This report is available at no cost from the National Renewable Energy Laboratory (NREL) at www.nrel.gov/publications.
Figure 27. Gearbox motion, YY, bottom rotation
37
This report is available at no cost from the National Renewable Energy Laboratory (NREL) at www.nrel.gov/publications.
Figure 28. Ring gear external face-width load distribution
38
This report is available at no cost from the National Renewable Energy Laboratory (NREL) at www.nrel.gov/publications.
Figure 29. Intermediate-shaft axial motion
39
This report is available at no cost from the National Renewable Energy Laboratory (NREL) at www.nrel.gov/publications.
Figure 30. HSS speed and azimuth