Embed Size (px)
Citation preview

GCE Economics
Edexcel Advanced Subsidiary GCE in Economics (8EC01)First examination 2009
Edexcel Advanced GCE in Economics (9EC01)First examination 2010
Issue 2
Getting Started


Contents
Edexcel GCE in Economics © Edexcel Limited 2008 Getting Started
Introduction 1
Unitoverview 2
Unit1:CompetitiveMarketsDeliverySchedule 3
Unit1:CompetitiveMarketsRevisionSheets 10
Unit2:ManagingtheEconomyDeliverySchedule 28
Unit2:ManagingtheEconomyRevisionSheets 36
Unit3:BusinessEconomicsandEconomicEfficiencyDeliverySchedule 50
Unit3:BusinessEconomicsandEconomicEfficiencyRevisionSheets 54
Unit4:GlobalEconomyDeliverySchedule 72
Unit4:GlobalEconomyRevisionSheets 79
StudentGuide 101


Edexcel GCE in Economics Getting Started 1Edexcel GCE in Economics
Introduction
Introduction
This Getting Started book will give you an overview of the course and what it means for you and
your students. The guidance in this book is intended to help you plan the course in outline and give
you further insight into the principles behind it to assist you and your students in succeeding in
the qualifi cation. Further guidance and additional material, including example students answers to
specimen papers will be added in the Edexcel GCE Economics subject area on www.edexcel.org.uk.
2 Edexcel GCE in Economics Getting Started© Edexcel Limited 2008Edexcel GCE in Economics
Unit overview
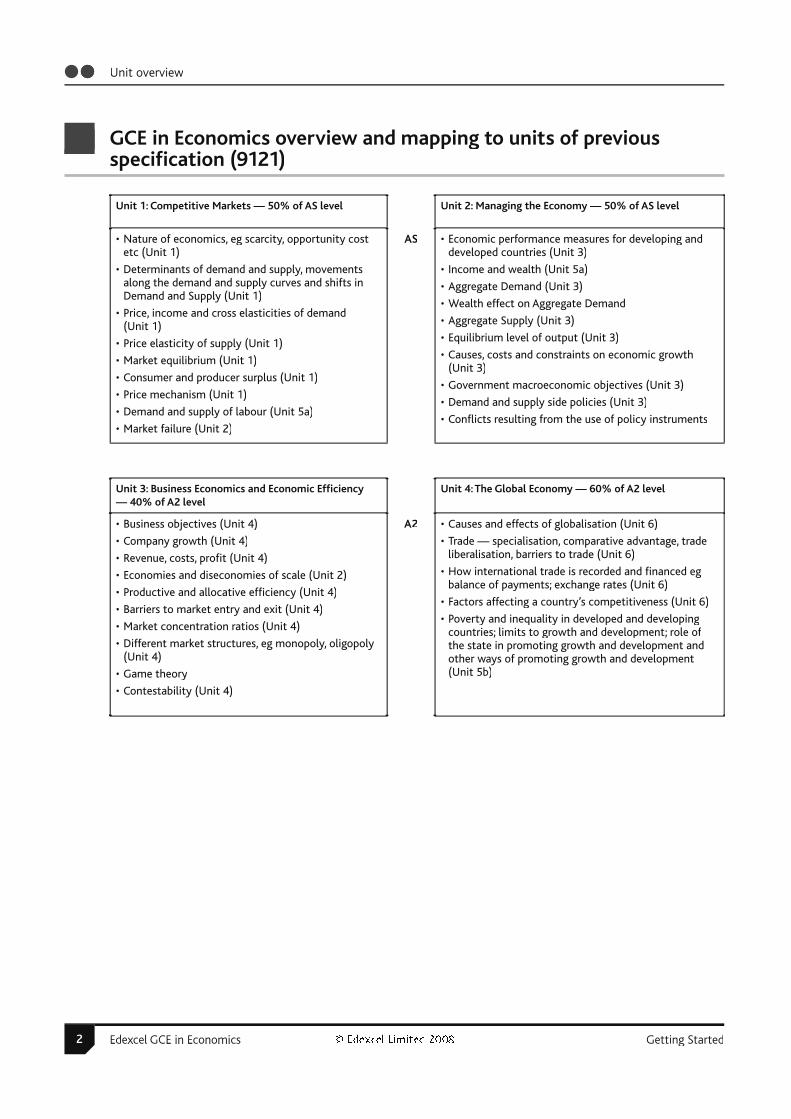
GCE in Economics overview and mapping to units of previous specifi cation (9121)
Unit 1: Competitive Markets — 50% of AS level Unit 2: Managing the Economy — 50% of AS level
• Nature of economics, eg scarcity, opportunity costetc (Unit 1)
• Determinants of demand and supply, movementsalong the demand and supply curves and shifts inDemand and Supply (Unit 1)
• Price, income and cross elasticities of demand(Unit 1)
• Price elasticity of supply (Unit 1)
• Market equilibrium (Unit 1)
• Consumer and producer surplus (Unit 1)
• Price mechanism (Unit 1)
• Demand and supply of labour (Unit 5a)
• Market failure (Unit 2)
AS • Economic performance measures for developing anddeveloped countries (Unit 3)
• Income and wealth (Unit 5a)
• Aggregate Demand (Unit 3)
• Wealth effect on Aggregate Demand
• Aggregate Supply (Unit 3)
• Equilibrium level of output (Unit 3)
• Causes, costs and constraints on economic growth(Unit 3)
• Government macroeconomic objectives (Unit 3)
• Demand and supply side policies (Unit 3)
• Confl icts resulting from the use of policy instruments
Unit 3: Business Economics and Economic Effi ciency — 40% of A2 level
Unit 4: The Global Economy — 60% of A2 level
• Business objectives (Unit 4)
• Company growth (Unit 4)
• Revenue, costs, profi t (Unit 4)
• Economies and diseconomies of scale (Unit 2)
• Productive and allocative effi ciency (Unit 4)
• Barriers to market entry and exit (Unit 4)
• Market concentration ratios (Unit 4)
• Different market structures, eg monopoly, oligopoly(Unit 4)
• Game theory
• Contestability (Unit 4)
A2 • Causes and effects of globalisation (Unit 6)
• Trade — specialisation, comparative advantage, tradeliberalisation, barriers to trade (Unit 6)
• How international trade is recorded and fi nanced egbalance of payments; exchange rates (Unit 6)
• Factors affecting a country’s competitiveness (Unit 6)
• Poverty and inequality in developed and developingcountries; limits to growth and development; role of the state in promoting growth and development andother ways of promoting growth and development(Unit 5b)

Edexcel GCE in Economics Getting Started 3Edexcel GCE in Economics
Unit 1: Competitive Markets Delivery Schedule
Competitive Markets — How They Work and Why They Fail — Course Outline for Unit 1
BASIC READING
Anderton A — Economics, 4th Edition (Causeway Press, 2006) ISBN 1902796926
Cramp P — Labour Markets: The Economics of Work and Leisure, 3rd Edition (Anforme ltd, 2006) ISBN 1905504055
ER = Economics Review magazine (Philip Allan Updates, www.philipallan.co.uk)
ET = Economics Today magazine (Anforme ltd, www.anforme.co.uk)
Tarrant R — Friday Afternoon Economics (Philip Allan Updates, to be published 2008)
Timing Content Reading/Activities Comments/notes
2 hours The basic economic problem andscarcity
Production possibility frontiers
- opportunity cost
- economic growth (causes of shiftsinwards/outwards of PPF)
Positive and normative economics
Anderton, Unit 1
ER September 2006 page 15— PPFs — P Smith
ER November 2006 page 20— Positive and normative —P Smith
ET September 2006 page 10— PPFs
Students are likely to be unsure as to what economics entailsas a subject — this may be worth a lesson of discussion in itself. PPFs do not need to beused to illustrate absolute and comparative advantage. Students should be aware of the causes and implications of an economy operating inside its PPF. Students should be provided with a list of economic statements and asked toexplain why they are either positive or normative.

4 Edexcel GCE in Economics Getting Started© Edexcel Limited 2008Edexcel GCE in Economics
Unit 1: Competitive Markets Delivery Schedule
Timing Content Reading/Activities Comments/notes
1.5 hours
(3.5 hours todate)
Specialisation and division of labour
- concept
- advantages
- disadvantages
Anderton, Unit 2 Brighter students could beencouraged to investigate Adam Smith’s understanding of division of labour in Wealth of Nations with his Glaswegian pin factory example. There are a number of classroom games that illustrate theprinciples of specialisation, requiring students to make a number of items individually, before then specialising as a group.
1.5 hours
(5 hours todate)
Economic systems
- free market (strengths/weaknesses)
- mixed
Anderton, Units 42 and 43 Students should focus on lack of equity being a key reason for mixed economies. A classroom discussion could begin centred on the world described by Charles Dickens in, for example, A Christmas Carol or Oliver Twist, which many students will know — ask them to discusswhether this society was ‘fair’.
2.5 hours
(7.5 hours todate)
Demand and supply curves
- their shape, and reasons for their shape
- change in price leads tomovement along the curves
- causes of shifts right or left ineither curve
Anderton, Units 4 and 5
Tarrant, Changes in demand and supply — play your cardsright
Many students fi nd these concepts quite abstract — use examples that they are able to relate to, such as asking how many times they would visit their local coffee shop per week at different prices of their favourite drink, or how likely they would be to deliver newspapers at different wage rates. A signifi cant number of students fi nd it diffi cult to remember that a change in price leads to a movement along thecurve not a shift — this point needs emphasising.

Edexcel GCE in Economics Getting Started 5Edexcel GCE in Economics
Unit 1: Competitive Markets Delivery Schedule
Timing Content Reading/Activities Comments/notes
4 hours
(11.5 hoursto date)
Elasticities
PED
- defi nition
- steep/shallow curves
- formula and interpretation of calculation
- characteristics of goods withelastic/inelastic supply
- link to total revenue and use tobusinesses
YED
- defi nition
- normal/inferior goods
- formula and interpretation of calculation
- use to businesses
XED
- defi nition
- complementary, substitute andindependent goods
- formula and interpretation of calculation
- use to businesses
PES
- defi nition
- steep/shallow curves
- characteristics of goods withelastic/inelastic supply
- formula and interpretation of calculation
- use to businesses
Anderton, Units 8 and 9
ER September 2006 page 24— Elasticities and housingmarkets — P Smith
ET September 2005 page 7— Should football clubs raiseor lower prices to increaserevenue? — A Chapman
Tarrant, Elasticities crossnumber and elasticitiesmissing words
Students tend to fi nd the concept of elasticity fairly straightforward, but struggle with the interpretation of the numbers generated from calculation — a number line that they keep in the front of their notes will help with this, as will signifi cant calculation practice (this is a good homework to set). A good way to teach the link between PED and total revenue is to get students to work it out themselves with aguided investigative worksheet — give them some questions containing information about theelasticities of various products, and get them to calculate new and old revenue following an increase/decrease in price.

6 Edexcel GCE in Economics Getting Started© Edexcel Limited 2008Edexcel GCE in Economics
Unit 1: Competitive Markets Delivery Schedule
Timing Content Reading/Activities Comments/notes
1.5 hours
(13 hours todate)
The market mechanism —interaction of demand and supply to determine market clearing price
Elimination of excess demand andsupply through price mechanism
Functions of prices: rationing,signalling, incentives
Anderton, Units 6 and 15
ET September 2005 page 14— What determines the priceof coffee? — I Black
Students can get confused betweenexcess demand and excess supply — it is worth emphasising theneed to label market diagrams fully and accurately to avoid this. For explaining the solution to excess supply, use examples of local markets that have stock left at the end of the day — ask students what market traders could do toeliminate their stock. For explaining the solution to excess demand, ask students to think of ways of preventing queues at popular attractions.
1 hour
(14 hours todate)
Consumer and producer surplus:
- defi nitions
- indication of correct area onmarket diagrams
- analysis of change in c.s. or p.s.following changes in demand/supply
Anderton, Unit 4
ET September 2004 page 14— Consumer and producer surplus
Tarrant, Interpreting marketdiagrams — matching game
Students need to be able to indicate the correct area on a market diagram, and to identify changes in c.s. or p.s. on a diagram.
1.5 hours
(15.5 hoursto date)
Application of market principles tovarious markets:
- agriculture
- commodities/precious metals
- shares
- oil
Anderton, Units 6,12, 21, 65
ER February 2007 page 17— Common Agricultural Policy — S Rickard
Tarrant, Agricultural Economics matching
Students should be aware of important features of each market, eg degree of price elasticity of demand/supply and factors that cause demand/supply curves to shift (ie recent increase in demandfor oil to fuel Newly Industrialised Countries).
1.5 hours
(17 hours todate)
Application of market principles tothe labour market:
- labour as a derived demand
- price of labour = wage rate
- factors causing demand for andsupply of labour to increase or decrease
Anderton, Units 71-77
Cramp, Units 1, 2, 3, 5, 9
ET September 2006 page 28— Ageing population and labour markets
ET September 2006 page 12— Government interference inwage determination — A Clarke
ET November 2006 page 11— Migration and the labour market
ER November 2006 page 2 — New migration tothe UK — S Drinkwater
MRP analysis and monopsony analysis is not necessary (although this could be extension work for more able students). Students should also consider the importance of the participation rate in the labour force, and recognise the concepts of unemployment andunderemployment.

Edexcel GCE in Economics Getting Started 7Edexcel GCE in Economics
Unit 1: Competitive Markets Delivery Schedule
Timing Content Reading/Activities Comments/notes
3 hours
(20 hours todate)
Externalities (positive and negative)
Social costs = private costs +external costs
Social benefi ts = private benefi ts +external benefi ts
Positive consumption externalitydiagram, including welfare gaintriangle
Negative production externalitydiagram, including welfare losstriangle
Cost benefi t analysis
Anderton, Units 19, 22, 61,62, 70
ET November 2005 page 16— Costs and benefi ts of air travel — T Allen
ET March 2007 page 26— London Olympics of 2012
ER September 2006 page 7— Air travel — P Smith
ER April 2007 page 2 —Hosting major events — C Jones
ER April 2007 page 26 — Theeconomic impact of transportinfrastructure investment — R Vickerman
Tarrant, Types of market failurewordsearch
Many students fi nd this topic abstract and therefore diffi cult. Use as many practical examplesas possible and get students toidentify private and external costs/benefi ts. eg traffi c congestion, building of new airports, improved access to education etc. Good examples to use for the cost benefi t analysis work are the London 2012Olympics, expansion of Heathrow Terminal 5, the Newbury Bypass etc.
1 hour
(21 hours todate)
Public goods:
- non-rival and non-excludablecharacteristics
- examples
- free-rider problem
- private goods
Anderton, Unit 20
ET January 2007 page 11— Public goods — A Chapman
Use examples. Students can getconfused between non-rival and non-excludable — it is worthemphasising this.

8 Edexcel GCE in Economics Getting Started© Edexcel Limited 2008Edexcel GCE in Economics
Unit 1: Competitive Markets Delivery Schedule
Timing Content Reading/Activities Comments/notes
1.5 hours
(22.5 hoursto date)
Imperfect information:
- symmetric, asymmetric,incomplete
Examples:
- healthcare
- education
- pensions
- tobacco/alcohol
Anderton, Unit 16 and 76
Tarrant, Market failure in healthcare and education missing words
Emphasise the importance of perfect information to enablemarkets to work properly.
Discuss the effects of imperfect information in terms of overconsumption (alcohol/tobacco) and underconsumption (healthcare/education).
1.5 hours
(24 hours todate)
Labour immobility:
- geographical and occupational
- reasons for immobility
- government measures to tacklethe problem (training programmesetc)
Anderton, Unit 75
Cramp, Units 8 and 9
ER April 2007 page 24 — NewDeal
Occupational immobility canbe introduced using examples such as The Full Monty and Billy Elliot where main characters are unemployed through lack of appropriate skills. Sociology students may be able to contributesome knowledge from their other studies. Students should be aware of the New Deal for Labour.
2.5 hours
(26.5 hoursto date)
Commodity markets and unstableprices:
- causes of unstable prices (time-lag, climate etc)
- problems caused by unstableprices (uncertain income, reducedinvestment, inability to purchasenecessities)
Solutions:
- minimum prices (includingdiagram)
- buffer stocks (including diagram)
- evaluation of solutions
Anderton, Units 12 and 21
ET September 2006 page 7— Buffer Stocks — M Jewell
Students do not need to use thediagrammatic analysis of time-lag causes of unstable prices (cobweb theorem) but should be able to explain verbally why time-lags in production can cause unstable prices. A number of studentsbecome confused over minimum prices being a price above the market equilibrium, not below— this needs emphasising. There are a number of approaches to buffer stock diagrams, but all should involve a fl oor and ceiling price, and a notion of buying and storingexcess supply for times when supply is low or demand high. Footage of the original Live Aid could be usedto illustrate Bob Geldof’s attack on the CAP.

Edexcel GCE in Economics Getting Started 9Edexcel GCE in Economics
Unit 1: Competitive Markets Delivery Schedule
Timing Content Reading/Activities Comments/notes
2.5 hours
(29 hours todate)
Defi nitions of taxation and subsidy
Reasons for use of tax/subsidy totackle market failure
Use of market diagrams to showeffect of tax and subsidy on supplycurve
Graphical analysis of incidenceof tax/subsidy on consumersand producers, and total revenuegained/lost by government
Implications of PED/PES for incidence of tax/subsidy
Evaluation of tax and subsidy
Anderton, Units 11, 62, 79
ET September 2004 page 28— Why do governments tax smoking? — S Earley
ET November 2005 page 6 — Tax and householdor industrial waste — R Powell
ET November 2005 page 21— National road user charging— C Bamford
ER February 2007 page 7— Environmental tax — A Leicester
This should be linked back to externalities, with negative externalities attracting tax and positive attracting subsidy. Also applicable to imperfect information.
For tax, use examples of landfi ll tax, carbon-offset tax and road pricing(eg congestion charge in London/Manchester).
4 hours
(33 hours todate)
Pollution permits
- how they work
- strengths/weaknesses
- examples
Extension of property rights
- how it works
- strengths/weaknesses
Regulation
- how it works
- strengths/weaknesses
- examples
State provision
- examples (NHS, state schools,emergency services etc)
- strengths/weaknesses
Anderton, Unit 62
ET November 2005 page 22— Tackling depletion of oilreserves — I Black
Much of the evaluation of these alternative methods of correcting market failure looks at the costof these approaches (including opportunity cost). The idea of problems caused by monopoly could be introduced with respectto state provision of goods with positive externalities or that are public goods. More able studentscould be introduced to the work of Ronald Coase on property rights. Evaluation of regulation should take into account the cost of a monitoring agency and the application of fi nes.
1.5hrs
(34.5hrs todate)
Defi nition of government failure
Examples of government failure
National Minimum Wage
Anderton Unit 20
ET November 2005 page 26— Effects of increasing theNMW
ET March 2006 page 22 — UKuniversities and governmentfailure — T Hamilton-Jones
ER November 2006 page 29— Assessing the NMW —M Bryan
Examples to be covered include failure in the agricultural sector, transport sector, labour market, and housing. There are many practical examples of these failures.
10 Edexcel GCE in Economics Getting Started© Edexcel Limited 2008Edexcel GCE in Economics
Unit 1: Competitive Markets Revision Sheets
GCE Economics Unit 1 — Competitive Markets — How They Work and Why They Fail Revision Sheets
1.3.1 — What is the nature of economics?
Economics is a social science, which investigates what, how, why, and for whom goods and
services are produced. The basic economic problem is that there are infi nite wants but fi nite
(non-renewable) resources with which to satisfy them. Economics is meant to help us to choose
between the competing demands placed on the non-renewable resources that we have. Increasingly,
economists are becoming more aware of the need to use renewable resources, such as wind and
solar power instead of oil and gas for electricity generation. Following the Bruntland Report of 1987,
economists are also increasingly aware of the role of sustainability. This means that we need to
consider the needs of future generations as well as our own generation when we make our decisions
regarding the use of resources.
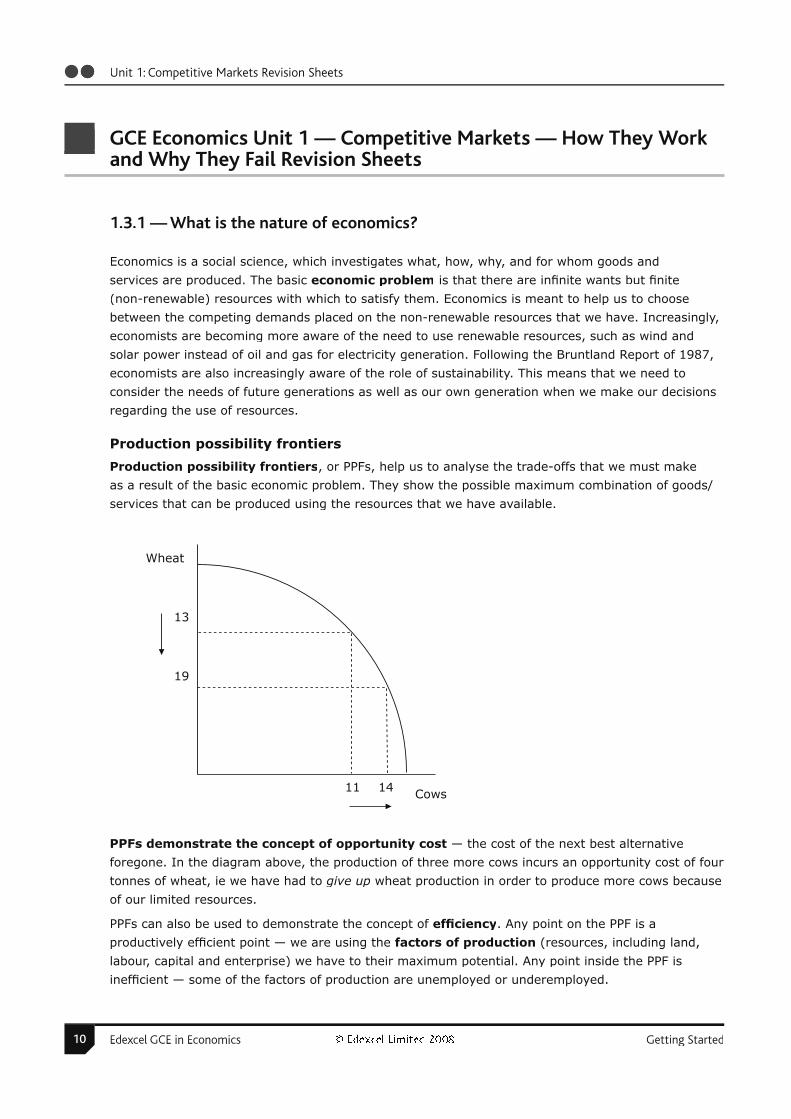
Production possibility frontiers
Production possibility frontiers, or PPFs, help us to analyse the trade-offs that we must make
as a result of the basic economic problem. They show the possible maximum combination of goods/
services that can be produced using the resources that we have available.
PPFs demonstrate the concept of opportunity cost — the cost of the next best alternative
foregone. In the diagram above, the production of three more cows incurs an opportunity cost of four
tonnes of wheat, ie we have had to give up wheat production in order to produce more cows because
of our limited resources.
PPFs can also be used to demonstrate the concept of effi ciency. Any point on the PPF is a
productively effi cient point — we are using the factors of production (resources, including land,
labour, capital and enterprise) we have to their maximum potential. Any point inside the PPF is
ineffi cient — some of the factors of production are unemployed or underemployed.
Wheat
13
19
11 14 Cows
Edexcel GCE in Economics Getting Started 11Edexcel GCE in Economics
Unit 1: Competitive Markets Revision Sheets
Economic growth (an increase in the productive potential of the country) can be shown by an
outwards shift in the PPF. Such a shift can be caused by an increase in the quantity or quality of the
factors of production (eg, better educated labour, hi-tech capital, a new oil fi eld discovery etc). Very
occasionally, the PPF shifts inwards.
Another way in which economic growth can occur is via specialisation, or division of labour.
Adam Smith wrote about the division of labour in Wealth of Nations back in the 18th century. He said
that by splitting the production of a good into a number of different tasks, and allocating each task
to a different worker, then more could be produced as workers developed greater skill in performing
their particular task with the use of specialist tools designed for just that task, thus leading to less
wastage of materials and less time spent on their task. However, when this method was put into
practice in the early 20th century, for example, with Henry Ford’s Model T production line, workers
became so bored that they had to be paid high wages as compensation for the monotony of their
work.
Economic systems
There are a number of approaches to organising an economy.
Free market economy: an economic system where all resources are allocated through the market
forces of demand and supply, with no intervention by the government.
Command, or centrally planned economy: an economic system where all resources are allocated
by the government, with no markets (eg ex-Soviet bloc, North Korea).
Mixed economy: an economic system where resources are partly allocated by the market and
partly by the government (eg, most economies today).
From the point of view of effi ciency, most economists would argue that free markets are the most
effi cient, in terms of using their resources in the best possible way to meet the needs and wants of
consumers. However, when equity is considered, most economists would also argue that free markets
lead to an unequal distribution of income and wealth, since owners of capital and entrepreneurs tend
to accumulate the most income/wealth, and many people, such as the sick or elderly, are unable
to work. As a result, most economies today are mixed economies, where markets allocate many
resources, but governments intervene to different extents in order to ensure a minimum standard of
living. They do this by raising revenue through taxes, and redistributing in the form of benefi ts and
direct provision of services such as healthcare.
The extent to which governments are involved in the economy is a normative issue, ie a matter of
opinion, requiring a value judgment. Economic analysis tends to be more concerned with positive
issues, ie statements of fact that can be tested against real-world evidence. For example, the
USA has a predominantly private healthcare system, where people have to pay directly for their
treatment, whereas the UK has a predominantly publicly-provided healthcare system (the NHS). To
say that the UK’s approach is ‘fairer’ is essentially a matter of opinion, ie a normative issue. To say
that the amount spent per head on healthcare in the UK is less than that in the US is a positive issue.

12 Edexcel GCE in Economics Getting Started© Edexcel Limited 2008Edexcel GCE in Economics
Unit 1: Competitive Markets Revision Sheets
1.3.2 — What determines the demand for a good or service in a market?
Demand refers to the amount that consumers are willing and able to buy at any given price. A
demand curve shows this relationship between price and quantity demanded. It slopes downwards
from left to right, because as price falls, people are more willing to buy a good.
Factors causing demand curve to
shift right:
• an increase in income (for normal
goods)
• a fall in income (for inferior goods)
• successful advertising
• fall in price of complementary goods
• rise in price of substitute goods
• good becomes more fashionable.
Factors causing demand curve to
shift to the left:
• a fall in income (for normal goods)
• a rise in income (for inferior goods)
• rise in price of complementary goods
• fall in price of substitutes
• good becomes less fashionable.
A very important point: a change in the price of a good does not lead to a movement of the
demand curve — it simply leads to a shift along the demand curve, since the demand curve shows
the relationship between price and quantity demanded.
Key terms:
Normal good — one for which demand increases as income rises
Inferior good — one for which demand falls as income rises, eg bus travel, own-brand supermarket
spaghetti sauce
Complementary good — a good that is bought with another good, ie the two go together well, eg
cinema tickets and popcorn
Substitute good — a good that is bought instead of another good ie consumers choose between
one or the other, eg gold engagement rings or platinum engagement rings.
Price
Quantity
D

Edexcel GCE in Economics Getting Started 13Edexcel GCE in Economics
Unit 1: Competitive Markets Revision Sheets
Elasticities
Price Elasticity of Demand (PED) measures the responsiveness of demand to a change in price. A
steep demand curve shows a good that has price inelastic demand ie demand for it is not responsive
to a change in price. A shallow demand curve shows a good that has price elastic demand ie demand
is responsive to a change in price. Goods with price inelastic demand tend to have few substitutes,
are necessities, and/or can be addictive eg petrol, alcohol, cigarettes. PED is always a negative
number. A number between 0 and –1 means demand is price inelastic. A number between –1 and –∞
means demand is price elastic.
It can be calculated using the formula:
% change in demand
% change in price
Income Elasticity of Demand (YED) measures responsiveness of demand to a change in income.
A positive number means the good is normal; a negative number means the good is inferior. It can
be calculated using the formula:
% change in demand
% change in income
Cross (price) Elasticity of Demand (XED) measures responsiveness of demand for one good to a
change in the price of another good. A positive number means the goods are substitutes; a negative
number means the goods are complements. It is measured using the formula:
% change in demand for good x
% change in price of good y
The importance of elasticities
PED is important to businesses because it tells them what their pricing strategy should be in order
to increase total revenue: if PED is inelastic, then a rise in price increases total revenue and a fall
in price reduces total revenue; if PED is elastic, then a rise in price reduces total revenue and a fall
in price increases total revenue. PED is also important to governments in terms of understanding
the burden (or incidence) of taxation on producers and consumers. The more price inelastic the
good, a greater proportion of the sales tax is paid by the consumer than the producer. Similarly, for
subsidies (a government grant given to producers in order to encourage production), the more price
inelastic the good, the greater the price fall for consumers. Businesses should also be aware of cross
price elasticities, because it will tell them how demand for their own product will change following a
price change by their competitors or partners.
14 Edexcel GCE in Economics Getting Started© Edexcel Limited 2008Edexcel GCE in Economics
Unit 1: Competitive Markets Revision Sheets
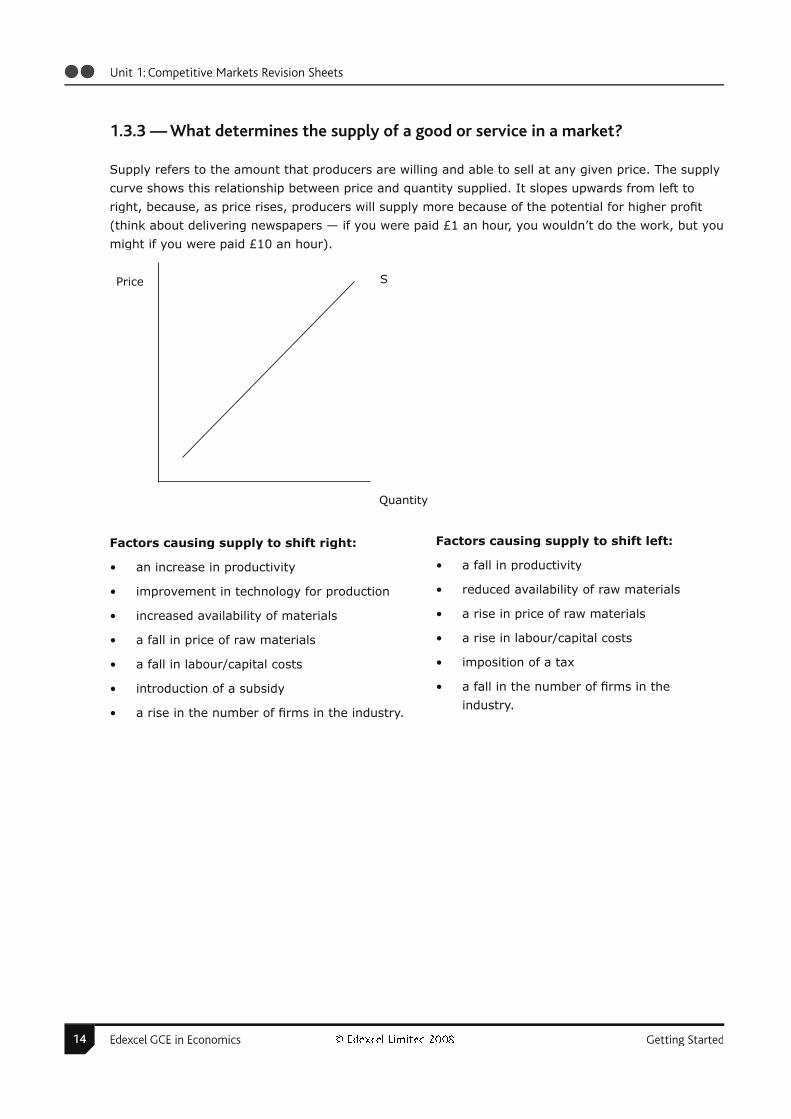
1.3.3 — What determines the supply of a good or service in a market?
Supply refers to the amount that producers are willing and able to sell at any given price. The supply
curve shows this relationship between price and quantity supplied. It slopes upwards from left to
right, because, as price rises, producers will supply more because of the potential for higher profi t
(think about delivering newspapers — if you were paid £1 an hour, you wouldn’t do the work, but you
might if you were paid £10 an hour).
Factors causing supply to shift right:
• an increase in productivity
• improvement in technology for production
• increased availability of materials
• a fall in price of raw materials
• a fall in labour/capital costs
• introduction of a subsidy
• a rise in the number of fi rms in the industry.
Factors causing supply to shift left:
• a fall in productivity
• reduced availability of raw materials
• a rise in price of raw materials
• a rise in labour/capital costs
• imposition of a tax
• a fall in the number of fi rms in the
industry.
Price
Quantity
S
Edexcel GCE in Economics Getting Started 15Edexcel GCE in Economics
Unit 1: Competitive Markets Revision Sheets
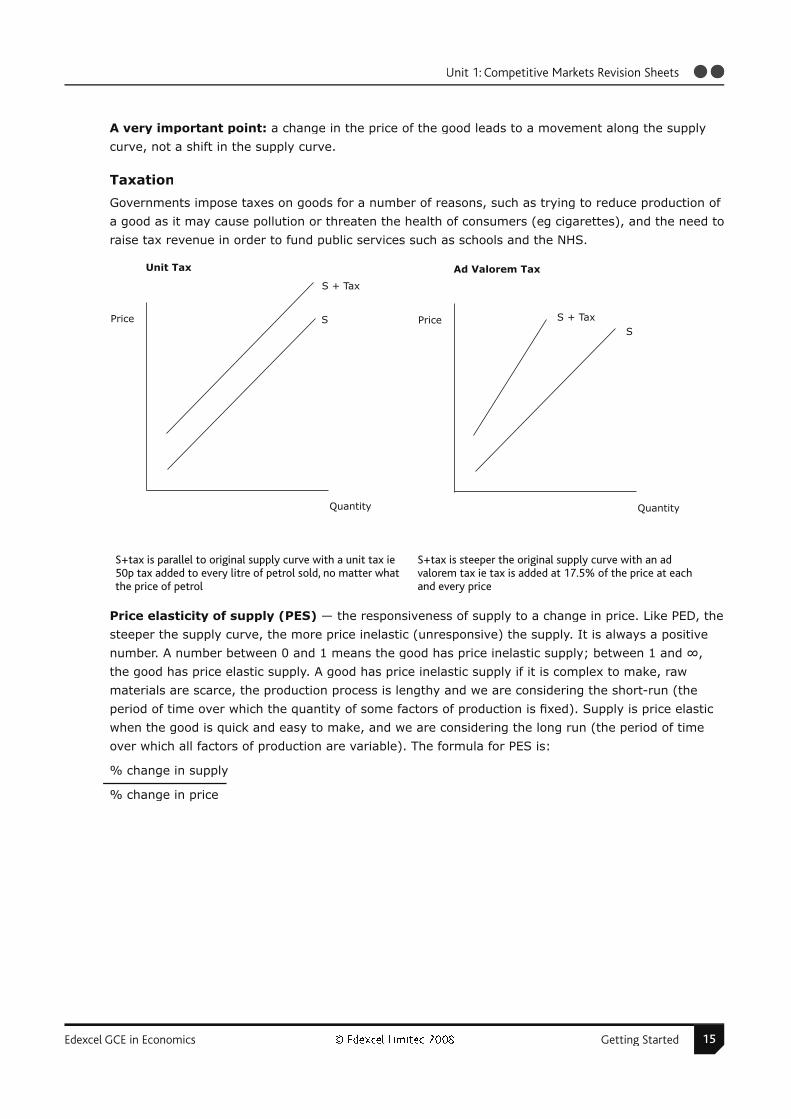
A very important point: a change in the price of the good leads to a movement along the supply
curve, not a shift in the supply curve.
Taxation
Governments impose taxes on goods for a number of reasons, such as trying to reduce production of
a good as it may cause pollution or threaten the health of consumers (eg cigarettes), and the need to
raise tax revenue in order to fund public services such as schools and the NHS.
S+tax is parallel to original supply curve with a unit tax ie50p tax added to every litre of petrol sold, no matter whatthe price of petrol
S+tax is steeper the original supply curve with an advalorem tax ie tax is added at 17.5% of the price at each and every price
Price elasticity of supply (PES) — the responsiveness of supply to a change in price. Like PED, the
steeper the supply curve, the more price inelastic (unresponsive) the supply. It is always a positive
number. A number between 0 and 1 means the good has price inelastic supply; between 1 and ∞,
the good has price elastic supply. A good has price inelastic supply if it is complex to make, raw
materials are scarce, the production process is lengthy and we are considering the short-run (the
period of time over which the quantity of some factors of production is fi xed). Supply is price elastic
when the good is quick and easy to make, and we are considering the long run (the period of time
over which all factors of production are variable). The formula for PES is:
% change in supply
% change in price
Price
Quantity
S + Tax
S
Unit Tax
Price
Quantity
S + TaxS
Ad Valorem Tax

16 Edexcel GCE in Economics Getting Started© Edexcel Limited 2008Edexcel GCE in Economics
Unit 1: Competitive Markets Revision Sheets
1.3.4 — What determines the price of a good or service in the market?
In a free market, we combine the forces of demand and supply in order to determine the market
price of a good or service.
P is known as the market clearing price — the price atwhich supply exactly meets demand. If the price is too high, then supply > demand, and we have excess supply, or a surplus or glut. To get rid of the excess supply, producers will have to lower the price, and so the market clearing price will eventually be reached. If the price is too low, then demand > supply, and we have excess demand or a shortage. To get rid of the excess demand, the price will rise towards the market clearing price, causing consumers to leave the market as the good becomes more expensive than the price they are willing to pay.
The Functions of Prices
Rationing: because resources are scarce and fi nite, not everyone is able to buy everything they
want; when demand is greater than supply, then prices are bid up so that the good/service is
rationed out to those who can afford to pay.
Incentive: when prices are high, then this attracts producers to the market because it can enable
higher profi ts to be earned.
Signalling: prices help to determine where and how resources should be allocated; if prices
increase, this signals to producers that demand is probably high and that they should increase
production.
Consumer and Producer Surplus
Consumer surplus: the difference between the amount that a consumer is willing to pay and the
price that they actually pay; shown by the difference between the demand curve (the amount they
are willing to pay) and the market equilibrium price (the amount they actually pay) — the darker
shaded area on the diagram.
Producer surplus: the difference between the amount a producer is willing to sell a good for, and
the price they actually receive; shown by the difference between the supply curve and the market
equilibrium price — the lighter shaded area on the diagram.
Obviously, the level of consumer and producer surplus willchange if there is a shift in the demand or supply curve.
Price
QuantityQ
S
D
P
Price
QuantityQ
S
D
P

Edexcel GCE in Economics Getting Started 17Edexcel GCE in Economics
Unit 1: Competitive Markets Revision Sheets
1.3.5 — How might the change in the price of a good be explained?
It is easy to see that a shift in demand or supply causes a change in the price of a good. Prices will
increase if demand increases (moves to the right) or supply decreases (moves to the left). Prices
will decrease if demand decreases (moves to the left) or supply increases (moves to the right).
Demand for oil is highly price inelastic, as is supply. Any change in supply of oil will therefore have
a very large effect on the price of oil. Supply shocks such as the war in Iraq, or the breaking of a
pipeline, will cause a dramatic increase in price as supply decreases. Recently, demand for oil from
Newly Industrialised Countries such as China has increased, causing the demand curve to shift right,
and oil prices to rise. Changes in oil prices have a large impact on the global economy, because oil is
used as a raw material in the production of many products and the transport industry. So, if the price
of raw materials increases then supply of most goods falls which pushes up prices of most goods.
Demand for agricultural goods is also price inelastic, as they are necessities for the majority of
people. Supply is also fairly price inelastic, as supply cannot easily be altered once crops are sown
etc. Farmers always know the maximum that they can sell, as this equals the amount they have
planted. However, in periods of bad weather, supply can be radically reduced, forcing prices up.
Demand for agricultural products has increased recently with the rise in importance of biofuels,
where products such as sugar cane are being used to produce ethanol rather than food. Again, this
pushes up the price.
The price of stocks and shares on the stock market is determined through market forces.
Confi dence is a key determinant of share prices. Demand for shares tends to increase if people
are feeling confi dent about the state of the economy and the future. Demand falls when events
occur that shake people’s confi dence, eg terrorist attacks, revelations of scandals at banks etc.
Speculation is also an important factor. If people believe that share prices will rise, they will want
to buy them at a lower price now and sell them at a higher price in the future. So, if people expect
share prices to rise then demand will increase — which causes the price to rise, resulting in a self-
fulfi lling prophecy!

18 Edexcel GCE in Economics Getting Started© Edexcel Limited 2008Edexcel GCE in Economics
Unit 1: Competitive Markets Revision Sheets
The Incidence of Taxation
NB: the steeper (more inelastic) the demand curve, the greater the yellow area and the smaller the green area
Incidence of a Subsidy
Price
P1
P
QuantityQ1 Q
S + Tax
S
D
Amount (incidence) of taxpaid by the consumer
Amount (incidence) of taxpaid by the producer
Sum of areas = total taxrevenue received by government
Price
P
P1
QuantityQ Q1
S + subsidy
S
D
Benefit of Subsidy toconsumer
Benefit of Subsidy toproducer
Total cost of Subsidy togovernment

Edexcel GCE in Economics Getting Started 19Edexcel GCE in Economics
Unit 1: Competitive Markets Revision Sheets
1.3.5 — What determines the wage rate for labour in a market?
In the labour market, people from households supply labour and businesses demand labour.
The demand for labour is known as derived demand — this means that demand for labour is
determined by demand for the goods and services that they produce. Businesses will demand more
labour if there is a high demand for the goods and services they produce, for example at times
of economic boom. Demand for labour also increases if workers are more productive, or if capital
becomes more expensive (labour and capital are substitutes).
Supply of labour is determined by a number of factors:
- changes in migration patterns: when many of the newer member states of the EU joined the
EU, countries such as the UK saw an increase in immigrants, and therefore an increase in the
labour supply
- income tax: when income tax is high, workers may feel that it is not worth working because
they take home too little of their pay, and so labour supply may fall ie the value of their leisure
time is more valuable than an hour of work, and so they substitute leisure for work. On the other
hand, workers may feel that they have to work longer hours to compensate for the reduction in
pay, and so labour supply may increase
- benefi ts: if state benefi ts (eg for sickness, disability, unemployment etc) are generous, then
people are more likely to stay at home rather than work, thus reducing the labour supply
- trade unions: because trade unions act to increase wage rates through a process of collective
bargaining, this may increase the labour supply as more people are encouraged to join the
workforce. However, higher wage rates mean reduced demand for labour, so unemployment
might result. A similar outcome may occur as a result of a National Minimum Wage
- social trends: the workforce in the UK had increased female participation compared to a few
decades ago, as it has become more acceptable for women to work and childcare has become
easier to access.
The price of labour is known as the wage rate. If wages are too high, then there is more labour
supplied than demanded — we have unemployment. If this occurs in a free labour market, then
workers will have to accept lower wages or go without a job; thus the wage rate will tend to fall to
the market clearing rate. If wages are too low, then demand for labour will be high but supply will
be low so there will be a labour shortage, ie workers will not work if they are paid too little (an
hour of their leisure time is more valuable than a hour of work). Firms will have to pay workers more
as an incentive to work, and so the wage rate will be bid up to the market clearing wage.

20 Edexcel GCE in Economics Getting Started© Edexcel Limited 2008Edexcel GCE in Economics
Unit 1: Competitive Markets Revision Sheets
The Labour Market Diagram, with the Effects of the National Minimum Wage
Wage rate
NMW
W
Unemployment
DL (nmw) QL SL (nmw)
SL
DL
Quantity of Labour

Edexcel GCE in Economics Getting Started 21Edexcel GCE in Economics
Unit 1: Competitive Markets Revision Sheets
1.3.7 — Why do some markets fail?
Negative externalities (or external costs) exist when the social costs of an economic action are
greater than the private costs. For example, a toy manufacturer located on the banks of a river will
incur a number of private costs of production (eg raw materials, labour, running machinery etc)
but may also impose costs on third parties, such as noise from delivery lorries and an ugly factory
affecting the quality of life of local residents or pollution being pumped into the river. Social costs =
private costs + external costs.
Positive externalities (or external benefi ts) exist when the social benefi ts of an economic action
are greater than the private benefi ts. For example, the education received by a child means that
he or she can get a job which pays a reasonable income (ie there is a private benefi t to education);
however, that child’s education may also benefi t wider society if he or she become a doctor and is
able to treat people so that they can return to work (ie there is also a social benefi t). Social benefi ts
= private benefi ts + external benefi ts.
MSB = marginal social benefi t
MSC = marginal social cost
MPC = marginal private cost
MPB = marginal private benefi t
P*Q* = ideal, effi cient equilibrium, where MSC = MSB
PQ = actual, ineffi cient equilibrium — market failure
Shaded area = welfare loss/gain
Price/cost
P*
P
Overproduction
Q* Q
MSC
Negative Externalities
MPC
Quantity
MSB
Price/cost
P*
P
Underconsuption
Q Q*
MSC
Positive Externalities
MSB
Quantity
MPB

22 Edexcel GCE in Economics Getting Started© Edexcel Limited 2008Edexcel GCE in Economics
Unit 1: Competitive Markets Revision Sheets
Cost benefi t analysis (CBA) is an investment appraisal tool that applies the externalities idea.
Major projects, such as staging the London 2012 Olympics, or the building of a new motorway, are
often controversial. To decide whether a project should go ahead or not, planners work out the
private and external costs (to give social costs), and the private and external benefi ts (to give social
benefi ts). If social costs exceed social benefi ts, then the project shouldn’t go ahead. If social benefi ts
exceed social costs, then the project might go ahead. In practice, however, it is very diffi cult to
value external costs and benefi ts because different people have different opinions as to their value
(ie it can be normative). It is also very costly to undertake a CBA. Finally, politicians may adopt
rent-seeking behaviour, where they decide to press ahead with a project where social costs are high
because it might win their party votes.
Public goods
Non-rival means that consumption of a good/service does not prevent another person from also
consuming that good/service, eg the provision of a streetlight demonstrates non-rivalry, because if
one person uses the light provided by the streetlight it does not prevent another person from also
benefi ting. However, if a person eats a chocolate bar, then someone else cannot also eat the same
chocolate bar.
Non-excludable means that once a good is provided, it is impossible to stop people from using it,
eg once a lighthouse is provided, then ships at sea cannot be prevented from benefi ting from it.
However, if a car manufacturer provides a new model of car, people can be excluded from purchasing
one if they do not have enough disposable income with which to buy the car.
Goods that are both non-rival and non-excludable are called public goods. Goods that are rival and
excludable are private goods. Goods that are either non-rival or non-excludable but not both are
quasi-public goods.
Public goods have to be provided by the government, because since people cannot be
prevented from using them, no-one has any incentive to pay to provide them as they cannot make a
profi t. Thus there is market failure. People who use public goods without paying for them are known
as free-riders.
Imperfect information
For markets to work, there needs to be perfect and symmetric information ie consumers and
producers have the same level of knowledge about the products, and they know everything there is
to know about them. In many cases, however, information may be asymmetric (producers know
more than consumers) or incomplete/imperfectr . In these situations, we have market failure.
In the private healthcare market, doctors know more than patients about healthcare and
treatments (asymmetric information). There is an incentive, therefore, for doctors to prescribe more
expensive treatment than is necessary in order to increase their profi ts. This is an ineffi cient use of
resources. Many consumers in the healthcare market take out insurance to help pay for treatment;
this, however, leads to a problem of moral hazard, where they take more risks and therefore
require more treatment because they are insured. Again, this is a consequence of asymmetric
information in the market where consumers know more than insurers about their intended future
actions.

Edexcel GCE in Economics Getting Started 23Edexcel GCE in Economics
Unit 1: Competitive Markets Revision Sheets
In many markets, such as the tobacco, alcohol or pensions marketsr , providers of these goods
and services often withhold information deliberately from consumers. For example, many tobacco
companies knew of the link between tobacco and lung cancer before consumers were aware of it,
and continued to advertise tobacco as being ‘healthy’ and ‘sociable’, leading to over-consumption of
tobacco, and therefore market failure. In the pensions market, many consumers do not understand
the workings of the pensions market, and that the type of fund into which they pay money may
result in a loss of money rather than a gain, should stock markets fall. Thus, consumers’ information
is incomplete, and an ineffi cient market outcome results.
Labour immobility
The labour market is not very effi cient, and market failure results from the inability of workers to
easily move between jobs. There are a number of reasons for this. Geographical immobility refers to
the inability of workers to move around the country in search of work. This may be due to the high
percentage of home ownership f in the UK (rather than rented accommodation like in continental
Europe) and the lengthy process required to sell and buy a house. High UK house prices also
prevent people from moving. It may also be due to social reasons, such as not wanting to move
away from family or not wanting to uproot children from good schools. The UK government provides
housing subsidies for Key Workers (nurses, teachers etc) in areas where house prices are high, but
many of the available homes are in undesirable areas and waiting lists are long.
Occupational immobility refers to the inability of workers to move between jobs due to lack of
appropriate skills or training. As the economy has shifted from having a manufacturing base to a
service-sector base, many low-skilled manual workers have found themselves without jobs. Schemes
such as the government’s New Deal for Labour have tried to tackle this by providing training
programmes and courses, but many people cannot afford to spend their time in training rather than
work.
Commodity markets
These are the markets concerned with raw materials, such as precious metals and minerals, and
agricultural products. Agricultural markets in particular are prone to strong fl uctuations in prices, as
supply can be unpredictable (owing to the weather and crop diseases). There is also a time-lag
problem, owing to the fact that crops can take up to a year to grow and animals several years to
raise meaning that farmers have to base their decisions on how much to plant or raise, and therefore
sell in the future, based on current prices. So, if the price of wheat is very high this year, farmers will
plant large wheat crops for reaping next year, but this increased supply will force down the market
price, which in turn encourages them to plant less, thus reducing supply and forcing prices back up.
These fl uctuating prices are bad for producers, because it leads to unstable income, and also bad for
consumers, for whom many of these goods are necessities.

24 Edexcel GCE in Economics Getting Started© Edexcel Limited 2008Edexcel GCE in Economics
Unit 1: Competitive Markets Revision Sheets
Governments can tackle these problems in a number of ways. Firstly, they could introduce a
minimum price, where goods cannot be sold at a price below this. Minimum prices are set above
the market price. This means that supply will exceed demand, and so there will be a glut or surplus.
Secondly, they could use a buffer stock, which entails a price ceiling and a price fl oor. If the price of
the commodity drops too low (probably through high supply), then the government or buffer stock
authority purchases large quantities of the good and stores it, in order to reduce the supply available
to the market and raise the market price. If the price becomes too high, the government or buffer
stock authority release the good onto the market from storage, thus increasing supply and lowering
price. However, there are a number of problems with buffer stock schemes:
• storage is expensive
• transport to and from storage is expensive
• it works only if goods are non-perishable
• it is nearly impossible to ensure that the amount kept in storage will equal the amount required
for release in the future to lower prices (many buffer stock schemes end up storing too much,
creating butter mountains, grain mountains and wine lakes).
Price
Pmin
Excess supply
Qd Qs
S
Minimum price
Quantity
D
Price
CeilingPrice
Released from storage
S
Buffer Stock
Quantity
D
Purchased for storage
TargetPrice
FloorPrice
S2
S1

Edexcel GCE in Economics Getting Started 25Edexcel GCE in Economics
Unit 1: Competitive Markets Revision Sheets
1.3.8 — How do governments attempt to correct market failure
Type of intervention How it works Strengths Weaknesses
Taxation Reduces supply and therefore increases price, to discourage production /consumptionof a good that has negative externalities.
Works through the pricemechanism. Easy tounderstand.
Can be expensive tocollect. Diffi cult to knowthe correct level of tax toset, as it should equal theexternal costs (= diffi cult tomeasure). Ineffective if PEDis inelastic, as tax will haveto be very high to reduceequilibrium quantity. Can beregressive.
Subsidy Increases supply and therefore reduces price, to encourage production /consumption of a good with positive externalities.
Works through the pricemechanism. Easy tounderstand.
Expensive for government— incurs an opportunitycost. Diffi cult to knowcorrect subsidy to provideas it should equal externalbenefi ts. Producers maypocket the money and notincrease supply.
State provision Government directly provides a good or service, funded through tax revenue, in order to provide goods which have positive externalities or are public goods.
Increases fairness of access to services such ashealthcare and education,which have many positiveexternalities attached.Without Governmentprovision, public goodswouldn’t be provided.Trustworthy provided withcommon standards.
Expensive for Government— incurs opportunity cost.State monopoly can resultin ineffi ciency (eg throughbureaucracy etc). Diffi cultto maintain consistentstandards.
Buffer stocks Government purchases commodities if a fl oor price is reached and sells commodities if a ceiling priceis reached.
Ensures fair income for producers and fair prices for consumers.
See section 1.3.7
Regulation Government imposes rules regarding the production, sale or use of a good/service, and backs this up legally by fi nes/ prison sentences etc. Aims to tackle negative externalities.
Easy to understand and ofteneasy to monitor/police.
Expensive to monitor/police.Firms may ignore fi nes if they are not large enough.Can be anti-competitive.Often diffi cult to ‘pin theblame’ on the appropriateperson, therefore unfair.
Pollution permits An effi cient amount of pollution is agreed, and a corresponding number of permits released — these can be traded amongst fi rms so that low polluters can sell to high polluters andmake a profi t. Aims to tackle negative externalities.
Uses the market mechanism,therefore effi cient.Requires little Governmentintervention, therefore cheapto run.
Diffi cult to set correctamount of pollution and therefore right number of permits.

26 Edexcel GCE in Economics Getting Started© Edexcel Limited 2008Edexcel GCE in Economics
Unit 1: Competitive Markets Revision Sheets
Type of intervention How it works Strengths Weaknesses
Extended property rights Aims to identify who isresponsible for paying for external costs, therefore reducing negative externalities. The economist Ronald Coase argued that it didn’t matter whether theproducer or the consumer took responsibility — either would be an effi cient outcome.
Once property rightsare allocated, no moreGovernment interventionneeded in theory, thereforecheap.
Diffi cult to allocate propertyrights when they havenever existed before. Someproperty rights cannotbe allocated, eg carbonemissions cause globalwarming, but no-one ‘owns’the world and it would bepolitically undesirable for this to happen.

Edexcel GCE in Economics Getting Started 27Edexcel GCE in Economics
Unit 1: Competitive Markets Revision Sheets
1.3.9 — What is government failure?
Government failure exists when the government intervenes to correct a market failure but this can
result in a more ineffi cient allocation of resources.
Example 1: Mexico City and emissions from cars — tackling transport marketfailure
A good example of government failure is Mexico’s approach to reducing CO2 emissions in Mexico
City. Their policy was very simple — cars with even/odd number plates were allowed into the city on
alternate days, which in theory should have reduced the number of cars entering the city by a half.
However, the reality was very different. Car-owners sold their nice cars, and bought two, older and
more polluting cars — one with an even number plate and one with an odd plate. Result: an increase
in CO2 emissions and Government failure.
Example 2: The Common Agricultural Policy (CAP) — tackling agricultural market failure
The aim of CAP is to stabilise agricultural prices and provide a satisfactory level of income for farmers
in the European Union (EU). However, the outcome is ineffi cient. Farmers produce too much, and
excess supply is bought by the EU and stored (causing ‘wine lakes’ and ‘butter mountains’). So, the
EU has to pay subsidies to farmers AND pay for warehouses and storage. Result: an ineffi cient use of
Government money and Government failure.
Example 3: The National Minimum Wage — tackling labour market failure
This was introduced to protect workers who received low pay, by making it illegal for employers
to pay a wage below the NMW. However, those workers who managed to retain their job ended up
with higher pay, but some workers would lose their jobs and therefore be worse off. Result: a more
ineffi cient market outcome and government failure.
Example 4: Rent controls — tackling housing market failure
Many people in the UK struggle to pay for ever-more-expensive housing, especially with the
increasing housing shortage in the South-East. If the government were to consider the level of rent
to be unacceptably high, then they could impose a maximum rent. Maximum prices are set below the
market equilibrium price, so that in this case demand for houses exceeds supply of houses, causing a
housing shortage — some people will be worse off. Result: Government failure.
28 Edexcel GCE in Economics Getting Started© Edexcel Limited 2008Edexcel GCE in Economics
Unit 2: Managing the Economy Delivery Schedule
Managing the Economy — Course Outline for Unit 2
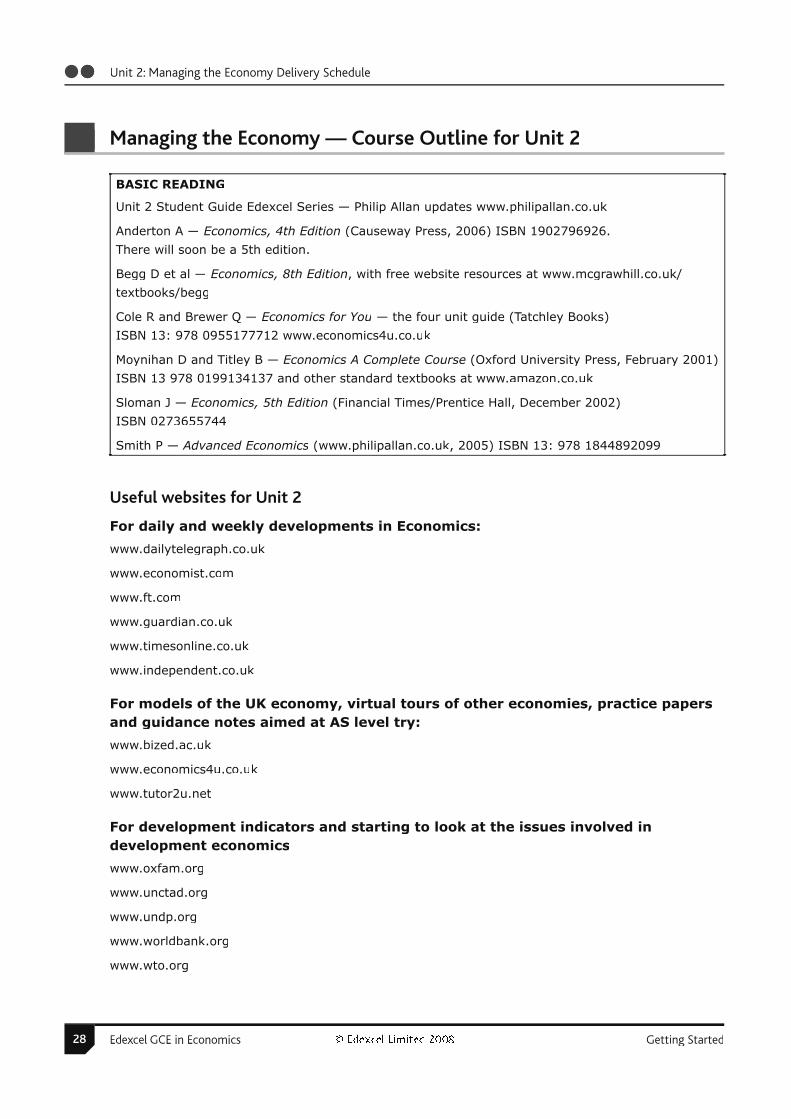
BASIC READING
Unit 2 Student Guide Edexcel Series — Philip Allan updates www.philipallan.co.uk
Anderton A — Economics, 4th Edition (Causeway Press, 2006) ISBN 1902796926.
There will soon be a 5th edition.
Begg D et al — Economics, 8th Edition, with free website resources at www.mcgrawhill.co.uk/
textbooks/begg
Cole R and Brewer Q — Economics for You — the four unit guide (Tatchley Books)
ISBN 13: 978 0955177712 www.economics4u.co.uk
Moynihan D and Titley B — Economics A Complete Course (Oxford University Press, February 2001)
ISBN 13 978 0199134137 and other standard textbooks at www.amazon.co.uk
Sloman J — Economics, 5th Edition (Financial Times/Prentice Hall, December 2002)
ISBN 0273655744
Smith P — Advanced Economics (www.philipallan.co.uk, 2005) ISBN 13: 978 1844892099
Useful websites for Unit 2
For daily and weekly developments in Economics:
www.dailytelegraph.co.uk
www.economist.com
www.ft.com
www.guardian.co.uk
www.timesonline.co.uk
www.independent.co.uk
For models of the UK economy, virtual tours of other economies, practice papers and guidance notes aimed at AS level try:
www.bized.ac.uk
www.economics4u.co.uk
www.tutor2u.net
For development indicators and starting to look at the issues involved indevelopment economics
www.oxfam.org
www.unctad.org
www.undp.org
www.worldbank.org
www.wto.org

Edexcel GCE in Economics Getting Started 29Edexcel GCE in Economics
Unit 2: Managing the Economy Delivery Schedule
Scheme of Work — One Teacher
Kindly submitted by Nick Maloney of Wellington School
Outline Scheme of Work
Principles
• In each term, do a mixture of micro and macro. Macro knowledge often comes late in the day
and some basic concepts early on will allow students to follow events in the media.
• The scheme assumes an even split between the two.
• Aim to have the covered all the concepts in the syllabus by Easter so that the Summer term can
be used for revision and exam preparation.
• Primarily use past Edexcel exam questions from January onwards for written work to prepare
students for assessment.
Examination programme:
This scheme of work assumes no exams are to be taken in January except for Unit 1 retakes.
30 Edexcel GCE in Economics Getting Started© Edexcel Limited 2008Edexcel GCE in Economics
Unit 2: Managing the Economy Delivery Schedule
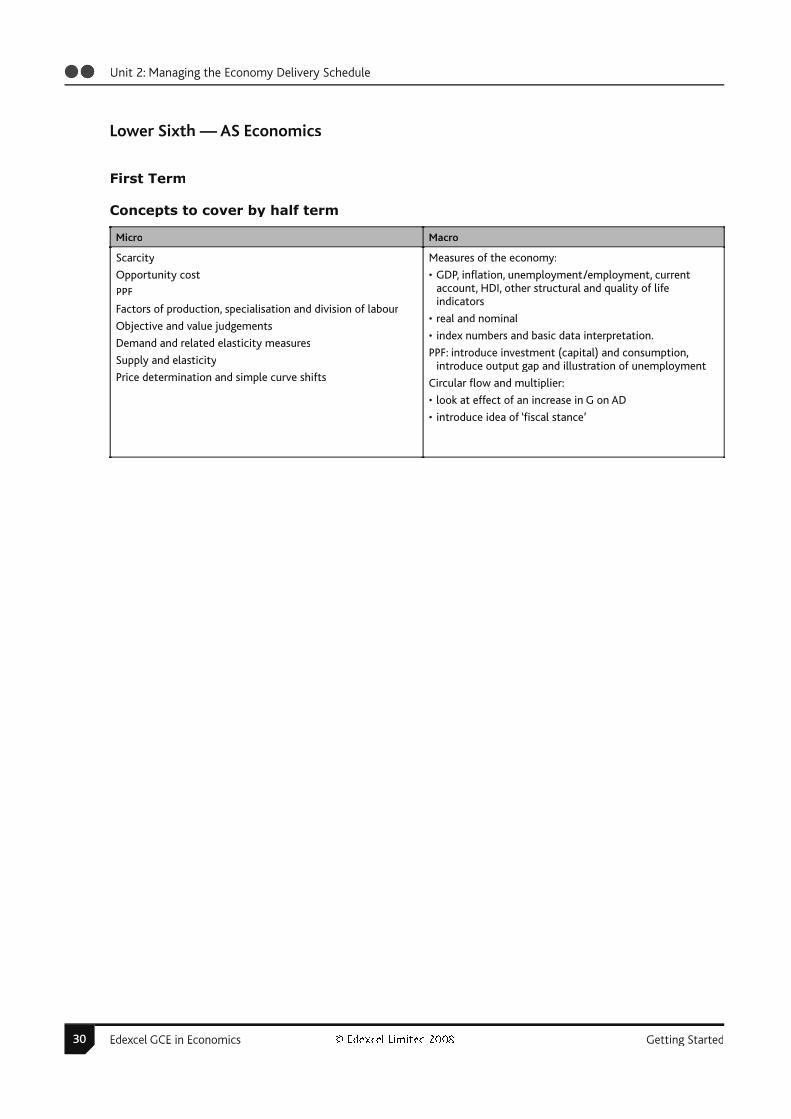
Lower Sixth — AS Economics
First Term
Concepts to cover by half term
Micro Macro
Scarcity
Opportunity cost
PPF
Factors of production, specialisation and division of labour
Objective and value judgements
Demand and related elasticity measures
Supply and elasticity
Price determination and simple curve shifts
Measures of the economy:
• GDP, infl ation, unemployment/employment, current account, HDI, other structural and quality of life indicators
• real and nominal
• index numbers and basic data interpretation.
PPF: introduce investment (capital) and consumption, introduce output gap and illustration of unemployment
Circular fl ow and multiplier:
• look at effect of an increase in G on AD
• introduce idea of ‘fi scal stance’

Edexcel GCE in Economics Getting Started 31Edexcel GCE in Economics
Unit 2: Managing the Economy Delivery Schedule
Concepts to cover after half term
Micro Macro
Consumer and producer surplus:
• Basic welfare analysis — why free market maximiseswelfare?
Role of price mechanism:
• Mixed economies — advantages and disadvantages of apure free market economy
Application of demand and supply framework to a variety of markets including labour, commodity and asset markets:
• indirect taxes and per unit subsidies
• price fl oors and ceilings eg national minimum wage
• effect of tax and benefi ts on the supply of labour (introduction of income and substitution effects)
AD and its components (C+I+G+X-M):
• briefl y look at factors infl uencing each
• introduce idea of transmission mechanism — ‘cause’ and ‘effect’
• shifts in AD
• relate to circular fl ow model.
AS:
• bring in concept of Phillips Curve to explain shape
• shifts in AS.
AD/AS equilibrium
Trend growth rate
Output gap analysis
Monetary policy:
• introduce current UK framework
• look at how an interest rate change effects the UK economy (transmission mechanisms).
Fiscal policy:
• Look at effect of government spending and tax changes using AD/AS analysis.

32 Edexcel GCE in Economics Getting Started© Edexcel Limited 2008Edexcel GCE in Economics
Unit 2: Managing the Economy Delivery Schedule
Second Term
Concepts to cover by half term
Micro Macro
Market failure — defi nition:
• look at assumptions of a ‘perfect market’
Externalities
• examples of government intervention
• tax, subsidy, prohibition, property rights, tradable permits,regulation (C&C).
Information failure:
• merit and demerit goods
• solutions: tax and subsidy, prohibition and promotion.
Public Goods:
• look at pure and quasi public goods
• free-rider problem.
Causes and constraints on growth.
Look at recent UK economy and identify causes andconstraints — use AD data as a starting point:
• discuss ‘unbalanced’ versus ‘balanced’ growth.
Costs and benefi ts of growth.
Macro objectives of government:
• Look at simple confl icts between objectives.
Edexcel GCE in Economics Getting Started 33Edexcel GCE in Economics
Unit 2: Managing the Economy Delivery Schedule
Concepts to cover after half term
Micro Macro
Information failure:
• asymmetric information
• moral hazard and principal-agent problem — solutions suchas incentives and observation
• adverse selection and lemon theory — solutions such assignalling and collective provision
Volatile prices:
• causes — inelasticity, uncertainty and time lags
• effects on producers and consumers
• solutions — buffer stocks, minimum prices
Cost benefi t analysis
Government failure — defi nition:
• evaluation of various government attempts at solving marketfailure
• look at current policies such as: congestion charge, carbon emissions trading, smoking ban, extension of compulsoryeducation to 18, etc.
Supply side policy:
• focus on productivity — shifting the PPF
• government spending (fi scal) vs. changes in regulation.
Evaluation of macro policies:
• time lag between implementation and outcome
• uncertainty of outcome
• confl icting objectives: equity, environment, infl ation, unemployment, growth, current account
Analysis of Budget statement:
• look at fi scal stance, supply side impact, assessment of government forecasts.

34 Edexcel GCE in Economics Getting Started© Edexcel Limited 2008Edexcel GCE in Economics
Unit 2: Managing the Economy Delivery Schedule
Third Term
Before exams
Systematic revision of syllabus using exam questions to frame discussion. Do a mixture of short
defi nition, diagram and supported choice tests and written responses to exam questions.
After exams
There are a variety of approaches possible here. Tackling an interesting part of the A2 syllabus may
help alleviate pressure next year. For example, game theory or differences between developed and
developing economies. A project-based approach may allow students to pursue their own interests.

Edexcel GCE in Economics Getting Started 35Edexcel GCE in Economics
Unit 2: Managing the Economy Delivery Schedule
2.1 Unit description
About this unit This unit is very similar to the 2000 to 2008 Unit 3 6353 Managing
the Economy, in terms of content and expected teaching style. There
have been some clarifi cations in terms of expectations in the analysis,
and some fl exibility in the use of defi nitions to allow for changes
in line with ongoing economic developments. There is a very basic
introduction to the defi nitions required for the economic development
component of the new Unit 4.
2.2 Assessment information
The assessment model is very similar to that used in the 2003
(revised 2000) specifi cation, with three main exceptions.
• The marks are doubled, to make more differentiation possible by
examiners, and so that changes at remark stage will be closely
refl ected by changed in UMS marks. This will allow more steps
in the mark scheme (half marks had not been allowed with the
mark base of 40, and odd numbers out of 80 effectively provide
half marks). It will also allow more differentiation in the mark
scheme, and a fanning out of the marks.
• The timing and weighting of this unit has increased, and is now
equal to the weighting of the microeconomics unit. This is an
encouraging development, not least in that many students fi nd
macroeconomics more challenging than the microeconomics
side and a greater step from GSCE in terms of conceptual
development.
• The assessment objectives are equally weighted, with 25%
of the marks each for knowledge, application, analysis and
evaluation. This is a change from 30:30:20:20 and will allow
little more scope for testing analysis and evaluation. This was
one of the main reasons for increasing the length of the exam by
50%.
2.3 Unit content
Where defi nitions are required these are indicated in bold. Please refer to the glossary at the end of
this section for Unit 2 for an acceptable defi nition.
Please note that this is not intended as a teaching guide to the full content, but instead highlights
points which are frequently raised by teachers at Inset meetings. If you have further points to raise
please don’t hesitate to email me at [email protected] .
36 Edexcel GCE in Economics Getting Started© Edexcel Limited 2008Edexcel GCE in Economics
Unit 2: Managing the Economy Revision Sheets
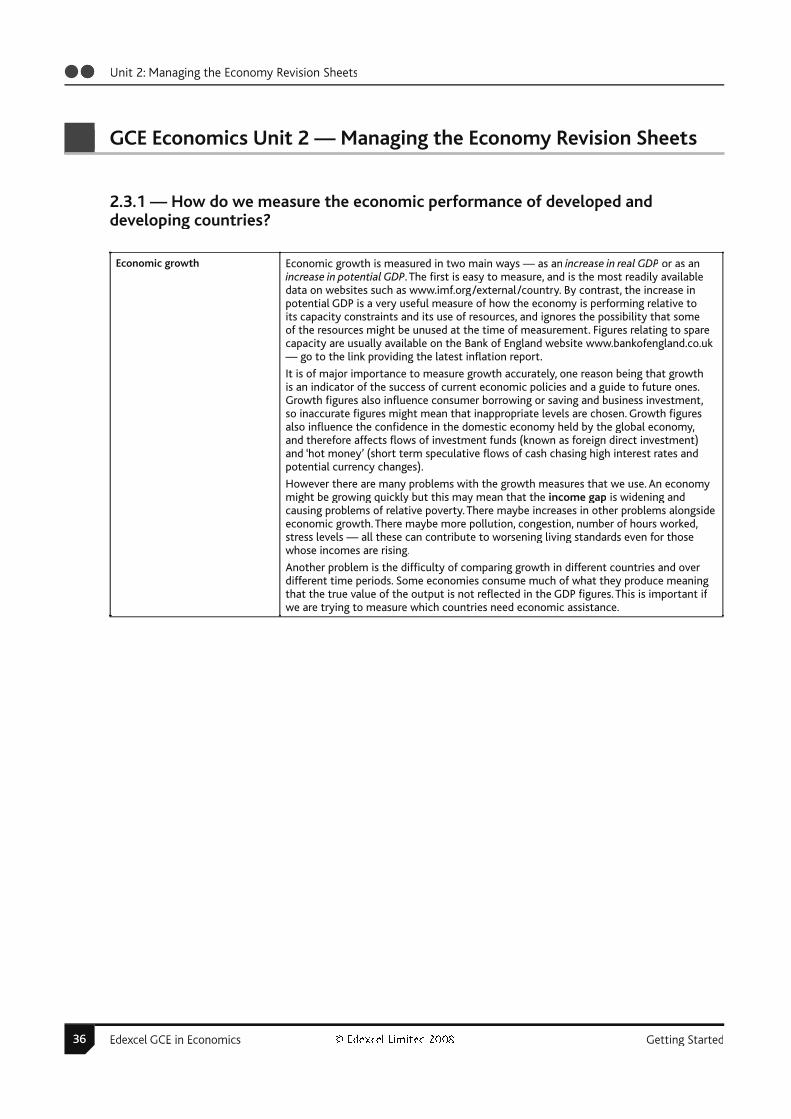
GCE Economics Unit 2 — Managing the Economy Revision Sheets
2.3.1 — How do we measure the economic performance of developed anddeveloping countries?
Economic growth Economic growth is measured in two main ways — as an increase in real GDP or as anincrease in potential GDP. The fi rst is easy to measure, and is the most readily availabledata on websites such as www.imf.org/external/countryr . By contrast, the increase inpotential GDP is a very useful measure of how the economy is performing relative toits capacity constraints and its use of resources, and ignores the possibility that some of the resources might be unused at the time of measurement. Figures relating to sparecapacity are usually available on the Bank of England website www.bankofengland.co.uk— go to the link providing the latest infl ation report.
It is of major importance to measure growth accurately, one reason being that growthis an indicator of the success of current economic policies and a guide to future ones.Growth fi gures also infl uence consumer borrowing or saving and business investment,so inaccurate fi gures might mean that inappropriate levels are chosen. Growth fi guresalso infl uence the confi dence in the domestic economy held by the global economy,and therefore affects fl ows of investment funds (known as foreign direct investment)and ‘hot money’ (short term speculative fl ows of cash chasing high interest rates andpotential currency changes).
However there are many problems with the growth measures that we use. An economymight be growing quickly but this may mean that the income gap is widening andcausing problems of relative poverty. There maybe increases in other problems alongsideeconomic growth. There maybe more pollution, congestion, number of hours worked,stress levels — all these can contribute to worsening living standards even for thosewhose incomes are rising.
Another problem is the diffi culty of comparing growth in different countries and over different time periods. Some economies consume much of what they produce meaningthat the true value of the output is not refl ected in the GDP fi gures. This is important if we are trying to measure which countries need economic assistance.

Edexcel GCE in Economics Getting Started 37Edexcel GCE in Economics
Unit 2: Managing the Economy Revision Sheets
Infl ation The key idea is that two different surveys are undertaken, one which indicates pricechanges and one the changes in the weighting of expenditure (Expenditure and FoodSurvey). The use of indices is intended to make comparisons easier over time andbetween countries, and a base year is chosen to make effective comparisons.
At the time of writing, the infl ation target is 2% +/- 1% CPI. Clearly in setting questions the data chosen will make use of the target currently in use by the body in charge of monetary policy, currently the MPC. These factors may change and it is importantthat the students will have a good working knowledge of monetary targets, preferablyrelating to targets within the most recent fi ve year period.
Employment and unemployment Employment and unemployment are not the opposite sides of the same issue — infact the number of people in work in the UK is often increasing at the same time that unemployment rises. This might be owing to increased immigration, for example, sothere are more people in the labour market, some of whom get jobs and some who don’tor replace others already working.
The two main methods of measuring unemployment in the UK are currently theInternational Labour Organisation (ILO) method, and the claimant count measure.
While the ILO method of measuring unemployment is fairly inclusive andinternationally comparable, there are problems in data collection and in the defi nitionof unemployment — for example, there are many out of work who now receiveincapacity benefi t (which might get more generous benefi t than those claiming for unemployment).
It may be that the claimant count, which measures those actually claiming Job Seeker’s Allowance, is in a way a better measure of hardship. There are again problems in thismeasurement, but these are of a different nature, so it is worthwhile to have sets of data to gain an overall picture of unemployment.
In times of economic prosperity the measures tend to move apart, with the ILOmeasure higher than the claimant count, and the trend moves in the opposite directionin an economic slowdown. The study of the reasons for these changes give a deeper understanding of how the measures are made, and much of the information is availableat www.statistics.gov.uk

38 Edexcel GCE in Economics Getting Started© Edexcel Limited 2008Edexcel GCE in Economics
Unit 2: Managing the Economy Revision Sheets
There are various names for different types of unemployment. Cyclical or demanddefi cient — the idea that unemployment levels might be related to the businesscycle. Classical — that unemployment might be positively related to wage pressuresespecially when wages are deliberately maintained above equilibrium level. Therelative importance of some types might be considered, for example that structuralunemployment might have long-term detrimental effects, whereas frictionalunemployment might not. Other types should also be considered: for example seasonal— where there are factors over which the government has little control, and regionalunemployment. Each type of unemployment has different implications for governmentpolicy.
Balance of Payments withemphasis on the current account of the Balance of Payments
The four elements of the current account (trade in goods, trade in services, investmentincome and transfers) should be understood, and their relative importance to the UK.Changes in the balance of payments on current account should be understood, from theviewpoint of cause and effect. Time series data should be used to show the context of an imbalance. It should be stressed that it is not the job of the Monetary Policy Committeeto correct an imbalance, although they may use the state of the Balance of Paymentsas an indicator of the state of the economy. The issue of ‘who pays for the imbalance?’might be discussed in class and whether the costs of trying to correct an imbalance areworthwhile in terms of damage to other measures.
Measures of development— Human Development Index (HDI)
There are three equal weights within the HDI: education (years of schooling andliteracy), health (mortality) and real GDP per head at PPPs. These are ranked 0 (best) toworst (1) in an index. This index does not take account of poverty or other measuresof deprivation, and in that respect is regarded by some as being of limited value. Theadvantage of HDI is that it does combine the effects of increased growth with other quality of life indicators, and in that respect is an important measure of development. Itmight be worth comparing the HDI with other measures, some of which contain a GDPelement and some that don’t.
PPPs are a way of measuring exchange rates using the idea of how much a basket of goods would cost in various countries. Rather than using nominal exchange rates, thePPP shows how much can be bought in another country with a unit of another currency— much like the ‘Big Mac Index’ (see www.economist.com) which shows relativeexchange rates based on the uniform (if distasteful) currency unit of a McDonald’sburger. It measures the real exchange rate, in terms of the cost of buying a fairlystandard product that can be bought in almost every country of the world, and wherethe ingredients are approximately the same. It can be used to measure the cost of livingof a standard basket of goods.
Other measures of development The important issue is that economic growth is not the same as increases in standards of living, but the latter is diffi cult to achieve without the former. Measures of economicdevelopment incorporate the concept of the quality of life, which is of course almostimpossible to measure, but there are indications of quality in life expectancy, access tomobile phone technology and so on. Some measures of economic development do notgrow in direct proportion to economic growth (eg GDP per head if infant mortality isfalling dramatically with small increases in income), and some far outpace it (increase inlife expectancy with the advent of inoculations).

Edexcel GCE in Economics Getting Started 39Edexcel GCE in Economics
Unit 2: Managing the Economy Revision Sheets
2.3.2 — Is income the same as wealth?
National income and the circular fl ow of incomeInjections and withdrawals
An acceptable simple diagram of the circular fl ow of income might be sketched asfollows:
The purpose of the diagram is to stress the concept of money fl ows, which are changed,with multiplied effects, when there is a change in injections or leakages.
It is of course possible to add the government and overseas market in this diagram, andto show repeated rounds of spending, if these are helpful in the student’s understanding. It is very unlikely that the diagram will be requested as a diagram — rather it is useful in gaining an understanding of the central concepts of macroeconomics.
Income and wealth If income increases are going to have a direct impact on wealth then a decision must bemade to forego current consumption in order to enjoy increased welfare in the future— a ‘jam tomorrow not jam today‘ ’ principle. Clearly many people with high incomes donot build up their personal wealth, and the same is true for fi rms and governments. Thedecision to increase productive resources, that is, build up wealth, is one of the mostsignifi cant economic decisions made in an economy.
X
G
I
Spending ongoods andservices
Factorincomes
Households
Firms
goodsand
services
factors ofproduction
S
T
M
40 Edexcel GCE in Economics Getting Started© Edexcel Limited 2008Edexcel GCE in Economics
Unit 2: Managing the Economy Revision Sheets
2.3.3 — What is aggregate demand (AD)?
The components of aggregate demand:C + I + G + (X — M)Movements along and shifts of the AD curve
Aggregate demand may be drawn as a straight downward sloping line at AS level,although this does rather omit the concept to the real balance effect — that the totalamount spent is likely to be fairly constant along the AD, and therefore the area under the AD is likely to remain fairly constant, as in the rectangular hyperbola.
Other reasons for drawing a downward sloping AD are that at higher average prices aneconomy is less likely to export more likely to import (increasing the M component of AD and therefore decreasing AD overall) — the international competitiveness argument.
Another argument for the downward sloping AD is that at higher prices the interest rate is likely to be higher, meaning that investment (a component of AD) is lower. They mightalso save more.
Whichever argument is used to explain the downward sloping AD, the vital point is that the AD does NOT slope downwards because people spend more at lower prices. Theremust be something else on which consumers choose to spend their money on at higher prices — eg imports — or the argument does not make sense in a macroeconomicscontext.
Consumption (C) Consumer spending is often the main driver of growth or a recession. The amount thatconsumers spend is largely infl uenced by the attitude of the consumer — is he or sheworried about losing a job, confi dent that shares and house prices are growing, or savingbecause of worries about a hopeless pension. Actual changes in the economy (such asrises in the FTSE) can cause real spending increases, if people decide to trade in their increases wealth, or may simply increase confi dence in spending. By contrast, a worryingstock market in, say, the USA, might cause people in the UK to reign in on their spending plans, whether or not the stock market in the UK reacts immediately or convincingly.
Investment (I) The interest rate, as the cost of borrowing, is likely to have an inverse relationship withthe amount of investment — only a few projects will be viable if the cost of credit ishigh. Increasingly business confi dence is seen as a major infl uence on the decision toinvest, and it may be that this contradicts the impact of interest rates. For example theMPC might raise rates because there are signs of consumer spending accelerating, whichmight encourage fi rms to invest more.
Government expenditure (G) Government spending is by central and local government on goods and services. Whileto some extent this spending is determined by the fi scal policy of the government, it is also largely dependent upon the business cycle. In a boom, tax receipts increase and thedemands on government spending will fall, and vice versa in an economic slowdown.
Changes in G are likely to have a large multiplier effect, in that the spending changes have a direct impact upon the spending in the economy.
Exports — Imports (X-M) X — M is the current account balance. If our main trading partners are suffering aslowdown in growth then this is likely to worsen our current account balance, as X fallsand M increases (our imports become more competitive). As AD falls we would expecta multiplied fall in UK national income but less infl ationary pressure in the economy. Bycontrast, if our main trading partners are growing quickly then this might stimulate theUK economy.
If the exchange rate strengthens (ie the pound gets stronger) then exports will becomerelatively expensive and imports relatively cheap. This would worsen the current accountposition. However, this depends on the elasticity of demand for exports and imports; if the competition is based on quality rather than price, then the changes in demand mightnot be signifi cant, and the current account might not suffer at all.

Edexcel GCE in Economics Getting Started 41Edexcel GCE in Economics
Unit 2: Managing the Economy Revision Sheets
2.3.4 — What is aggregate supply (AS)?
Aggregate supplyMovements along and shifts of the AS curve
Movements along the AS curve occur when there is a shift in AD, as a new equilibriumpoint is established. A short-run AS curve might be shown as a static backward-bending-L-shape (Keynesian), and a shift in AS might be seen as the long run AS situation. Other interpretations are acceptable. This diagram shows a possible analysis of a successfulsupply-side shift.
2.3.5 — What determines the price level and equilibrium level of real output?
Equilibrium level of output Equilibrium income or output occurs where planned AD equals planned AS, andmany economists argue that this point can occur even if there is unemployment. Theimplication is that the unemployment does not act as a force to clear the market, that is, wages do not keep falling until everyone is employed.
One real-world example is that people with very low skills can fi nd it hard to get a jobwhen the economy is not growing very fast. There might be seasonal work, for examplein agriculture, but there are lean times of the year when casual workers fi nd it hard toget jobs. It might be that these workers are too expensive to take on — but it might also be that there is no incentive for employers to take on workers whatever the going wage.
The multiplier An injection such as an increase in exports means that there is an immediate increasein AD. But the extra income raised by selling goods abroad will raise incomes of thosemaking the goods and services, and this income will be spent in the economy. Whatever is not spent on withdrawals (see glossary) will cause second round increases in AD,which leads to further rounds of income and spending. These knock on effects are themultiplier effects of an increase in injections, and the process work in reverse wheninjections fall — a reverse multiplier, or multiplied contraction of AD.
e2
e1
AD
y2
PL1
PL2
Pricelevel
Real national income
y1
AS1 AS2

42 Edexcel GCE in Economics Getting Started© Edexcel Limited 2008Edexcel GCE in Economics
Unit 2: Managing the Economy Revision Sheets
2.3.6 — What are the causes, costs and constraints on economic growth?
Actual and potential growth Actual growth is measured as increases in real GDP, and potential growth is an increasein the capacity in the economy.
Trends in growth rate are shown by changes in real GDP over time; these may becompared to changes in capacity over time, or compared to the trend or sustainable rateof growth — the vertical difference between the trend and actual being shown as theoutput gap. The gap signifi es whether the economy is operating with spare capacity and therefore worries about unemployment, or by contrast at over capacity, with worriesabout infl ation.
Causes and constraints ongrowth
Growth can be achieved by increases in the components of aggregate demand, for example an increase in consumer spending. The size of this increase depends on thesize of the multiplier, and therefore any changes in injections and leakages will have animpact on the degree of change in growth.
Growth can be achieved by increases or improvements in any of the factors of production, eg productivity growth or immigration. The effect is to shift the aggregatesupply curve to the right.
It is important to be able to compare and contrast the causes of growth, and to be ableto illustrate them with an AD/AS diagram.
Benefi ts of growth Increased wealth and income is no doubt a factor determining living standards, but theimpact should not be considered without evaluation of the issues. Increased incomeresulting from growth is likely to increase income inequality, and there might bestructural unemployment as some industries re replaced by new ones but workers’ skillsare not transferable.
Understand the benefi ts of growth to citizens of increased standards of living, to fi rms(increased profi ts) and to government (for example, increasing tax revenues).
Students may consider whether an increase in income necessarily increases livingstandards.
Costs of growth Costs of growth are well documented, most particularly by political pressure groups such as Friends of the Earth www.foe.org.uk. The following should be considered, but there aremany other valid factors: the adverse consequences of growth for the environment; thebalance of payments problems; income distribution and the opportunity cost of growth.

Edexcel GCE in Economics Getting Started 43Edexcel GCE in Economics
Unit 2: Managing the Economy Revision Sheets
2.3.7 — What are the macroeconomic objectives of governments? Do they confl ict?
Current macroeconomicobjectives
Students should have a sense of the trends in macroeconomic measures over thepast fi ve to ten years, and the stage at which governments might become concernedabout them. The side effects of macroeconomic problems could be considered, and thechanging importance of objectives as other factors change might be used as ways of weighing up which objectives are the most important to a government.
Confl icts between objectives The Phillips Curve, an empirical observation in 1958, comments that a shortage of labour might set off an increase in wages. The implication is that there might be a trade off between unemployment and increases in infl ation. This is set against the classical viewthat there is only unemployment if wages are too high — that is, if the supply of labour is greater than the demand for labour — in which case if more people are allowed tobecome unemployed the pressure on wages will fall.
The student should come to a view as to whether unemployment exists because wages are high or because there are other factors in the economy causing defi ciencies in thelabour market.
Another trade off which may be considered is that between economic growth and thecurrent account of the balance of payments. If an economy is growing quickly, as inIndia, it is likely to suck in many imports and exporters have reduced incentive to exportif the output can be sold at home. However if the growth is export led, as in China,the economic growth may improve current account, as the exports are bringing in thespending power in the economy. (Note that country specifi c data is not required.)
Growth may damage the environment, if it involves increased manufacturing, but if service based it may not. Indeed the increased incomes from growth might enable acountry to ‘clean up’, convert to cleaner or renewable fuels or tighten legislation.
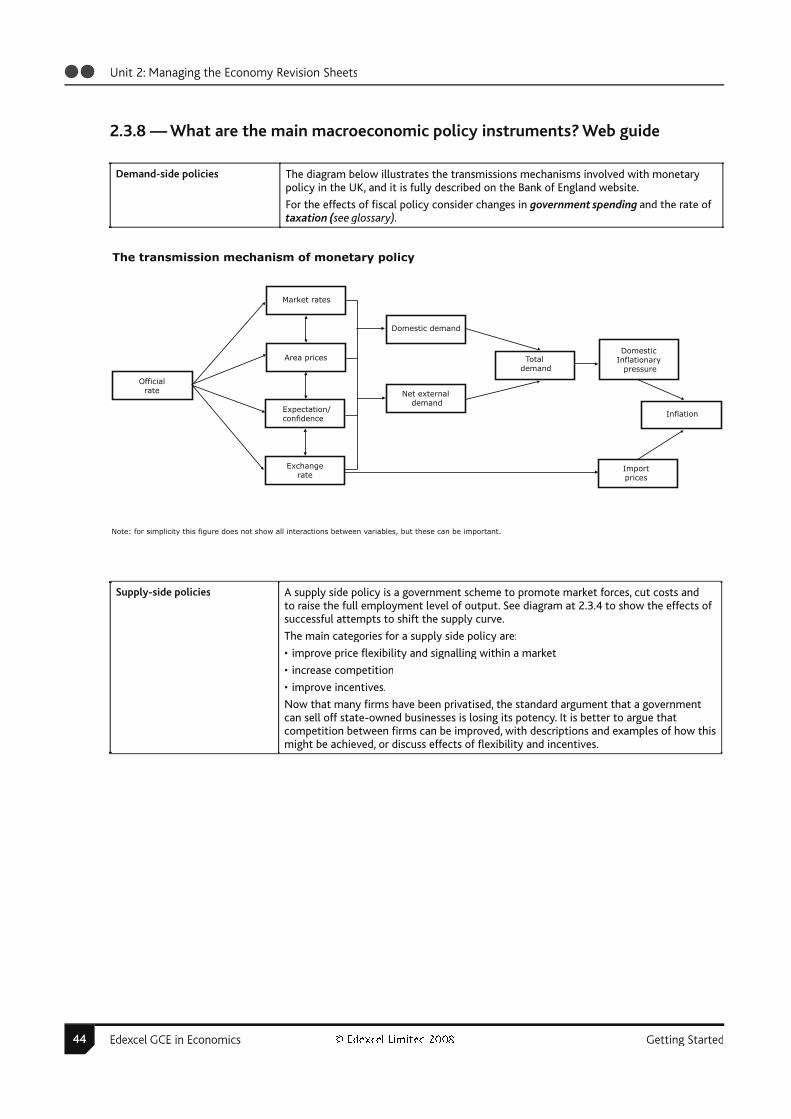
44 Edexcel GCE in Economics Getting Started© Edexcel Limited 2008Edexcel GCE in Economics
Unit 2: Managing the Economy Revision Sheets
2.3.8 — What are the main macroeconomic policy instruments? Web guide
Demand-side policies The diagram below illustrates the transmissions mechanisms involved with monetarypolicy in the UK, and it is fully described on the Bank of England website.
For the effects of fi scal policy consider changes in government spending and the rate of taxation (see glossary).((
Supply-side policies A supply side policy is a government scheme to promote market forces, cut costs andto raise the full employment level of output. See diagram at 2.3.4 to show the effects of successful attempts to shift the supply curve.
The main categories for a supply side policy are:
• improve price fl exibility and signalling within a market
• increase competition
• improve incentives.
Now that many fi rms have been privatised, the standard argument that a governmentcan sell off state-owned businesses is losing its potency. It is better to argue that competition between fi rms can be improved, with descriptions and examples of how this might be achieved, or discuss effects of fl exibility and incentives.
Market rates
Domestic demand
Area prices
Expectation/confidence
Exchangerate
Officialrate Net external
demand
Total demand
Domestic Inflationary
pressure
Inflation
Importprices
The transmission mechanism of monetary policy
Note: for simplicity this figure does not show all interactions between variables, but these can be important.

Edexcel GCE in Economics Getting Started 45Edexcel GCE in Economics
Unit 2: Managing the Economy Revision Sheets
2.3.9 — Do macroeconomic policies confl ict when they are used together?
Confl icts resulting from the useof policy instruments
An increase in government spending (part of fi scal policy) is likely to have a directimpact on the supply side of the economy — namely health, education or through theimpact of changes in taxes and benefi ts. The increased spending might cause problemsin supply — see the term bottlenecks in the glossary — but in the long run it is thoughtthat spending in these areas would help to improve the supply side conditions in aneconomy.
The investment by a government on the infrastructure of an economy, the educationalestablishments or the health infrastructure will also have a direct impact on the costs of production of fi rms. However overspending by governments may mean that there is ashortage of credit in the fi nancial markets, and the shortage of liquid assets will push up the cost of credit — that is the interest rate.
An increase in interest rates, while intended to control infl ation, might have theeffect of attracting hot money into the economy. This may make the exchange rateystronger, or simply destabilise it. While a stronger currency might help to control AD(exports become less competitive and imports relatively cheaper) these effects are notguaranteed. Increasing interest rates are often seen as being damaging to the supply sideof the economy.

46 Edexcel GCE in Economics Getting Started© Edexcel Limited 2008Edexcel GCE in Economics
Unit 2: Managing the Economy Revision Sheets
Unit 2 Glossary
These are defi nitions which must be understood for Unit 2. Please note that these are acceptable
defi nitions, and teachers and textbooks may well teach more complete or more erudite versions
(please email your suggestions to [email protected]). Cross references within the glossary
are shown in bold italics.
Aggregate Demand — total spending on goods and services in an economy; components are
Consumption (C) + Investment (I) + t Government Spending (G)+(Exports (X)– Imports (M)).
Aggregate Supply — the total amount of output in an economy.
Balance of Payments — record of a country’s transactions with the rest of the world.
Base year — a year chosen as a good comparison in a series of data, when building an index.
Bottlenecks — a constraint on the supply side of the economy which causes costs of aggregate
supply to rise as the economy grows. An example is the effect of the Olympics in East London. The
use of fully-qualifi ed builders for the Olympics creates a shortage elsewhere, making costs more
generally rise in the region.
Business cycle — the tendency of economic activity to rise above and below the trend rate of
economic growth.
Budget — the annual statement by the Government of its intentions to tax and spend in future
years. It usually comes in March, just before the start of the new tax year in April. In recent years a
‘pre-budget report’ has been delivered in December so that the budget is more predictable.
Budget surplus — the amount by which tax revenue exceeds government spending.
Budget defi cit — the amount by which government spending exceeds tax revenue.
Claimant Count — a measure of those claiming unemployment benefi ts (not all those who are
eligible — many do not claim). For more information go to www.statistics.gov.uk
Circular fl ow of income — a simple model of the economy which shows the movement of goods
and services between households and fi rms, and their corresponding payments in money terms.
Constant prices — where the effects of infl ation have been taken out.
Consumer Price Index (CPI) — the measure of the average level of prices. Increases in the CPI
are known as infl ation, and this is used as a target for monetary policy since 2003. It excludes
housing costs. For information on how it is calculated go to www.statistics.gov.uk
Consumption — total planned household spending.
Cost of living — a measure of how much has to be spent to maintain living standards. It is usually
measured by comparing the prices of a selection of items known as the ‘basket of goods’, and
persistent increases in this cost is measured in an infl ation index.
Current account of the balance of payments — a record of a country’s trade of exports,
imports, investment income and current transfers with the rest of the world.
Current Prices — the effects of infl ation have been left in.
Decile — when data is presented in a serial order, a decile marks boundaries between 10% band
widths. Deciles are used for comparison between sets of data, and have the advantage that they are
not distortions on the extremes of a distribution.

Edexcel GCE in Economics Getting Started 47Edexcel GCE in Economics
Unit 2: Managing the Economy Revision Sheets
Demand-side policies — policies used by government to shift aggregate demand. The main policies
are monetary policy and fi scal policy.
Economic Growth — a measure of the increase in either real GDP or potential GDP.
Equilibrium National Income or Equilibrium Level of Output — the level of income or output at
which aggregate demand equals aggregate supply.
Employment rate — the percentage of those in the workforce (those able and willing to work) who
are in employment.
Exchange Rate — the price of one currency in terms of another.
Exports — the value of goods and services sold abroad. These are shown in the circular fl ow of
income as money coming into the country, that is, an injection.
Family Expenditure Survey — a survey collecting personal diaries of expenditure by families
and individuals in the UK. The data is collected using computer assisted interviewing and a paper
questionnaire. The response rate is around 63%.
Flow — a movement of goods and services OR the money used to pay for them, over a period of
time.
Fiscal defi cit — an infl ationary fi scal policy, where government spending is greater than tax
receipts.
Fiscal policy — the government’s manipulation of its spending and taxation in order to affect
aggregate demand.
Fiscal surplus — a defl ationary fi scal policy, where government spending is less than tax receipts.
Government expenditure — spending by central and local government.
Gross Domestic Product (GDP) — the total output in an economy, measured by total production
by fi rms OR total incomes by the factors of production OR by total spending. All three measurements
in theory are equal; they represent the circular fl ow at various points.
Hot Money — short term, speculative fl ows of money between countries. These may distort the
exchange rate so that they do not refl ect purchasing power parity. The motivation for these
movements is changes in relative interest rates or expected exchange rate changes.
Human Development Index (HDI) — a measure of economic development or quality of life,
composed of three equally weighted index numbers, comprising health, education and GDP per head
(adjusted for exchange rate differences and infl ation).
ILO (International Labour Organisation) measure of unemployment — a measure of
unemployment used in most rich countries, which surveys 51 000 households (covering 101 000
people) by phone and other surveys, asking whether people have been looking for work in the past
four weeks and are ready to start within the next two weeks.
Imports — the value of goods and services bought from abroad. These are shown in the circular
fl ow of income as money leaving the country, that is, a withdrawal income. The reward paid for
the use of a factor of production: rent, wages, interest or profi t.
Income gap or Income inequality — a measure of the gap between the incomes of various groups
within an economy often shown by plotting the average incomes of the between the lowest and
highest decile (see www.statistics.gov.uk). The wage difference between these two tends to widen in
periods of economic growth, and can be altered by changes to taxes and benefi ts.
48 Edexcel GCE in Economics Getting Started© Edexcel Limited 2008Edexcel GCE in Economics
Unit 2: Managing the Economy Revision Sheets
Index — a simple way to compare data with a base year.
Infl ation — a general and persistent increase in the price level — or, sustained increase in the cost
of living.
Infl ation Targeting — a narrowly focused monetary policy which seeks to keep the rate of infl ation
within a certain band, ignoring other monetary objectives.
Injections — where money fl ows into the circular fl ow, specifi cally investment, government
spending and exports.
Interest rate — the cost of borrowing money. The Monetary Policy Committee sets the rate
for very short-term loans to the commercial banks, at which they will borrow as a last resort —
sometimes called the ‘bank rate’ or ‘repo rate’, and it becomes the ‘base rate’ on which banks will set
their lending and borrowing rates.
Investment — an increase in the capital stock. It is determined by interest rates, confi dence and
the availability of credit.
Labour productivity — output per worker, or output per hour worked.
Monetary policy — decisions made using monetary instruments such as the interest rate.
Monetary Policy Committee — a group of nine economists and industrialists who meet at least once a
month to set the Bank of England’s main interest rate, which, since 1997 has been responsible for UK
monetary policy.
Multiplier — the number of times a rise in incomes exceeds the rise in injections that caused it. It
measures the knock on effects when an injection or withdrawal changes.
National income — the total earnings in the economy of individuals, fi rms and government,
including money earned from exports.
Net exports (X-M) — the difference between the money earned by exports less the money spent
on imports. It is a component of aggregate demand.
New Deal for the unemployed — measures introduced in 1997 which aims to link unemployment
benefi ts to attempts to get back into the job market.
Nominal values — where the effects of infl ation are still incorporated in the data.
Output gap — the difference between actual real GDP growth and the potential real GDP growth.
Per capita per head — GDP per head measures the average amount that each person contributes
to the economy including those who contribute nothing.
Phillips Curve — this is an empirical observation that there is a possible trade off between infl ation
and unemployment — that is that less of one means more of the other.
Productivity — output per unit of input. See labour productivity.
Productivity Gap — a measure of the difference between productivity levels in one country
compared to others.
Real values — where the effects of infl ation have been taken out.
Spare Capacity — a situation where there are unemployed resources in an economy.
Standard of living — a measure of welfare of people living in an economy.
Stock — a physical amount of goods or services that exist at a point in time, or the money that
might be used to pay for them.

Edexcel GCE in Economics Getting Started 49Edexcel GCE in Economics
Unit 2: Managing the Economy Revision Sheets
Supply-Side Policies — actions by government designed to promote market forces in order to
increase economic growth to its potential rate. These can be achieved by increasing price fl exibility,
increasing competition or improving incentives in the market.
Unemployment rate — the percentage of the workforce (that is, able and willing to work) that is
not currently employed.
Volume and Value — volumes measure quantities eg the number of goods sold on the export
market, and values measure the price times quantity eg the value of exported goods is £245bn (in
2006).
Wealth — a stock of assets, eg property, shares.
Withdrawals — where money fl ows out of the circular fl ow, specifi cally savings, taxation and
imports.

50 Edexcel GCE in Economics Getting Started© Edexcel Limited 2008Edexcel GCE in Economics
Unit 3: Business Economics and Economic Effi ciency Delivery Schedule
Business Economics and Economic Effi ciency — Course Outline for Unit 3
BASIC READING
Anderton A — Economics, 4th Edition (Causeway Press, 2006) ISBN 1902796926
Ellis B — Microeconomics Teacher Resource Pack (Hodder Arnold H and S, 2002) ISBN 0860032663
ER = Economics Review magazine (Philip Allan Updates, www.phillipallan.co.uk)
ET = Economics Today magazine (Anforme Ltd, www.anforme.co.uk)
Griffi ths A and Wall S — Applied Economics, 10th Edition (Financial Times/Prentice Hall, 2007) ISBN 0273708228
Nutter R and Cramp P — Industrial Economics (Anforme Ltd, 2002) ISBN 0907529690
Powell M, Matthews K and Parkin M — Economics, 3rd Edition (Financial Times/Prentice Hall, 2005) ISBN 0273681257
Sloman J — Economics, 5th Edition (Financial Times/Prentice Hall, 2002) ISBN 0273655744
Timing Content Reading/Activities Comments/notes
2 hours
1.5 hours(total todate 3.5hours)
1. The role of fi rms in a capitalistsociety:
− different types (by legal structure)
− different types (by size)
− a brief introduction to the motivesof fi rms(refer to costs, revenueand profi t).
2. How fi rms grow:
− internal expansion
− external growth, mergers, take-overs etc.
Anderton, Unit 51
Cramp, Section A, Units 1–3
Griffi ths and Wall, Chapter 4
Ellis, pages 71-77
Parkin et al, pages 203–205and page 208
Anderton, Unit 64
Griffi ths and Wall, Chapters 5and 7
Ellis, pages 52–57
To act as an introduction tothe unit. Link back to the micro concepts with which they are already familiar, particularly supply. Mention the potential drive to monopolisation as an example of market failure.
Review of concentration ratios

Edexcel GCE in Economics Getting Started 51Edexcel GCE in Economics
Unit 3: Business Economics and Economic Effi ciency Delivery Schedule
Timing Content Reading/Activities Comments/notes
4.5 hours
(total todate 8hours)
4. Costs, Revenue and Profi t:
a. Costs
− S-R, L-R
− average, marginal, total etc
− link to the law of DR
- link to supply curve
b. Revenue
− average, marginal, total etc
− link to the D curve
c. Profi t and profi t maximisation
d. Barriers to entry and exit.
Anderton, Units 46, 47, 48, 49
Cramp, Unit 4
Sloman, Chapter 5
Parkin et al, Chapter 10
ET Volume 10 No 1 ‘Economiesof Scale’ pages 23–27
ET Volume 10 No 2 ‘U- shapedCost Curves’ pages 27–29
ER ‘Total, marginal, average’November 2004
ER ‘Long run costs and output’September 2003
ER ‘Short-run costs’ September 2003
Anderton, Unit 52, Cramp Unit 5 Sloman Chapter 5.6
Anderton, Unit 17
It is important to establish theseas preconditions for studying the‘theory of the fi rm’.
2 hours
(total todate 10hours)
5. Alternative motives of fi rms:
− revenue maximisation
− sales
− behavioural theories
Anderton, Units 17, 18, 50
Cramp, Unit 12
Griffi ths and Wall, Chapter 3
2 hours
(total todate 12hours)
6. The goal of effi ciency
− productive
− allocative
Ellis, pages 79–87
ER ‘Competition and Productive effi ciency’ April2004
Use this to bring together much of the previous study of, eg costs and revenue.
52 Edexcel GCE in Economics Getting Started© Edexcel Limited 2008Edexcel GCE in Economics
Unit 3: Business Economics and Economic Effi ciency Delivery Schedule
Timing Content Reading/Activities Comments/notes
7 hours
(total todate 19hours)
7. Market structures:
− perfect competition
− monopoly
− comparisons and contrast with PC
− price discrimination
− oligopoly
− monopolistic competition
− monopsony
Anderton, Units 53-57
Cramp, Units 7-10
Sloman, Chapters 6 and 7
Parkin et al, Chapters 11, 12and 13
Ellis, pages 44–50
Griffi ths and Wall, Chapter 6and Ellis pages 18–22
ET Volume 11 No 3, ‘PerfectCompetition v Monopoly’ pages 2–4
ET Volume 12 No 3 ‘Monopoly’, pages 22–25
ER ‘The market for Oil’November 2004
ER ‘Cartel Problems’ November 2003
ER ‘Price Discrimination’ February 2003
ER ‘Games and Markets’September 2002
Much of the groundwork for this has already been done in topics 4,5 and 6.
Use comparisons between perfectcompetition and monopoly tohighlight effi ciency issues.
Use oligopoly to look at fi rms’ motivation.
Note: focus in Specifi cation on Game Theory and Prisoners’ Dilemma
2 hours
(total todate 21 hrs)
8. Pricing strategy and contestability Anderton, Unit 58
Cramp, Unit 11
Sloman, page 212-215
Griffi ths and Wall, Chapter 9
Ellis, pages 24–31 and 33–42
Ellis, pages 59–69
ET Volume 12 No 2 ‘Pricingstrategies’, pages 26–29
Make reference here to practical pricing strategies, eg cost-plus pricing etc, if not done so previously.

Edexcel GCE in Economics Getting Started 53Edexcel GCE in Economics
Unit 3: Business Economics and Economic Effi ciency Delivery Schedule
Timing Content Reading/Activities Comments/notes
1.5 hours
(total todate 22.5hours)
9. Competition policy
a) Institutions, legislation andunderlying principles
Anderton, Unit 63
Cramp, Unit 15
Ellis, pages 89–98
Sloman, pages 342–350
ER ‘A stronger UK Comp policy’February 2004
1.5 hours
(total todate 24hours)
10. Privatisation and the Regulationof Privatised Industries
Anderton, Unit 67
Cramp, Unit 14
Griffi ths and Wall, Chapter 8
Ellis, pages 100–107
Sloman, pages 351–363
Parkin et al, Chapter 19
ER ‘Rail privatisation revisited’February 2003
Stress the overlap betweencompetition policy and regulation.
54 Edexcel GCE in Economics Getting Started© Edexcel Limited 2008Edexcel GCE in Economics
Unit 3: Business Economics and Economic Effi ciency Revision Sheets
GCE Economics Unit 3 — Business Economics and Economic Effi ciency Revision Sheets
3.3.1 — Motives of a Firm
What motivates a fi rm?
Who are the main participants in a fi rm’s daily decision-making process?
a) Directors and Managers: Shareholders in a PLC will elect directors to look after their interests
in the company for them. Directors in turn appoint managers to manage and run the company.
The only way owners can infl uence decisions is through the AGM.
b) The workers: don’t have the power to run the company, but collectively may be able to
infl uence decisions. Trade Unions may exert infl uence over wages (and therefore costs), job
losses and health and safety.
c) The consumers: can infl uence the work of businesses through their demand patterns. If a fi rm
fails to provide goods that consumers demand they will eventually cease trading as in the case of
Rover Cars in 2005.
Short-run profi t maximisation
Shareholders will be motivated by maximising their profi ts from the company, in other words
— dividends. Thus it is assumed that the fi rm will want to maximise its profi ts. However not all fi rms
are able to operate at a profi t. Some will be faced with making a loss.
Long-run profi t maximisation
Keynesian economists believe that fi rms will seek to maximise their long run rather than their short-
run profi ts. This is based upon the belief that fi rms will use cost plus pricing. In other words, the
price of the product is worked out by calculating the average cost, when the fi rm is operating at full
capacity and adding a mark-up.
Short-run profi t maximisation suggests that fi rms adjust price and output in response to changes
in market conditions. However, most economists agree that rapid price changes may affect a fi rm’s
position in the market. Consumers dislike rapid price adjustments, and often view price cuts as signs
of desperation and distress.
This theory suggests that a fi rm might continue to operate in the short run even if it were making
a loss. The management would hope to be able to turn the business around and make profi ts in the
long run.

Edexcel GCE in Economics Getting Started 55Edexcel GCE in Economics
Unit 3: Business Economics and Economic Effi ciency Revision Sheets
Managerial theories
Some managers would seek to maximise sales rather than profi ts. It is often the case that increased
sales go hand in hand with increased salaries for top executives.
Other managers are said to be motivated by factors, such as high salaries, the number of people
under their control, the power they can yield over investment decisions and the availability of
fringe benefi ts. This idea originates from the concept that managers in large fi rms will have enough
discretion to pursue policies giving them personally most satisfaction.
However, profi t remains a shareholder’s best measure of success. Managers and directors are
prone to shareholder revolts, and may even get voted out of offi ce. Managers will therefore profi t
satisfi ce, in other words, satisfy the demands of shareholders. Once those demands have been met,
managers would be free to maximise their own rewards from the company.

56 Edexcel GCE in Economics Getting Started© Edexcel Limited 2008Edexcel GCE in Economics
Unit 3: Business Economics and Economic Effi ciency Revision Sheets
3.3.7 — Introduction to market structures
Market structure
Market structures are based on the characteristics of a market. Economists identify a number of
characteristics which determine the market structure a fi rm is said to operate in:
• the size and number of fi rms in the market
• the ease or diffi cultyr with which these new fi rms might enter the market (barriers to entry and
exit)
• the extent to which goods in the market are similar (homogeneity)
• the extent of knowledge f shared by fi rms in the market
• the extent to which the actions of one fi rm will affect another fi rm (interdependence).
The number of fi rms in an industry
The number of fi rms in an industry may vary from one to many. For example, Thames Water is the
sole supplier of water in the London area, ie a monopoly. In agriculture, on the other hand, there are
tens of thousands of farms supplying eggs to the market.
1. Monopoly is said to exist where there is only one supplier in the market.y
2. Oligopoly is said to exist in a market dominated by a few large producers alongside a largey
number of small and relatively unimportant fi rms.
3. Perfect Competition or Monopolistic Competition. In this market structure there are a large
number of small fi rms, none of which are large enough to infl uence price.
Barriers to entry
Market structures are also affected by the ease with which new entrants can access the market.
Firms that are in an industry, which is unlikely to experience many new entrants, may behave
differently to those operating in an industry which has low barriers to entry.
Product homogeneity and branding
In some industries, such as gas and oil extraction and agriculture, the product is essentially the same
whoever produces it. These identical goods are known as homogenous goods. This means that no
producer has a monopoly over production.
Firms fi nd it much easier to maximise profi ts if they are able to differentiate their product by creating
brand loyalty and reducing the elasticity of demand for the good. This also creates barriers to entry
reducing the competitiveness of the market.
Edexcel GCE in Economics Getting Started 57Edexcel GCE in Economics
Unit 3: Business Economics and Economic Effi ciency Revision Sheets
Knowledge
Buyers and sellers are said to have perfect knowledge if they are fully informed about price and
output. Therefore, if one producer puts its prices up, then that producer will lose all its customers
because they will buy the good from elsewhere in the industry.
Perfect knowledge does not mean that all fi rms or consumers possess all the knowledge, but instead
that this information is freely available; it is up to fi rms and consumers to access this.
Imperfect knowledge exists where there are patents protecting a particular process, such as the
recipe for Coca Cola. Individual fi rms may not be aware of all the new innovations to be introduced.
A lack of information acts as a barrier to entry, preventing or discouraging new fi rms from entering
the market.
Interrelationships within markets
Firms may be independent of each other, in other words the actions of one fi rm will have no
signifi cant impact on any other fi rm in the industry.
If fi rms are interdependent then the actions of one fi rm will have an impact on others. For example,
when one fi rm advertises it is hoping to take consumers away from their current purchases. This will
necessarily have an impact on other producer’s level of demand.
58 Edexcel GCE in Economics Getting Started© Edexcel Limited 2008Edexcel GCE in Economics
Unit 3: Business Economics and Economic Effi ciency Revision Sheets
3.3.9 — Perfect competition
The model of perfect competition describes a market where there is a high degree of competition.
Assumptions
A perfectly competitive market must possess four characteristics.
1. There must be many buyers and sellers in the market, none of whom is large enough to
infl uence price. Buyers and sellers are said to be price takers.
2. There is freedom of entry and exit to the industry. Firms must be able to establish themselves
in the industry quickly.
3. Buyers and sellers possess perfect knowledge of prices. Thus if one producer charges higher
prices than its competitors for a good, consumers will buy from elsewhere in the market and
demand will fall to zero.
4. Firms produce a homogenous product. There is no branding of products.
There are only a few industries in the world which approximate to this model. However the foreign
exchange market is a close approximation. There are a large number of foreign exchange dealers
supplying the market, none of whom is large enough to infl uence the exchange rate. It is relatively
easy to establish a bureau-de-change and thus enter the industry, and equally easy to leave. A
foreign exchange dealer will know the market determined exchange rate. Currencies are homogenous
— US dollars are indistinguishable from other US dollars sold by another bureau-de-change.
Demand and revenue
The model of perfect competition assumes that there are a large number of suppliers in the market.
A fi rm in perfect competition can expand output or reduce output without infl uencing price. In
other words a bureau de change cannot put up the exchange rate for US dollars and expect to sell
anything. It may decide to lower the exchange rate, but there is no gain by doing this, as the foreign
exchange dealer may sell all his output at the original higher price.

Edexcel GCE in Economics Getting Started 59Edexcel GCE in Economics
Unit 3: Business Economics and Economic Effi ciency Revision Sheets
As can be seen in Figure 1, the demand curve for the foreign exchange dealer is horizontal, in other
words perfectly elastic.
Figure 1: The perfectly competitive fi rm’s demand curve
The horizontal demand curve as depicted in Figure 1, is also the fi rm’s average and marginal revenue
curves. If a fi rm sells all its output at the market price, then this price must be the average price or
revenue. In addition if a fi rm sells an extra ie marginal unit, it will receive the same price for each
additional unit as it did for each preceding unit sold, and therefore marginal revenue will be the same
as average revenue.
Total Revenue = Price x Quantity therefore
Average Revenue = Total Revenue or Price x Quantity
Quantity Quantity
if the quantity cancel each other Price x QuantityQuantityQuantity AR = Price
QuantityQuantityQuantity
Cost and supply curves
In the perfectly competitive market, the supply curve of the fi rm is the marginal cost curve above the
average variable cost in the short run and the average total cost in the long run.
The marginal cost of production ie the change in total cost resulting from the sale of one more unit,
represents the lowest price a fi rm would be prepared to supply an extra unit of output for.
If the price of a good was £8, and the marginal cost £5, then the fi rm would produce the good and
gain £3 super normal profi t. If the price was £5 and marginal cost £5, then the fi rm would still
produce the product, as the revenue gained will contain an element of normal profi t. If the price fell
to £4, and marginal cost remained at £5, then the fi rm would make a loss of £1 per unit. The fi rm
would not supply the good in this case.
In the short run a fi rm will not necessarily shut down if it is making a loss. It will remain open as long
as it covers the average variable cost. The fi rm will only stop supplying if average revenue or price is
less than average variable cost.

60 Edexcel GCE in Economics Getting Started© Edexcel Limited 2008Edexcel GCE in Economics
Unit 3: Business Economics and Economic Effi ciency Revision Sheets
3.3.9 — Perfect competition equilibrium
Short-run equilibrium
In perfect competition fi rms are assumed to be profi t maximisers. Firms will therefore produce where
marginal cost is equal to marginal revenue (MC=MR). The price the fi rm charges is determined by
the market because the individual fi rm is too small to infl uence price and is therefore a price-taker.
Perfectly competitive fi rms can make super-normal profi ts in the short-run as shown in Figure 1. In
this diagram the horizontal average revenue curve is shown to be above the average total cost at
the point where MC=MR (point A). At Q1 the fi rm charges P1, but faces only average costs of P2,
therefore it makes super-normal profi t as indicated by the shaded area (P1, P2, A, B).
Figure 1: Short-run profi t maximisation
In Figure 2 the fi rm is making a loss at its equilibrium, profi t maximising or loss minimising output,
where MC=MR. The price charged per unit of output P2 is lower than average total cost, P1 and
hence the fi rm makes a loss of P1P2CD.
Figure 2: Short-run fi rm making losses
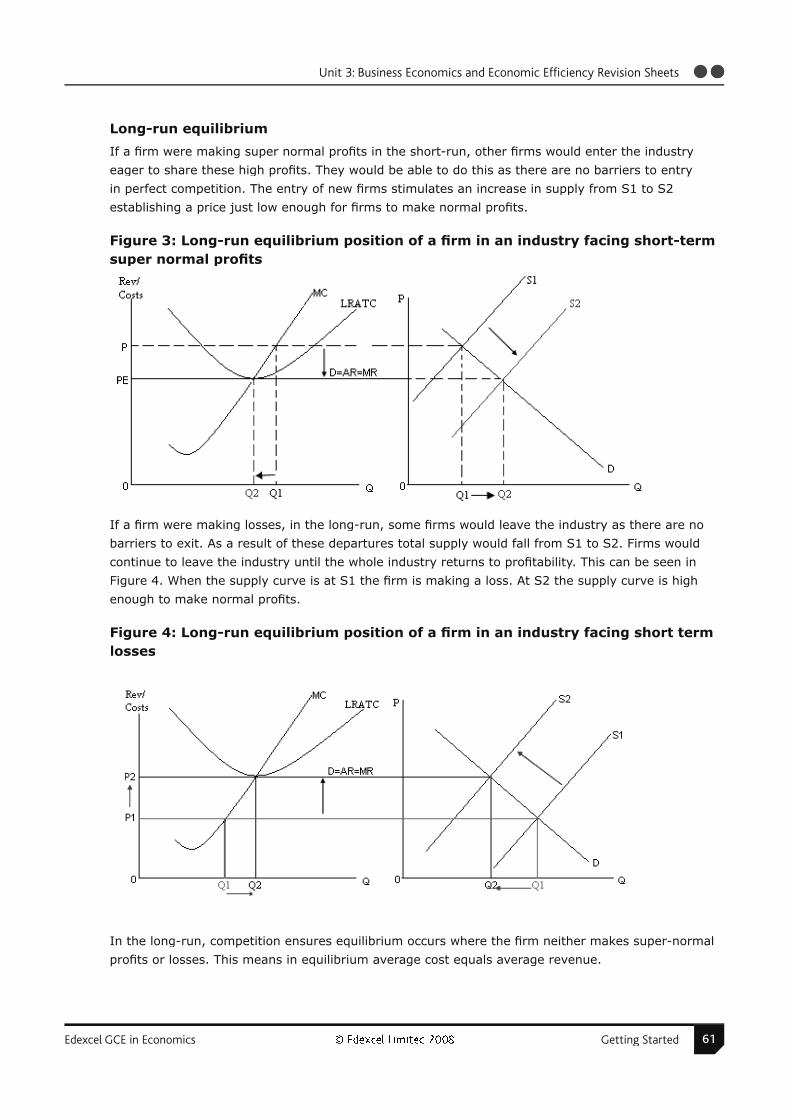
Edexcel GCE in Economics Getting Started 61Edexcel GCE in Economics
Unit 3: Business Economics and Economic Effi ciency Revision Sheets
Long-run equilibrium
If a fi rm were making super normal profi ts in the short-run, other fi rms would enter the industry
eager to share these high profi ts. They would be able to do this as there are no barriers to entry
in perfect competition. The entry of new fi rms stimulates an increase in supply from S1 to S2
establishing a price just low enough for fi rms to make normal profi ts.
Figure 3: Long-run equilibrium position of a fi rm in an industry facing short-term super normal profi ts
If a fi rm were making losses, in the long-run, some fi rms would leave the industry as there are no
barriers to exit. As a result of these departures total supply would fall from S1 to S2. Firms would
continue to leave the industry until the whole industry returns to profi tability. This can be seen in
Figure 4. When the supply curve is at S1 the fi rm is making a loss. At S2 the supply curve is high
enough to make normal profi ts.
Figure 4: Long-run equilibrium position of a fi rm in an industry facing short termlosses
In the long-run, competition ensures equilibrium occurs where the fi rm neither makes super-normal
profi ts or losses. This means in equilibrium average cost equals average revenue.
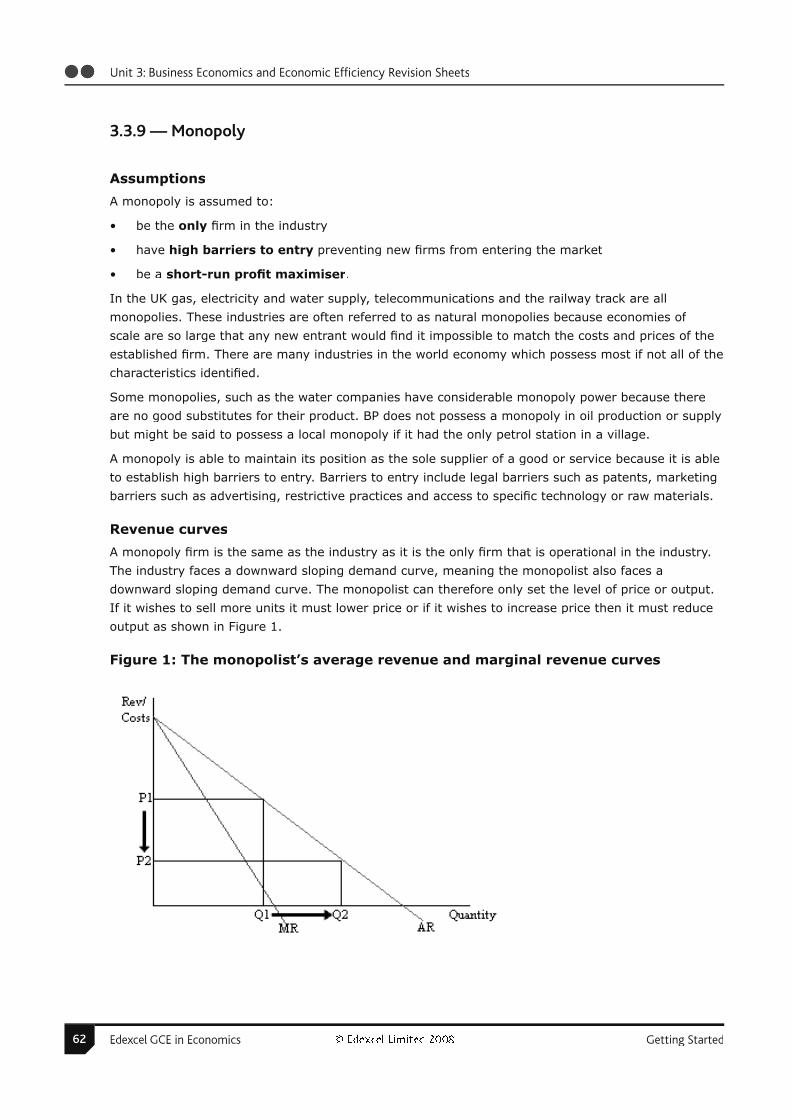
62 Edexcel GCE in Economics Getting Started© Edexcel Limited 2008Edexcel GCE in Economics
Unit 3: Business Economics and Economic Effi ciency Revision Sheets
3.3.9 — Monopoly
Assumptions
A monopoly is assumed to:
• be the only fi rm in the industry
• have high barriers to entry preventing new fi rms from entering the market
• be a short-run profi t maximiser.
In the UK gas, electricity and water supply, telecommunications and the railway track are all
monopolies. These industries are often referred to as natural monopolies because economies of
scale are so large that any new entrant would fi nd it impossible to match the costs and prices of the
established fi rm. There are many industries in the world economy which possess most if not all of the
characteristics identifi ed.
Some monopolies, such as the water companies have considerable monopoly power because there
are no good substitutes for their product. BP does not possess a monopoly in oil production or supply
but might be said to possess a local monopoly if it had the only petrol station in a village.
A monopoly is able to maintain its position as the sole supplier of a good or service because it is able
to establish high barriers to entry. Barriers to entry include legal barriers such as patents, marketing
barriers such as advertising, restrictive practices and access to specifi c technology or raw materials.
Revenue curves
A monopoly fi rm is the same as the industry as it is the only fi rm that is operational in the industry.
The industry faces a downward sloping demand curve, meaning the monopolist also faces a
downward sloping demand curve. The monopolist can therefore only set the level of price or output.
If it wishes to sell more units it must lower price or if it wishes to increase price then it must reduce
output as shown in Figure 1.
Figure 1: The monopolist’s average revenue and marginal revenue curves
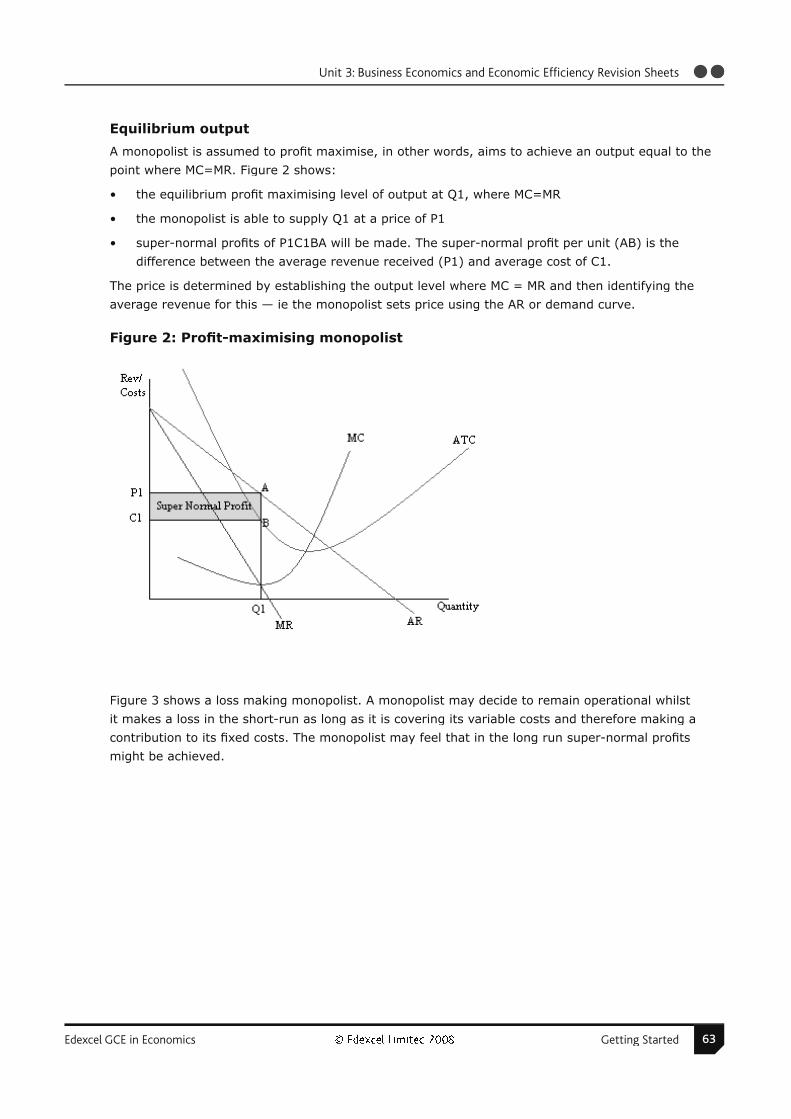
Edexcel GCE in Economics Getting Started 63Edexcel GCE in Economics
Unit 3: Business Economics and Economic Effi ciency Revision Sheets
Equilibrium output
A monopolist is assumed to profi t maximise, in other words, aims to achieve an output equal to the
point where MC=MR. Figure 2 shows:
• the equilibrium profi t maximising level of output at Q1, where MC=MR
• the monopolist is able to supply Q1 at a price of P1
• super-normal profi ts of P1C1BA will be made. The super-normal profi t per unit (AB) is the
difference between the average revenue received (P1) and average cost of C1.
The price is determined by establishing the output level where MC = MR and then identifying the
average revenue for this — ie the monopolist sets price using the AR or demand curve.
Figure 2: Profi t-maximising monopolist
Figure 3 shows a loss making monopolist. A monopolist may decide to remain operational whilst
it makes a loss in the short-run as long as it is covering its variable costs and therefore making a
contribution to its fi xed costs. The monopolist may feel that in the long run super-normal profi ts
might be achieved.
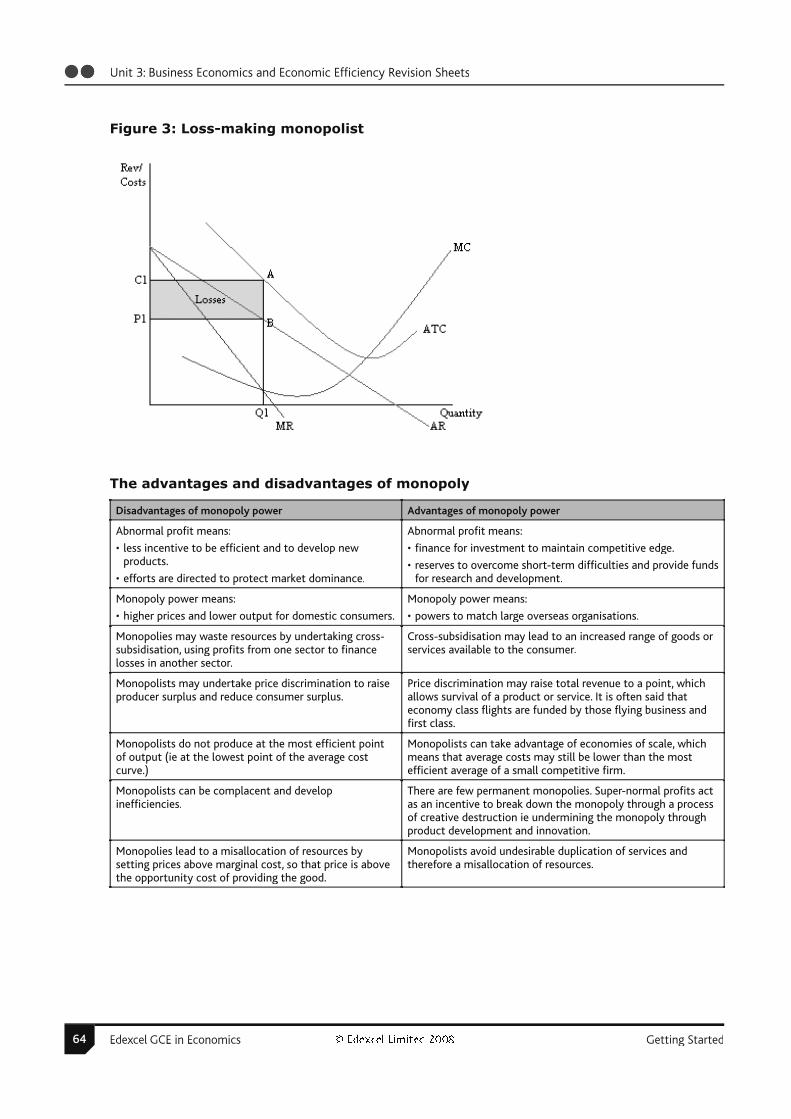
64 Edexcel GCE in Economics Getting Started© Edexcel Limited 2008Edexcel GCE in Economics
Unit 3: Business Economics and Economic Effi ciency Revision Sheets
Figure 3: Loss-making monopolist
The advantages and disadvantages of monopoly
Disadvantages of monopoly power Advantages of monopoly power
Abnormal profi t means:
• less incentive to be effi cient and to develop newproducts.
• efforts are directed to protect market dominance.
Abnormal profi t means:
• fi nance for investment to maintain competitive edge.
• reserves to overcome short-term diffi culties and provide fundsfor research and development.
Monopoly power means:
• higher prices and lower output for domestic consumers.
Monopoly power means:
• powers to match large overseas organisations.
Monopolies may waste resources by undertaking cross-subsidisation, using profi ts from one sector to fi nancelosses in another sector.
Cross-subsidisation may lead to an increased range of goods or services available to the consumer.
Monopolists may undertake price discrimination to raiseproducer surplus and reduce consumer surplus.
Price discrimination may raise total revenue to a point, whichallows survival of a product or service. It is often said thateconomy class fl ights are funded by those fl ying business andfi rst class.
Monopolists do not produce at the most effi cient pointof output (ie at the lowest point of the average costcurve.)
Monopolists can take advantage of economies of scale, whichmeans that average costs may still be lower than the mosteffi cient average of a small competitive fi rm.
Monopolists can be complacent and developineffi ciencies.
There are few permanent monopolies. Super-normal profi ts actas an incentive to break down the monopoly through a processof creative destruction ie undermining the monopoly throughproduct development and innovation.
Monopolies lead to a misallocation of resources bysetting prices above marginal cost, so that price is abovethe opportunity cost of providing the good.
Monopolists avoid undesirable duplication of services andtherefore a misallocation of resources.

Edexcel GCE in Economics Getting Started 65Edexcel GCE in Economics
Unit 3: Business Economics and Economic Effi ciency Revision Sheets
3.3.9 — Oligopoly and game theory
Oligopoly
Firms operating in oligopoly industries tend to keep prices stable. They know that the actions of one
fi rm will impact on the other fi rms in the industry, in other words they are interdependent. If one
fi rm were to raise its prices then others would not follow and because the goods traded are similar,
customers will move to the lower cost option. If a fi rm were to lower prices then other fi rms would
follow suit and a price war would result, with no real gain for any of the fi rms in the industry.
Instead, oligopoly fi rms will tend to work together through collusive agreements, whether they
are tacit or overt or engage in non-price competition. Non-price competition can take the form of
advertising, issuing of loyalty cards, branding, packaging and other measures to reduce the closeness
of substitutes.
Game theory
Game Theory can be used by economists to predict how fi rms will react in a number of given
scenarios. It is used mainly when dealing with oligopoly to explain why fi rms may collude and
furthermore why they may later decide to abandon any agreement to collude. The prisoner’s
dilemma can explain the way that game theory can be used by fi rms.
Prisoner’s dilemma
Assumptions
• The model assumes a zero sum game — there will be a winner and loser.
• The prisoners have been kept separate and so do not know what each is doing, but they do know
the outcome of each action.
Rixy
Not Confess Confess
Franky
Not Confess A
Each get 1 year
C
Franky gets 10 years
Rixy gets 3 months
Confess B
Franky gets 3 months
Rixy gets 10 yrs
D
Each gets 3 years
What should they do?
Confess — If one of them was to confess then they should get a 3 month prison sentence, but as
they cannot trust each other, and cannot be sure that the other party has not also confessed (which
would result in a 10 year sentence for the prisoner who did not confess), they will act selfi shly
therefore both confessing to get the best solution for themselves. Thus they will tend to D, where
both confess.
Not Confess — if they could trust each other and be sure of each other’s response this would be the
best option. By not confessing both prisoners would get one year each — ie option A.

66 Edexcel GCE in Economics Getting Started© Edexcel Limited 2008Edexcel GCE in Economics
Unit 3: Business Economics and Economic Effi ciency Revision Sheets
Maximax — maximising the maximum benefi t for the individual, ie B and C which would mean that
Rixy should confess and would get 3 months, but only if Franky could be trusted not to confess,
otherwise both will get 3 years.
Maximin — minimum benefi t, ie D, which is where the prisoners will tend to because they cannot
trust each other.
Game theory suggests that fi rms don’t trust each other and although they know that it is mutually
benefi cial for them to collude to set the price at £2, they will tend to an option where they will both
set price at £1.80 as neither fi rm can be trusted to keep to any agreement.
Dominant strategy — in this case the same policy is suggested by different strategies. This is a
dominant strategy game because both strategies encourage a cut in price, ie Maximax (where each
fi rm in isolation would set the price at £1.80 hoping that the other fi rm has gone for £2) and Maximin
(where both fi rms will eventually end up at because they have set price at £1.80).
Firm X
£2 £1.80
Firm Y
£2 A
Each get £10m
C
Firm Y £5m
Firm X £12m
£1.80 B
Firm Y £12m
Firm X £5m
D
Each gets £8m
A Collude
B Firm X
Maximax
C Firm Y
D Nash Equilibrium ie Maximin
Both strategies suggest a Nash Equilibrium.
Nash Equilibrium — is the position resulting from everyone making their optimal decision, ie setting
price at £1.80, by attempting, independently, to choose the best strategy for whatever the other is
likely to do, ending up in a worse position than if they had colluded to set price at £2.

Edexcel GCE in Economics Getting Started 67Edexcel GCE in Economics
Unit 3: Business Economics and Economic Effi ciency Revision Sheets
3.3.9 — Monopolistic competition
Imperfect competition
Perfect competition assumes that there are many small fi rms and all goods are homogenous, and in
monopoly it is assumed there is only one supplier. However in reality neither of these conditions is
exactly met and therefore often industries fall in between these two extremes.
In most industries some competition exists because there are at least two fi rms, but competition is
imperfect because fi rms sell products which are not homogenous.
Assumptions
The assumptions made for monopolistic competition are almost the same as perfect competition
minus one important assumption. Goods don’t have to be homogenous. The assumptions made are:
1. There are a large number of small fi rms
2. There are low barriers to entry or exit.
3. Firms produce similar but differentiated products.
What is meant here is that the products are similar but differentiated in terms of packaging, colour,
design, specifi cation, marketing or price from rival products.
The downward sloping demand curve
Firms producing a product which is slightly different from their rivals will have a certain amount of
market power. They will, for instance, be able to raise price without losing all of their customers
to those fi rms who have maintained stable prices. Therefore the fi rm’s demand curve is downward
sloping.
It is not a price-taker like a fi rm operating in a perfectly competitive environment. Yet because there
are a large number of fi rms producing close substitutes, its market power is likely to be relatively
weak.
If one examines the case of Chinese restaurants operating in Chinatown in London, because the
consumer has a great deal of choice the prices which are set by the individual restaurants will
be similar. If one restaurant were to drastically raise prices then it is likely they would lose many
customers unless they were able to brand their product in such a way as to differentiate it from the
rivals.

68 Edexcel GCE in Economics Getting Started© Edexcel Limited 2008Edexcel GCE in Economics
Unit 3: Business Economics and Economic Effi ciency Revision Sheets
Figure 1: The monopolistically competitive fi rm in long-run equilibrium
Long-run equilibrium
The fi rm will produce where MC=MR so as to profi t maximise. In Figure 1, this means that it will
produce at an output level of Q1. It will charge a price based on its demand or average revenue
curve, in this case P1.
In the long-run the fi rm will not be able to obtain super-normal profi ts, because new fi rms will enter
the industry if they see profi ts to be made exploiting the lack of barriers to entry. The entry of new
fi rms will increase supply, shifting the average revenue curve downwards to the point where average
revenue is just equal to average cost, as in Figure 1.
If the fi rm were making a loss, fi rms would leave the industry, reducing supply and shifting the AR
curve upwards again to a point where average revenue is equal to average cost.
Therefore in the long-run a monopolistically competitive fi rm can make neither super-normal profi ts
nor losses.

Edexcel GCE in Economics Getting Started 69Edexcel GCE in Economics
Unit 3: Business Economics and Economic Effi ciency Revision Sheets
3.3.9 — Comparing the monopolist and perfect competition
If we assume that the perfectly competitive fi rm and the monopolist share the same cost curves
(average cost and marginal cost) we can compare the output and effi ciency levels of the two fi rms.
• The monopolist makes super-normal profi t equal to the area PmCmba, by operating at the profi t
maximising point.
• The monopolist is not productively effi cient as the profi t maximising level of output (Qm) does
not maximise economies of scale, which occur at the minimum point of the AC curve ie the point
C.
• The monopolist is not allocatively effi cient because P (AR) is not equal to MC (necessary
condition for allocative effi ciency). Note: AR is greater than MC at an output of Qm.
• Perfectly competitive fi rms operate where AC=AR and where MC=MR. This occurs on the AR
curve marked for the perfectly competitive fi rm, (AR=MR=D for PC). At the point C the fi rm is
profi t maximising.
• A perfectly competitive fi rm is also allocatively effi cient because P=MC.
• A perfectly competitive fi rm is also productively effi cient, operating at the lowest point of its
average cost curve.
• Consumer surplus is reduced by the monopolist. A perfectly competitive fi rm will have consumer
surplus equal to Ppcfc whilst the monopolist by raising price is able to reduce consumer surplus
to Pmfa.
• Under perfect competition output is greater at Qpc and price is lower at Ppc than if the fi rm were
to operate as a monopoly (Qm & Pm), allowing them to make normal profi ts.
• Deadweight welfare loss from the fi rm operating as a monopolist is equal to ade.
70 Edexcel GCE in Economics Getting Started© Edexcel Limited 2008Edexcel GCE in Economics
Unit 3: Business Economics and Economic Effi ciency Revision Sheets
3.3.11 — Government intervention to promote competition
Offi ce of Fair Trading and the Competition Commission
The Competition Commission replaced the Monopolies and Mergers Commission on 1 April 1999.
The Commission conducts in-depth inquiries into mergers, markets and the regulation of the major
regulated industries such as water, electricity and gas. Every inquiry is undertaken in response to a
request made by the Offi ce of Fair Trading (OFT).
Mergers
The Enterprise Act 2002 introduced new regulations for assessing whether a merger should be
allowed to proceed. In allowing most mergers the Commission must determine whether the merger
will impact adversely on competition, in other words if it ‘prevents, restricts or distorts competition’
then the merger is likely to be blocked.
Cartels
The Enterprise Act identifi es certain situations which would result in prosecutions for unlawful
behaviour if the actions of at least two fi rms (A and B).
• directly or indirectly fi x a price for the supply in the United Kingdom of a product or service by
fi rms A and B
• limit or prevent supply in the United Kingdom of a product or service by both fi rms A and B
• limit or prevent production in the United Kingdom of a product or service by both fi rms A and B
• divide between fi rms A and B the supply in the United Kingdom of a product or service to a
customer or customers
• divide between fi rms A and B customers for the supply in the United Kingdom of a product or
service
• fi x the terms of a bid in such a way that prevents the normal operation of the bidding process.
The punishment for the operation of a cartel can include imprisonment for up to a maximum of fi ve
years and/or a fi ne.
Europe and USA
In the European Union the European Competition Commission investigates anti-competitive
behaviour issuing fi nes where appropriate.
Recent fi nes issued by the European Competition Commission include:
• April 2007 Dutch brewers: Heineken €219m, Grolsch €31.7m and Bavaria €22.9m for sharing
prices
• February 2007 European escalator and lift manufacturers: Kone €142m, Otis €225m, Schindler
€144m and Thyssen Krupp €480m for price fi xing
• January 2007 manufacturers of gas insulators operating in the EU: Hitachi €52m, Toshiba €91m,
Mitsubishi €119m, and Siemens €419m.

Edexcel GCE in Economics Getting Started 71Edexcel GCE in Economics
Unit 3: Business Economics and Economic Effi ciency Revision Sheets
In the United States of America the Antitrust Commission seeks to promote competition in market
places. Individuals who undertake anti-competitive behaviour in the United States can be fi ned up
to $1m and jailed for a maximum of 10 years. In addition, fi rms may be fi ned up to $100 m for each
violation.
In 1999, over $850 million in fi nes was imposed on members of the vitamins cartel, including a
record $500 million fi ne imposed on Hoffmann-La Roche and a $225 million fi ne imposed on BASF
AG. This was in addition to a number of top executives being sentenced to terms in jail.
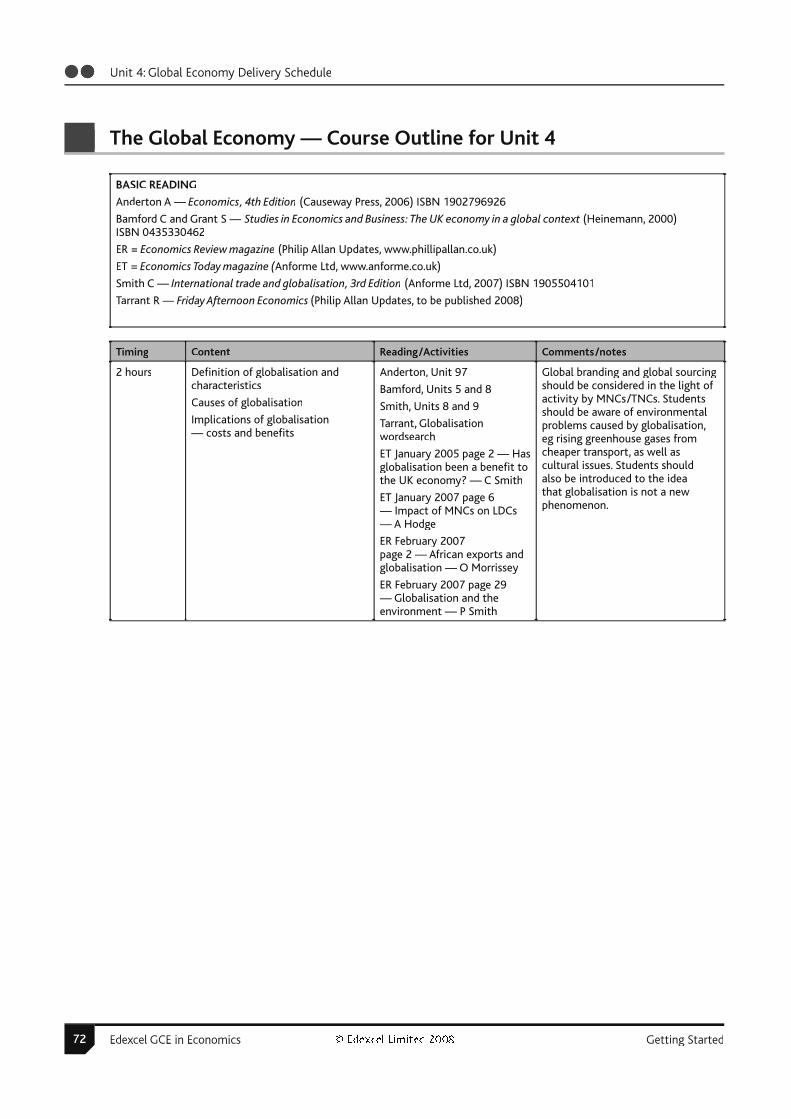
72 Edexcel GCE in Economics Getting Started© Edexcel Limited 2008Edexcel GCE in Economics
Unit 4: Global Economy Delivery Schedule
The Global Economy — Course Outline for Unit 4
BASIC READING
Anderton A — Economics, 4th Edition (Causeway Press, 2006) ISBN 1902796926
Bamford C and Grant S — Studies in Economics and Business: The UK economy in a global context (Heinemann, 2000) tISBN 0435330462
ER = Economics Review magazine (Philip Allan Updates, www.phillipallan.co.uk)
ET = Economics Today magazine (Anforme Ltd, www.anforme.co.uk)((
Smith C — International trade and globalisation, 3rd Edition (Anforme Ltd, 2007) ISBN 1905504101
Tarrant R — Friday Afternoon Economics (Philip Allan Updates, to be published 2008)
Timing Content Reading/Activities Comments/notes
2 hours Defi nition of globalisation andcharacteristics
Causes of globalisation
Implications of globalisation— costs and benefi ts
Anderton, Unit 97
Bamford, Units 5 and 8
Smith, Units 8 and 9
Tarrant, Globalisation wordsearch
ET January 2005 page 2 — Hasglobalisation been a benefi t tothe UK economy? — C Smith
ET January 2007 page 6— Impact of MNCs on LDCs — A Hodge
ER February 2007 page 2 — African exports andglobalisation — O Morrissey
ER February 2007 page 29— Globalisation and the environment — P Smith
Global branding and global sourcing should be considered in the light of activity by MNCs/TNCs. Students should be aware of environmental problems caused by globalisation,eg rising greenhouse gases from cheaper transport, as well as cultural issues. Students should also be introduced to the ideathat globalisation is not a new phenomenon.

Edexcel GCE in Economics Getting Started 73Edexcel GCE in Economics
Unit 4: Global Economy Delivery Schedule
Timing Content Reading/Activities Comments/notes
4 hours
(6 hours todate)
Patterns of trade, including betweendeveloped and developing nations
Law of comparative advantage:
– results
– evaluation
Costs and benefi ts of trade
Nature of trading blocs and role of WTO
Anderton, Units 14, 40, 98
Bamford, Unit 4
Smith, Units 1 and 2
ET March 2006 page 12— Effect of China on trade — C Smith
Students should be encouraged to look at how patterns of trade have changed, particularly with reference to the growing importance of trading blocs. They should know the characteristics of the various types of trading bloc (eg Free Trade Areas, Customs Unions), and understand the idea of trade creation andtrade diversion (which links to the confl ict between blocs andthe WTO). PPFs should be used toillustrate comparative and absolute advantage.
3 hours
(9 hours todate)
Reasons for protectionism
Understanding of tariffs, quotas,subsidies to domestic producers andother non-tariff barriers
Tariff and quota diagrams
Evaluation of tariffs, quotas,subsidies, and protectionism ingeneral
Anderton, Units 40, 103
Smith, Units 10 and 11
Tarrant, Free trade and protectionism matching
ER September 2006 page 2— US protectionism and China— J Whittock
ET March 2007 page 6— Implications of the rise inprotectionism — B Reeves
Arguments for protectionism should include infant industries and employment protection. Students should be aware of current examples of protectionist measures, and consequent retaliation. Deadweight welfare loss trianglesshould be used on tariff/quota diagrams as part of their evaluation. Able students could be introducedto the ideas of David Ricardo regarding the benefi ts of free trade versus protectionism.

74 Edexcel GCE in Economics Getting Started© Edexcel Limited 2008Edexcel GCE in Economics
Unit 4: Global Economy Delivery Schedule
Timing Content Reading/Activities Comments/notes
2.5 hours
(11.5 hoursto date)
Components of the Balance of Payments Account
Causes and effects of imbalances onthe current account
Evaluation of measures to correctimbalances on the current account
Anderton, Units 30, 94, 96
Smith, Unit 3
Tarrant, Balance of paymentsmissing words
Students should understand thecomponents within the current account, and should be aware of which components record defi cits or surpluses on the UK’s Balanceof Payments. Students should consider the size of defi cits or surpluses on the current account in a global context, and examine the implications of large imbalances between countries. Measures to correct imbalances on the current account include expenditure-reducing, expenditure switching and supply-side policies; each of these should be evaluated and students should be encouraged to reach their own conclusions as to the most appropriate measure. Students should consider the option of doing nothing, in light of theory on fl oating exchange rates.
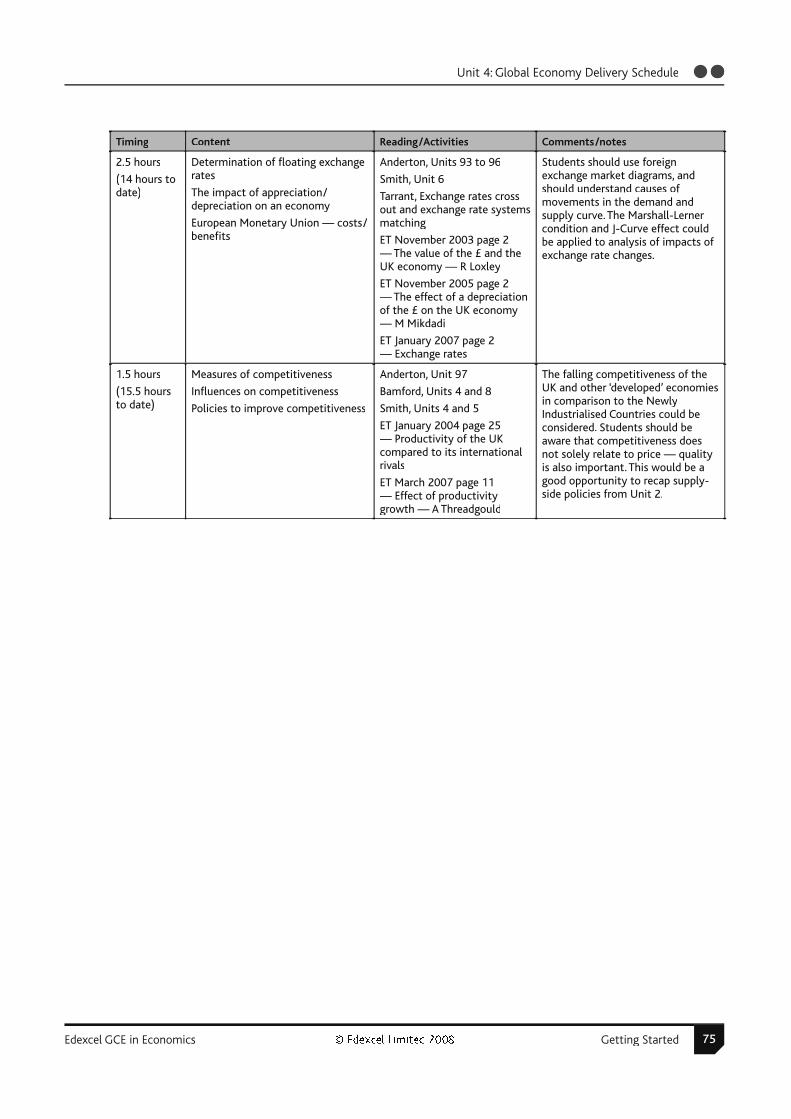
Edexcel GCE in Economics Getting Started 75Edexcel GCE in Economics
Unit 4: Global Economy Delivery Schedule
Timing Content Reading/Activities Comments/notes
2.5 hours
(14 hours todate)
Determination of fl oating exchangerates
The impact of appreciation/depreciation on an economy
European Monetary Union — costs/benefi ts
Anderton, Units 93 to 96
Smith, Unit 6
Tarrant, Exchange rates crossout and exchange rate systemsmatching
ET November 2003 page 2— The value of the £ and theUK economy — R Loxley
ET November 2005 page 2— The effect of a depreciationof the £ on the UK economy— M Mikdadi
ET January 2007 page 2— Exchange rates
Students should use foreign exchange market diagrams, and should understand causes of movements in the demand and supply curve. The Marshall-Lerner condition and J-Curve effect could be applied to analysis of impacts of exchange rate changes.
1.5 hours
(15.5 hoursto date)
Measures of competitiveness
Infl uences on competitiveness
Policies to improve competitiveness
Anderton, Unit 97
Bamford, Units 4 and 8
Smith, Units 4 and 5
ET January 2004 page 25— Productivity of the UKcompared to its internationalrivals
ET March 2007 page 11— Effect of productivity growth — A Threadgould
The falling competitiveness of the UK and other ‘developed’ economiesin comparison to the NewlyIndustrialised Countries could be considered. Students should beaware that competitiveness doesnot solely relate to price — quality is also important. This would be a good opportunity to recap supply-side policies from Unit 2.
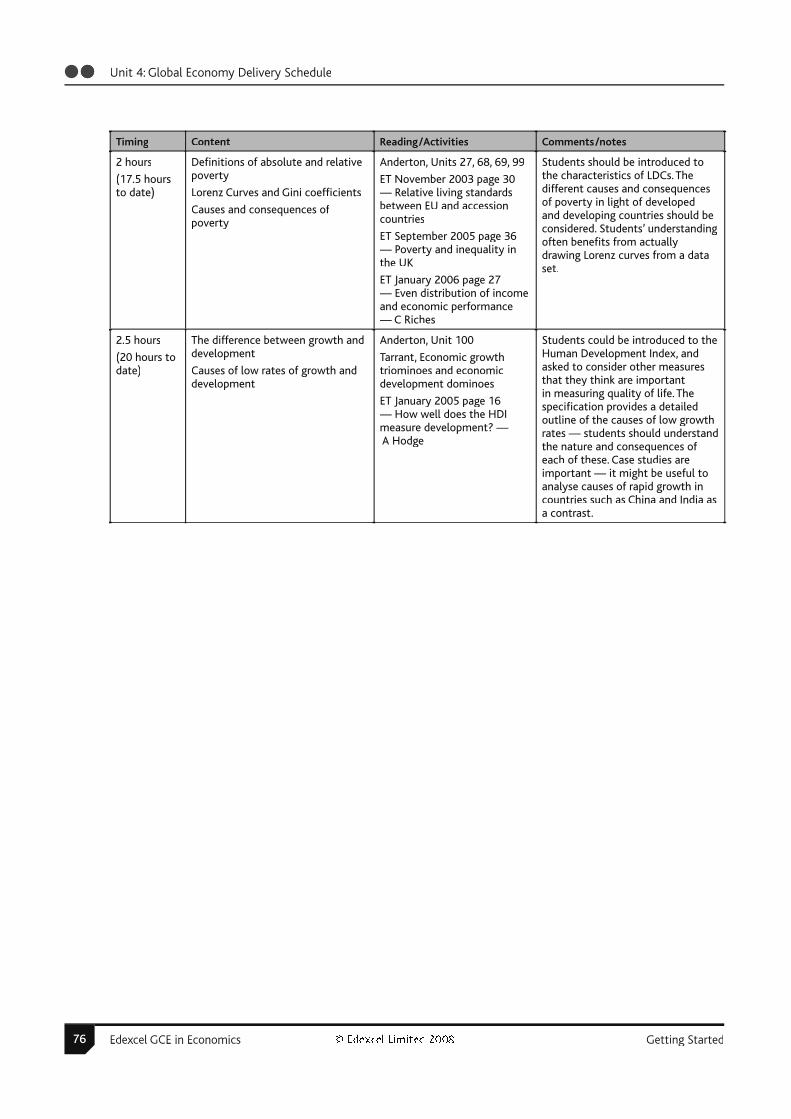
76 Edexcel GCE in Economics Getting Started© Edexcel Limited 2008Edexcel GCE in Economics
Unit 4: Global Economy Delivery Schedule
Timing Content Reading/Activities Comments/notes
2 hours
(17.5 hoursto date)
Defi nitions of absolute and relativepoverty
Lorenz Curves and Gini coeffi cients
Causes and consequences of poverty
Anderton, Units 27, 68, 69, 99
ET November 2003 page 30— Relative living standardsbetween EU and accessioncountries
ET September 2005 page 36— Poverty and inequality inthe UK
ET January 2006 page 27— Even distribution of income and economic performance — C Riches
Students should be introduced tothe characteristics of LDCs. The different causes and consequences of poverty in light of developed and developing countries should be considered. Students’ understandingoften benefi ts from actually drawing Lorenz curves from a data set.
2.5 hours
(20 hours todate)
The difference between growth anddevelopment
Causes of low rates of growth anddevelopment
Anderton, Unit 100
Tarrant, Economic growth triominoes and economic development dominoes
ET January 2005 page 16— How well does the HDImeasure development? —A Hodge
Students could be introduced to theHuman Development Index, and asked to consider other measures that they think are important in measuring quality of life. The specifi cation provides a detailedoutline of the causes of low growth rates — students should understand the nature and consequences of each of these. Case studies areimportant — it might be useful to analyse causes of rapid growth in countries such as China and India as a contrast.
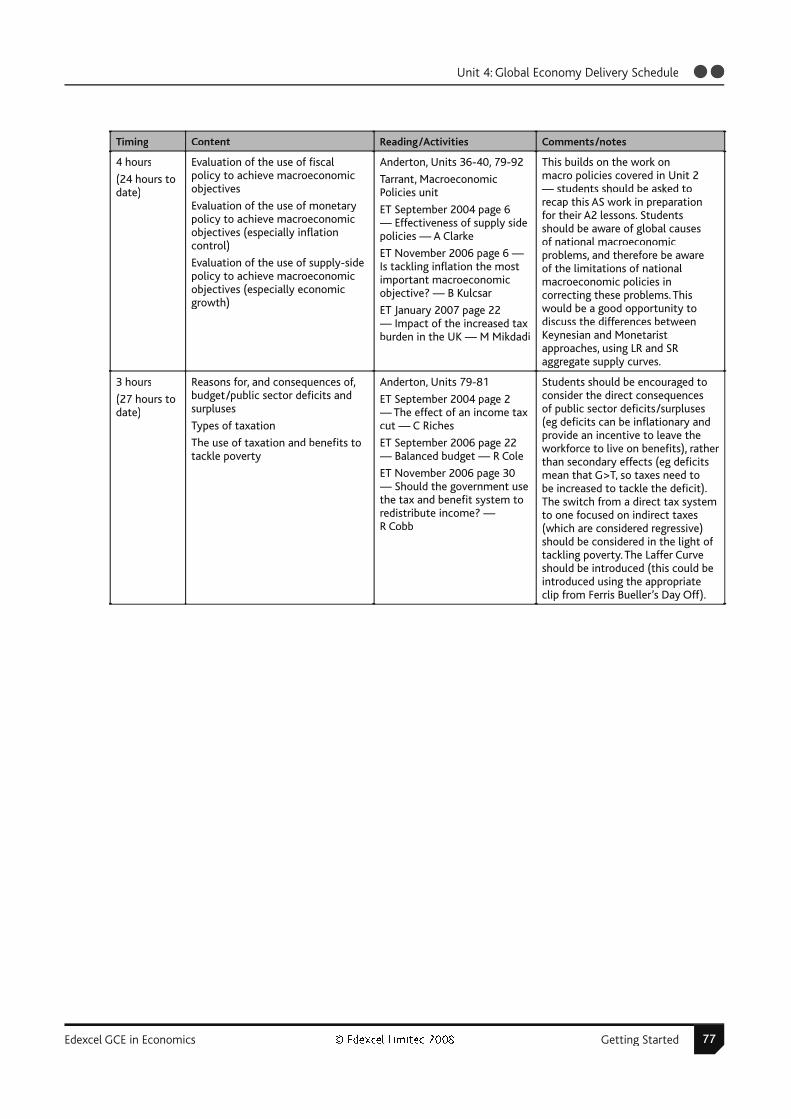
Edexcel GCE in Economics Getting Started 77Edexcel GCE in Economics
Unit 4: Global Economy Delivery Schedule
Timing Content Reading/Activities Comments/notes
4 hours
(24 hours todate)
Evaluation of the use of fi scalpolicy to achieve macroeconomicobjectives
Evaluation of the use of monetarypolicy to achieve macroeconomicobjectives (especially infl ationcontrol)
Evaluation of the use of supply-sidepolicy to achieve macroeconomicobjectives (especially economicgrowth)
Anderton, Units 36-40, 79-92
Tarrant, Macroeconomic Policies unit
ET September 2004 page 6— Effectiveness of supply sidepolicies — A Clarke
ET November 2006 page 6 —Is tackling infl ation the mostimportant macroeconomic objective? — B Kulcsar
ET January 2007 page 22— Impact of the increased taxburden in the UK — M Mikdadi
This builds on the work onmacro policies covered in Unit 2 — students should be asked to recap this AS work in preparation for their A2 lessons. Students should be aware of global causesof national macroeconomicproblems, and therefore be aware of the limitations of national macroeconomic policies incorrecting these problems. This would be a good opportunity to discuss the differences betweenKeynesian and Monetaristapproaches, using LR and SRaggregate supply curves.
3 hours
(27 hours todate)
Reasons for, and consequences of,budget/public sector defi cits andsurpluses
Types of taxation
The use of taxation and benefi ts totackle poverty
Anderton, Units 79-81
ET September 2004 page 2— The effect of an income taxcut — C Riches
ET September 2006 page 22— Balanced budget — R Cole
ET November 2006 page 30— Should the government usethe tax and benefi t system toredistribute income? — R Cobb
Students should be encouraged to consider the direct consequencesof public sector defi cits/surpluses (eg defi cits can be infl ationary and provide an incentive to leave the workforce to live on benefi ts), rather than secondary effects (eg defi cits mean that G>T, so taxes need to be increased to tackle the defi cit). The switch from a direct tax system to one focused on indirect taxes (which are considered regressive) should be considered in the light of tackling poverty. The Laffer Curve should be introduced (this could be introduced using the appropriate clip from Ferris Bueller’s Day Off).

78 Edexcel GCE in Economics Getting Started© Edexcel Limited 2008Edexcel GCE in Economics
Unit 4: Global Economy Delivery Schedule
Timing Content Reading/Activities Comments/notes
8 hours
(35 hours todate)
Evaluation of measures to promotegrowth and development
Theories of growth anddevelopment
Anderton, Units 102–104
Smith, chapters 13–15
ET January 2006 page 2 —Should economic development be left to the market? —A Hodge
ET November 2003 page 22— Arguments for and againstforeign aid — H Mapplebeck
ET September 2006 page 11— Economic development and the environment — G Mallard
ER April 2007 page 14— Fiscal policy to eradicatechild poverty — J Shaw
An extensive list of measures to promote growth and development is provided in the specifi cation. Students should understand thenature of each of these, and be able to evaluate them, rememberingthat different measures willbe valid depending on thenature of the country requiring assistance (for example, degree of political stability/ corruption, or sophistication of transport and communication links). There is signifi cant debate regarding the impact of Fair Trade schemes, particularly with respect to thecoffee market — much of the literature on this is available on the internet. Students could be introduced to some of the theories of growth and development, such as Harrod-Domar, Solow, Rostow’s Stages of Growth, and the Lewis 2 — sector model. The role of institutions such as the IMF could be considered, and the World Bank’s Structural Adjustment Programmes (with reference to Uganda as the fi rst ‘success’). Able students could also consider whether growth and development is actually desirable, since it may be accompanied by a number of negative externalities. The activities of pressure groups such as Jubilee 2000 could beexamined. The dependence of countries such as Ethiopia on aidhand-outs and humanitarian relief could be evaluated as an example.

Edexcel GCE in Economics Getting Started 79Edexcel GCE in Economics
Unit 4: Global Economy Revision Sheets
GCE Economics Unit 4 — The Global Economy Revision Sheets
4.3.1 — What are the causes and effects of globalisation?
Defi nition of globalisation (from Peter Jay):
‘The ability to produce any goods (or service) anywhere in the world, using raw materials,
components, capital and technology from anywhere, sell the resulting output anywhere, and place
the profi ts anywhere.’
Characteristics
Globalisation refers to the increasing interdependence of economic actors (producers, consumers,
governments, entrepreneurs). Key phrases include global branding and global sourcing, although
it is not just about the activity of multinational companies (MNCs). Globalisation is characterised
by increasing foreign ownership of companies, increases in trade in both goods and services, de-
industrialisation in developed countries, and increasing global media presence.
Causes:
• improvements in transport infrastructure and operations
• improvements in communications technology and IT (especially the Internet, allowing a global
media presence)
• reduced protectionism (although this is debatable, with the increase in trading blocs’ power)
• development of international fi nancial markets
• increasing number and infl uence of multinational companies
• end of the Cold War.
Consequences:
• increased dependency of economies on the output of other economies
• greater consumer choice
• lower prices, through specialisation according to comparative advantage
• increasing environmental destruction and other negative externalities
• ‘Footloose’ companies (which can cause unemployment as they move from Place to place)
• possible loss of culture/national identities.

80 Edexcel GCE in Economics Getting Started© Edexcel Limited 2008Edexcel GCE in Economics
Unit 4: Global Economy Revision Sheets
Other issues:
• some people argue that globalisation is not a new phenomenon and that we have been in a
continual process of globalisation since the time of the fi rst humans — this is supported by the
fact that the rate of increase in exports has not really changed recently.
• de-industrialisation in developed countries, combined with a global search for new sources of
energy (especially oil/gas reserves) and the growth of economies such as China and India has
left many ‘Western’ countries concerned about their future and their future power in the global
economy.
• trading blocs are seen as both a contributor to globalisation, with their emphasis on creating
trade within their boundaries, and also an inhibitor to globalisation, since they divert trade
away from economies not within their boundaries.

Edexcel GCE in Economics Getting Started 81Edexcel GCE in Economics
Unit 4: Global Economy Revision Sheets
4.3.2 — Why trade?
International trade can be defi ned as the buying and selling of goods across international boundaries.
Why do countries trade?
The basic reason is that countries are not able to produce everything that they want in today’s
society — gone are the days when people lived off local produce and owned very few assets. This is
associated with economic development and increases in income. Trade allows countries to specialise
in producing the goods/services that can be produced effi ciently — receipts from exports can then
be used to buy goods that would be ineffi cient for that country to make. We buy goods from abroad
because of their:
• availability, eg we cannot grow coconuts in the UK so we import them from the Caribbean
• price, eg other countries may be able to produce much more cheaply than we can in the UK,
because of lower labour costs or easier access to raw materials
• product differentiation, eg a car is not just a car — many British people now want to own
large American SUVs.
Patterns of trade
The UK’s share of world trade in manufacturing has fallen signifi cantly over the past century; this
is true of all G7 countries, but the fall in the UK’s share has been the largest. In global terms, trade
fl ows with Newly Industrialised Countries and the Tiger Economies have radically increased.
Trade within trading blocs, such as the EU, has also signifi cantly increased (trade creation), but
at the expense of trade with more traditional trading partners, such as between the UK and the
Commonwealth countries (trade diversion). Trade has also been infl uenced by the increase in
outsourcing over the past decade or so.
Arguments FOR free trade (advocated by the World Trade Organization, WTO, who act to reduce
trade barriers and settle trade disputes):
• increased consumer choice
• lower prices, through existence of economies of scale
• reduced domestic monopoly power
• increasing world output as a result of comparative advantage.
Comparative advantage
Is the ability to produce a good or service at a lower opportunity cost than another country, ie a
country has a comparative advantage in production of a good if it has to forego the production of
fewer other products in order to make it. This differs from absolute advantage, which is the ability
to produce a good or service at a lower cost than another country. The Law of Comparative
Advantage states that countries should specialise in the production of a good in which they have a
comparative advantage and then trade, causing global output to increase.
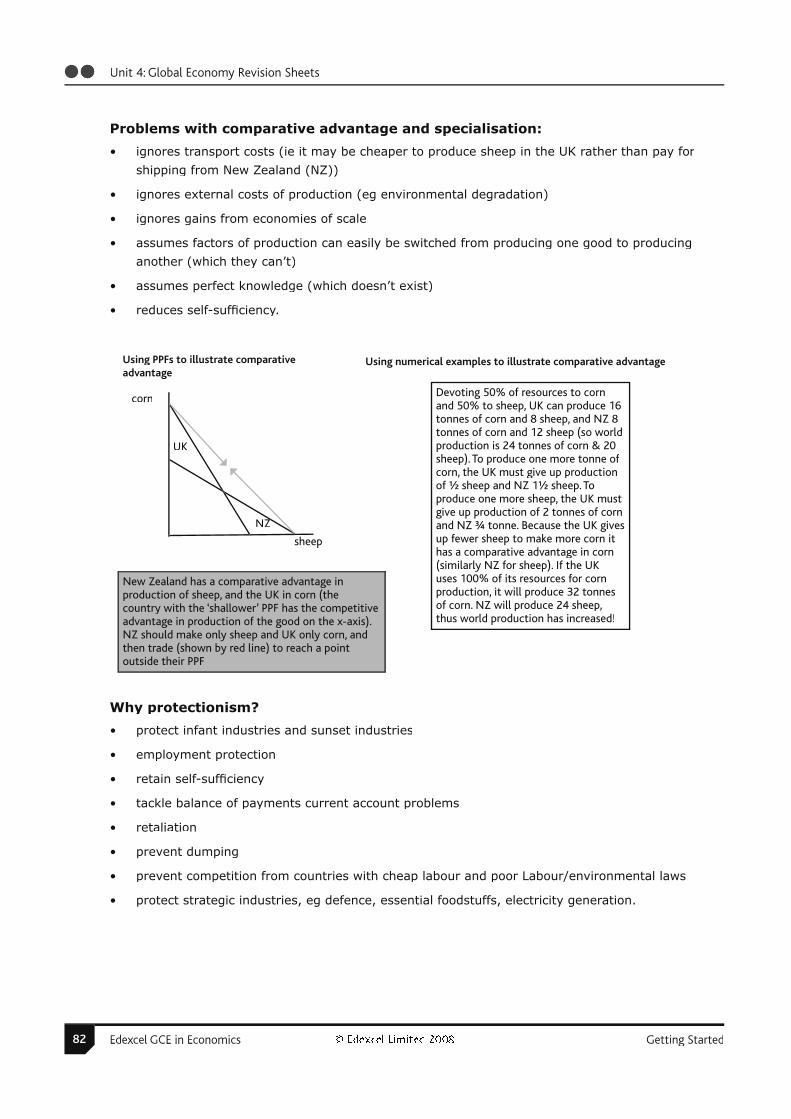
82 Edexcel GCE in Economics Getting Started© Edexcel Limited 2008Edexcel GCE in Economics
Unit 4: Global Economy Revision Sheets
Problems with comparative advantage and specialisation:
• ignores transport costs (ie it may be cheaper to produce sheep in the UK rather than pay for
shipping from New Zealand (NZ))
• ignores external costs of production (eg environmental degradation)
• ignores gains from economies of scale
• assumes factors of production can easily be switched from producing one good to producing
another (which they can’t)
• assumes perfect knowledge (which doesn’t exist)
• reduces self-suffi ciency.
Why protectionism?
• protect infant industries and sunset industries
• employment protection
• retain self-suffi ciency
• tackle balance of payments current account problems
• retaliation
• prevent dumping
• prevent competition from countries with cheap labour and poor Labour/environmental laws
• protect strategic industries, eg defence, essential foodstuffs, electricity generation.
Using numerical examples to illustrate comparative advantageUsing PPFs to illustrate comparativeadvantage
New Zealand has a comparative advantage inproduction of sheep, and the UK in corn (thecountry with the ‘shallower’ PPF has the competitiveadvantage in production of the good on the x-axis).NZ should make only sheep and UK only corn, andthen trade (shown by red line) to reach a pointoutside their PPF
Devoting 50% of resources to cornand 50% to sheep, UK can produce 16tonnes of corn and 8 sheep, and NZ 8tonnes of corn and 12 sheep (so worldproduction is 24 tonnes of corn & 20sheep). To produce one more tonne of corn, the UK must give up productionof ½ sheep and NZ 1½ sheep. Toproduce one more sheep, the UK mustgive up production of 2 tonnes of cornand NZ ¾ tonne. Because the UK givesup fewer sheep to make more corn ithas a comparative advantage in corn(similarly NZ for sheep). If the UKuses 100% of its resources for cornproduction, it will produce 32 tonnesof corn. NZ will produce 24 sheep,thus world production has increased!
corn
sheep
UK
NZZ
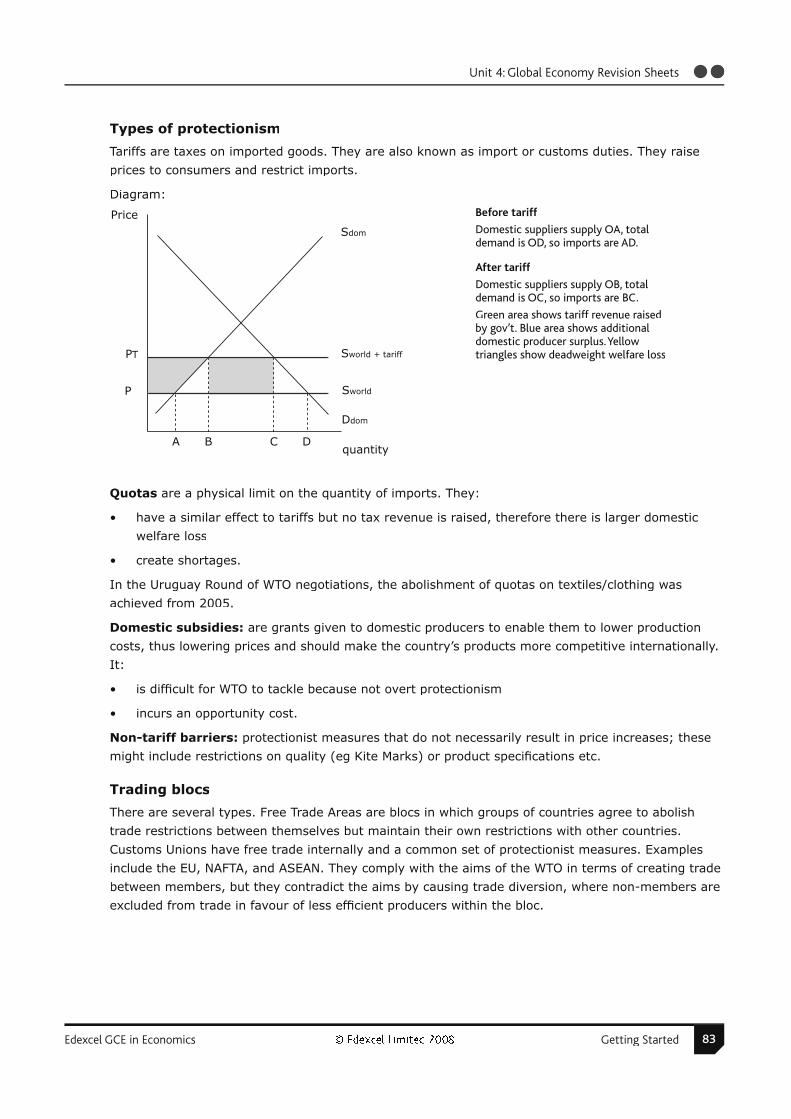
Edexcel GCE in Economics Getting Started 83Edexcel GCE in Economics
Unit 4: Global Economy Revision Sheets
Types of protectionism
Tariffs are taxes on imported goods. They are also known as import or customs duties. They raise
prices to consumers and restrict imports.
Diagram:
Quotas are a physical limit on the quantity of imports. They:
• have a similar effect to tariffs but no tax revenue is raised, therefore there is larger domestic
welfare loss
• create shortages.
In the Uruguay Round of WTO negotiations, the abolishment of quotas on textiles/clothing was
achieved from 2005.
Domestic subsidies: are grants given to domestic producers to enable them to lower production
costs, thus lowering prices and should make the country’s products more competitive internationally.
It:
• is diffi cult for WTO to tackle because not overt protectionism
• incurs an opportunity cost.
Non-tariff barriers: protectionist measures that do not necessarily result in price increases; these
might include restrictions on quality (eg Kite Marks) or product specifi cations etc.
Trading blocs
There are several types. Free Trade Areas are blocs in which groups of countries agree to abolish
trade restrictions between themselves but maintain their own restrictions with other countries.
Customs Unions have free trade internally and a common set of protectionist measures. Examples
include the EU, NAFTA, and ASEAN. They comply with the aims of the WTO in terms of creating trade
between members, but they contradict the aims by causing trade diversion, where non-members are
excluded from trade in favour of less effi cient producers within the bloc.
Before tariff
Domestic suppliers supply OA, totaldemand is OD, so imports are AD.
After tariff
Domestic suppliers supply OB, totaldemand is OC, so imports are BC.
Green area shows tariff revenue raisedby gov’t. Blue area shows additionaldomestic producer surplus. Yellowtriangles show deadweight welfare loss
Price
Sworld + tariff
quantity
Ddom
PT
P Sworld
Sdom
A B C D

84 Edexcel GCE in Economics Getting Started© Edexcel Limited 2008Edexcel GCE in Economics
Unit 4: Global Economy Revision Sheets
4.3.3 — How is international trade recorded and fi nanced?
The Balance of Payments is a record of all a country’s fi nancial dealings with the rest of the
world over the course of a year. It has three parts: the current account, the capital account and the
fi nancial account.
The current account has three parts.
1. Balance of Trade — this looks at the value of imports and the value of exports. Exports are
goods/services that are made by UK companies and sold abroad. They appear as a positive
entry into the Balance of Payments because they bring money into the country. Imports are
goods/services made abroad and sold to people in the UK. They appear as a negative entry
into the Balance of Payments because money leaves the country. We can split the Balance of
Trade up even further by looking at trade in goods, or visible trade, and trade in services, or
invisible trade.
2. Income — this is made up of income earned by UK citizens who own assets overseas.
It includes profi ts, dividends on investments abroad (payments made to shareholders by
companies who earn a profi t) and interest. Growth in investment income has increased
signifi cantly since 1999.
3. International transfers — these are usually money transfers between central governments
(who lend and borrow money from each other) or grants, such as those that we receive as part
of the CAP from the EU. However, our transfers to the EU are normally in defi cit — we give the
EU more money than we receive.
If we have a current account defi cit, then value of money leaving the country > value of
money entering the country. We usually abbreviate this to value of imports > value of exports.
If we have a current account surplus, then value of money entering the country > value of
money leaving the country, or value of exports > value of imports.
The capital account refers to transactions in fi xed assets and is relatively small. The largest aspect
of the capital account refers to fl ows of capital associated with migration. As immigration into the UK
increases, this increases the surplus on the capital account, as immigrants’ assets become part of the
UK’s assets. This account has been in surplus now for 20 years or so.
The fi nancial account refers to transactions in fi nancial assets, or what is more commonly known
as Foreign Direct Investment (lots of older textbooks refer to this as the capital account — don’t get
confused, the name changed a few years ago!). This has shown a signifi cant surplus over the past 6
or 7 years.
Edexcel GCE in Economics Getting Started 85Edexcel GCE in Economics
Unit 4: Global Economy Revision Sheets
The Balance of Payments must always balance
If we have a current account defi cit, we must have a surplus on the capital and fi nancial accounts.
This is because we have to pay for everything we consume and fund it in some way — to fund our
current account defi cit, we must be selling assets to foreign investors. It is debatable whether this is
sustainable in the long run, since if people invest in the UK, at some point they will require a return
on their investment, and this will cause a defi cit on the fi nancial account.
Additionally, because the data is never completely accurate, the accounts also incorporate a ‘net
errors and omissions’ item, which makes sure that everything will balance.
Correcting problems on the balance of payments current account
Governments tend not to be as concerned with correcting surpluses or defi cits on the current account
as they used to be, but there is evidence of global imbalance, with some countries running the
largest (persistent) defi cits they have ever seen and others (particularly oil-producing counties and
China) running enormous surpluses. Theoretically, under a fl oating exchange rate regime, current
account imbalances will be self-correcting. In practise, this tends not to happen for a multitude of
reasons. there are essentially three ways of correcting a defi cit: expenditure-reducing, expenditure-
switching and supply-side policies.
Expenditure reducing policies require the government to cut the income of its citizens, so that they
spend less on imports (for example, through defl ationary fi scal policy); however, a side-effect of this
is that spending on domestic goods also decreases, so AD falls. This can reduce economic growth and
cause recession. It is an unpopular policy, especially politically, and therefore unlikely to be used.
Expenditure switching policies require the government to fi nd ways of reducing its citizens’ spending
on imports, using protectionist measures such as tariffs or quotas, or even a devaluation of the
currency under a fi xed exchange rate regime. However, since this often leads to retaliation, exports
will also fall, and the current account defi cit may not be corrected.
Supply-side policies, such as spending on education and training in order to improve the quality
and therefore competitiveness of exports, aim to boost export demand rather than reduce import
demand. Whilst they can incur an opportunity cost, they contribute positively to economic growth
and can be anti-infl ationary in the long run.
Are persistent imbalances on the current account a cause for concern?
Traditionally, defi cits have been seen as ‘worse’ than surpluses. However, a small imbalance should
not be cause for concern; persistent large imbalances are more worrying. Large and persistent
defi cits can be a problem because there is a need to fi nance the increasing expenditure on imports,
usually through loans from abroad (which show as a surplus on the fi nancial account); having large
debts, especially with creditors abroad, can be problematic when those creditors want their money
back or decide to discontinue lending. Large and persistent surpluses can be a problem because
resources are focused on producing to meet export demand rather than domestic demand, so
consumer choice and resulting living standards could actually be low.

86 Edexcel GCE in Economics Getting Started© Edexcel Limited 2008Edexcel GCE in Economics
Unit 4: Global Economy Revision Sheets
Exchange rates: are the price of one currency in terms of another. Exchange rates are determined
much like any other price in a free market, via demand and supply.
The demand curve for sterling
1. Demand for the pound comes from demand for our exports from abroad. We want to be paid in
pounds, no matter where our customers come from, and so people abroad have to purchase pounds
on the foreign exchange market. If demand for exports increases, then demand for the pound
on the foreign exchange market increases.
2. Demand for the pound also comes from demand for saving in UK bank accounts — if the UK
interest rate goes up compared to interest rates abroad, then people abroad will want to save their
money in UK bank accounts. Because you can save only pounds (rather than dollars or euros) in
UK banks, demand for the pound on the foreign exchange market will rise if the interest
rate rises. The stocks of funds that move around the world in search of the best return is called hot
money.
3. Long term capital movements are also important. So, inwards investment into the UK
increases demand for the pound.
The supply curve for sterling
1. Supply of the pound onto the foreign exchange market comes from our demand for imports.
People abroad want to be paid in their own currency, so we take our pounds along to the foreign
exchange market, releasing them on to the market in return for other currencies. So, supply of the
pound on the foreign exchange market increases if demand for imports increases.
2. If the interest rate abroad increases relative to the interest rate in the UK, then funds will move
from the UK to overseas bank accounts, increasing the supply of the pound on foreign exchange
markets.
3. If there is net outwards investment from the UK economy, then the supply of pounds will increase.
The exchange rate is determined at the point where the demand curve and supply curve for sterling on the foreign exchange market meet.
Price of sterling, in $
Quantity of Sterling
D
Appreciation
Depreciation
E.Rate
S
Q*

Edexcel GCE in Economics Getting Started 87Edexcel GCE in Economics
Unit 4: Global Economy Revision Sheets
Depreciation means that the value of the £, in terms of other currencies, goes down. For example,
£1 = $1.60 to £1 = $1.40 — in the second example, it takes fewer dollars to buy £1. With a
depreciation, even though a good may still be priced at £10, it now costs Americans only $14 instead
of $16 — demand will increase.
Appreciation means that the value of the £, in terms of other currencies, goes up. For example,
£1 = $1.50 to £1 = $1.70 — in the second example, it now takes more dollars to buy £1. With an
appreciation, even though a good may still be priced at £10, it now costs Americans $17 instead of
$15, therefore reducing demand for our exports.
The effect of speculation
The minute-to-minute fl uctuations in the exchange rate are caused by speculation, ie people trying
to earn profi t from buying and selling currencies by predicting which way market forces will move.
Speculation actually causes a self-fulfi lling prophecy. Think about this scenario — imagine that
traders in the City of London expect the value of the pound to rise. In order to make a profi t, they
should buy pounds while they are cheap and then sell them once they have risen in price. So,
they start to buy pounds on the foreign exchange market. This increases demand for the pound,
and therefore increases the price — exactly as they anticipated! Until about 30 years ago, many
developed economies imposed exchange controls on their currency movements in order to prevent
speculation. Under a strict exchange control, currency could only be bought and sold through a
country’s central bank. China is one country that still has some degree of exchange control.
European Monetary Union: adoption of the European single currency, the euro, and the
centralisation of monetary policy for the Eurozone.
The criteria for joining the euro were set out in the Maastricht Treaty. There are fi ve main criteria
that countries must meet before being allowed to move towards EMU.
1. The government’s budget defi cit must be below 3% of GDP.
2. The public debt must be below 60% of GDP.
3. The rate of infl ation in a country must be within 1.5% of the average of the best three
performing EU member states.
4. Long term interest rates must be within 2% of the average interest rate in the three economies
with the lowest infl ation.
5. The exchange rate must be within the bounds set by the exchange rate mechanism.

88 Edexcel GCE in Economics Getting Started© Edexcel Limited 2008Edexcel GCE in Economics
Unit 4: Global Economy Revision Sheets
Assessment of EMU
Pros Cons
Reduces transactions costs Irreversible decision to join
Reduces exchange rate risks of trading with Europeanpartners
‘One size fi ts all’ monetary policy unlikely to beappropriate for the different member states
Protection against damaging effects of currencyspeculation
Restricts use of fi scal policy (and therefore supply sidepolicy) through Growth and Stability Pact
Can encourage FDI Possible loss of national identity and sovereignty
Increased trade and FDI may result in higher employment and economic growth
Poorer/weaker countries may see increasedunemployment as their goods are not demandedinternationally
Lower infl ation from strong monetary policy control byECB
Asymmetric infl ation target may limit economicgrowth
Edexcel GCE in Economics Getting Started 89Edexcel GCE in Economics
Unit 4: Global Economy Revision Sheets
4.3.4 — How does a country compete?
Competitiveness refers to the ability of a country to sell its goods/services abroad. Competitiveness
is usually determined by the price and/or quality of the good or service.
Measures of competitiveness
The price of a good abroad depends on both its cost of manufacture and the exchange rate.
Cost of manufacture:
• unit labour costs compared to competitors
o productivity
– measured by GDP per capita
– infl uenced by level of education/training, trade union activity, labour laws, level of
investment
o wages
– depends on cost of living, productivity, trade union activity, labour laws etc
• costs of capital
o depends on cost of fi nance eg interest rates
• transport costs compared to competitors
• rate of infl ation.
Exchange rate:
• real, rather than nominal, exchange rate is important
o the exchange rate adjusted for infl ation
• terms of trade: index of export prices/index of import prices
Improving competitiveness
Competitiveness can be improved by infl uencing any of the factors outlined above. Supply-side
policies are the most likely to be used in most developed countries — these will improve productivity,
reduce ‘red-tape’ surrounding businesses, reduce trade-union activity and so on. It is impossible for
countries with fl oating exchange rates to manipulate the exchange rate to improve competitiveness
(although countries such as China, with fi xed exchange rates, have been accused of deliberately
keeping their exchange rates undervalued in order to maintain competitiveness). Governments want
to improve competitiveness in order to boost AD (exports are a component of AD), thus reducing
unemployment and causing economic growth, and therefore an increase in living standards.

90 Edexcel GCE in Economics Getting Started© Edexcel Limited 2008Edexcel GCE in Economics
Unit 4: Global Economy Revision Sheets
4.3.5 — What is poverty and inequality in developed and developing countries?
Relative poverty exists when a person is poor compared to others in their society. Most poverty in
developed countries tends to be relative poverty. Absolute poverty exists when a person’s continued
daily existence is threatened. Much of the poverty in developing countries tends to be absolute
poverty.
Inequality can occur in terms of either income or wealth. Income is a fl ow concept — people earn
income, either through paid work or through dividends on fi nancial assets. Wealth is a stock concept
— it is a measure of the value of people’s assets.
Causes of unequal income distribution include:
• receipt of different wages
o different abilities/skills resulting in differing levels of productivity and therefore differing
wages
o discrimination
o compensating differentials, eg some jobs are considered intrinsically rewarding and therefore
attract lower pay
o regional differences in pay
• unemployment
• varying ownership of fi nancial assets, since these generate income
o people on higher income are able to afford to purchase assets, which in turn then generate
more income, leading to a virtuous cycle.
Inequality in a free market economy is inevitable, since people with higher skill and ability will attract
higher wages, and some people, perhaps with disabilities or poor skill levels, will earn nothing. This
is one of the strongest arguments in favour of a mixed economy with government intervention to
redistribute income through the tax system.
Causes of unequal wealth distribution include:
• different levels of income
• inheritance.
Measures of inequality include the Lorenz curve and the Gini coeffi cient. Lorenz Curves plot
cumulative share of income (or wealth) against the cumulative share of the population with that
income (or wealth). The Gini coeffi cient is a numerical measure between 0 and 1 of the degree
of inequality in a society; it can be measured using areas on a Lorenz curve. 0 denotes absolute
equality; 1 is absolute inequality.

Edexcel GCE in Economics Getting Started 91Edexcel GCE in Economics
Unit 4: Global Economy Revision Sheets
This Lorenz curve showsthat 50% of the population
earn 20% of the income.
Call the area between theline of equality and theLorenz curve ‘A’ and thearea under the Lorenz curve‘B’. The Gini coeffi cient =A/(A+B)
100
50
20
45
10050
Cumulative share ofincome (%)
Cumulative share ofpopulation (%)
Line of absolute equality
Lorenze curve

92 Edexcel GCE in Economics Getting Started© Edexcel Limited 2008Edexcel GCE in Economics
Unit 4: Global Economy Revision Sheets
4.3.6 — What are the limits to growth and development in developed anddeveloping countries?
Economic growth: an increase in real GDP/an increase in the productive potential of a country.
Measured by assessing growth in GDP, or sometimes GDP per capita.
Economic development: an increase in living standards — this could relate to income per head,
levels of education, healthcare, access to housing etc. Measured in many ways, usually using
composite measures such as the Human Development Index (HDI), which provides a score between
0 and 1 based on GDP per capita, literacy rates and life expectancy.
Classifi cation/characteristics of countries
Developed countries:
- ‘First World Countries’, or ‘Most Developed Countries’ (MDCs)
- tend to be those countries thought of as ‘Western’
- many have entered a phase of de-industrialisation, and have developed their service sectors
(including fi nancial and IT services)
- high GDP per head
- high levels of education and healthcare
- reliable and safe transport infrastructure and operations
- non-corrupt democratically-elected government
- high productivity and investment.
Developing countries
- ‘Third World Countries’ or ‘Less Developed Countries’ (LDCs)
- tend to be located in Africa, South America and Asia
- wide range of levels of development
o Newly Industrialised Countries (NICs) include South Korea, Taiwan and other Tiger
Economies — are industrialised, with good education, transport and other infrastructure
o Low Income (‘Fourth World’) — generally less than $1000 income per head
o Middle Income (‘emerging economies’) — generally less than $10 000 income per head
- often led by corrupt, non-democratically elected governments
- may have had recent civil war
- agriculture-based or subsistence economy with small industrial sector (not true for NICs)
- poor fi nancial infrastructure
- poor education, healthcare, transport, and communications infrastructure
- high unemployment and underemployment
- low productivity and investment
- high birth/death rates
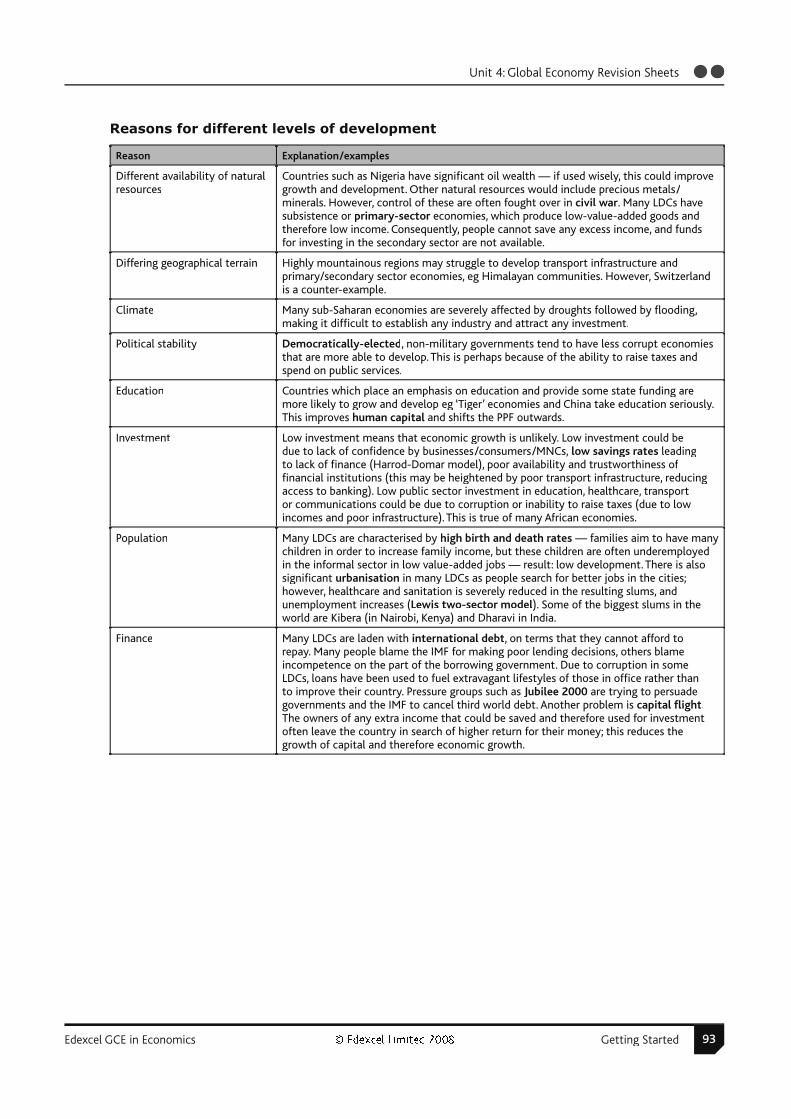
Edexcel GCE in Economics Getting Started 93Edexcel GCE in Economics
Unit 4: Global Economy Revision Sheets
Reasons for different levels of development
Reason Explanation/examples
Different availability of naturalresources
Countries such as Nigeria have signifi cant oil wealth — if used wisely, this could improvegrowth and development. Other natural resources would include precious metals/minerals. However, control of these are often fought over in civil war. Many LDCs havesubsistence or primary-sector economies, which produce low-value-added goods andtherefore low income. Consequently, people cannot save any excess income, and fundsfor investing in the secondary sector are not available.
Differing geographical terrain Highly mountainous regions may struggle to develop transport infrastructure andprimary/secondary sector economies, eg Himalayan communities. However, Switzerlandis a counter-example.
Climate Many sub-Saharan economies are severely affected by droughts followed by fl ooding,making it diffi cult to establish any industry and attract any investment.
Political stability Democratically-elected, non-military governments tend to have less corrupt economiesthat are more able to develop. This is perhaps because of the ability to raise taxes andspend on public services.
Education Countries which place an emphasis on education and provide some state funding aremore likely to grow and develop eg ‘Tiger’ economies and China take education seriously.This improves human capital and shifts the PPF outwards.
Investment Low investment means that economic growth is unlikely. Low investment could bedue to lack of confi dence by businesses/consumers/MNCs, low savings rates leadingto lack of fi nance (Harrod-Domar model), poor availability and trustworthiness of fi nancial institutions (this may be heightened by poor transport infrastructure, reducingaccess to banking). Low public sector investment in education, healthcare, transportor communications could be due to corruption or inability to raise taxes (due to lowincomes and poor infrastructure). This is true of many African economies.
Population Many LDCs are characterised by high birth and death rates — families aim to have manychildren in order to increase family income, but these children are often underemployedin the informal sector in low value-added jobs — result: low development. There is alsosignifi cant urbanisation in many LDCs as people search for better jobs in the cities;however, healthcare and sanitation is severely reduced in the resulting slums, andunemployment increases (Lewis two-sector model). Some of the biggest slums in theworld are Kibera (in Nairobi, Kenya) and Dharavi in India.
Finance Many LDCs are laden with international debt, on terms that they cannot afford torepay. Many people blame the IMF for making poor lending decisions, others blameincompetence on the part of the borrowing government. Due to corruption in someLDCs, loans have been used to fuel extravagant lifestyles of those in offi ce rather thanto improve their country. Pressure groups such as Jubilee 2000 are trying to persuadegovernments and the IMF to cancel third world debt. Another problem is capital fl ight.The owners of any extra income that could be saved and therefore used for investmentoften leave the country in search of higher return for their money; this reduces thegrowth of capital and therefore economic growth.

94 Edexcel GCE in Economics Getting Started© Edexcel Limited 2008Edexcel GCE in Economics
Unit 4: Global Economy Revision Sheets
4.3.7 — What is the role of the state in promoting growth and development?
Fiscal policy — any policy concerned with government spending, taxation or government borrowing.
If government spending = taxation, there is a balanced budget. An increase in government spending/
a fall in tax, causes an increase in AD (expansionary fi scal policy). In the short-run, this can be
infl ationary, reduce unemployment and increase GDP. In the long run, depending on what the
government spends its money on, it can be anti-infl ationary, raise employment and cause sustained
economic growth (if the LRAS increases due to spending on education for example). The opposite is
true of a restrictionist or defl ationary fi scal policy.
Budget defi cit:
• government spending exceeds tax revenue
• caused by
o economic recession or slump
o increase in supply side policy
o economic shock requiring government response
• funded by rise in current borrowing, to be repaid by increasing future taxes, or issue of gilts
• consequences can include:
o rise in productive potential of country if spending improves education
o increased dependency on benefi ts
o infl ation (and resulting loss in international competitiveness and rise in inequality) although
this may be wiped out if the supply side improves and LRAS increases
o reduced attractiveness for FDI if government seen as incompetent, although could raise FDI
if the defi cit has led to an improvement in the supply-side etc.
A budget surplus is essentially the opposite. Governments are able to pay back loans, raising their
creditworthiness. If taxes become too high, governments need to be aware of the Laffer curve
effect, where tax revenue may begin to fall as people decide that work is not worth the effort to
simply pay high taxes.
1000
Tax revenue
Marginal rate of tax(%)
T* = optimal rate of tax
Laffer Curve
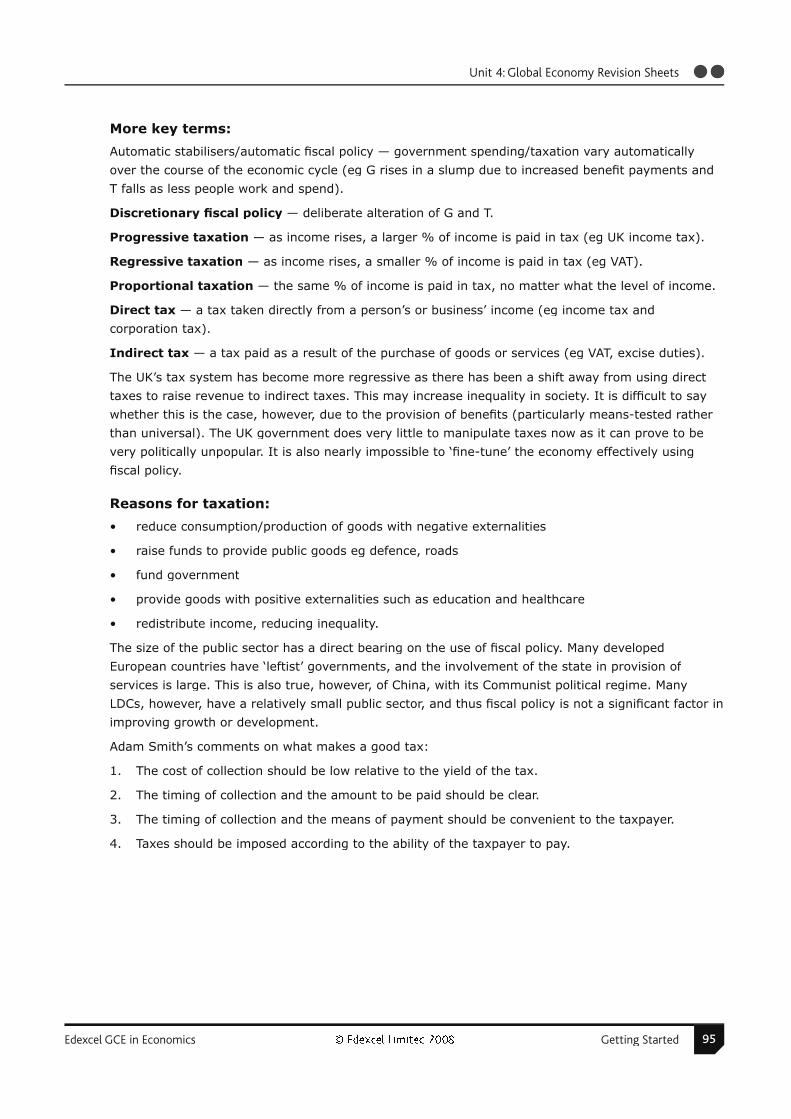
Edexcel GCE in Economics Getting Started 95Edexcel GCE in Economics
Unit 4: Global Economy Revision Sheets
More key terms:
Automatic stabilisers/automatic fi scal policy — government spending/taxation vary automatically
over the course of the economic cycle (eg G rises in a slump due to increased benefi t payments and
T falls as less people work and spend).
Discretionary fi scal policy — deliberate alteration of G and T.
Progressive taxation — as income rises, a larger % of income is paid in tax (eg UK income tax).
Regressive taxation — as income rises, a smaller % of income is paid in tax (eg VAT).
Proportional taxation — the same % of income is paid in tax, no matter what the level of income.
Direct tax — a tax taken directly from a person’s or business’ income (eg income tax and
corporation tax).
Indirect tax — a tax paid as a result of the purchase of goods or services (eg VAT, excise duties).
The UK’s tax system has become more regressive as there has been a shift away from using direct
taxes to raise revenue to indirect taxes. This may increase inequality in society. It is diffi cult to say
whether this is the case, however, due to the provision of benefi ts (particularly means-tested rather
than universal). The UK government does very little to manipulate taxes now as it can prove to be
very politically unpopular. It is also nearly impossible to ‘fi ne-tune’ the economy effectively using
fi scal policy.
Reasons for taxation:
• reduce consumption/production of goods with negative externalities
• raise funds to provide public goods eg defence, roads
• fund government
• provide goods with positive externalities such as education and healthcare
• redistribute income, reducing inequality.
The size of the public sector has a direct bearing on the use of fi scal policy. Many developed
European countries have ‘leftist’ governments, and the involvement of the state in provision of
services is large. This is also true, however, of China, with its Communist political regime. Many
LDCs, however, have a relatively small public sector, and thus fi scal policy is not a signifi cant factor in
improving growth or development.
Adam Smith’s comments on what makes a good tax:
1. The cost of collection should be low relative to the yield of the tax.
2. The timing of collection and the amount to be paid should be clear.
3. The timing of collection and the means of payment should be convenient to the taxpayer.
4. Taxes should be imposed according to the ability of the taxpayer to pay.

96 Edexcel GCE in Economics Getting Started© Edexcel Limited 2008Edexcel GCE in Economics
Unit 4: Global Economy Revision Sheets
As globalisation increases, we may also want to add the idea that domestic tax systems should be
compatible with foreign ones, so that people and businesses are not tempted to move between
countries in search of lower tax rates.
Monetary policy — any policy concerned with manipulation of interest rates, the money supply or
exchange rates. The UK, Europe and a number of other countries have independent central banks
— this means that they set interest rates in order to control infl ation rather than to satisfy political
whims. This independence gives their policy more credibility — if people believe that the changes are
permanent and correct, then they will adjust their spending more quickly.
Firms and households choose to keep holdof some of their money in order to maketransactions more quickly. However, if they keephold of cash, they are unable to use that moneyto purchase fi nancial assets which would providethem with interest. So, the opportunity cost, or the price of money, is the interest rate.
The government cannot control both the money supply and the interest rate. If the government
wanted the money supply to be M*, it could either control the money supply and allow the interest
rate to adjust automatically to i*, or it could control the interest rate and allow the money supply to
adjust automatically to M*.
Control of the money supply itself is extremely diffi cult, as it is nearly impossible to actually measure
the amount of money. So, in the UK, we choose to control the interest rate in order to control
infl ation.
However, control of infl ation is becoming more diffi cult as the infl uence of globalisation increases.
Domestic causes of infl ation include increased government spending, low domestic interest rates
(increasing availability of credit), increased business/consumer confi dence (perhaps through
increased house prices, trust in the government etc. There are also a number of international causes
of infl ation, which domestic central banks can do less to correct, for example the growth of China has
pushed up prices (due to increased demand) of raw materials such as copper and oil — this causes
cost-push infl ation in the domestic economy. This makes the decisions of policy-makers all the more
diffi cult, as the level of complexity increases, causing more uncertainty about the future.
M*
i*
Inte
rest
rat
e
Quantity
Supply
The money market
Demand

Edexcel GCE in Economics Getting Started 97Edexcel GCE in Economics
Unit 4: Global Economy Revision Sheets
Evaluation of monetary policy
Strengths Weaknesses
Stable infl ation increases consumer/business/investor confi dence, thus allowing economic growth to be moreeasily achieved
It can take up to two years for the effects of interest ratechanges to fully affect the CPI — this is not helpful if thereare signifi cant external shocks to the economy
The implications of changes in the interest rate are clear to understand
Just because the Bank of England changes the base rate,doesn’t mean that interest rates change for everyone in theeconomy
It has effects on both AD and AS, so can have short-termand longer-term effects
Affects the exchange rate, which can alter thecompetitiveness of the economy (although this could be astrength!)
There is clear framework and remit for the MPC, removingpolitical bias
If infl ation is primarily cost-push, rather than demand-pull, then a rise in interest rates will increase the costs of businesses as the interest to be paid on their debt increases,which could make infl ation worse
Initial effects on consumer and business spending can befairly rapid, so long as the MPC’s decision is credible
In the UK, many poorer people currently face signifi cant debtproblems, and already face high interest rates — monetarypolicy may therefore worsen the distribution of income
Evidence — since 1997, the rate of infl ation has been lowand steady
We can’t calculate the exact effect of a rise in interest rates— data is uncertain and incomplete
Particularly effective in the UK as there is high householddebt (high house prices, high borrowing) so changes ininterest rates are felt quickly
We cannot attribute the low infl ation rates solely toeffective monetary policy from the MPC — much of therecent low infl ation refl ects recession abroad (reducingdemand for exports) and falling worldwide commodityprices (with the exception of oil)
Many businesses borrow their funds overseas, where interestrates are lower, so a rise in interest rates in the UK will haverelatively little effect
Goodhart’s Law — this states that economic variables oftenlose their relationship with other variables once we try tocontrol them
Supply-side policies — any policy concerned with increasing the quantity or improving the quality
of a country’s factors of production, in order to increase the productive potential of the country
and increase LRAS. Such policies might include improving education so that it is appropriate to the
skills required in the modern economy, reducing ‘red-tape’ for new business start-ups, improving
healthcare so that people take less time off sick, teaching entrepreneurship, reducing access to
benefi ts, encouraging increased labour force participation (this latter point is one of the major
reasons behind Ireland’s growth since joining the EU).
These policies are usually funded through tax revenues — there is therefore a close link between
fi scal policy and supply-side policies. Supply-side policies can take several years to have an effect
on the economy, and may be infl ationary in the short-run as government spending increases.
Governments also need to ensure that they are not spending their money on training people in skills
that will soon be outdated, since this will then contribute to future structural unemployment.

98 Edexcel GCE in Economics Getting Started© Edexcel Limited 2008Edexcel GCE in Economics
Unit 4: Global Economy Revision Sheets
Key evaluative points for supply-side policies
There is an opportunity cost of spending on education and training. Additionally, how do we know
what sort of skills will be needed in several years’ time? By the time education programmes have
been developed, they may be out of date and inappropriate.
Labour market fl exibility is not necessarily desirable from the point of view of many workers — it
makes it easier to lose jobs and increases competition for jobs, which can cause stress.
Taking away unemployment benefi ts does encourage people into work, but care must be taken to
protect the vulnerable, who really are not able to work. In addition, benefi ts must not be so low that
people choose to stay in jobs they do not like rather than become frictionally unemployed for a short
period in the hope of fi nding a better job — this would be ineffi cient.
Care must also be taken not to make the tax system too progressive, as this will discourage highly
skilled workers from working harder or being more productive. However, there is a need to prevent
high inequality. This is a diffi cult trade-off to make.

Edexcel GCE in Economics Getting Started 99Edexcel GCE in Economics
Unit 4: Global Economy Revision Sheets
4.3.8 — What other measures can be used to promote growth and development?
Models/theories of growth and development
Harrod-Domar Now considered an ‘old’ theory that focuses on the role of investment for growth, thistheory states that the rate of growth equals the marginal propensity to save (which provides funds for investment) divided by the capital-output ratio. A problem with thistheory is that it doesn’t help LDCs to establish a fi nancial system in which savings and investment are possible in the fi rst place.
Rostow’s 5 stages of development
The 5 stages of development are: traditional society, precursor to take-off (high savings), take-off, drive to maturity, mass consumption. Again, savings and investment are key. Tohelp LDCs gain enough funds for investment, Rostow suggested that foreign aid could beused.
Lewis 2-sector This is a structural change model. Lewis said that growth would be achieved by themigration of workers from the rural primary sector to the modern industrial urban sector — this would occur through higher wage incentives. However, despite evidence fromcurrent developed economies, this model often seems inappropriate for LDCs, wherethe population in the urban slums is often unemployed, and would be more productivein the rural sector. This theory also assumes that secondary sector production would belabour-intensive, whereas it is often capital-intensive.
Dependency theory Lack of growth and development is not the fault of LDCs, but by the conditionsunder which they operate as a result of their links to MDCs ie ex-colonial rule forcingspecialisation in the primary sector, the constraints placed on LDCs as a result of accumulation of debt from ‘Western’ institutions. However, India’s recent growth ratesare contrary to this theory.
Market liberalisation/neo-classical theory
The idea here is that by opening up markets (by reducing protectionism etc) andencouraging FDI (MNC activity), LDCs will grow and develop as their goods can be soldon the international market and they benefi t from infrastructure development by MNCs.However, many economists argue that this will lead to growth but not necessarilydevelopment, as only some people in the LDCs will benefi t. The environmentaldegradation and other negative externalities caused as a result may reduce livingstandards. The success of this approach also depends on the political climate in the LDCbeing stable.
Role of tourism
Many LDCs are increasingly highly dependent on tourism from the developed world as incomes rise.
Most LDCs positively encourage tourism because it allows foreign currency to be earned and it is
not capital-intensive (therefore not reliant on high investment). However, there may be signifi cant
negative externalities resulting from tourism growth, eg use of clean water for tourists not locals,
expansion of airports causing pollution and loss of farmland etc. The Kingdom of Bhutan, in the
Himalayas, aims to tackle this problem by taxing tourists heavily for every night they spend in the
country.
Microfi nance
The lack of extensive fi nancial infrastructure in many LDCs is an inhibitor to development.
Microfi nance allows people in LDCs to borrow small amounts of money from local lenders — much of
this business is now conducted using mobile telephones, which have leapfrogged landlines in many
LDCs. The idea is that local but poor entrepreneurs will be able to set up small businesses, and go
on to employ other local people — a sort of ‘grassroots’ approach to development. Debtors must
be sure, however, that their micro-creditor does not charge extortionate interest — given a lack of
education in many LDCs, this may prove diffi cult.

100 Edexcel GCE in Economics Getting Started© Edexcel Limited 2008Edexcel GCE in Economics
Unit 4: Global Economy Revision Sheets
Debt relief
Many LDCs hit a ‘debt crisis’ in the 1980s and 1990s, as they could not afford to pay the interest
on their large debts to international fi nancial institutions. This was a combination of interest rates
rising and the value of the dollar rising (and most loans were agreed in terms of US dollars). Latin
American countries and many African countries were amongst the worst hit — Mexico defaulted on
its loans fi rst, and others followed suit. This meant that these countries were then unable to borrow.
The massive debts that they had to repay meant that governments of these countries were unable
to invest in human capital or other infrastructure necessary for growth and development. Initially,
the IMF set up Structural Adjustment Programmes, where it would lend the debtors money to pay off
their original debts, but on strict conditions with respect to fi scal policy and trade policy. These were
very unpopular. One solution is debt forgiveness, where the loans are essentially cancelled — many
lenders do not want to do this. An alternative is debt rescheduling, where the repayment terms are
altered. Jubilee 2000, a pressure group, actively campaigns for debt cancellation.
Foreign aid
This is increasingly multilateral (between many countries), rather than bilateral (between two
countries), which reduces the restrictions under which aid is provided. There are different types
of aid, ranging from humanitarian aid (such as food and shelter, in times of emergency), to grants
(sums of money that do not need to be repaid) and loans (money that should be repaid). Whilst
many in the developed world see aid as a positive thing, much of the aid is squandered on projects
that will not contribute to development, or are duplicated by different aid agencies who do not
communicate with each other, or even spent by corrupt governments on themselves in the LDCS.
If humanitarian aid is continued for a long period, then people become overly dependent on it, and
forget their own skills — this has happened in Ethiopia. Many of the most needy do not get any
aid; much of it is channelled into those projects which have captured the global media interest.
As mentioned earlier, dependency theory suggests that provision of aid can reduce the level of
development in an LDC.
Fairer trade
The WTO works towards reducing protectionist policies. Many LDCs argue that they need to protect
their economies however, as they cannot afford to compete with the subsidies provided to the
agricultural sectors in developed economies, such as the CAP in the EU. Many LDCs are unable to sell
their mainly primary sector products abroad because of protectionism in the developed world. The
Fair Trade movement is one way in which farmers in LDCs are supposed to benefi t, thus improving
development. This guarantees farmers a certain income, so that they are not subject to monopsony
purchasing power from developed countries, particularly with respect to coffee, cocoa and cotton.
However, there are often a signifi cant number of ‘middle men’ involved, reducing the benefi ts that
fair trade farmers receive. Additionally, not every farmer in every LDC benefi ts — many are unaware
of the scheme, and many are not able to afford the membership fees that are required. Some cynical
people argue that the Fair Trade movement is just a means of making people in the developed world
‘feel better’ about their position in relation to those in LDCs.

Edexcel GCE in Economics Getting Started 101Edexcel GCE in Economics
Student Guide
Student Guide — GCE in Economics
What do I need to know, or be able to do, before taking this course?
Some students may have studied a GCSE in Economics, GCSE in Business and Economics or GCSE
in Business before studying this course, although this is not an essential requirement for studying
Economics A level. What is likely to be much more important is your attitude to Maths, as you will be
required to interpret data and make assumptions from it. Some teachers will look for a good grade
in Maths GCSE and some universities will look for the combination of Maths A level and Economics A
level before allowing you to study for an Economics Honours degree.
What will I learn?
Unit 1: Competitive Markets provides an introduction to the nature of economics and examines
how the price mechanism allocates resources in markets. It analyses the nature of market failure, its
causes and possible policy remedies. At the end of this unit, you should be able to apply supply and
demand analysis to real world situations; to understand why markets might not allocate resources
effi ciently and the methods of dealing with market failure, together with an evaluation of their
effectiveness.
Unit 2: Managing the Economy provides an introduction to the key measures of economic
performance and the main objectives and instruments of economic policy. You should be able to use
a basic Aggregate Demand/Aggregate Supply model to understand why demand and/or supply side
policies may be seen as appropriate ways of managing an economy; predict the possible impact of
such policies and to recognise the assumptions involved; argue for different approaches and identify
criteria for success.
Unit 3: Business Economics and Economic Effi ciency develops the content of Unit 1 and
examines how the pricing of and nature of competition between fi rms is affected by the number and
size of market participants. At the end of this unit, you should be able to analyse the pricing and
output decisions of fi rms in different contexts. You should also be capable of making an appraisal of
government intervention aimed at promoting competitive markets. Where appropriate, you should be
able to relate the theoretical framework to real world examples.
Unit 4: The Global Economy develops the knowledge and skills gained in Unit 2 so that they
can be applied in a global context. The application, analysis and evaluation of economic models is
required as well as an ability to assess policies which might be used to deal with economic problems.
An awareness of trends and developments in the global economy over the last 10 years is required.
Throughout the course you are expected to interpret data presented in different forms, for example
tables, graphs and index numbers; carry out simple calculations, for example involving percentages
and percentage change and distinguish between real and nominal data. You will also be required to
interpret diagrams and construct simple graphs.
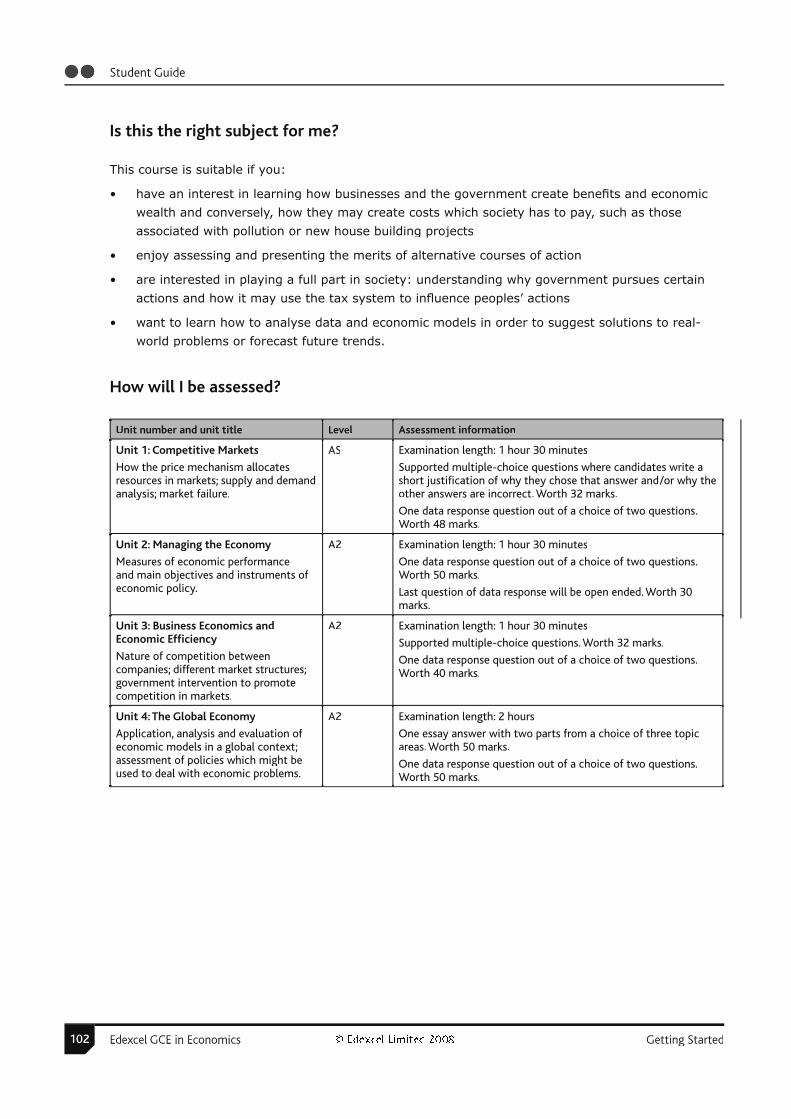
102 Edexcel GCE in Economics Getting Started© Edexcel Limited 2008Edexcel GCE in Economics
Student Guide
Is this the right subject for me?
This course is suitable if you:
• have an interest in learning how businesses and the government create benefi ts and economic
wealth and conversely, how they may create costs which society has to pay, such as those
associated with pollution or new house building projects
• enjoy assessing and presenting the merits of alternative courses of action
• are interested in playing a full part in society: understanding why government pursues certain
actions and how it may use the tax system to infl uence peoples’ actions
• want to learn how to analyse data and economic models in order to suggest solutions to real-
world problems or forecast future trends.
How will I be assessed?
Unit number and unit title Level Assessment information
Unit 1: Competitive Markets
How the price mechanism allocatesresources in markets; supply and demandanalysis; market failure.
AS Examination length: 1 hour 30 minutes
Supported multiple-choice questions where candidates write ashort justifi cation of why they chose that answer and/or why theother answers are incorrect. Worth 32 marks.
One data response question out of a choice of two questions.Worth 48 marks.
Unit 2: Managing the Economy
Measures of economic performanceand main objectives and instruments of economic policy.
A2 Examination length: 1 hour 30 minutes
One data response question out of a choice of two questions.Worth 50 marks.
Last question of data response will be open ended. Worth 30marks.
Unit 3: Business Economics andEconomic Effi ciency
Nature of competition betweencompanies; different market structures;government intervention to promotecompetition in markets.
A2 Examination length: 1 hour 30 minutes
Supported multiple-choice questions. Worth 32 marks.
One data response question out of a choice of two questions.Worth 40 marks.
Unit 4: The Global Economy
Application, analysis and evaluation of economic models in a global context;assessment of policies which might beused to deal with economic problems.
A2 Examination length: 2 hours
One essay answer with two parts from a choice of three topicareas. Worth 50 marks.
One data response question out of a choice of two questions.Worth 50 marks.

Edexcel GCE in Economics Getting Started 103Edexcel GCE in Economics
Student Guide
What can I do after I’ve completed the course?
This qualifi cation should enable you to progress on to a straight economics degree with a focus
on theory, or a degree in applied economics such as environmental economics, labour economics,
public sector economics or monetary economics. Alternatively students may like to study a business
economics or mathematical economics degree. Economics can also be combined with another subject
as a joint degree or with other subjects, eg politics, philosophy or history as a combined degree.
Post university employment rates of economists are among the highest for graduates. An economics
degree enables students to gain transferable skills in problem solving, quantitative analysis and
communication. They are likely to fi nd employment in fi nance, banking, insurance, accountancy,
management and consultancy. Some become professional economists.
Next steps!
You should:
• Find out what grade you are likely to get in your GCSE Maths.
• Ask your Careers Advisor if an Economics A level will assist you in progressing on to the degree
course or in getting the job you want to do?
• Familiarise yourself with the specifi cation and additional support material for each economics unit
which can be found under the GCE Economics subject heading at www.edexcel.org.uk.

Edexcel, a Pearson company, is the UK’s largest awarding body, offering academic and vocational qualifications and testing to more than 25,000 schools, colleges, employers and other places of learning in the UK and in over 100 countries worldwide. Qualifications include GCSE, AS and A Level, NVQ and our BTEC suite of vocational qualifications from entry level to BTEC Higher National Diplomas, recognised by employers and higher education institutions worldwide.
We deliver 9.4 million exam scripts each year, with more than 90% of exam papers marked onscreen annually. As part of Pearson, Edexcel continues to invest in cutting-edge technology that has revolutionised the examinations and assessment system. This includes the ability to provide detailed performance data to teachers and students which helps to raise attainment.
Acknowledgements
This document has been produced by Edexcel on the basis of consultation with teachers, examiners, consultants and other interested parties. Edexcel acknowledges its indebtedness to all those who contributed their time and expertise to its development.
References to third-party material made in this document are made in good faith. Edexcel does not endorse, approve or accept responsibility for the content of materials, which may be subject to change, or any opinions expressed therein. (Material may include textbooks, journals, magazines and other publications and websites.)
Authorised by Roger Beard Prepared by Sara Furness
Publications code UA019571
All the material in this publication is copyright © Edexcel Limited 2008
This specification is Issue 2. Key changes are sidelined. We will inform centres of any changes to this issue. The latest issue can be found on the Edexcel website: www.edexcel.org.uk.

Further copies of this publication are available from Edexcel Publications, Adamsway, Mansfield, Notts, NG18 4FN
Telephone: 01623 467467 Fax: 01623 450481 Email: [email protected]
Publications code UA019571
For more information on Edexcel and BTEC qualifications please visit our website: www.edexcel.org.uk
Edexcel Limited. Registered in England and Wales No. 4496750 Registered Office: One90 High Holborn, London WC1V 7BH. VAT Reg No 780 0898 07