Embed Size (px)
Citation preview
1
Gatwick Airport Flight Performance Team
Quarterly report for the period January to March 2012
About Gatwick Airport
Gatwick Airport opened in 1958 with just over 186,000 passengers passing through in our first year of operation. Today, it's a different story. We're open 24 hours a day, 365 days a year, and we now serve almost 34 million passengers every year.
Gatwick is one of the top ten international airports in the world and the second largest in the UK. Around 90 carriers operate from the airport including British Airways, easyJet, Emirates, Monarch Airlines, Thomas Cook, Thomson Airways and Virgin Atlantic. It is the best connected point-to-point airport in Europe welcoming almost 33.8 million passengers (March 2012) a year flying to more than 200 destinations.
The airport is 28 miles south of London with excellent public transport links. Gatwick Airport is owned by a group of international investment funds, of which Global Infrastructure Partners (GIP) is the controlling shareholder. Over the next 10 years we want Gatwick to become London’s airport of choice delivering great service to more than 40 million passengers each year.
Security, safety and responsibly managing our environmental impact are always our top priorities.
About this report
This report is produced by the Gatwick Flight Performance Team (FPT). This team is responsible
for recording, investigating and responding to aircraft noise enquiries as well as monitoring airline
compliance to noise mitigation measures as detailed in the UK Aeronautical Information
Publication (AIP). This department also actively engages with the airlines to improve their
adherence to the above noise mitigation measures and in addition manages the night-time
restrictions on flying at Gatwick.
This report contains detailed data on aircraft activity at Gatwick including the adherence to the
noise mitigation measures detailed in the UK AIP, a report on night flying during the quarter, an
update on the community noise monitoring programme and an analysis of complaints / enquires
received during the period.
Flight Performance Team commentary
A final summary report of the temporary noise group was presented to NATMAG for discussion,
and at this time there are no plans for any further meetings of this particular group. The report
highlighted key areas of discussion and some possible options for moving forward, which will of
course be progressed through the appropriate governance structure.
A report on approach noise at Gatwick, produced by the Gatwick Area Conservation Campaign
was also discussed at the last NATMAG. Gatwick Airport has committed to providing responses to
the issues and suggestions raised in that report.

2
Key Monitoring Indicators – 1st Quarter 2012
12 month averages
Parameter Current year Previous year 2006 Baseline
Track keeping performance (% on track) ▲ 97.40 97.18 98.17
24hr CDA (% achievement) ▲ 90.69 90.17 80.79
Day/Shoulder CDA (% achievement) ▲ 90.44 89.81 79.90
Core night CDA (% achievement) ▼ 93.50 93.74 89.60
1000ft Infringements (No.) ▼ 5 6 11
1000ft Infringements (No. below 900ft) ▲ 2 0 6
Departure Noise Infringements (Day) - 0 0 10
Departure Noise Infringements (Night/Shoulder)
▲ 4
0
2
Complaint Callers (No.) ▼ 360 406 587
Complaint Enquiries (No.) ▼ 2404 5073 4791
Complaint response performance target is 95% within 8 days
▼ 92.06 98.26
West/East Runway Split (%) - 70/30 61/39 68/32
Performance Headlines
Over a 12 month average, two of the Continuous Descent Approaches (CDA) indicators for the
various time periods remain ‘green’, continuing the ongoing trend for improved CDA achievement
at Gatwick Airport. The exception is the night-time CDA achievement rate which has dropped
compared to last year. It is expected that the night-time achievement rate will indeed remain lower
than its recent average until the main runway resurfacing works are completed. These works will
be happening during the night time, when the Northern runway will be utilised. Because of the
absence of descent profile guidance from an ILS necessitates a phase of level flight prior to the
initiation of Ground Control Approach by Gatwick Air Traffic Control. Even so in the last 3 years the
12 month average has increased from 80% to the current level of 90%. The FPT continues to work
with airlines on improving their performance with regular reviews and data gathering exercises.
Track keeping performance has shown another small improvement on the previous year’s
performance. It should be noted that some Gatwick departure routes have turns of 90�� and 180�
which, when they were first designed, were easier to fly with older, slower aircraft, although they
remained lower on the route for longer. Track deviations occur on all routes. However at Gatwick
Airport the 26 Lambourne wrap around route has the largest proportion. Further details on track
keeping will follow later in this report.
As part of our continuing commitment to increase on track performance the FPT also continues to
engage with the airlines directly and through the Flight Operations Performance and Safety
Committee on a range of initiatives.
The number of enquiries has reduced considerably compared to the previous twelve months, with
the number of complainants down by 10% and enquiries down by more than 50%.
The postcode areas with the greatest number of complainants this quarter were, East Grinstead,
Edenbridge (which includes surrounding villages), Horley and Crawley.

3
Airport Operations
During the quarter, there were a total of 52,961 fixed wing aircraft movements at Gatwick. This
represents an approximate 4.0% decrease in aircraft traffic compared to the same period in 2011.
The direction of operation is determined by wind direction and was split 65% on the westerly
runway and 35% on the easterly runway.
Northern Runway (26R/08L) usage
During this time there were 738 movements from the northern runway of which 697 took place in
March. The northern runway is normally only utilised during the night when maintenance on the
main runway is planned. The main runway is being rehabilitated during 2012 and 2013. These
works commenced in March 2012 and are due to continue until September, and will require
extensive periods of northern runway operations during the night time period. Although Gatwick
has a main runway and the ‘reserve’ northern runway, they cannot be operated simultaneously.
Complaint response time
This quarter the percentage of enquiries that have been responded to within 8 days was 92.06%. A
full breakdown of complaint information is produced later in this report.
Airline Communications
The Flight Operations Performance & Safety Committee (FLOPSC) meets bi-monthly. At these
meetings performance statistics in relation to the 1000ft by 6.5km from start of roll (SOR)
requirement, departure track keeping, departure noise infringements, and CDA statistics are
routinely discussed.
As part of our normal process the FPT sends details of track deviations to the appropriate airline so
those details can be passed on to the relevant training captain or chief pilot so they can work with
their flight crews to improve future performance. As part of our ongoing work with the airlines and
NATS at FLOPSC, there has been increased uptake in the number of departing flights being
granted PRNAV departures, which should in turn have an overall positive effect on departure track
keeping performance. The FPT will continue to monitor PRNAV uptake.
The Airline performance statistics relating to both track keeping and CDA achievement are now
being circulated to a much wider airline audience each month. This includes all domestic airlines
and the majority of foreign operators. Work continues to ensure that we are able to circulate these
statistics to all airlines that operate at Gatwick.
The FPT endeavours to send details of all track deviations or unusual activity to the appropriate
airline and frequently receives welcome feedback on measures employed by them to reduce
further reoccurrences. The FPT also offers to work with airlines to improve their track keeping at
FLOPSC meetings.
Community Noise Monitoring
The Gatwick Noise Monitoring Group is a forum where Local Authority technical experts and
independent consultants meet with Gatwick Airport Ltd to discuss the location of mobile noise
4
monitors, the duration they are to be onsite and to review and verify the data. This group also
makes recommedations on monitor locations and also on the format the data should be reported to
the Noise & Track Monitoring Advisory Group (NATMAG) and the wider community. Mobile noise
monitors are currently deployed in Lingfield, Rusper, Okewood Hill, Hever, Leigh (Surrey) and
another in Haywards Heath, West Sussex. There is also an inactive mobile noise monitor in Hever.
Sustainable Aviation
Gatwick Airport Ltd is a member of Sustainable Aviation. This is a long term strategy which sets out the collective approach of UK aviation to tackling the challenge of ensuring a sustainable future for our industry. Sustainable Aviation was launched in 2005 and brings together the main players from UK airlines, airports, manufacturers and air navigation service providers
The FPT Manager is a member of the Sustainable Aviation Improvements Group. The ‘mission statement’ of this group is “Working with the industry in the UK and internationally to trial & implement innovative low noise and emission procedures”.
Progress made to date includes ‘Towards the Perfect Flight DVD’, a ‘Perfect Flight’ live trial and ongoing work with the ‘Departures Code of Practice’. As mentioned on the cover page of this report, work is ongoing regarding Continuous Climb Departures which is a similar concept to Continuous Descent Arrivals. For more information visit: www.sustainableaviation.co.uk
Community Communications
The END noise action plan was formally adopted by the Secretary of State on 19th May 2011. The action plan details 50 plus actions that the airport will deliver during the period covering 2010 - 2015. We have already been active in delivering against the 2010 actions proposed and are therefore well on schedule with our plan. Progress will be reported through our S106 annual monitoring report as the END noise action plan will replace our S106 interim noise action plan.
WebTrak
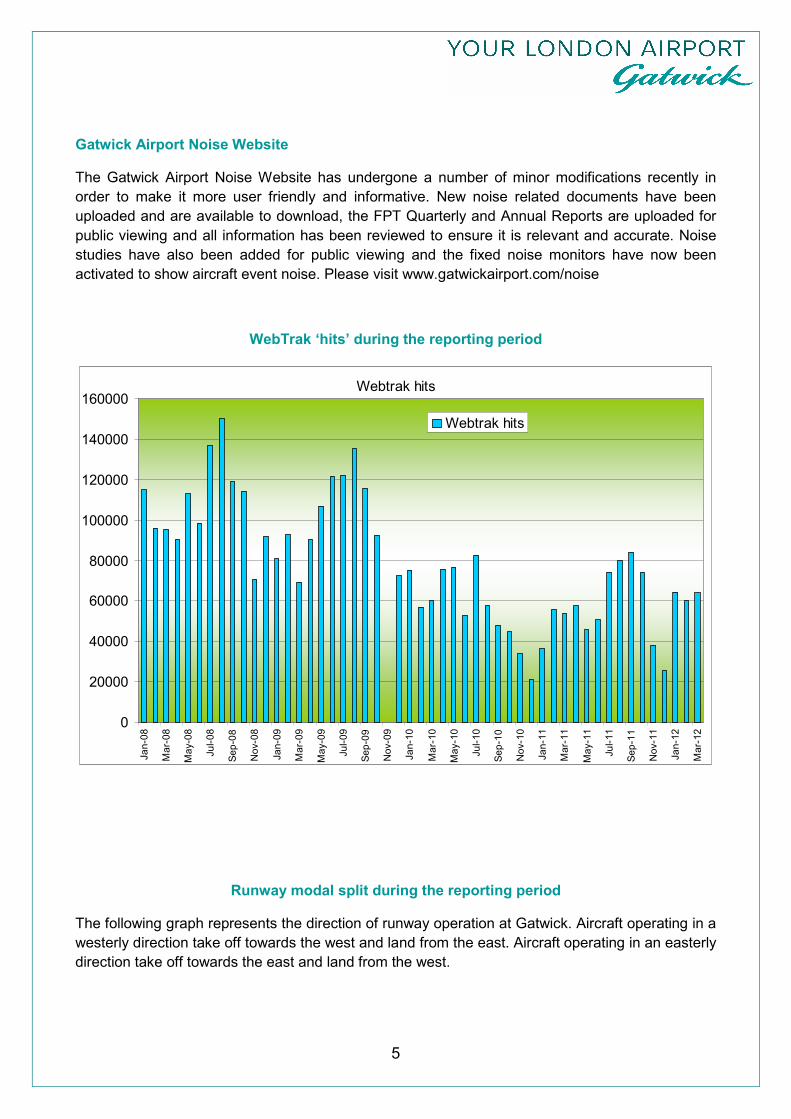
Gatwick Airport Limited offers a web based flight tracking application called WebTrak. This facility
allows members of the public to track Gatwick flights. An updated version was released in 2010
and was designed to be more user friendly, with a number of additional enhancements that
improves on the look and feel from the original. Since its introduction this has proven to be very
popular and a useful tool for communities affected by noise. Details of the number of WebTrak hits
are shown on the following page.
Complaints Handling Policy
The noise complaint handling policy established in December 2008 and amended in May 2010
continues to be applied consistently by the FPT when dealing with noise related enquiries. This
policy is displayed on the Gatwick Airport noise website.
In order to provide a co-ordinated and accurate response to complaints, the FPT continues to
engage actively with colleagues within NATS, the CAA, DfT and other organisations when dealing
with noise related enquiries.
5
Gatwick Airport Noise Website
The Gatwick Airport Noise Website has undergone a number of minor modifications recently in
order to make it more user friendly and informative. New noise related documents have been
uploaded and are available to download, the FPT Quarterly and Annual Reports are uploaded for
public viewing and all information has been reviewed to ensure it is relevant and accurate. Noise
studies have also been added for public viewing and the fixed noise monitors have now been
activated to show aircraft event noise. Please visit www.gatwickairport.com/noise
WebTrak ‘hits’ during the reporting period
Webtrak hits
0
20000
40000
60000
80000
100000
120000
140000
160000
Jan-08
Mar-08
May-08
Jul-08
Sep-08
Nov-08
Jan-09
Mar-09
May-09
Jul-09
Sep-09
Nov-09
Jan-10
Mar-10
May-10
Jul-10
Sep-10
Nov-10
Jan-11
Mar-11
May-11
Jul-11
Sep-11
Nov-11
Jan-12
Mar-12
Webtrak hits
Runway modal split during the reporting period
The following graph represents the direction of runway operation at Gatwick. Aircraft operating in a
westerly direction take off towards the west and land from the east. Aircraft operating in an easterly
direction take off towards the east and land from the west.

6
Runway Modal Split
0%
10%
20%
30%
40%
50%
60%
70%
80%
90%
100%
Apr-10
May-10
Jun-10
Jul-10
Aug-10
Sep-10
Oct-10
Nov-10
Dec-10
Jan-11
Feb-11
Mar-11
Apr-11
May-11
Jun-11
Jul-11
Aug-11
Sep-11
Oct-11
Nov-11
Dec-11
Jan-12
Feb-12
Mar-12
Month
Percentage Westerly
Easterly
3 monthly mov avg (w esterly %)
The Aeronautical Information Publication
An Aeronautical Information Publication (or AIP) is defined by the International Civil Aviation
Organisation (ICAO) as a publication issued by or with the authority of a state and containing
aeronautical information of a lasting character essential to air navigation.
It is designed to be a manual containing thorough details of regulations, procedures and other
information pertinent to flying aircraft in the particular country to which it relates. It is usually issued
by or on behalf of the respective civil aviation administration.
The structure and contents of AIPs are standardised by international agreement through ICAO.
AIPs normally have three parts - GEN (general), ENR (en route) and AD (aerodromes).
The Gatwick Aerodrome AIP contains details regarding the noise mitigation measures in place and
adherence to these is reported in this section.
Adherence to noise mitigation measures as detailed in the Gatwick AIP
Each element of this report is preceded where applicable by the relevant Aeronautical Information
Publication (AIP) reference and summary text detailing the purpose of the requirement. Data is
then presented on current performance.

7
It should be noted that Gatwick is 202ft above mean sea level and the ANOMS NTK system
measures height relative to Gatwick elevation and not sea level.
References in the AIP are usually above sea level (quoted as Gatwick QNH) and therefore need to
be reduced by 202ft to be comparable with heights as measured by ANOMS. For example the
requirement to join the ILS at 3000ft would equate to 2798ft in the ANOMS.
No account is taken of the variability of heights as measured by the radar which, depending on the
distance from the radar head, can be +/- 200ft from that indicated. This is obviously allowed for by
NATS when managing operations.
FOR THE PURPOSES OF THIS REPORT ANY REFERENCE TO HEIGHT
SHOULD BE READ AS ABOVE AIRFIELD ELEVATION UNLESS OTHERWISE
STATED.
ALL DATA CONTAINED WITHIN THIS REPORT SHOULD BE CONSIDERED IN
LIGHT OF THE PRECEDING TEXT AND THE COMMENTARY THAT FOLLOWS.
DEPARTURES - INITIAL CLIMB PERFORMANCE
EGKK AD 2.21 (3 (1) ). After take-off the aircraft shall be operated in such a way that it is at a height of
not less than 1000 ft aal (above airfield level) at 6.5 km from start of roll as measured along the
departure track of the aircraft. This is to ensure departing aircraft achieve at least that climb gradient in
order to reduce the impact on the ground.
Comment:
There were two 1,000 feet infringements that occurred during the quarter. On 7 February at 12.06 an Air Vietnam Boeing 777 passed the 6.5km point at a height of 823 feet. This new airline operator has been contacted and no further infringements have been recorded since. On 23 March at 22:17 an Airbus A340-300 operated by Air Asia X passed the 6.5km point at a height of 891 feet. This airline has stopped operating a scheduled service from Gatwick from April onwards.
The summer months are typically the peak period for aircraft failing to meet the 1,000ft requirement
primarily due to the warmer weather, which reduces aircraft climb performance.

8
1000ft Infringement Table
Year Total Infringements Year Total Infringements Year Total Infringements
2005 28 2008 11 2011 3
2006 11 2009 22 2012 2
2007 26 2010 6
Departure Monitoring 1,000ft (AAL) from Start of Roll
0
2
4
6
8
10
12
Jan Feb Mar Apr May Jun Jul Aug Sep Oct Nov Dec
Month
Aircraft below 1,000ft
2004
2005
2006
2007
2008
2009
2010
2011
2012
DEPARTURES - NOISE INFRINGEMENTS
Departure Noise Limits (Daytime)
EGKK AD 2.21(3(3)) Subject to sub-paragraphs (5) and (6) below, any aircraft shall, after take-off, be
operated in such a way that it will not cause more than 94 dBA Lmax by day 0700 to 2300 hours local
time) as measured at any noise monitoring terminal at any of the sites referred to in sub-paragraph (2).
This is to ensure that departing aircraft do not exceed the stated level during the day.
Year Number of Day Infringements
Year Number of Day Infringements
Year Number of Day Infringements
2005 29 2008 2 2011 0
2006 9 2009 0 2012 0
2007 13 2010 0
9
Comment:
There were no infringements of the noise limits during the day time period during the quarter.
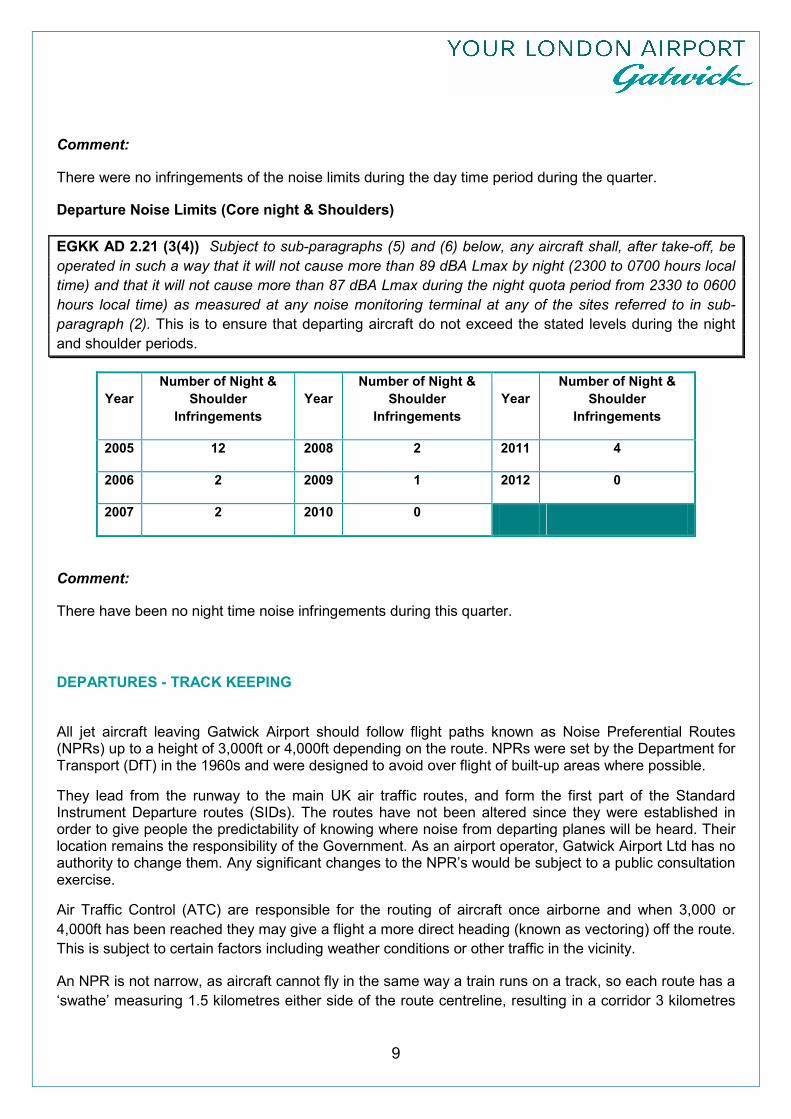
Departure Noise Limits (Core night & Shoulders)
EGKK AD 2.21 (3(4)) Subject to sub-paragraphs (5) and (6) below, any aircraft shall, after take-off, be
operated in such a way that it will not cause more than 89 dBA Lmax by night (2300 to 0700 hours local
time) and that it will not cause more than 87 dBA Lmax during the night quota period from 2330 to 0600
hours local time) as measured at any noise monitoring terminal at any of the sites referred to in sub-
paragraph (2). This is to ensure that departing aircraft do not exceed the stated levels during the night
and shoulder periods.
Year
Number of Night &
Shoulder
Infringements
Year
Number of Night &
Shoulder
Infringements
Year
Number of Night &
Shoulder
Infringements
2005 12 2008 2 2011 4
2006 2 2009 1 2012 0
2007 2 2010 0
Comment:
There have been no night time noise infringements during this quarter.
DEPARTURES - TRACK KEEPING
All jet aircraft leaving Gatwick Airport should follow flight paths known as Noise Preferential Routes (NPRs) up to a height of 3,000ft or 4,000ft depending on the route. NPRs were set by the Department for Transport (DfT) in the 1960s and were designed to avoid over flight of built-up areas where possible.
They lead from the runway to the main UK air traffic routes, and form the first part of the Standard Instrument Departure routes (SIDs). The routes have not been altered since they were established in order to give people the predictability of knowing where noise from departing planes will be heard. Their location remains the responsibility of the Government. As an airport operator, Gatwick Airport Ltd has no authority to change them. Any significant changes to the NPR’s would be subject to a public consultation exercise.
Air Traffic Control (ATC) are responsible for the routing of aircraft once airborne and when 3,000 or
4,000ft has been reached they may give a flight a more direct heading (known as vectoring) off the route.
This is subject to certain factors including weather conditions or other traffic in the vicinity.
An NPR is not narrow, as aircraft cannot fly in the same way a train runs on a track, so each route has a
‘swathe’ measuring 1.5 kilometres either side of the route centreline, resulting in a corridor 3 kilometres

10
wide. As long as aircraft remain within this ‘swathe’ they are deemed to be on track, there is no
requirement to follow the route centreline.
Any flight leaving the route below the required height (a track deviation) is automatically tagged by a
Noise and Track Keeping System in the Flight Evaluation Unit at Gatwick Airport. Details of all track
deviations are supplied to our Flight Operations Performance & Safety Committee and discussed at their
bi-monthly meetings.
Comment:
The table below shows track keeping performance over the previous 12 month period. Compared to the
fourth quarter 2011 the on track performance has improved over the past three months and for the rolling
12 month year on year period the on track performance stands at 97.40% as opposed to 97.18% for the
12 months ended March 2011.
Total Westerly Easterly
Month Deviations Departures %
Deviations Deviations Departures %
Deviations Deviations Departures %
Deviations
Apr-11 146 10450 1.40% 119 4444 2.68% 27 5980 0.45%
May-11 343 11258 3.05% 334 8898 3.75% 9 2327 0.39%
Jun-11 436 11431 3.81% 417 8469 4.92% 19 2950 0.64%
Jul-11 443 12215 3.63% 421 7855 5.36% 22 4373 0.50%
Aug-11 425 12508 3.40% 414 10060 4.12% 11 2448 0.45%
Sep-11 432 11689 3.70% 411 9672 4.25% 21 2017 1.04%
Oct-11 279 10948 2.55% 257 7878 3.26% 22 2908 0.76%
Nov-11 157 8344 1.88% 133 3847 3.46% 24 4479 0.54%
Dec-11 169 8962 1.89% 1 69 1.45% 168 8889 1.89%
Jan-12 94 8637 1.09% 8 2236 0.36% 86 6401 1.34%
Feb-12 97 8381 1.16% 14 2997 0.47% 83 5384 1.54%
Mar-12 212 9361 2.26% 64 4212 1.52% 148 5149 2.87%

11

12
DEPARTURES - OVER CONGESTED AREAS
The WIZAD Noise Preferential Route
EGKK AD 2.21 (8) (c) The ATC clearance via Mayfield specified in the second column of the table will not
be available between 2300 hours and 0700 hours local time. Aircraft following the Noise Preferential
Routing which relates to that clearance shall not fly over Crawley, Crawley Down or East Grinstead. This is
to avoid aircraft noise from departing aircraft over areas of high population at night on the 26WIZAD NPR.
Comment:
This quarter there have been no departures during the restricted period, on the ’26 WIZAD’ Noise
Preferential Route.
MAP ILLUSTRATING THE LOCATION OF THE ‘WIZAD’ NOISE PREFERENTIAL ROUTE

13
Crawley overflight
EGKK AD 2.21 (9) After take-off the aircraft shall avoid flying over the congested areas of Horley and
Crawley This is to avoid aircraft noise from departing aircraft over areas of high population
Comment:
During this monitoring period there were no departing aircraft that over-flew Crawley town.
MAP ILLUSTRATING CRAWLEY OVERFLIGHT ANALYSIS GATE

14
Horley overflight
MAP ILLUSTRATING HORLEY OVERFLIGHT FLIGHT ANALYSIS ‘GATE’ AND AIRCRAFT TRACKS
(Jan – Mar 2012)
ANALYSIS OF HORLEY OVERFLIGHT
Month Departures on 26LAM
Horley gate
% through Horley gate
Month Departures on 26LAM
Horley gate
% through Horley gate
Month Departures on 26LAM
Horley gate
% through Horley gate
Jan-10 2024 85 4.20% Jan-11 2270 79 3.48% Jan-12 2835 109 3.84
Feb-10 2212 63 2.85% Feb-11 2721 76 2.79% Feb-12 2326 99 4.26
Mar-10 2681 82 3.06% Mar-11 1540 55 3.57% Mar-12 2176 84 3.86
Apr-10 2076 60 2.89% Apr-11 1841 43 2.34% Apr-12
May10 2159 62 2.87% May11 3980 98 2.46% May12
Jun-10 2420 74 3.06% Jun-11 3675 92 2.50% Jun-12
Jul-10 5117 127 2.48% Jul-11 3262 127 3.89% Jul-12
Aug10 4405 153 3.47% Aug11 4319 98 2.27% Aug12
Sep-10 3967 128 3.23% Sep11 4321 65 1.50% Sep12
Oct-10 3206 114 3.56% Oct 11 3487 101 2.90% Oct 12
Nov-10 2334 90 3.86% Nov11 1753 28 1.60% Nov12
Dec-10 1505 89 5.91% Dec11 3903 162 4.15% Dec12

15
HORLEY GATE PENETRATION GRAPH
Comment:
NATS implemented a plan in 2010 to reduce such incidents. Air Traffic Controllers were reminded that no flights should over-fly Horley. They also made changes to the standard routings for aircraft positioning from London Heathrow to Gatwick in order to avoid over-flight of Horley. The FPT continues to monitor and report this so that performance can be monitored and improved over time.
The jet aircraft with the lowest recorded height was a Cimber Sterling, Canadair Regional Jet which over-flew the town at a height of 4,553ft above airfield elevation. The average height of Gatwick aircraft passing over the town was 7060 ft.
ARRIVALS – CONTINUOUS DESCENT APPROACHES (CDA)
EGKK AD 2.21 (10) Where the aircraft is approaching the aerodrome to land it shall commensurate with it
ATC clearance minimise noise disturbance by the use of continuous decent and low power, low drag,
operating procedures (referred to in Detailed Procedures for descent clearance in AD (2-EGKK-1-17).
Where the use of these procedures is not practicable, the aircraft shall maintain as high an altitude as
possible. In addition, when descending on initial approach including in the closing heading, and on
intermediate and final approach, thrust reductions should be achieved where possible by maintaining a
'clean' aircraft configuration and by landing with reduce flaps, provided that in all the circumstances of the
flight this is consistent with safe operation of the aircraft. This is to avoid prolonged periods of level flight
and keep aircraft as high as possible for as long as possible.

16
CDA data is measured over three time periods, the core night period (2330-0600), the day and
shoulder periods (06:00 – 2330) and the 24hour period.
CORE NIGHT PERIOD
Comment:
During the quarter the core night-time CDA achievement rate has dropped to 87.60% from 93.70%
recorded in the previous quarter. Although there was no explanation for the slight fall in performance during
January and February, the closure of the main runway in March would appear to have had a major effect on
the CDA performance rate. This effect was also apparent when the main runway was resurfaced over 10
years ago. The 12 month rolling average for night time achievement is now 93.50% of all arrivals. This
compares with an average achievement rate for the preceding twelve month period ended Mar 2011 of
93.74%. Due to the main runway resurfacing works it is expected that the night time CDA performance will
reduce over the next few months.
BREAKDOWN OF CORE NIGHT CDA DATA
Month All Arrivals 08 Easterly Arrivals 26 Westerly Arrivals
Total Non CDA CDA Total Non CDA CDA Total Non CDA CDA
Apr-11 805 58 92.80% 406 19 95.32% 399 39 90.23%
May-11 1030 68 93.40% 192 12 93.75% 838 56 93.32%
Jun-11 1237 48 96.12% 269 6 97.77% 968 42 95.66%
Jul-11 1454 89 93.88% 533 44 91.74% 921 45 95.11%
Aug-11 1510 92 93.91% 225 12 94.67% 1285 80 93.77%
Sep-11 1358 78 94.26% 284 20 92.96% 1074 58 94.60%
Oct-11 990 50 94.95% 287 13 95.47% 703 37 94.74%
Nov-11 252 15 94.05% 155 6 96.13% 97 9 90.72%
Dec-11 282 31 89.01% 15 5 66.67% 267 26 90.26%
Jan-12 227 26 88.55% 57 4 92.98% 170 22 87.06%
Feb-12 270 25 90.74% 98 13 86.73% 172 12 93.02%
Mar-12 358 55 84.64% 190 29 84.74% 168 26 84.52%

17
CORE NIGHT PERIOD COMPLIANCE RATE GRAPH
Gatwick Night Time CDA Achievement (23:30-06:00) with quarterly trend line
0.00%
10.00%
20.00%
30.00%
40.00%
50.00%
60.00%
70.00%
80.00%
90.00%
100.00%
Jul-10
Aug-10
Sep-10
Oct-10
Nov-10
Dec-10
Jan-11
Feb-11
Mar-11
Apr-11
May-11
Jun-11
Jul-11
Aug-11
Sep-11
Oct-11
Nov-11
Dec-11
Jan-12
Feb-12
Mar-12
Month
% CDA Achievement
DAYTIME AND SHOULDER PERIOD
Comment:
The average daytime and shoulder period achievement rate for this period (Q1 2012) is 91.20% compared
to 90.67% for Q4 2011. The twelve month period to the end of March 2012 shows an achievement rate of
90.44 % compared to 89.81% for the same period ending March 2011.

18
BREAKDOWN OF DAYTIME & SHOULDER PERIOD DATA
DAY & SHOULDER PERIOD COMPLIANCE RATE GRAPH
All Arrivals
08R Easterly Arrivals 26L Westerly Arrivals
Month Total Non CDA
CDA Total Non CDA CDA Total Non CDA
CDA
Apr-11 9584 913 90.47% 5430 540 90.06% 4154 373 91.02%
May-11 10224 943 90.78% 2136 192 91.01% 8088 751 90.71%
Jun-11 10172 1026 89.91% 2474 241 90.26% 7698 785 89.80%
Jul-11 10767 1166 89.17% 3758 419 88.85% 7009 747 89.34%
Aug-11 11008 1065 90.33% 2137 241 88.72% 8871 824 90.71%
Sep-11 10341 1079 89.57% 1820 167 90.82% 8521 912 89.30%
Oct-11 9843 821 91.66% 2667 186 93.03% 7176 635 91.15%
Nov-11 8085 771 90.46% 4459 512 88.52% 3626 259 92.86%
Dec-11 8693 892 89.74% 138 10 92.75% 8555 882 89.69%
Jan-12 8406 754 91.03% 2182 155 92.90% 6224 599 90.38%
Feb-12 8107 647 92.02% 2800 259 90.75% 5307 388 92.69%
Mar-12 9019 847 90.61% 3980 423 89.37% 5039 424 91.59%
Gatwick Day & Shoulder CDA Achievement (0600 - 2330) with quarterly trend line
0%
10%
20%
30%
40%
50%
60%
70%
80%
90%
100%
Apr-11
May-11
Jun-11
Jul-11
Aug-11
Sep-11
Oct-11
Nov-11
Dec-11
Jan-12
Feb-12
Mar-12
Month
Percentage CDA

19
24 HOUR PERIOD
Comment:
The 24 hour CDA achievement rate for the year ended March 2012 was 90.69%, compared to 90.17% for
the corresponding period to March 2011. Most months we now see achievement rates close to or above
90%.
BREAKDOWN OF 24 HOUR PERIOD DATA
All Arrivals 08R Easterly Arrivals 26L Westerly Arrivals
Month Total Non CDA
% CDA Total Non CDA % CDA Total Non CDA
% CDA
Apr-11 10389 971 90.65% 5836 559 90.42% 4553 412 90.95%
May-11 11254 1011 91.02% 2328 204 91.24% 8926 807 90.26%
Jun-11 11409 1074 90.59% 2743 247 91.00% 8666 827 90.46%
Jul-11 12221 1255 89.73% 4291 463 89.21% 7930 792 90.01%
Aug-11 12518 1157 90.76% 2362 253 89.29% 10156 904 91.10%
Sep-11 11699 1157 90.11% 2104 187 91.11% 9595 970 89.89%
Oct-11 10833 871 91.96% 2954 199 93.26% 7879 672 91.47%
Nov-11 8337 786 90.57% 4614 518 88.77% 3723 268 92.80%
Dec-11 8975 923 89.72% 153 15 90.20% 8822 908 89.71%
Jan-12 8633 780 90.96% 2239 159 92.90% 6394 621 90.29%
Feb-12 8377 659 92.13% 2898 263 90.92% 5479 396 92.77%
Mar-12 9377 902 90.38% 4170 452 89.16% 5207 450 91.36% 24 HOUR PERIOD COMPLIANCE
RATE
Gatwick 24 Hr Period CDA Achievement
70%
75%
80%
85%
90%
95%
100%
Apr-11
May-11
Jun-11
Jul-11
Aug-11
Sep-11
Oct-11
Nov-11
Dec-11
Jan-12
Feb-12
Mar-12
Month
Percentage CDA Achievement
% CDA
3 per. Mov. Avg. (% CDA)
20
ARRIVALS – OVER CONGESTED AREAS
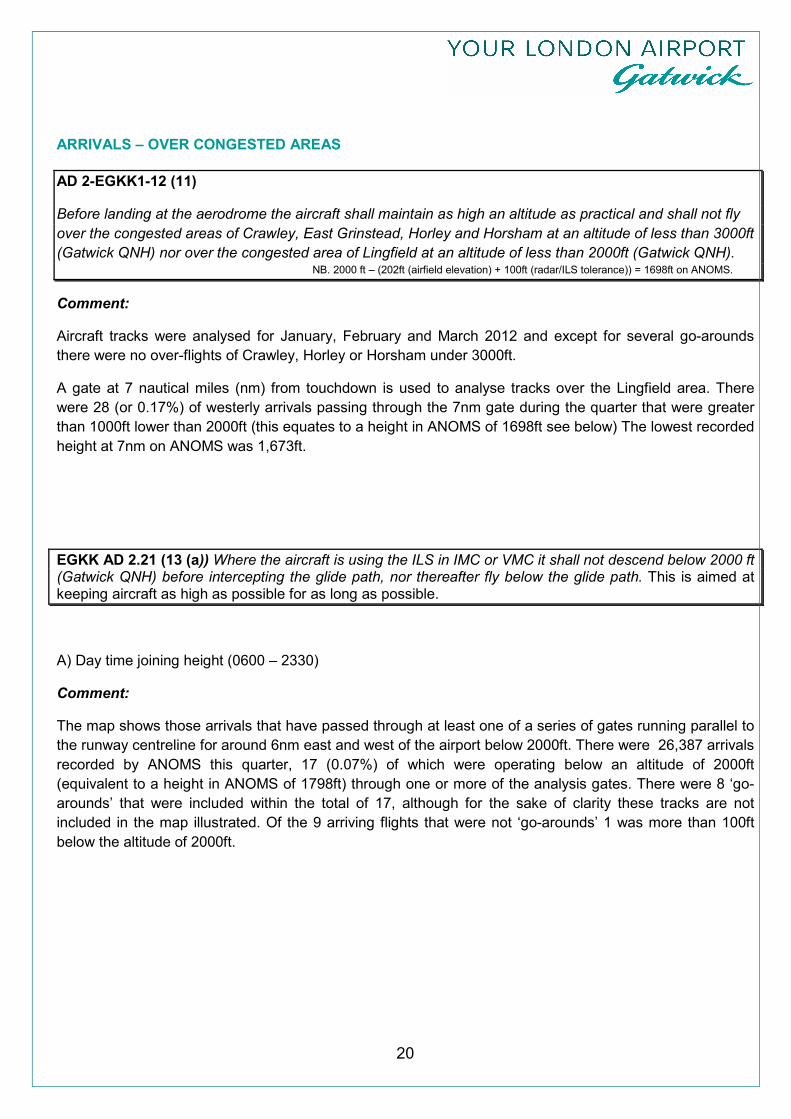
AD 2-EGKK1-12 (11)
Before landing at the aerodrome the aircraft shall maintain as high an altitude as practical and shall not fly
over the congested areas of Crawley, East Grinstead, Horley and Horsham at an altitude of less than 3000ft
(Gatwick QNH) nor over the congested area of Lingfield at an altitude of less than 2000ft (Gatwick QNH). NB. 2000 ft – (202ft (airfield elevation) + 100ft (radar/ILS tolerance)) = 1698ft on ANOMS.
Comment:
Aircraft tracks were analysed for January, February and March 2012 and except for several go-arounds
there were no over-flights of Crawley, Horley or Horsham under 3000ft.
A gate at 7 nautical miles (nm) from touchdown is used to analyse tracks over the Lingfield area. There
were 28 (or 0.17%) of westerly arrivals passing through the 7nm gate during the quarter that were greater
than 1000ft lower than 2000ft (this equates to a height in ANOMS of 1698ft see below) The lowest recorded
height at 7nm on ANOMS was 1,673ft.
EGKK AD 2.21 (13 (a)) Where the aircraft is using the ILS in IMC or VMC it shall not descend below 2000 ft (Gatwick QNH) before intercepting the glide path, nor thereafter fly below the glide path. This is aimed at keeping aircraft as high as possible for as long as possible.
A) Day time joining height (0600 – 2330)
Comment:
The map shows those arrivals that have passed through at least one of a series of gates running parallel to
the runway centreline for around 6nm east and west of the airport below 2000ft. There were 26,387 arrivals
recorded by ANOMS this quarter, 17 (0.07%) of which were operating below an altitude of 2000ft
(equivalent to a height in ANOMS of 1798ft) through one or more of the analysis gates. There were 8 ‘go-
arounds’ that were included within the total of 17, although for the sake of clarity these tracks are not
included in the map illustrated. Of the 9 arriving flights that were not ‘go-arounds’ 1 was more than 100ft
below the altitude of 2000ft.

21
MAP ILLUSTRATING THE ANOMS LATE ANALYSIS GATES WITH URBAN AREA ANNOTATED
EGKK AD 2.21 (14) Between the hours of 2330 (local) to 06:00 (local), inbound aircraft, whether or not making use of the ILS localiser and irrespective of weight or type of approach, shall not join the centre-line below 3000ft (Gatwick QNH) closer than 10 nm touchdown. This aims to keep aircraft higher for longer and avoid overflying areas en route to the ILS below 3000ft.
B) Night joining height & distance
Comment:
ANOMS was introduced in June 2007 and this corresponds to the rise in aircraft joining below 3000ft,
however this was not the reason. Previously only aircraft below 2598ft at 10nm would have been recorded
which takes account of the 202ft elevation of Gatwick and the 200ft tolerance of the radar equipment. This
metric is primarily used by NATS to ensure compliance and in allowing for these tolerances it is reasonable
for a controller to assume that if an aircraft displays an altitude of 2800ft on their system it is compliant with
the 3000ft requirements. The same aircraft would be at 2598ft above the airfield as displayed on the
Gatwick ANOMS (or any NTK) system. Since June 2007 statistics have only taken account of the airfield
elevation and consequently any aircraft below 2798ft at 10nm has been flagged.

22
JOINING POINT GRAPH
Night Joining Point
0
2
4
6
8
10
12
14
Oct-10
Nov-10
Dec-10
Jan-11
Feb-11
Mar-11
Apr-11
May-11
Jun-11
Jul-11
Aug-11
Sep-11
Oct-11
Nov-11
Dec-11
Jan-12
Feb-12
Mar-12
Month
% Joining at less than 10nm
% Joining below 3000ft (measured to 2598ft)
% Joining below 3000ft (measured to 2798ft)
GO - AROUNDS
A go-around is a procedure adopted when an arriving aircraft on final approach aborts landing by applying
take off power and climbing away from the airport. It is a set procedure to be followed by the flight crew in
the event of an aircraft being unable to land. The procedure is published so that Air Traffic Control (ATC)
and the pilots can anticipate where the aircraft will go following the decision to go-around.
The number and reasons for go-arounds are routinely discussed at FLOPSC meetings and Pilot Forums.
All parties are focussed on minimising the number of occasions when a go around is required but expect
some to occur given the fact that Gatwick is a busy single runway airport. It should be stated that there are
well established standard procedures which both pilots and controllers are trained in and are familiar with.
Gatwick Airport Ltd as the airport operator actively encourages airlines operating at the airport to fly to the
best possible environmental standards. However safety must and always will be the number one priority.
23
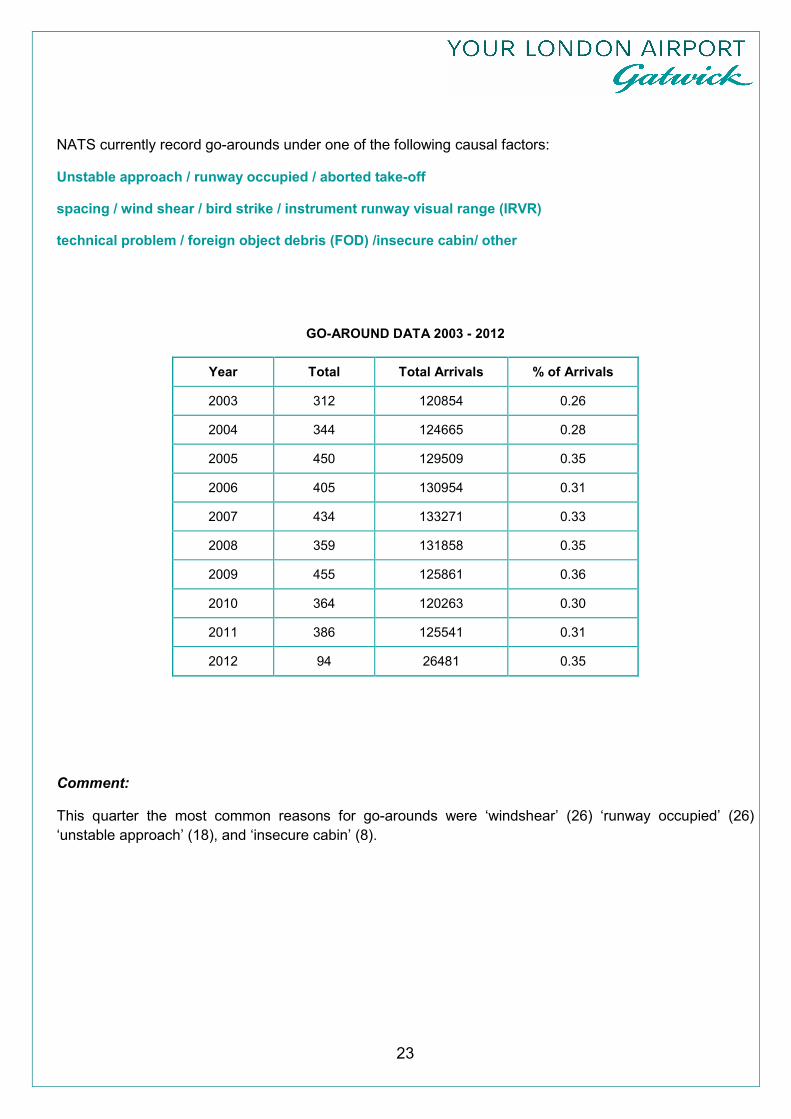
NATS currently record go-arounds under one of the following causal factors:
Unstable approach / runway occupied / aborted take-off
spacing / wind shear / bird strike / instrument runway visual range (IRVR)
technical problem / foreign object debris (FOD) /insecure cabin/ other
GO-AROUND DATA 2003 - 2012
Year Total Total Arrivals % of Arrivals
2003 312 120854 0.26
2004 344 124665 0.28
2005 450 129509 0.35
2006 405 130954 0.31
2007 434 133271 0.33
2008 359 131858 0.35
2009 455 125861 0.36
2010 364 120263 0.30
2011 386 125541 0.31
2012 94 26481 0.35
Comment:
This quarter the most common reasons for go-arounds were ‘windshear’ (26) ‘runway occupied’ (26)
‘unstable approach’ (18), and ‘insecure cabin’ (8).

24
NIGHT FLIGHTS
Introduction
The Secretary of State in exercise of his powers under Section 78 of the Civil Aviation Act 1982 has
imposed restrictions at Gatwick Airport on aircraft operating at night. These restrictions are in place to limit
and mitigate noise disturbance from aircraft operating at night and to prohibit aircraft of specified
descriptions from operating, also to limit the number of occasions on which other aircraft may take off or
land.
The night flying restrictions are divided into summer and winter seasons which coincide with the start and
end of British Summer Time. They consist of a movement limit and a quota count system. The quota count
(QC) means that points are allocated to different aircraft types according to how noisy they are. The noisier
the aircraft type, the higher the points allocated. This provides an incentive for airlines to use quieter aircraft
types. Aircraft are certified by the International Civil Aviation Organisation according to the noise they
produce and are classified separately for both take off and landing
For the purposes of night flying operations, the night quota period is defined as the period between 23:30
and 06:00 (Local time). In addition there are two further shoulder periods of 23:00 - 23:30 and 06:00 –
07:00 (Local time), where other restrictions apply to the scheduling and operation of aircraft of specified
descriptions
Restrictions
Winter 2006/07 2007/08 2008/09 2009/10 2010/11 2011/12
Movements
Limits 3250 3250 3250 3250 3250 3250
Quota Points 2300 2240 2180 2120 2060 2000
Summer 2007 2008 2009 2010 2011 2012
Movements
Limits 11200 11200 11200 11200 11200 11200
Quota Points 6700 6600 6500 6400 6300 6200
Comment:
The winter season 2011 ended at 01:00 hours 25th March 2012 , and the season limits are 2,000 QC points and 3,250 movements. The end of season report produced for the Department of Transport is shown in the table on the following pages outlining the weekly movement and QC usage to date. The Department for Transport has confirmed that the current night flight restriction will remain in force until
October 2014, with a consultation to be launched next year.
Dispensations - There were no dispensations during the Winter 2011/2012 season.
QC4, QC8 and QC16 movementsThere were no QC8 or QC16 movements during either the ‘night
quota’ or ‘shoulder periods’, and no QC4 movements during the ‘night quota period’.

25
AIRPORT MOVEMENTS and QUOTA SUMMARY
To Week 21 (30 October 2011 to 24 March 2012 inc)
Season Quota Points Limit
Quota Points Carried Over
Season Movement Limit
Movements Carried Over
2000.00
0.00
3250
0 3250 Total Quota Points Allowed Total Movements Allowed 2000.00
Government Report
Week
Ending
Date
QC0.25
No.
QC0.25
Value
QC0.5
No.
QC0.5
Value
QC1
No.
QC1
Value
QC2
No.
QC2
Value
QC4
No.
QC4
Value
QC8
No.
QC8
Value
QC16
No.
QC16
Value
Total
Quota
Mvmts
Against
Exmpt
Types
Not
Cnt'd
Not
Cnt'd
Not
Cnt'd
Total
Arvls
Total
Arvls
Total
Deps
Total
Deps
Total
Rnwy
Wk
No. 05/11/2011 58 55 27.50 23 23.00 12 24.00 0 0 0.00 0 0.00 2 89.00 0 0 134 16 14.50 0 150 1 0.00 148 89.3 10.7 12/11/2011 17 17 8.50 5 5.00 11 22.00 0 0 0.00 0 0.00 2 39.75 0 0 45 7 4.25 0 52 2 0.00 50 86.5 13.5 19/11/2011 20 15 7.50 7 7.00 8 16.00 0 0 0.00 0 0.00 5 35.50 0 0 49 6 5.00 0 55 3 0.00 50 89.1 10.9 26/11/2011 37 21 10.50 5 5.00 13 26.00 0 0 0.00 0 0.00 4 50.75 0 0 68 12 9.25 0 80 4 0.00 76 85.0 15.0 03/12/2011 19 18 9.00 4 4.00 13 26.00 0 0 0.00 0 0.00 2 43.75 0 0 52 4 4.75 0 56 5 0.00 54 92.9 7.1 10/12/2011 23 13 6.50 4 4.00 12 24.00 0 0 0.00 0 0.00 4 40.25 0 0 50 6 5.75 0 56 6 0.00 52 89.3 10.7 17/12/2011 32 21 10.50 7 7.00 12 24.00 0 0 0.00 0 0.00 4 49.50 0 0 68 8 8.00 0 76 7 0.00 72 89.5 10.5 24/12/2011 42 25 12.50 12 12.00 10 20.00 0 0 0.00 0 0.00 0 55.00 0 0 83 6 10.50 0 89 8 0.00 89 93.3 6.7 31/12/2011 28 17 8.50 8 8.00 9 18.00 0 0 0.00 0 0.00 0 41.50 0 0 59 3 7.00 0 62 9 0.00 62 95.2 4.8 07/01/2012 33 15 7.50 12 12.00 9 18.00 0 0 0.00 0 0.00 2 45.75 0 0 64 7 8.25 0 71 10 0.00 69 90.1 9.9 14/01/2012 24 11 5.50 3 3.00 7 14.00 0 0 0.00 0 0.00 6 28.50 0 0 49 2 6.00 0 51 11 0.00 45 96.1 3.9 21/01/2012 24 11 5.50 4 4.00 11 22.00 0 0 0.00 0 0.00 0 37.50 0 0 45 5 6.00 0 50 12 0.00 50 90.0 10.0 28/01/2012 21 15 7.50 6 6.00 7 14.00 0 0 0.00 0 0.00 5 32.75 0 0 50 4 5.25 0 54 13 0.00 49 92.6 7.4 04/02/2012 28 17 8.50 3 3.00 6 12.00 0 0 0.00 0 0.00 3 30.50 0 0 53 4 7.00 0 57 14 0.00 54 93.0 7.0 11/02/2012 65 12 6.00 10 10.00 7 14.00 0 0 0.00 0 0.00 8 46.25 0 0 94 8 16.25 0 102 15 0.00 94 92.2 7.8 18/02/2012 32 14 7.00 7 7.00 10 20.00 0 0 0.00 0 0.00 0 42.00 0 0 57 6 8.00 0 63 16 0.00 63 90.5 9.5 25/02/2012 32 19 9.50 9 9.00 8 16.00 0 0 0.00 0 0.00 0 42.50 0 0 60 8 8.00 0 68 17 0.00 68 88.2 11.8 03/03/2012 28 16 8.00 6 6.00 7 14.00 0 0 0.00 0 0.00 2 35.00 0 0 53 6 7.00 0 59 18 0.00 57 89.8 10.2 10/03/2012 37 20 10.00 4 4.00 9 18.00 0 0 0.00 0 0.00 5 41.25 0 0 67 8 9.25 0 75 19 0.00 70 89.3 10.7 17/03/2012 28 26 13.00 11 11.00 10 20.00 0 0 0.00 0 0.00 4 51.00 0 0 68 11 7.00 0 79 20 0.00 75 86.1 13.9 24/03/2012 23 27 13.50 5 5.00 9 18.00 0 0 0.00 0 0.00 4 42.25 0 0 64 4 5.75 0 68 21 0.00 64 94.1 5.9 TOTALS 651 162.75 405 202.50 155 155.00 200 400.00 0 0.00 0 0.00 0 0.00 920.25 1411 62 0 0 0 1332 141 1473 90.4 9.6
26 March 2012 Page 1 of 2 Version 1.4.7
Quota Points Available
Quota Points % Used
1079.75
46.0
Movements Available
Movements % Used
1839
43.4
Delays likely to lead to serious congestion and delays resulting from widespread
disruption of Air Traffic Exemptions granted by Govt (VIP Passengers,Emergency Relief)
Emergency Take-offs and Landings
Note 1 Not Cnt'd Delays:
Note 2 Not Cnt'd Govt:
Note 3 Not Cnt'd Emgcy:
26 March 2012 Page 2 of 2 Version 1.4.7

26
Map showing the location of callers (Q1 2012)
27
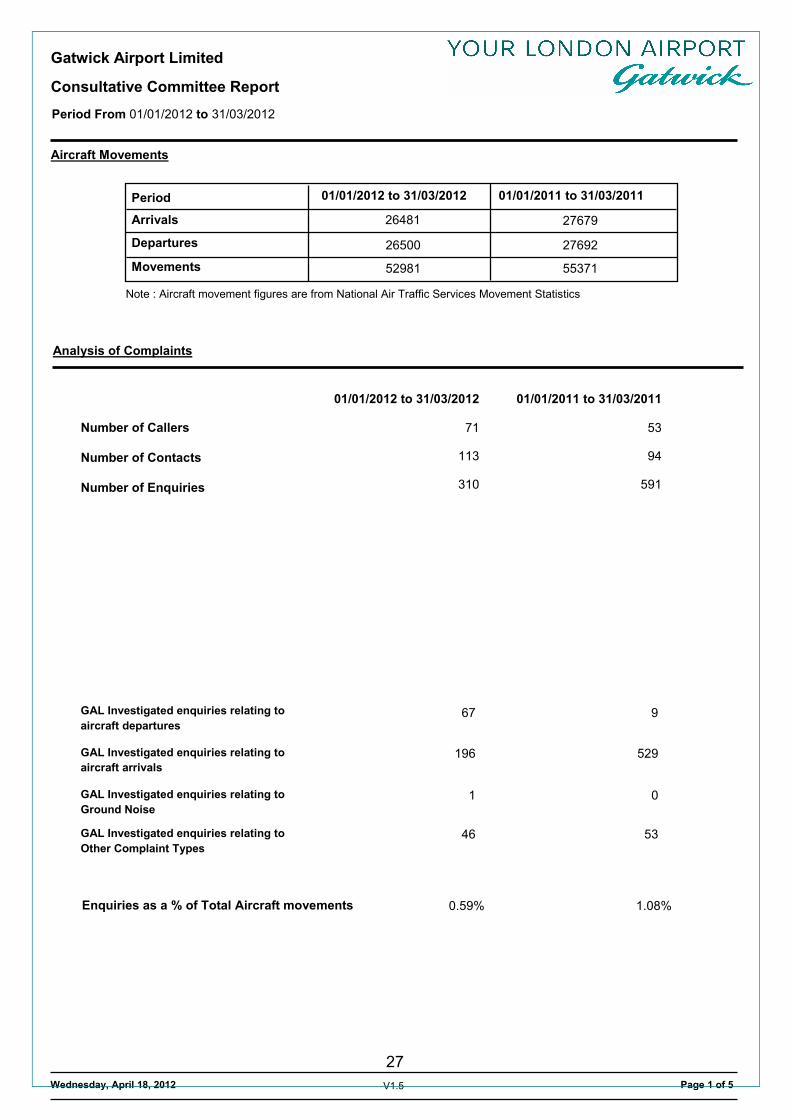
Consultative Committee Report
Period From 01/01/2012 to 31/03/2012
Gatwick Airport Limited
Aircraft Movements
Period
Arrivals
Departures
Movements
01/01/2012 to 31/03/2012
26481
26500
52981
27679
27692
55371
01/01/2011 to 31/03/2011
Note : Aircraft movement figures are from National Air Traffic Services Movement Statistics
Analysis of Complaints
01/01/2012 to 31/03/2012 01/01/2011 to 31/03/2011
Number of Callers
Number of Contacts
Number of Enquiries
71
113
310
53
94
591
GAL Investigated enquiries relating to
aircraft departures
GAL Investigated enquiries relating to
aircraft arrivals
GAL Investigated enquiries relating to
Ground Noise
GAL Investigated enquiries relating to
Other Complaint Types
67
196
53 46
529
1 0
9
Enquiries as a % of Total Aircraft movements 0.59% 1.08%
Wednesday, April 18, 2012 Page 1 of 5 V1.5

28
Consultative Committee Report
Period From 01/01/2012 to 31/03/2012
Gatwick Airport Limited
Note: Figures for this report are based on the date of the reported incident, not the date the call was received
Subject of Enquiries Received
Current Period (01-01-2012 to 31-03-2012)
Callers per
Subject Contacts per
Subject Enquiries per
Subject
260 70 43 Aircraft Noise
32 30 17 Low Flying
8 8 3 Track Keeping
8 8 8 Night - General
6 6 6 Night - Early Morning
5 5 5 Increased Flights
2 2 2 Other
2 2 2 Property Enquiry
1 1 1 Engine Runs
1 1 1 Unspecified
1 1 1 Departures - General
1 1 1 Noise Literature Request
0 0 0 Odour
0 0 0 Policy
0 0 0 Safety
0 0 0 Go round
0 0 0 Under NPR
0 0 0 Helicopters
0 0 0 Other Damage
0 0 0 Runway Works
0 0 0 Oily Deposits
0 0 0 Other Enquiry
0 0 0 Reverse Thrust
0 0 0 APU/GPU running
0 0 0 Northern Runway
0 0 0 Property Blight
0 0 0 Student Enquiry
0 0 0 Fuel Jettisoning
0 0 0 Chimney Emissions
0 0 0 Aircraft Emissions
0 0 0 Arrivals - General
0 0 0 Insulation Request
0 0 0 Other Ground Noise
0 0 0 Start of Roll Noise
0 0 0 Arrivals - Under ILS
0 0 0 Change to Easterlies
0 0 0 Change to Westerlies
0 0 0 Fire Training Ground
0 0 0 Vortex Strike Damage
Wednesday, April 18, 2012 Page 2 of 5 V1.5

29
Consultative Committee Report
Period From 01/01/2012 to 31/03/2012
Gatwick Airport Limited
Note: Figures for this report are based on the date of the reported incident, not the date the call was received
Subject of Enquiries Received
Current Period (01-01-2012 to 31-03-2012)
Callers per
Subject Contacts per
Subject Enquiries per
Subject
0 0 0 General Noise Enquiry
0 0 0 Arrivals - Under Stack
0 0 0 Ground Noise - General
0 0 0 Specific Noise Enquiry
0 0 0 Health/Pollution Levels
0 0 0 Aircraft Operation on the Ground
0 0 0 Arrivals - Under Path from Stack
Wednesday, April 18, 2012 Page 3 of 5 V1.5

30
Consultative Committee Report
Period From 01/01/2012 to 31/03/2012
Gatwick Airport Limited
Enquiries per
Subject Contacts per
Subject Callers per
Subject
Subject of Enquiries Received
Note: Figures for this report are based on the date of the reported incident, not the date the call was received
Previous Period (1-01-2011 to 31-03-2011 )
Arrivals - General 5 15 391
Aircraft Noise 30 41 169
Low Flying 15 21 67
Night - General 5 12 23
Increased Flights 3 3 9
Track Keeping 5 5 7
Arrivals - Under ILS 1 2 7
Departures - General 2 2 4
Night - Early Morning 4 4 4
Odour 1 2 2
Other 1 1 1
Property Enquiry 1 1 1
Policy 0 0 0
Safety 0 0 0
Go round 0 0 0
Under NPR 0 0 0
Engine Runs 0 0 0
Helicopters 0 0 0
Unspecified 0 0 0
Other Damage 0 0 0
Runway Works 0 0 0
Oily Deposits 0 0 0
Other Enquiry 0 0 0
Reverse Thrust 0 0 0
APU/GPU running 0 0 0
Northern Runway 0 0 0
Property Blight 0 0 0
Student Enquiry 0 0 0
Fuel Jettisoning 0 0 0
Chimney Emissions 0 0 0
Aircraft Emissions 0 0 0
Insulation Request 0 0 0
Other Ground Noise 0 0 0
Start of Roll Noise 0 0 0
Change to Easterlies 0 0 0
Change to Westerlies 0 0 0
Fire Training Ground 0 0 0
Vortex Strike Damage 0 0 0
General Noise Enquiry 0 0 0
Arrivals - Under Stack 0 0 0
Wednesday, April 18, 2012 Page 4 of 5 V1.

31
Consultative Committee Report
Period From 01/01/2012 to 31/03/2012
Gatwick Airport Limited
Enquiries per
Subject Contacts per
Subject Callers per
Subject
Subject of Enquiries Received
Note: Figures for this report are based on the date of the reported incident, not the date the call was received
Previous Period (1-01-2011 to 31-03-2011 )
Ground Noise - General 0 0 0
Specific Noise Enquiry 0 0 0
Health/Pollution Levels 0 0 0
Noise Literature Request 0 0 0
Aircraft Operation on the Ground 0 0 0
Arrivals - Under Path from Stack 0 0 0
Wednesday, April 18, 2012 Page 5 of 5

32
Period From 01/01/2012 to 31/03/2012
Aircraft Noise Enquiries - Administrative Localities
London Gatwick
Locality Enquiries Contacts Callers
Billingshurst 1 1 1
Charlwood 1 1 1
Copthorne 1 1 1
Cranleigh 1 1 1
Crawley 6 6 6
Crawley Down 1 1 1
Crowborough 1 1 1
Dorking 2 2 2
Dormansland 1 1 1
East Grinstead 9 11 13
Eastbourne 1 1 1
Edenbridge 8 26 90
Felbridge 1 1 1
Gatwick 2 2 2
Handforth 1 1 1
Haslemere 1 1 1
Havant 1 1 1
Hayes 1 1 1
Haywards Heath 1 1 1
Hever 1 11 14
Holmwood 1 1 1
Horley 7 7 8
Horsham 1 2 2
Ingatestone 1 1 1
Langley Green 1 1 2
Lingfield 2 12 100
London 3 3 3
Marsh Green 1 1 37
Newdigate 2 2 2
Nutley 1 1 1
Ockley 1 1 1
Outwood 1 1 1
Redhill 1 1 1
Reigate 1 2 2
Robertsbridge 1 1 3
Salfords 1 1 1
Test 1 1 1
Tonbridge 1 1 1
Woking 1 1 1
Total 71 113 310
Wednesday, April 18, 2012 Page 1 of 1 V1.4.2
33
Produced by the Gatwick Airport Flight Performance Team
To find out more about our work please contact us at:
Flight Performance Team
Gatwick Airport Limited
8th Floor, Destinations Place
Gatwick Airport
West Sussex RH6 0NP
Web: www.gatwickairport.com/noise
Freephone: 0800 393 070 (voicemail facility)
Email: [email protected]
© Gatwick Airport Limited 2012

34