Embed Size (px)
Citation preview
GAS POTENTIAL OF THE FERNIE SHALE, CROWSNEST COALFIELD, SOUTHEAST BRITISH COLUMBIA
Barry Ryan1 and Bob Morris2
ABSTRACT Samples from the Fernie Formation were collected from the Crowsnest Coalfield and analysed for total
organic carbon (TOC). It was possible to locate most samples in terms of their stratigraphic position within the formation, however, there were no major variations in TOC with stratigraphic position. TOC values were generally low and Tmax values indicate that the formation is over mature. The formation rides on top of the Lewis thrust and has experienced considerable deformation that may increase its potential as a shale gas resource.
Barry Ryan and Bob Morris, Gas potential of the Fernie Shale, Crowsnest Coalfield, Southeast British Columbia in Summary of Activities 2006, BC Ministry of Energy, Mines and Petroleum Resources, pages 73-88. 1Resource Development and Geoscience Branch, BC Ministry of Energy, Mines and Petroleum Resources, PO Box 9323, Stn Prov Govt, Victoria, BC, V8W 9N3 2Morris Geological, Fernie, British Columbia
Keywords: Shale gas, total organic carbon, Fernie Formation, Crowsnest Coalfield
INTRODUCTION Samples discussed in this report were collected from
outcrops of the Jurassic Fernie Formation in the Crowsnest Coalfield (Figure 1). The Crowsnest Coalfield is located between the Elk River and Michel Creek drainages and covers a total area of about 600 square kilometres. The Alberta Natural Gas Company 36 inch pipeline, which connects the Alberta gas fields with the US market, trends north-south through the coalfield (Figure 2).
The most recent geology maps and sections for the area are by Johnson and Smith (1991). Other more recent studies for example Monahan (2002) have used these maps and accompanying sections. One of the earliest regional papers on the Crowsnest Coalfield (Newmarch, 1953) provides a preliminary map of the Coalfield and detailed geology of the Coal Creek area. The map was compiled at a time when the mines in the creek were still operating. Other mapping data includes Pearson and Grieve (1978). These maps provide strike/dip and seam location data not present on the maps in Johnson and Smith (1991). The regional map of Price 1961 covers the Crowsnest Coalfield and also provides strike/dip information.
The Coalfield forms part of the Jurassic and lowest Cretaceous strata of the Rocky Mountains and Foothills (Table 1). This area has been the subject of several in-depth studies, including Poulton (1984, 1989, 1990), and Frebold (1957, 1969). The Coalfield is defined by outcrops of the Jura- Cretaceous Kootenay Group and underlying Fernie Formation and in general terms is a structural basin rimmed by outcrops of the Fernie Formation (Figure 2). The coalfield forms part of the upper plate of the Lewis Thrust and therefore formations
in the Coalfield have structural characteristics different from the same formations below the Lewis Thrust and penetrated by numerous oil and gas holes in the Western Canadian Sedimentary Basin to the east.
The coal bearing Mist Mountain Formation, which overlies the Fernie Formation, varies in thickness from 490 to 660 metres (Ryan, 2004). Rank of seams in the Mist Mountain Formation range from 0.82% to 1.64% with ranks increasing with depth and generally being higher in the southwestern part of the Coalfield (Pearson and Grieve, 1985). The formation is the target for conventional coal exploration and since 1990 coalbed gas (CBG also referred to as coalbed methane, CBM) exploration. The most recent CBM exploration program is by Shell in the northern part of the basin where the company has drilled 3 holes.
The marine Fernie Formation, which does not contain coal seams, was designated as the “Fernie Shales” on a map of the Crowsnest Coalfields by McEvoy (1902). Leach (1914) was the first to use the term “Fernie Formation” while the term “Fernie Group” was first used by Henderson and Douglas (1954).
Coalbed methane exploration in the overlying Mist Mountain has resulted in interest in the shale gas potential of the underlying Fernie Formation and this report provides some preliminary data on the subject. The study is composed of two parts. The mapping portion of the study aimed to define the distribution of the various subdivisions of the Fernie Formation and to examine the formation as a potential fractured shale reservoir. Fieldwork included mapping, structural analysis and collection of outcrop, core and cuttings samples within the Fernie Formation (Morris, 2004). The second part of the study, which forms this report includes a discussion of total organic carbon (TOC), analysis of samples.
Summary of Activities 2006 73
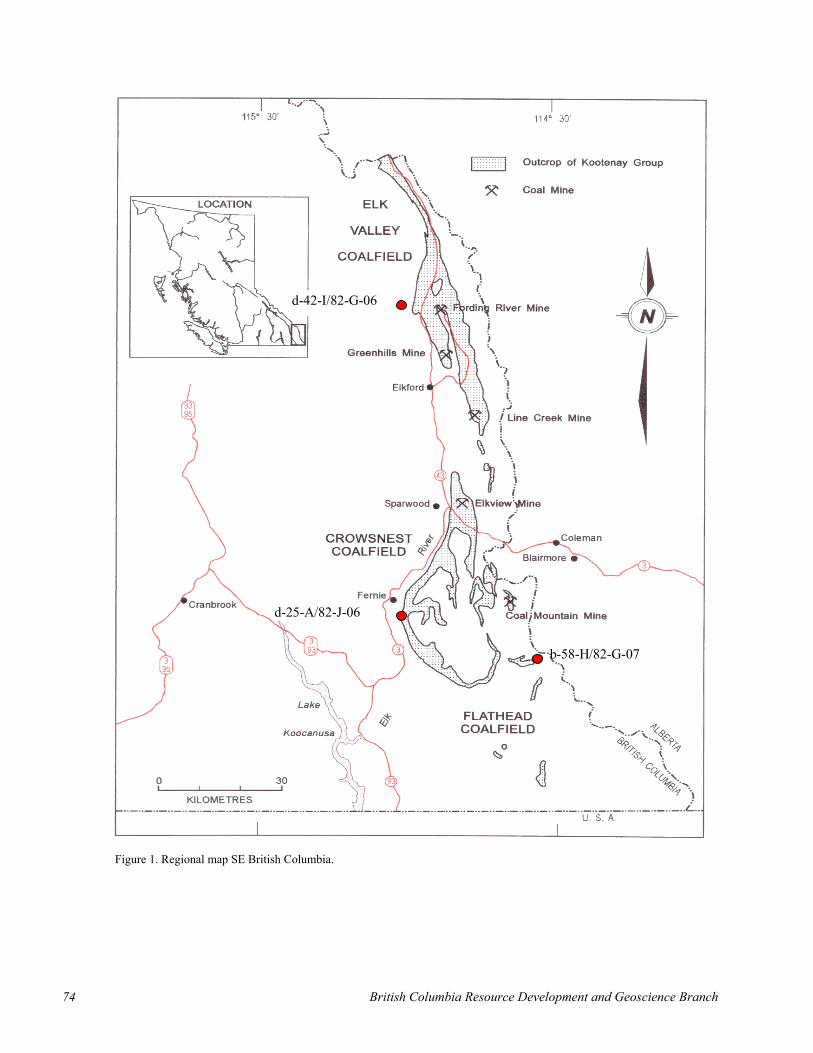
Figure 1. Regional map SE British Columbia.
b-58-H/82-G-07
d-25-A/82-J-06
d-42-I/82-G-06
74 British Columbia Resource Development and Geoscience Branch

Figure 2. Regional geology Crowsnest Coalfield extracted from Ministry of Energy, Mines and Petroleum Resources MapPlace geology map East Kootenay.
Summary of Activities 2006 75

TABLE 1. STRATIGRAPHY OF SOUTHEAST BRITISH COLUMBIA AND FERNIE FORMATION
STRATIGRAPHY The Fernie Formation was first described by McEvoy
and Leach (1902) who designated the “Fernie Shales” on their map of the Crowsnest Coalfield. There is no type locality designated for the formation, and no known mappable complete section. Price (1961) mapped the area and divided the Fernie Formation into units that from bottom to top are the Dark Grey Shales, Rock Creek, Grey Beds, Green Beds and Passage Beds. The cumulative thickness of these units ranges from 120 to 240 metres. More recently Poulton, et al. (1994) provide a section through southeast British Columbia that indicates a thickness of about 200 metres. They also provide a stratigraphic column for southeast British Columbia, a part of which gives a break-down of the Fernie Formation (Figure 3) listing all of the subdivisions that are referred to as Lower, Middle and Upper Members of the formation as well as units and beds.
The Lower Fernie Member contains four units. The lowest unit is the Phosphorite Unit, which is overlain by the Basal unit, the Lower Shale unit and the Poker Chip Shale Unit. All these units are described by Frebold (1957) and Poulton et al. (1994). The Poker Chip Shale Unit, also known as the “Paper shale Unit, is described as
Figure 3. Stratigraphic section of the Fernie Formation adapted from Poulton et al. (1994).
organic rich (Monahan 2002) and in conjunction with the Phosphatic unit as potential hydrocarbon source rocks. Fossils in this unit are generally restricted to ammonites, which are preserved as imprints or films. Locally, vertebrate remains have been found as well as belemnites.
The Middle Fernie Member is represented by four units. The lowest is the Rock Creek Unit overlain successively by the Lille, Highwood and Grey Beds Unit. Only the Grey Beds Unit was observed during this study. Three main facies are recognized in the Unit; the Corbula munda, Gryphaea beds (a predominantly shaly facies) and a facies characterized by grey shales with sandstone intercalations. The Corbula munda and Gryphaea beds consist of grey shales with brown or green tinges intercalated with bands and lenses of hard grayish calcareous sandstone. Most of these strata are fossiliferous containing abundant pelecypods and less commonly ammonites. The shale facies is characterized by indurated grey, limy, somewhat sandy shales that in places form steep cliffs. Most have a greenish tinge and are easily recognizable from a distance. Belemnites are numerous in the upper part.
UPPER FERNIE
MIDDLE FERNIE
LOWER FERNIE
KOOTENAY GROUP LO
WER
C
RET
ACEO
US
JUR
ASSI
C A
ND
CR
ETAC
EOU
SJU
RAS
SIC
CADOMIN FORMATION
ELK FORMATIONminor coal
MIST MOUNTAIN FORMATIONcoal seams
KOO
TEN
AY G
RO
UP
FER
NIE
FO
RM
ATIO
N PASSAGE BEDS
MOOSE MOUNTAIN MEMBER
WEARY RIDGE MEMBER
MO
RR
ISSE
Y FO
RM
ATIO
N
76 British Columbia Resource Development and Geoscience Branch
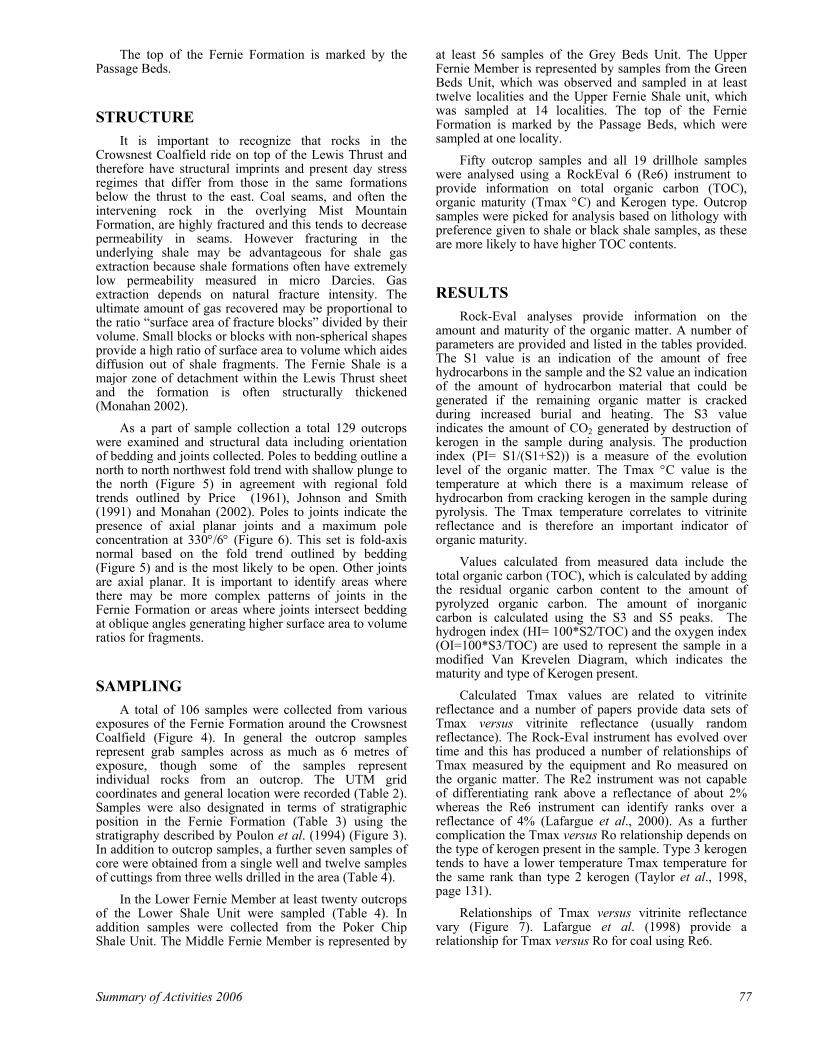
The top of the Fernie Formation is marked by the Passage Beds.
STRUCTURE It is important to recognize that rocks in the
Crowsnest Coalfield ride on top of the Lewis Thrust and therefore have structural imprints and present day stress regimes that differ from those in the same formations below the thrust to the east. Coal seams, and often the intervening rock in the overlying Mist Mountain Formation, are highly fractured and this tends to decrease permeability in seams. However fracturing in the underlying shale may be advantageous for shale gas extraction because shale formations often have extremely low permeability measured in micro Darcies. Gas extraction depends on natural fracture intensity. The ultimate amount of gas recovered may be proportional to the ratio “surface area of fracture blocks” divided by their volume. Small blocks or blocks with non-spherical shapes provide a high ratio of surface area to volume which aides diffusion out of shale fragments. The Fernie Shale is a major zone of detachment within the Lewis Thrust sheet and the formation is often structurally thickened (Monahan 2002).
As a part of sample collection a total 129 outcrops were examined and structural data including orientation of bedding and joints collected. Poles to bedding outline a north to north northwest fold trend with shallow plunge to the north (Figure 5) in agreement with regional fold trends outlined by Price (1961), Johnson and Smith (1991) and Monahan (2002). Poles to joints indicate the presence of axial planar joints and a maximum pole concentration at 330°/6° (Figure 6). This set is fold-axis normal based on the fold trend outlined by bedding (Figure 5) and is the most likely to be open. Other joints are axial planar. It is important to identify areas where there may be more complex patterns of joints in the Fernie Formation or areas where joints intersect bedding at oblique angles generating higher surface area to volume ratios for fragments.
SAMPLING A total of 106 samples were collected from various
exposures of the Fernie Formation around the Crowsnest Coalfield (Figure 4). In general the outcrop samples represent grab samples across as much as 6 metres of exposure, though some of the samples represent individual rocks from an outcrop. The UTM grid coordinates and general location were recorded (Table 2). Samples were also designated in terms of stratigraphic position in the Fernie Formation (Table 3) using the stratigraphy described by Poulon et al. (1994) (Figure 3). In addition to outcrop samples, a further seven samples of core were obtained from a single well and twelve samples of cuttings from three wells drilled in the area (Table 4).
In the Lower Fernie Member at least twenty outcrops of the Lower Shale Unit were sampled (Table 4). In addition samples were collected from the Poker Chip Shale Unit. The Middle Fernie Member is represented by
at least 56 samples of the Grey Beds Unit. The Upper Fernie Member is represented by samples from the Green Beds Unit, which was observed and sampled in at least twelve localities and the Upper Fernie Shale unit, which was sampled at 14 localities. The top of the Fernie Formation is marked by the Passage Beds, which were sampled at one locality.
Fifty outcrop samples and all 19 drillhole samples were analysed using a RockEval 6 (Re6) instrument to provide information on total organic carbon (TOC), organic maturity (Tmax °C) and Kerogen type. Outcrop samples were picked for analysis based on lithology with preference given to shale or black shale samples, as these are more likely to have higher TOC contents.
RESULTS Rock-Eval analyses provide information on the
amount and maturity of the organic matter. A number of parameters are provided and listed in the tables provided. The S1 value is an indication of the amount of free hydrocarbons in the sample and the S2 value an indication of the amount of hydrocarbon material that could be generated if the remaining organic matter is cracked during increased burial and heating. The S3 value indicates the amount of CO2 generated by destruction of kerogen in the sample during analysis. The production index (PI= S1/(S1+S2)) is a measure of the evolution level of the organic matter. The Tmax °C value is the temperature at which there is a maximum release of hydrocarbon from cracking kerogen in the sample during pyrolysis. The Tmax temperature correlates to vitrinite reflectance and is therefore an important indicator of organic maturity.
Values calculated from measured data include the total organic carbon (TOC), which is calculated by adding the residual organic carbon content to the amount of pyrolyzed organic carbon. The amount of inorganic carbon is calculated using the S3 and S5 peaks. The hydrogen index (HI= 100*S2/TOC) and the oxygen index (OI=100*S3/TOC) are used to represent the sample in a modified Van Krevelen Diagram, which indicates the maturity and type of Kerogen present.
Calculated Tmax values are related to vitrinite reflectance and a number of papers provide data sets of Tmax versus vitrinite reflectance (usually random reflectance). The Rock-Eval instrument has evolved over time and this has produced a number of relationships of Tmax measured by the equipment and Ro measured on the organic matter. The Re2 instrument was not capable of differentiating rank above a reflectance of about 2% whereas the Re6 instrument can identify ranks over a reflectance of 4% (Lafargue et al., 2000). As a further complication the Tmax versus Ro relationship depends on the type of kerogen present in the sample. Type 3 kerogen tends to have a lower temperature Tmax temperature for the same rank than type 2 kerogen (Taylor et al., 1998, page 131).
Relationships of Tmax versus vitrinite reflectance vary (Figure 7). Lafargue et al. (1998) provide a relationship for Tmax versus Ro for coal using Re6.
Summary of Activities 2006 77
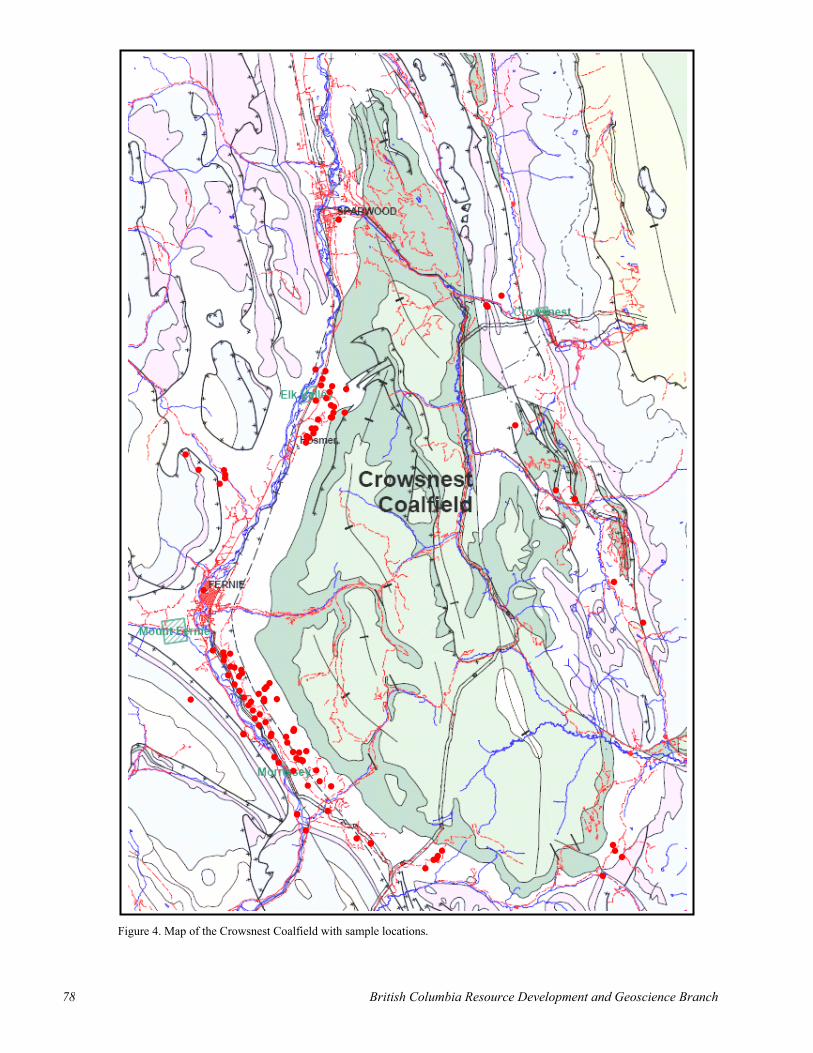
Figure 4. Map of the Crowsnest Coalfield with sample locations.
78 British Columbia Resource Development and Geoscience Branch

Krivak (2005) provides a relationship that seems to provided high estimates of Ro. Leachie et al. (1988) measured Tmax and Ro values in marine and non marine rocks in northeast BC. Their relationship of Tmax versus Ro values for marine rocks seems to provide the best relationship for the Fernie data based on knowledge of the rank of coals in the overlying Mist Mountain Formation. The relations provided by Ibrahimbas and Riediger (2005) for Cretaceous samples seems to provide Ro values that are too low.
Figure 5. Lower hemisphere equal area projection of poles to bedding.
Tmax temperatures for the outcrop samples range from 449°C to 541°C (Table 5) and place the formation in the dry gas field (Figure 8). Based on these values, Ro values range from 0.9% to 3.1% and average 1.62% using the relationship for marine rocks (Leachie et al., 1998). The data are sorted by unit within the Fernie Formation (Table 6) and plotted into a modified Van Krevelen Diagram (Figure 9). The data is hydrogen poor plotting in the type 3 kerogen field with a high degree of maturity.
Chip samples collected from 3 holes were analysed with most of the samples coming from 2 of the holes (Table 4). Holes ware located: a) to the west of the Elk valley Coalfield, b) below the Bourgeau Thrust, west of the Crowsnest Coalfield in subcrop of Fernie and c) east of the Crowsnest Coalfield intersecting the Fernie below the Lewis Thrust (Figure 1). Hole d-25 intersects the Fernie above and below the Bourgeau Thrust. The Tmax temperatures are low and do not predict realistic ranks indicating the possible presence of contamination (Figure 10). Hole d-42 drilled into Fernie below the Bourgeau Thrust where the formation is steeply dipping. Tmax
temperatures increase consistently with depth and do not indicate any major thrusts. The single sample from below the Lewis Thrust (hole b-58 Figure 1) indicates a low rank equivalent to high-volatile A bituminous.
Figure 6. Lower hemisphere equal area projection of poles to joints.
Figure 7. Tmax versus Ro relationships derived from Lafargue et al. (1998) (Re6), Krivak (2005) Lechie, et al. (1988) (marine and non marine) and Ibrahimbas, and Riediger (2005).
Equal area lower hemisphere projectioncontours of poles to bedding at 1 to 4% data densitymaximum density at pole 240/54 = 4.59 %
0
1
1
1
2
2
2
22
3
3
1
1
1
Equal area lower hemisphere projectioncontours of poles to joints at 1 to 4 % data densitymaximum density at pole 330/6 = 4.68%
0
1
1
1
22
2
2
3
3
2
1
1
Summary of Activities 2006 79
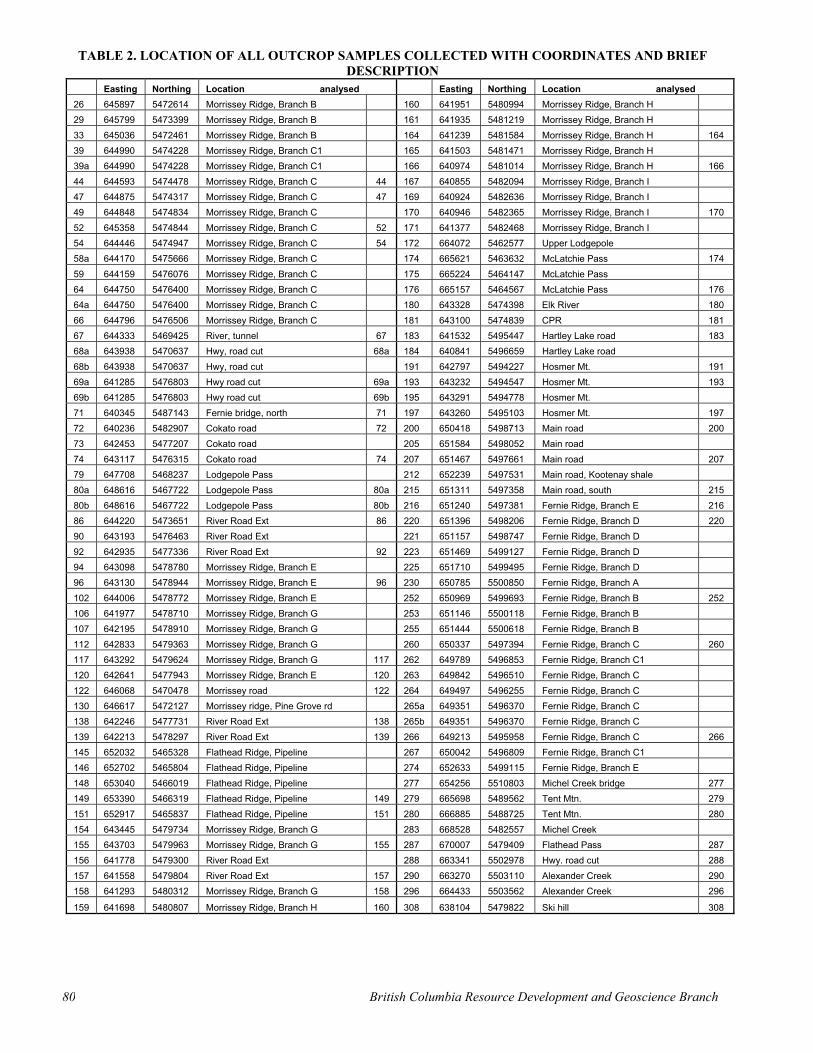
TABLE 2. LOCATION OF ALL OUTCROP SAMPLES COLLECTED WITH COORDINATES AND BRIEF DESCRIPTION
Easting Northing Location analysed Easting Northing Location analysed 26 645897 5472614 Morrissey Ridge, Branch B 160 641951 5480994 Morrissey Ridge, Branch H 29 645799 5473399 Morrissey Ridge, Branch B 161 641935 5481219 Morrissey Ridge, Branch H 33 645036 5472461 Morrissey Ridge, Branch B 164 641239 5481584 Morrissey Ridge, Branch H 164 39 644990 5474228 Morrissey Ridge, Branch C1 165 641503 5481471 Morrissey Ridge, Branch H 39a 644990 5474228 Morrissey Ridge, Branch C1 166 640974 5481014 Morrissey Ridge, Branch H 166 44 644593 5474478 Morrissey Ridge, Branch C 44 167 640855 5482094 Morrissey Ridge, Branch I 47 644875 5474317 Morrissey Ridge, Branch C 47 169 640924 5482636 Morrissey Ridge, Branch I 49 644848 5474834 Morrissey Ridge, Branch C 170 640946 5482365 Morrissey Ridge, Branch I 170 52 645358 5474844 Morrissey Ridge, Branch C 52 171 641377 5482468 Morrissey Ridge, Branch I 54 644446 5474947 Morrissey Ridge, Branch C 54 172 664072 5462577 Upper Lodgepole 58a 644170 5475666 Morrissey Ridge, Branch C 174 665621 5463632 McLatchie Pass 174 59 644159 5476076 Morrissey Ridge, Branch C 175 665224 5464147 McLatchie Pass 64 644750 5476400 Morrissey Ridge, Branch C 176 665157 5464567 McLatchie Pass 176 64a 644750 5476400 Morrissey Ridge, Branch C 180 643328 5474398 Elk River 180 66 644796 5476506 Morrissey Ridge, Branch C 181 643100 5474839 CPR 181 67 644333 5469425 River, tunnel 67 183 641532 5495447 Hartley Lake road 183 68a 643938 5470637 Hwy, road cut 68a 184 640841 5496659 Hartley Lake road 68b 643938 5470637 Hwy, road cut 191 642797 5494227 Hosmer Mt. 191 69a 641285 5476803 Hwy road cut 69a 193 643232 5494547 Hosmer Mt. 193 69b 641285 5476803 Hwy road cut 69b 195 643291 5494778 Hosmer Mt. 71 640345 5487143 Fernie bridge, north 71 197 643260 5495103 Hosmer Mt. 197 72 640236 5482907 Cokato road 72 200 650418 5498713 Main road 200 73 642453 5477207 Cokato road 205 651584 5498052 Main road 74 643117 5476315 Cokato road 74 207 651467 5497661 Main road 207 79 647708 5468237 Lodgepole Pass 212 652239 5497531 Main road, Kootenay shale 80a 648616 5467722 Lodgepole Pass 80a 215 651311 5497358 Main road, south 215 80b 648616 5467722 Lodgepole Pass 80b 216 651240 5497381 Fernie Ridge, Branch E 216 86 644220 5473651 River Road Ext 86 220 651396 5498206 Fernie Ridge, Branch D 220 90 643193 5476463 River Road Ext 221 651157 5498747 Fernie Ridge, Branch D 92 642935 5477336 River Road Ext 92 223 651469 5499127 Fernie Ridge, Branch D 94 643098 5478780 Morrissey Ridge, Branch E 225 651710 5499495 Fernie Ridge, Branch D 96 643130 5478944 Morrissey Ridge, Branch E 96 230 650785 5500850 Fernie Ridge, Branch A 102 644006 5478772 Morrissey Ridge, Branch E 252 650969 5499693 Fernie Ridge, Branch B 252 106 641977 5478710 Morrissey Ridge, Branch G 253 651146 5500118 Fernie Ridge, Branch B 107 642195 5478910 Morrissey Ridge, Branch G 255 651444 5500618 Fernie Ridge, Branch B 112 642833 5479363 Morrissey Ridge, Branch G 260 650337 5497394 Fernie Ridge, Branch C 260 117 643292 5479624 Morrissey Ridge, Branch G 117 262 649789 5496853 Fernie Ridge, Branch C1 120 642641 5477943 Morrissey Ridge, Branch E 120 263 649842 5496510 Fernie Ridge, Branch C 122 646068 5470478 Morrissey road 122 264 649497 5496255 Fernie Ridge, Branch C 130 646617 5472127 Morrissey ridge, Pine Grove rd 265a 649351 5496370 Fernie Ridge, Branch C 138 642246 5477731 River Road Ext 138 265b 649351 5496370 Fernie Ridge, Branch C 139 642213 5478297 River Road Ext 139 266 649213 5495958 Fernie Ridge, Branch C 266 145 652032 5465328 Flathead Ridge, Pipeline 267 650042 5496809 Fernie Ridge, Branch C1 146 652702 5465804 Flathead Ridge, Pipeline 274 652633 5499115 Fernie Ridge, Branch E 148 653040 5466019 Flathead Ridge, Pipeline 277 654256 5510803 Michel Creek bridge 277 149 653390 5466319 Flathead Ridge, Pipeline 149 279 665698 5489562 Tent Mtn. 279 151 652917 5465837 Flathead Ridge, Pipeline 151 280 666885 5488725 Tent Mtn. 280 154 643445 5479734 Morrissey Ridge, Branch G 283 668528 5482557 Michel Creek 155 643703 5479963 Morrissey Ridge, Branch G 155 287 670007 5479409 Flathead Pass 287 156 641778 5479300 River Road Ext 288 663341 5502978 Hwy. road cut 288 157 641558 5479804 River Road Ext 157 290 663270 5503110 Alexander Creek 290 158 641293 5480312 Morrissey Ridge, Branch G 158 296 664433 5503562 Alexander Creek 296
159 641698 5480807 Morrissey Ridge, Branch H 160 308 638104 5479822 Ski hill 308
80 British Columbia Resource Development and Geoscience Branch

TABLE 3. ALL SAMPLES COLLECTED DESIGNATED BY UNIT WITHIN THE FERNIE FORMATION
TABLE 4. LOCATION, DEPTH AND ROCK-EVAL DATA FOR DRILLHOLE SAMPLES
from tod-42-I/82-G-06 core Core 1, #1 1548.38 1549.91d-42-I/82-G-06 core Core 1, #2 1553.57 1553.57d-42-I/82-G-06 core Core 1, #3 1557.53 1557.53d-42-I/82-G-06 core Core 2, #1 1921.46 1921.46d-42-I/82-G-06 core Core 3, #1 2592.32 2592.32d-42-I/82-G-06 core Core 3, #2 2595.52 2595.52d-42-I/82-G-06 core Core 3, #3 2600.25 2600.25
d-42-I/82-G-06 chips WA 1113 350.52 432.82d-42-I/82-G-06 chips WA 1113 853.44 935.74d-25-A/82-J-06 chips WA 6095 605 610d-25-A/82-J-06 chips WA 6095 630 640d-25-A/82-J-06 chips WA 6095 2680 2720d-25-A/82-J-06 chips WA 6095 2880 2935d-25-A/82-J-06 chips WA 6095 2940 2995d-25-A/82-J-06 chips WA 6095 3125 3200d-25-A/82-J-06 chips WA 6095 3970 4010d-25-A/82-J-06 chips WA 6095 4015 4060d-25-A/82-J-06 chips WA 6095 4065 4116b-58-H/82-G-07 chips WA 6241 3440 3520
Outcrop Samples by Member
with analyzed samples high-lightedMember Sample number
Kootenay GroupKootenay 212
Upper Fernie Passage beds 277
Upper Fernie 49, 52, 54, 149, 155 , 176, 207, 215, 216 , 263, 264, 266 , 274, 280
Green beds 29, 39, 39a, 47, 64, 64a, 117 , 154, 161, 165, 265, 265a
Middle FernieGrey beds 26, 33, 44, 58a, 59, 66, 71, 72 , 74, 79, 80a,
80b, 86 , 90, 92, 94, 96, 102, 106, 107, 112, 120, 122 , 130, 138, 139 , 145, 146, 148, 151, 156, 157, 158, 159, 160, 164,166, 167, 169, 170, 171, 172, 175, 200, 205, 220, 221, 223, 225, 230, 252, 253, 255, 260, 262, 267
Ribbon Creek No sampleGryphaea beds No sampleCorbula Munda beds No sampleHighwood No sample
Lille No sampleRock Creek No sample
Lower FerniePoker Chip Shale 73Lower Shale 67, 68a, 68b, 69b, 174, 180, 181, 183,
184, 191, 193 , 195, 197, 279 , 283, 287,288, 290, 296, 308
Basal Unit No sampleBasal Phosphorite No sample
Summary of Activities 2006 81

TABLE 5. ROCK-EVAL DATA FOR TOTAL ORGANIC CARBON ANALYSES FOR SAMPLES AND RO CALCULATED USING MARINE RELATIONSHIP FROM LEACHIE ET AL. (1988)
Sample Rock
No.
Colour Texture
Type
Notes
MINC% TOC HI OI Tmax Ro-1 Ro-2 Av Ro
52 dark grey fissile shale small conc 0.1 1.42 29 66 484 1.01 1.16 1.08
54 dark grey mod. platy shale sericite, concretions 0.1 1.34 25 59 488 1.04 1.21 1.13
68a dark grey thin bedded shale sericite, belemnite 1.4 0.91 58 51 461 0.82 0.93 0.87
69a dark grey thin bedded shale 1.2 1.23 42 41 474 0.92 1.06 0.99
71 dark grey fissile shale 4.3 0.47 23 55 475 0.93 1.07 1.00
72 dark grey fissile sh/slst ca veins 1.7 0.26 12 138 490 1.06 1.23 1.15
74 dark grey platy shale ca veins, clay 2.0 0.33 36 139 472 0.90 1.04 0.97
80a dark grey massive sh/slst 10.7 0.12 0 333 516 1.37 1.50 1.43
80b dark grey platy shale clay 0.6 0.61 7 118 541 1.73 1.76 1.74
86 dark grey mod. platy sh/slst 0.8 0.23 17 178 490 1.06 1.23 1.15
96 dark grey massive siltstone ca veins 1.2 0.21 19 176 490 1.06 1.23 1.15
122 dark grey massive siltstone ca veins 1.1 0.11 18 182 489 1.05 1.22 1.14
138 dark grey fissile siltstone green tint 0.8 0.17 24 212 479 0.96 1.11 1.04
151 dark grey massive siltstone 0.3 0.41 20 195 499 1.16 1.32 1.24
155 dark grey massive siltstone 0.1 1.51 25 72 478 0.95 1.10 1.03
157 dark grey mod. platy shale clay 0.1 1.40 21 103 477 0.94 1.09 1.02
158 dark grey massive shale mini concretions 1.8 0.25 20 100 466 0.86 0.98 0.92
159 dark grey platy shale ca veins 3.3 0.25 12 216 494 1.11 1.27 1.19
160 dark grey platy shale bivalve 2.7 0.42 14 164 490 1.06 1.23 1.15
164 dark grey massive siltstone mini conc., bivalve? 1.6 0.19 11 168 485 1.01 1.17 1.09
170 dark grey fissile siltstone 1.6 0.28 11 139 501 1.18 1.34 1.26
174 dark grey platy shale muddy, dirty, coaly? 0.2 1.18 6 136 513 1.33 1.47 1.40
176 dark grey mod. platy siltstone sericite 0.1 1.43 12 110 493 1.10 1.26 1.18
183 dark grey platy siltstone concretions, sericite 1.3 0.77 34 56 484 1.01 1.16 1.08
191 dark grey platy siltstone rusty 0.2 2.45 17 67 500 1.17 1.33 1.25
197 dark grey massive siltstone ca veins, green tint 0.8 0.27 41 63 472 0.90 1.04 0.97
200 dark grey massive shale belemnite? Rusty 3.8 0.09 11 333 480 0.97 1.12 1.05
260 dark grey massive siltstone 0.2 1.19 42 76 474 0.92 1.06 0.99
266 dark grey fissile siltstone very fine sericite 0.1 1.22 34 75 472 0.90 1.04 0.97
277 dark grey massive siltstone slicks 1.3 1.49 34 55 498 1.15 1.31 1.23
280 dark grey platy siltstone sericite, concretions 0.9 0.62 56 71 462 0.83 0.94 0.88
287 gray/brown fissile shale clay, concretions 0.1 0.39 10 259 474 0.92 1.06 0.99
296 dark grey fissile shale sericite 0.2 2.56 36 59 468 0.87 1.00 0.93
308 dark grey mod. platy siltstone sericite 0.1 0.50 42 134 453 0.78 0.84 0.81
47 dark grey massive slst/lmst bivalves, black 1.1 0.33 18 73 453 0.78 0.84 0.81
44 black massive siltstone concretions, dense 2.9 0.14 14 179 463 0.84 0.95 0.89
67 gray/brown thin bedded ss/slst ammonite 4.4 0.37 14 349 483 1.00 1.15 1.07
69b black thin bedded shale
ca veins, plant debris 0.9 0.64 22 45 449 0.76 0.80 0.78
92 dark grey mod. platy siltstone 0.1 1.57 31 55 473 0.91 1.05 0.98
117 dark grey massive sandstone 3.0 0.16 25 256 493 1.10 1.26 1.18
82 British Columbia Resource Development and Geoscience Branch

TABLE 5. CONTINUED
TABLE 6. OUTCROP SAMPLES SORTED BY UNITS WITH TOC, HI AND OI DATA
Unit /No TOC Hi OI Tmax Ro
Unit /No TOC Hi OI Tmax Ro
Unit /No TOC Hi OI Tmax Ro
Passage beds Grey beds Upper Fernie Lower Fernie
277 1.49 34.0 55.0 498.0 1.78 122 0.11 18.0 182.0 489.0 1.62 67 0.37 14.0 349.0 483.0 1.51 Upper Fernie 1.36 200 0.09 11.0 333.0 480.0 1.46 181 0.25 20.0 120.0 459.0 1.08
52 1.42 29.0 66.0 484.0 1.53 80a 0.12 0.0 333.0 516.0 2.10 183 0.77 34.0 56.0 484.0 1.53
155 1.51 20.0 195.0 499.0 1.42 80b 0.61 7.0 118.0 541.0 2.55 197 0.27 41.0 63.0 472.0 1.31
280 0.62 56.0 71.0 462.0 1.13 44 0.14 14.0 179.0 463.0 1.15 287 0.39 10.0 259.0 474.0 1.35
54 1.34 25.0 59.0 488.0 1.60 71 0.47 23.0 55.0 475.0 1.37 68a 0.91 58.0 51.0 461.0 1.12
149 0.92 7.0 139.0 500.0 1.81 72 0.26 12.0 138.0 490.0 1.64 69a 1.23 42.0 41.0 474.0 1.35
176 1.43 12.0 110.0 493.0 1.69 74 0.33 36.0 139.0 472.0 1.31 69b 0.64 22.0 45.0 449.0 0.90
207 1.45 19.0 110.0 485.0 1.55 86 0.23 17.0 178.0 490.0 1.64 174 1.18 6.0 136.0 513.0 2.05
215 1.82 31.0 70.0 465.0 1.19 92 1.57 31.0 55.0 473.0 1.33 180 1.35 43.0 15.0 452.0 0.95
216 2.28 58.0 21.0 461.0 1.12 96 0.21 19.0 176.0 490.0 1.64 191 2.45 17.0 67.0 500.0 1.81
266 1.22 34.0 75.0 472.0 1.31 120 0.23 26.0 235.0 471.0 1.29 193 2.93 20.0 7.0 463.0 1.15
average 1.40 29.1 91.6 480.9 1.43 122 0.11 18.0 182.0 489.0 1.62 279 1.54 42.0 80.0 456.0 1.03
Green beds Upper Fernie 138 0.17 24.0 212.0 479.0 1.44 288 5.94 58.0 11.0 475.0 1.37
47 0.47 18.0 73.0 453.0 1.37 139 0.18 39.0 111.0 480.0 1.46 290 0.88 30.0 31.0 455.0 1.01
117 0.16 25.0 256.0 493.0 1.69 151 0.41 20.0 195.0 499.0 1.80 296 2.56 36.0 59.0 468.0 1.24
average 0.32 21.5 164.5 473.0 1.53 157 1.40 21.0 103.0 477.0 1.40 308 0.50 42.0 134.0 453.0 0.97
158 0.25 20.0 100.0 466.0 1.21 average 1.42 31.5 89.6 470.1 1.28
159 0.25 12.0 216.0 494.0 1.71
160 0.42 14.0 164.0 490.0 1.64
164 0.19 11.0 168.0 485.0 1.55
166 0.22 18.0 195.0 489.0 1.62
170 0.28 11.0 139.0 501.0 1.83
200 0.09 11.0 333.0 480.0 1.46
220 1.64 60.0 21.0 463.0 1.15
252 1.46 60.0 18.0 467.0 1.22
260 1.19 42.0 76.0 474.0 1.35
average 0.47 22.0 161.3 484.6 1.54
Sample Rock No.
Colour Texture
Type
Notes
MINC% TOC HI OI Tmax Ro-1
Ro-2 Av Ro
139 dark grey platy siltstone 0.9 0.18 39 111 480 0.97 1.12 1.05
149 dark grey platy siltstone sericite, carb 0.1 0.92 7 139 500 1.17 1.33 1.25
166 dark grey mod. platy siltstone 1.1 0.22 18 195 489 1.05 1.22 1.14
180 black mod. platy siltstone fossils, carb., slicks 0.4 1.35 43 15 452 0.77 0.83 0.80
181 dark grey mod. platy siltstone green tint 1.6 0.25 20 120 459 0.81 0.90 0.86
193 black mod. platy shale carb., slicks 0.7 2.93 20 7 463 0.84 0.95 0.89
207 dark grey massive siltstone rusty, sericite 0.2 1.45 19 110 485 1.01 1.17 1.09
215 very dark grey massive siltstone sericite, ca veins 0.9 1.82 31 70 465 0.85 0.97 0.91
216 very dark grey massive siltstone ca veins 1.1 2.28 58 21 461 0.82 0.93 0.87
220 very dark grey fissile siltstone concretions 0.9 1.64 60 21 463 0.84 0.95 0.89
252 very dark grey massive siltstone very fine sericite 0.6 1.46 60 18 467 0.86 0.99 0.93
279 dark grey massive siltstone concretions 1.1 1.54 42 80 456 0.79 0.87 0.83
288 black platy siltstone carb. 5.0 5.94 58 11 475 0.93 1.07 1.00
290 dark grey platy siltstone 2.2 0.88 30 31 455 0.79 0.86 0.83
Ro-1 uses relationship from Lafargue et al (1998)
Ro-2 uses Cretaceous relationship from Ibrahimas and Riediger (2005)
Summary of Activities 2006 83

Figure 8. Generation of oil and gas from Kerogen; figure from Dow (1974).
Figure 9. Van Krevelen Diagram for outcrop samples.
DISCUSSION Organic material that collects in low energy
environments, where fine sediments accumulate, is preserved if the environment is anoxic. Shales with moderate contents of preserved organic material have the potential to be a source rocks for oil or gas depending on the kerogen type and its maturity. Shale also has the potential to act as a reservoir for gas, based on the adsorption ability of the organic matter and the ability of the shale to retain gas in the micro porosity.
At depth to the east the Jurassic Fernie Formation is divided from base upwards in part into the Nordegg, Gordondale, Poker Chip, Rock Creek, and Grey Beds. The Nordegg Member underlies part of southeast British Columbia and a large area of southern Alberta. The Gordondale Member underlies southeast and northeast
BC and a large area of Alberta. Both members have good source rock potential for oil.
Figure 10. Depth versus Tmax plots for holes d-42-I/82-G06 and d-25-A/82-G-07.
In northeast British Columbia the Fernie Formation is overlain by the Nikanassin, Cadomin Gething, and Bluesky formations and on top the lower Cretaceous Moosebar or Wilrich Formation, which is a marine shale with shale gas potential. Ibrahimbas and Riediger (2005) provide an average TOC for the Wilrich of 2.1%. Leckie et al. (1988) analysed samples for TOC from the Monkman Pass area. TOC values range from 0.75 to 2.36% and rank ranges from 1.2 to 1.24% Rmax. They derived approximate Tmax versus Ro relationships for marine and non-marine rocks, which are depicted in Figure 7.
Total organic carbon values of samples from the Crowsnest Coalfield and adjoining area, sorted by units (Table 6) provide averages of 1.67 % for the Upper Fernie, 1.41% for the Lower Fernie and 1.75% for the Grey Beds. These reflectances are in the range of what would be expected based on measured reflectance values in the overlying Mist Mountain (Pearson and Grieve 1985). The Tmax values indicate that the formation is in the dry gas field (Figure 8) and values indicate a poor to
0
500
1000
1500
2000
2500
3000
3500
4000
4500
300 350 400 450 500 550
Tmax'C
Dep
th m
etre
s
d-25-A/82-J-06
Above Bourgeau Thrust
Below Bourgeau Thrust
0
500
1000
1500
2000
2500
3000
460 480 500 520 540 560
Tmax 'C
Dep
th M
etre
s
d-42-I/82-G-06
0
100
200
300
400
500
600
700
800
900
1000
0 50 100 150 200
oxygen index
hydr
ogen
inde
x
type 1
type 2
type 3
Lower FernieGrey Beds Upper FernieUpper Fernie
84 British Columbia Resource Development and Geoscience Branch
fair source rock potential especially as the kerogen appears to be type 3 (Figure 9).
Contours of Tmax values indicate higher values to the southwest (Figure 11), which agrees with the general rank trends for the overlying Mist Mountain Formation. Plots of Grey Beds and Lower Fernie data sets separately (Table 6) indicate, with the limited amount of data available, that it is not possible to distinguish any maturity difference between units with in the Fernie Formation.
The TOC contents of producing shale units range from 0.5% to over 20% (Table 7) and in terms of TOC content and rank the Fernie Formation is similar to the Lewis Shale. The Lewis Shale is 300 to 450 metres thick and occurs at a depth of 1000 to 2000 metres in the San Juan Basin. Well productivity correlates with natural fracture spacing (Dart, 1992). Permeability is improved by dissolution of carbonate cement on some fractures. The presence of inorganic carbon is identified by Rock-Eval analyses and contents are generally low in the Fernie shale samples. The shale is considerably under pressured, which decreases gas contents, which are from 0.3 to 0.6 cc/g but probably aids permeability and produceability. There are no data on pressure gradients in the Fernie Formation, though unpublished data probably exists for the overlying Mist Mountain Formation.
Shale gas contents are composed of adsorbed gas on organic material and gas in the non organic rock that is tightly held free gas and possibly some gas adsorbed onto clay surfaces. Adsorption on non organic material is suspected when any isotherm on a sample with low organic content predicts unrealistically high adsorption ability when calculated to the equivalent 100% TOC sample. The effect of clay adsorption or tight free gas is more for lower TOC samples and it can cause a double accounting of gas because it is not part of the gas adsorbed on the organic material. Many isotherms on shale, for which the TOC content is also provided, permit estimation of the adsorption characteristics of the equivalent sample with 100% TOC. As noted previously (Bustin, PC 2005) often calculated langmuir volumes (Vl) at 100% TOC appear to be unrealistically high, indicating double accounting or the possibility that sample preparation may have artificially increased the adsorption ability of the shale component of the sample. The lower the TOC content the more this will affect estimation of Vl at 100%TOC.
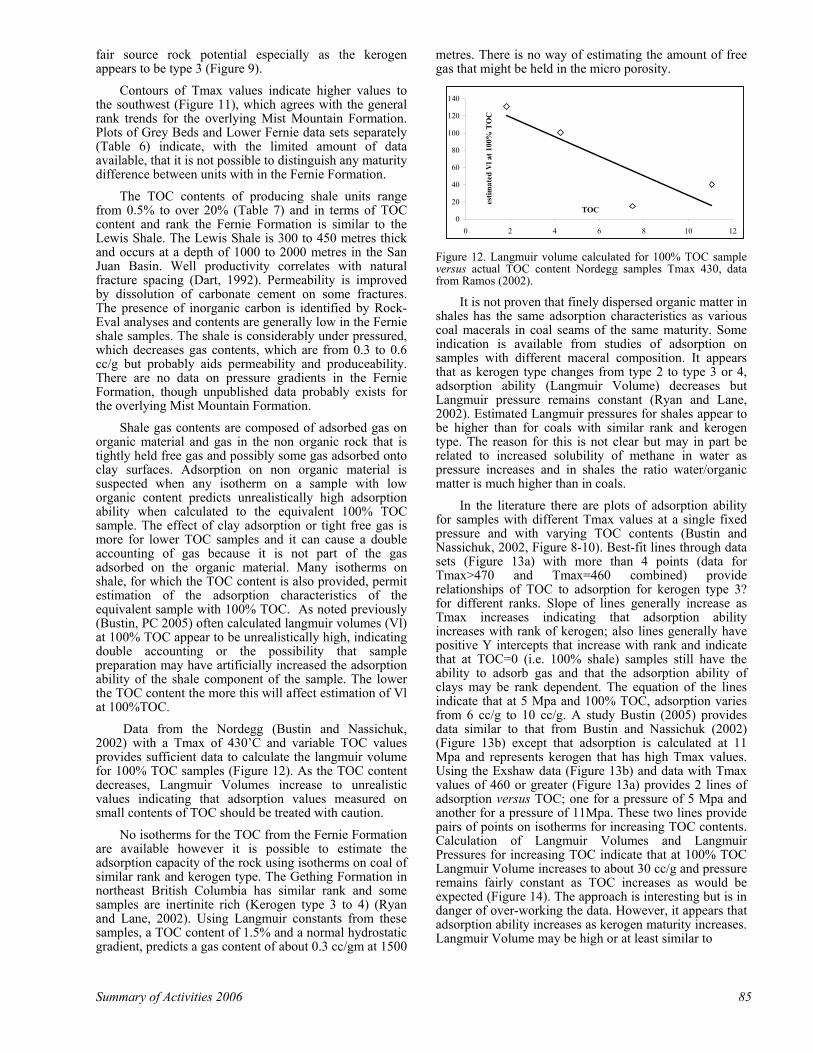
Data from the Nordegg (Bustin and Nassichuk, 2002) with a Tmax of 430’C and variable TOC values provides sufficient data to calculate the langmuir volume for 100% TOC samples (Figure 12). As the TOC content decreases, Langmuir Volumes increase to unrealistic values indicating that adsorption values measured on small contents of TOC should be treated with caution.
No isotherms for the TOC from the Fernie Formation are available however it is possible to estimate the adsorption capacity of the rock using isotherms on coal of similar rank and kerogen type. The Gething Formation in northeast British Columbia has similar rank and some samples are inertinite rich (Kerogen type 3 to 4) (Ryan and Lane, 2002). Using Langmuir constants from these samples, a TOC content of 1.5% and a normal hydrostatic gradient, predicts a gas content of about 0.3 cc/gm at 1500
metres. There is no way of estimating the amount of free gas that might be held in the micro porosity.
Figure 12. Langmuir volume calculated for 100% TOC sample versus actual TOC content Nordegg samples Tmax 430, data from Ramos (2002).
It is not proven that finely dispersed organic matter in shales has the same adsorption characteristics as various coal macerals in coal seams of the same maturity. Some indication is available from studies of adsorption on samples with different maceral composition. It appears that as kerogen type changes from type 2 to type 3 or 4, adsorption ability (Langmuir Volume) decreases but Langmuir pressure remains constant (Ryan and Lane, 2002). Estimated Langmuir pressures for shales appear to be higher than for coals with similar rank and kerogen type. The reason for this is not clear but may in part be related to increased solubility of methane in water as pressure increases and in shales the ratio water/organic matter is much higher than in coals.
In the literature there are plots of adsorption ability for samples with different Tmax values at a single fixed pressure and with varying TOC contents (Bustin and Nassichuk, 2002, Figure 8-10). Best-fit lines through data sets (Figure 13a) with more than 4 points (data for Tmax>470 and Tmax=460 combined) provide relationships of TOC to adsorption for kerogen type 3? for different ranks. Slope of lines generally increase as Tmax increases indicating that adsorption ability increases with rank of kerogen; also lines generally have positive Y intercepts that increase with rank and indicate that at TOC=0 (i.e. 100% shale) samples still have the ability to adsorb gas and that the adsorption ability of clays may be rank dependent. The equation of the lines indicate that at 5 Mpa and 100% TOC, adsorption varies from 6 cc/g to 10 cc/g. A study Bustin (2005) provides data similar to that from Bustin and Nassichuk (2002) (Figure 13b) except that adsorption is calculated at 11 Mpa and represents kerogen that has high Tmax values. Using the Exshaw data (Figure 13b) and data with Tmax values of 460 or greater (Figure 13a) provides 2 lines of adsorption versus TOC; one for a pressure of 5 Mpa and another for a pressure of 11Mpa. These two lines provide pairs of points on isotherms for increasing TOC contents. Calculation of Langmuir Volumes and Langmuir Pressures for increasing TOC indicate that at 100% TOC Langmuir Volume increases to about 30 cc/g and pressure remains fairly constant as TOC increases as would be expected (Figure 14). The approach is interesting but is in danger of over-working the data. However, it appears that adsorption ability increases as kerogen maturity increases. Langmuir Volume may be high or at least similar to
0
20
40
60
80
100
120
140
0 2 4 6 8 10 12
TOC
estim
ated
Vl a
t 100
% T
OC
Summary of Activities 2006 85
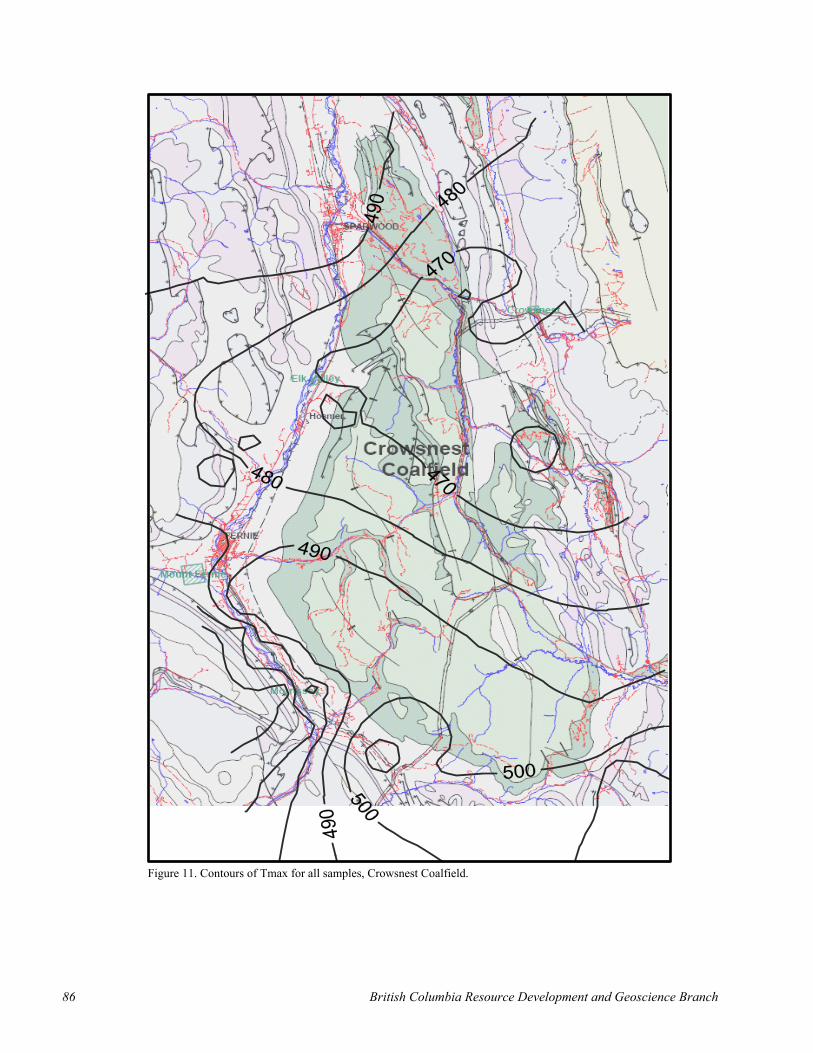
Figure 11. Contours of Tmax for all samples, Crowsnest Coalfield.
86 British Columbia Resource Development and Geoscience Branch
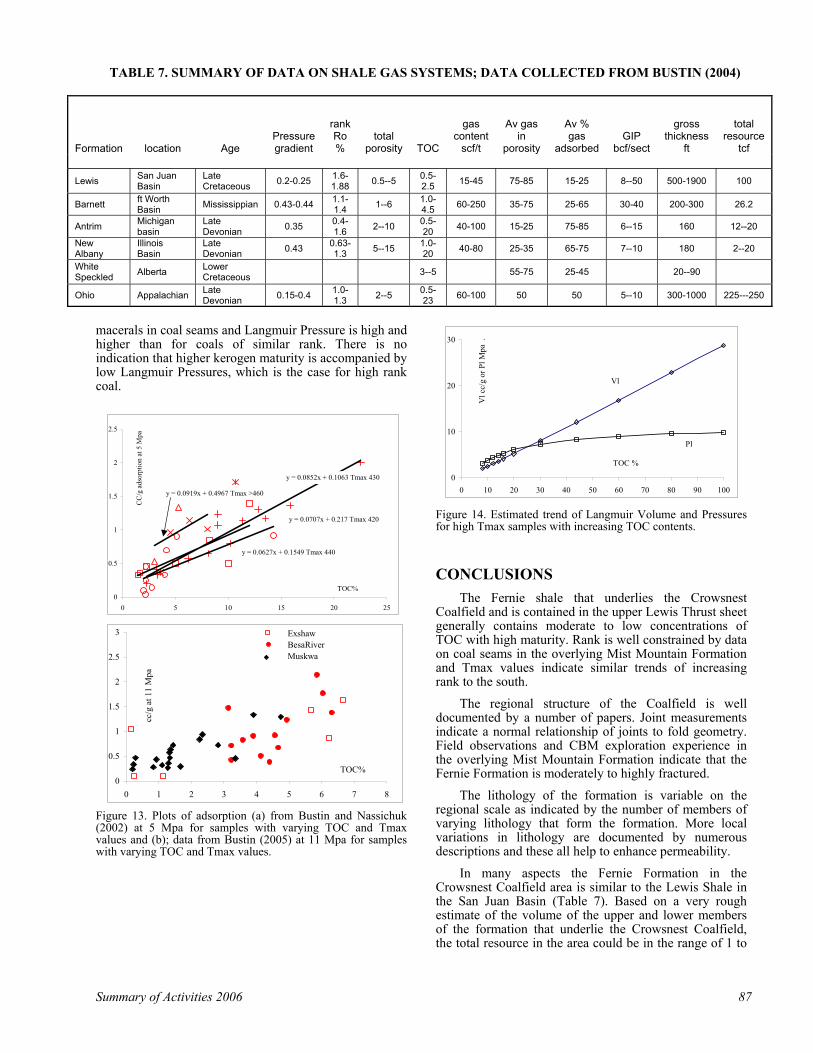
macerals in coal seams and Langmuir Pressure is high and higher than for coals of similar rank. There is no indication that higher kerogen maturity is accompanied by low Langmuir Pressures, which is the case for high rank coal.
Figure 13. Plots of adsorption (a) from Bustin and Nassichuk (2002) at 5 Mpa for samples with varying TOC and Tmax values and (b); data from Bustin (2005) at 11 Mpa for samples with varying TOC and Tmax values.
Figure 14. Estimated trend of Langmuir Volume and Pressures for high Tmax samples with increasing TOC contents.
CONCLUSIONS The Fernie shale that underlies the Crowsnest
Coalfield and is contained in the upper Lewis Thrust sheet generally contains moderate to low concentrations of TOC with high maturity. Rank is well constrained by data on coal seams in the overlying Mist Mountain Formation and Tmax values indicate similar trends of increasing rank to the south.
The regional structure of the Coalfield is well documented by a number of papers. Joint measurements indicate a normal relationship of joints to fold geometry. Field observations and CBM exploration experience in the overlying Mist Mountain Formation indicate that the Fernie Formation is moderately to highly fractured.
The lithology of the formation is variable on the regional scale as indicated by the number of members of varying lithology that form the formation. More local variations in lithology are documented by numerous descriptions and these all help to enhance permeability.
In many aspects the Fernie Formation in the Crowsnest Coalfield area is similar to the Lewis Shale in the San Juan Basin (Table 7). Based on a very rough estimate of the volume of the upper and lower members of the formation that underlie the Crowsnest Coalfield, the total resource in the area could be in the range of 1 to
0
10
20
30
0 10 20 30 40 50 60 70 80 90 100
TOC %
Vl c
c/g
or P
l Mpa
.
Vl
Pl
0
0.5
1
1.5
2
2.5
3
0 1 2 3 4 5 6 7 8
TOC%
cc/g
at 1
1 M
pa
ExshawBesaRiverMuskwa
y = 0.0919x + 0.4967 Tmax >460
y = 0.0852x + 0.1063 Tmax 430
y = 0.0627x + 0.1549 Tmax 440
y = 0.0707x + 0.217 Tmax 420
0
0.5
1
1.5
2
2.5
0 5 10 15 20 25
TOC%
CC
/g a
dsor
ptio
n at
5 M
pa
TABLE 7. SUMMARY OF DATA ON SHALE GAS SYSTEMS; DATA COLLECTED FROM BUSTIN (2004)
Formation location Age Pressure gradient
rank Ro %
total porosity TOC
gas content
scf/t
Av gas in
porosity
Av % gas
adsorbed GIP
bcf/sect
gross thickness
ft
total resource
tcf
Lewis San Juan Basin
Late Cretaceous 0.2-0.25 1.6-
1.88 0.5--5 0.5-2.5 15-45 75-85 15-25 8--50 500-1900 100
Barnett ft Worth Basin Mississippian 0.43-0.44 1.1-
1.4 1--6 1.0-4.5 60-250 35-75 25-65 30-40 200-300 26.2
Antrim Michigan basin
Late Devonian 0.35 0.4-
1.6 2--10 0.5-20 40-100 15-25 75-85 6--15 160 12--20
New Albany
Illinois Basin
Late Devonian 0.43 0.63-
1.3 5--15 1.0-20 40-80 25-35 65-75 7--10 180 2--20
White Speckled Alberta Lower
Cretaceous 3--5 55-75 25-45 20--90
Ohio Appalachian Late Devonian 0.15-0.4 1.0-
1.3 2--5 0.5-23 60-100 50 50 5--10 300-1000 225---250
Summary of Activities 2006 87

5 tcf. At this time there are no isotherm or adsorption data to permit a reasonable estimate of the resource.
REFERENCES Bustin, R.M. and Nassichuk, B. (2002): Gas shale geology,
engineering application to exploration and development; Short course notes Course Calgary October 10th and 11th 2002.
Bustin R.M. (2005): Gas shale potential of Devonian strata northeastern British Columbia; British Columbia Ministry of Energy, Mines and Petroleum Resources, Petroleum Geology Special Paper 2005-1.
Dart, Jr. S.W. (1992): Evaluation of San Juan Basin fractured reservoirs from surface data; Rocky Mountain Association of Geologists, page 95-114.
Dow, W. (1974): Kerogen studies and geological interpretations; Journal of Geochemical Exploration, Volume 7, pages 79-99.
Frebold, H. (1957): The Jurassic Fernie Group in the Canadian Rocky Mountains and foothills; Geological Survey of Canada, Memoir 287, 197 p.
Frebold, H. (1969): Subdivision and facies of Lower Jurassic rocks in the southern Canadian Rocky Mountains and foothills. Proceedings of the Geological Association of Canada, v. 20, pages 76-89.
Henderson, G.G.L. and Douglas R.J.W. (1954): Southern Rocky Mountains of Canada, tectonic compilation Map; Alberta Society Petroleum Geology Guide Book.
Ibrahimbas, A. and Riediger, C. (2005): Thermal maturity and implications for shale gas potential in northeastern British Columbia and northeastern Alberta; paper presented Canadian Society of Unconventional Gas, Conference, November 2005, Calgary.
Krivak, D. (2005): Progressive analysis in the development of tight gas shale plays; Canadian Institute Shale Gas Short curse Calgary, January 31.
Johnson, D.G.S. and Smith, L.A. (1991): Coalbed Methane in southeastern British Columbia; British Columbia Ministry of Energy and Mines, Petroleum Geology Branch, Special paper 1991-1.
Lechie, D.A., Kalkrueth, W.D. and Snowdon, L.R. (1988): Source rock potential and thermal maturity of Lower Cretaceous Strata: Monkman Pass area, British Columbia; American Association of Petroleum Geology, Bulletin, Volume 72, pages 820-838.
Leach, W.W. (1914): Blairmore map area, Alberta; Geological Survey of Canada, Summary Report 1912, page 234.
Lafargue, E., Espitalie, J., Marquis, F. and Pillot, D. (2000): Rock-Eval 6 applications in hydrocarbon exploration, production and soil contamination studies; Revuede I’institut Francais du Petrole, volume 53, number 4, pages 421-437.
McEvoy J. (1902): Geological and topographical map of Crowsnest Coal Fields; Geological Survey of Canada Map Number 767.
Monahan, P. (2002): The Geology and oil and gas potential of the Fernie-Elk Valley Area, southeastern British Columbia, British Columbia Ministry of Energy and Mines.
Morris, B. (2004): Geochemistry, Fracture Analysis, and Hydrocarbon Potential of the Jurassic Fernie Formation, Crowsnest Coalfield, Southeast British Columbia; Report submitted to Resources Development and Geosciences Branch, British Columbia Ministry of Energy, Mines and Petroleum Resources.
Newmarch, C.B. (1953): Geology of the Crowsnest Coal Basin; British Columbia Department of Mines, Bulletin Number 33.
Pearson, D.E. and Grieve, D.A. (1978): Preliminary geological map of the Crowsnest Coalfield, west part; British
Columbia Ministry of Energy, Mines and Petroleum Resources, Preliminary map 27.
Pearson, D.E. and Grieve, D.A (1985): Rank variation, coalification pattern and coal quality in the Crowsnest Coalfield, British Columbia; Canadian Institute of Mining and Metallurgy Bulletin, Volume 78, pages 39-46.
Poulton, T.P., Christopher, J.E., Hayes, B.J.R., Losert, J., Tittemore, J. and Gilchrist, R.D. (1994): Jurassic and lowermost Cretaceous strata of the Western Canada Sedimentary Basin; Chapter 18 Geological Atlas of the Western Canada Sedimentary Basin.
Poulton, T.P. (1984): Jurassic of the Canadian Western Interior, from 49°N Latitude to Beaufort Sea, In: The Mesozoic of Middle North America, D. F. Stott and D. Glass (eds.); Calgary, Canadian Society of Petroleum Geologists, Memoir 9, pages 15-41.
Poulton, T.P. and Aitken, J.D. (1989): The Lower Jurassic phosphorites of southeastern British Columbia and terrane accretion to western North America; Canadian Journal of Earth Sciences, v. 26, pages 1612-1616.
Price, R.A. (1961): Fernie map area east half Alberta and British Columbia 82G E1/2; Geological Survey of Canada Paper 61-24.
Price, R.A. (1964): Flathead map area British Columbia and Alberta; Memoir 336.
Ramos, S.(2002): The effect of shale composition on the gas adsorption potential of organic rich mudrocks in the Western Sedimentary Basin; University of British Columbia, Department of Earth and Ocean Sciences; Masters of Science Thesis.
Ryan, B.D. and Lane, R. (2002): Adsorption characteristics of coals from the Gething Formation northeast British Columbia; British Columbia Ministry of Energy and Mines, Geological Fieldwork, Paper 2002-1.
Ryan, B.D. (2004): Coalbed gas Resource of prospective areas of the Crowsnest Coalfield; Report of activities 2003, Resources Development Branch, Oil and Gas Division, British Columbia Ministry of Energy, Mines and Petroleum Resources.
Taylor, G.H, Teichmuller, M., Davis, A., Diessel, C.F.K., Littke, R. and Robert, P. (1998): Organic Petrography; Geruder Borntraeger, Berlin-Stuttgard.
88 British Columbia Resource Development and Geoscience Branch