Embed Size (px)
Citation preview

Garibaldi Provincial Park Weather Station: Technical Overview
Tyler Heilman (Quest University Canada)
July 23rd 2014

2 Garibaldi Provincial Park Weather Station: Technical Overview
1. Introduction
2. Hardware/ Electronics
a. Schematic
b. Power Supply
c. Datalogger
d. Sensors
e. Data Acquisition
3. Software
a. Interfacing System
b. Block Diagrams
4. Location
5. Infrastructure

3 Garibaldi Provincial Park Weather Station: Technical Overview
1. Introduction
This document is a technical overview of the Garibaldi Provincial Park weather station. It is an information document for those who are concerned with the progress of the station, and those who may be working on the station in the future.
2. Hardware/ Electronics
a. General Schematic This is the beta version of the schematic for the weather station.
b. Power Supply The station is powered from a bank of 12V Pb-acid batteries. The batteries are charged by a 12V solar panel. The 12-13.5V from the batteries is dropped to 7V with a switching regulator, then dropped to 5V by a linear regular onboard the datalogger. The 12-13.5V volts from the batteries is used unregulated to power the 12V radio transmitter.

4 Garibaldi Provincial Park Weather Station: Technical Overview
Battery: Panasonic Pb-acid 12V, 7.6Ah Solar Panel: Coleman 25W, Model #38028 Switching Regulator: Recom DC/DC 8-18V to 6.5V Model # R-78B6.5-1.5 c. Datalogger The weather station datalogger is an Arduino Mega © microcontroller board. The microcontroller manages all data capture, transfer, and computation. All sensors receive power from and send signals to the microcontroller. Features of the Arduino Mega ©:
Microcontroller: ATmega1280 Logic Voltage: 5V Flash memory: 128 KB Analog to Digital Converter: 10 bit, 16 channels, 9.6 KHz, 4.9mV per step Input Voltage: 6.5V Current Draw; ~50milliamps
d. Sensors
1. Apogee© Silicon-Cell Pyranometer Accuracy due to temperature response: ±.04% per °C Accuracy due to cosine response: ±1% at 45° zenith angle, ±5% at 75° zenith angle 2. Unidata© Thermistor, model 6507D Accuracy: ±0.1°C 3. GeoScientific© Jarek Tipping Bucket Rain Gauge Accuracy: ±1% 4. Aosong © 2315 Humidity Sensor Accuracy: ±2% RH 5. NovaLynx © Model 200-WS-02F Wind Speed and Direction Sensor Wind Direction Accuracy: 20K ohm pot with ±1% linearity, 5° dead band. Overall ±3% Accuracy Wind Speed Accuracy: ±3% (calibrated) Max Windspeed (datalogging): 130 mph 6. Apogee © Barometric Pressure Sensor Accuracy: 1.5% over range of 15 to 115kPa
e. Data Acquisition The data are saved in a csv file to an SD card. An SD card of 4GB can save 10+ years of data, and it can be retrieved at the interval desired. Data will be available real time. Two communication options were being considered for this data transfer:
Cellular Network

5 Garibaldi Provincial Park Weather Station: Technical Overview
Radio Transmission Radio transmission is favored because of the lack of continuing costs. With this method, the data would be communicated from the station to a receiver at QUC with a 900 MHz signal. The communication and interfacing platform favored for this data transfer is the xbee/zigbee © system for its easy interfacing with the Arduino © and low cost. Once loaded onto the xbee at QUC campus, the data would be downloaded onto a server and uploaded on to a website where the complete csv file would be available, along with graphical and numerical representations of recent weather at the site. Although radio transmission is preferred, the finalized site does not have a line of sight back to Squamish. This necessitates data transfer to be done over the cellular network. Equipment for this has been purchased, and continuing costs for cellular subscriptions are estimated at $15/mo. The method of data retrieval and presentation described above can still be employed.
3. Software
a. Interfacing System The code for the station is uploaded onto the ATmega2560 microcontroller using the Arduino © IDE (Integrated Development Environment). The Arduino © IDE is a high-level programming language based off of C++ and the Processing © development environment. After development on a computer, the code is loaded onto the Arduino © via a USB connection and the pre-loaded bootloader.
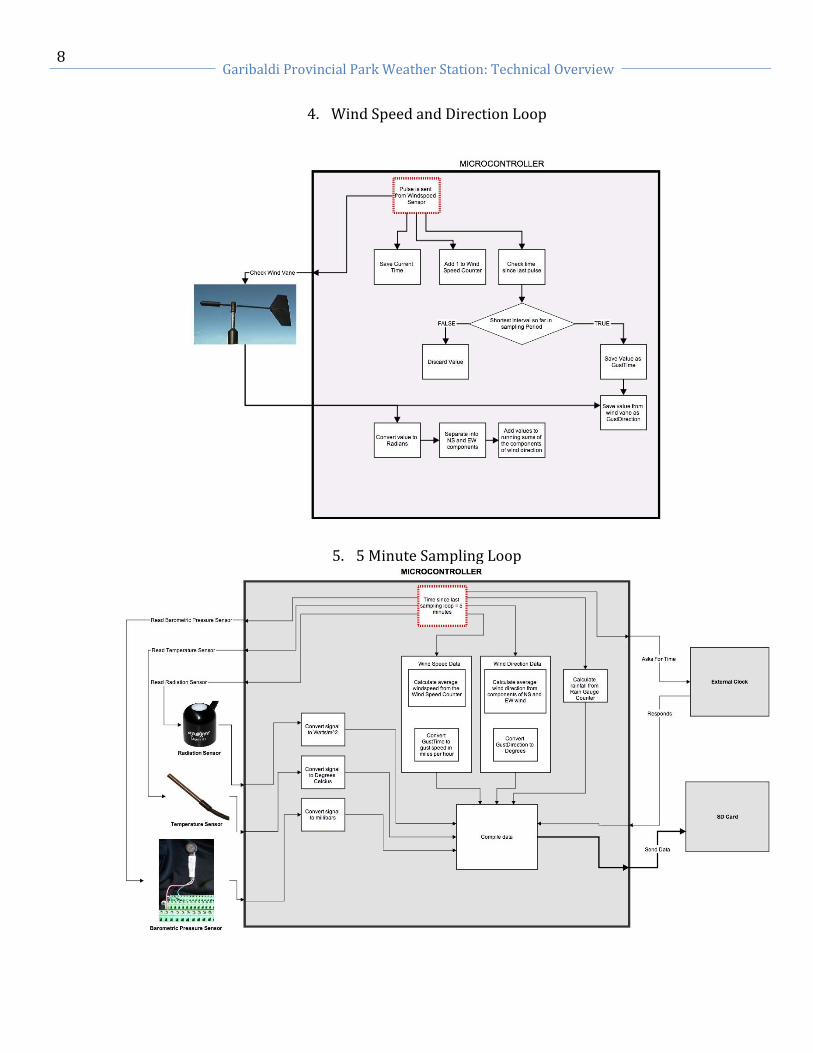
b. Flow Diagrams The following is a visual representation of the code for the station. Initial states are indicated with red dashed lines and conditional statements are indicated with a diamond shape. All flow diagrams correspond to a section of code, and therefore a specific function of the station. If concerned with the exact wording of the code refer to the Appendix, Section 1.
1. Weather Station Start-Up Sequence

6 Garibaldi Provincial Park Weather Station: Technical Overview

7 Garibaldi Provincial Park Weather Station: Technical Overview
2. General Loop Sequence
4. Rain Gauge Loop
8 Garibaldi Provincial Park Weather Station: Technical Overview
4. Wind Speed and Direction Loop
5. 5 Minute Sampling Loop

9 Garibaldi Provincial Park Weather Station: Technical Overview
4. Location
More than 10 sites were assessed in their ability to meet a set of requirements and recommendations set out by Environment Canada, and meet the needs of the organizations involved. To satisfy the standards of Environment Canada, the site must be:
Away from any obstacles such as trees, houses, or other infrastructure. (In order to comply with the international standard, the distance to the obstacle must be more than 10 times the height of the obstacle)
Free from irregular features such as isolated streams, ridges, or deep valleys Grassy, or with unobtrusive, low-lying fauna. Large expanses of open rock are to be avoided
For the Squamish First Nations and BC Parks, the site must be:
Free of significant historical and cultural value Impossible or difficult to see from high traffic areas in the park
In addition to these requirements the site should be:
Accessible, as to allow installation without serious use of the budget Topographically safe (in both summer and winter), to minimize risk of damage to the station or
persons working on the station The finalized site meets all of the requirements of the organizations involved and is the closest to
meeting the standards of Environment Canada of any of the sites assessed. After consultation with EC, it has been asserted that the failure to meet these international standards is acceptable for the area the station is installed in.

10 Garibaldi Provincial Park Weather Station: Technical Overview
The finalized site. Trees in the immediate area were measured at 5 m to 20 m of height. The Elfin lakes trail can be seen in the bottom right corner. Image retrieved from Google EarthTM.
The approximate ratio of height of the obstacle to distance the obstacle for the site is 1:3. This ratio was deemed to be acceptable and construction on the site is under way.
5. Infrastructure The station will be mounted on a 12 m stainless pole guyed and bolted into rock. The guys will be posted at 3 radial points and 2 heights on the mast (6.13 m and 9.2 m) for a total of 6 guys. Standard measuring height of 1.25-2 m would result in snow burial of the sensors, so the datalogger and all sensors besides radiation and wind will be bolted to the mast at 5 m. The radiation sensor will be installed at 12 m, and the windspeed/direction sensor will be installed at the international standard height of 10 m.

11 Garibaldi Provincial Park Weather Station: Technical Overview
Diagram shows tower, location of sensors, and the topography of the immediate site area. The image was created
with survey equipment and a 3D rendering software: Google SketchUpTM.
Appendix:
Section 1. Code Refer back to the block diagrams (2c. ) for visual representation of the text below. #include <math.h> //for the math
#include <SD.h> //SD library
#include <Wire.h> //library for connection to Real Time Clock and SD data communication (I2C communication)
#include "RTClib.h" //library for the RTC
const int chipSelect = 10; this is for I2C communication
RTC_DS1307 RTC; //Defines which RTC (Real Time Clock) we are using
int samplingtime = 5; // time in between sampling intervals -1 (in seconds)
unsigned long oldunixtime = 0; //Time since some arbitrarily old date. It is an integer representation o the current date and time
in the unit seconds
//Variables for the anemometer
const int AnemometerPin = 2; //The pin the anemometer is attached to
int NewStateAnemometerReedSwitch = 0; //for setting up edge detection : The new state of the switch
int OldStateAnemometerReedSwitch = 0; //also for setting up edge detection : The old state of the switch
unsigned int OLDtimeAnemometerFreq = 0; //sampling intervals..
float TimerAnemometerFreq = 0; //time in between each pulse
float avgmph = 0; //variable for avg at polling intervals
long AvgCountAnemometer = 0; //pulses per sampling interval
float currentMPH = 0; //Current wind speed in MPH
float gustMPH = 0; //saves the wind speed maximum (in MPH)
//variables for the wind vane
const int vaneinput = A0; //vane is attached to A0
int winddirection = 0; //10bit Value for wind direction
int gustdirection = 0; // 0-360 degree value for gust direction

12 Garibaldi Provincial Park Weather Station: Technical Overview
float u_wind = 0; //vertical component of wind direction (NS component)
float v_wind = 0; //horizontal component of wind direction (EW component)
float u_windavgcount = 0; //component average counts
float v_windavgcount = 0; // ""
float u_windavgfinal = 0; //component average for sampling period
float v_windavgfinal = 0; // ""
float WindAvgRads = 0; //direction in Rads ranging from -pi to +pi
int avgwinddirection = 0; //average wind direction for sampling period in 0-360 degrees
//
//Variables for the Rain Gauge
const int RainGaugePin = 3; //The rain gauge is hooked up to I/O pin 3
int RainGaugeCounter; //number of times that the rain gauge bucket tips in the sampling period
int RainGaugeState = 0; //for edge detection of the rain gauge
long O = 0; //for saving current time, calling up later as old time
long I = 200; //interval for reed switch debounce delay
float rainfall; //amount of rainfall during sampling period
float RainGaugeCalibrationFactor = .25; //each tip of the rain gauge is calibrated to equal __mm of rainfal
//Variables for the 6507D Temperature Probe
int TemperaturePin = A1; // select the input pin for the potentiometer
int resistor = 15000; //Resistor is 15000 ohms
double value1; //intermediary variable neccessary for math
float value; //intermediary variable as well
float TemperatureSensorValue = 0; // variable to store the value coming from the sensor
float TempValueCelcius = 0; //final temperature value
//Variables for the Apogee Silicon Cell Pyranometer (0-2.5V output)
const int PyranometerPin = A2; //Pyranometer is attached to analog pin A2
int PyraPinVal = 0; //10bit value from sensor
float RadiationIntensity = 0; //Value in Watts/m^2
//
//Variables for the Apogee Barometer
const int BarometerPin = A3; //Barometric Pressure Sensor is hooked up to Analog Pin A3
int BarPinVal = 0; //10bit value from sensor
int PressureMillibars = 0; //Value for pressure in millibars
//
void setup() {
analogReference(DEFAULT);
Serial.begin(9600); //start serial monitor at 9600 baud rate
pinMode(AnemometerPin, INPUT); //sets the anemometer pin as an input
pinMode(RainGaugePin, INPUT);
Wire.begin(); //starts the library for I2C connection
RTC.begin(); //starts the library for RTC callups
if (! RTC.isrunning()) { //if the clock is not running
Serial.println("RTC is NOT running!"); //Tell us!
}
Serial.print("me - you there SD?");
if (!SD.begin(chipSelect)) { //if the SD card is not running
Serial.println("SD - nope :( "); //everything stops :(
return;
}
else {
Serial.println("SD - yep, get't on!"); //if it is running, continue on

13 Garibaldi Provincial Park Weather Station: Technical Overview
}
File (datafile) = SD.open("wxdata.csv" , FILE_WRITE); //open or write a csv file called wxdata
if(datafile) { //The following are headers for data tables that get filled with weather data
datafile.print("Date");
datafile.print(",");
datafile.print("Time");
datafile.print(",");
datafile.print("pulses per interval");
datafile.print(",");
datafile.print("interval high");
datafile.print(",");
datafile.print("Wind Direction");
datafile.print(",");
datafile.print("Gust Direction");
datafile.print(",");
datafile.print("Temperature (Celcius)");
datafile.print(",");
datafile.print("Rainfall");
datafile.print(",");
datafile.print("Shortwave Radiation");
datafile.print(",");
datafile.println("Pressure");
datafile.close(); //close the file
}
// RTC.adjust(DateTime(__DATE__, __TIME__)); //This sets the date and time to the
//computer clock. Uncomment to reset the clock.
}
void loop() { //entering loop sequence...
DateTime now = RTC.now(); //We want time stamps for the CURRENT time
//These Variables must be declared in the loop sequence. Because they are
unsigned long N = millis(); //This variable is for the RainGuage Reed Switch Delay
unsigned long NEWtimeAnemometerFreq = millis(); //These variables are for calling up the time since the arduino has been
unsigned long timenow = millis(); // turned on, in milliseconds
//Refer to the block diagram "Rain Gauge Loop" for a visual representation of the following:
RainGaugeState = digitalRead(RainGaugePin); //check the rain gauge
if (RainGaugeState == HIGH && N - O > I) { //if sending a pulse, and last time a pulse was sent was longer then 2
O = N; //seconds ago, do the following
RainGaugeCounter +=1; //add one to a counter that is for remebering the number of tips of the rain gauge bucket
Serial.print("RainGaugeCounter = "); //send all this data to the serial port, where it can be seen on a computer
Serial.println(RainGaugeCounter);
}
//Refer to the block diagram "Wind Speed and Direction Loop" for a visual representation of the following:
NewStateAnemometerReedSwitch = digitalRead(AnemometerPin); //Check the anemometer
if (NewStateAnemometerReedSwitch != OldStateAnemometerReedSwitch) {
if (NewStateAnemometerReedSwitch == HIGH) {
//translation of the above: if the switch is in a different state from before
//and it is now high (Voltage = 5V), we count this as a pulse. Once it has been established that the
//anemometer is indeed sending a pulse, the following commands are carried out
TimerAnemometerFreq = (NEWtimeAnemometerFreq - OLDtimeAnemometerFreq); //calculate the time since last pulse
OLDtimeAnemometerFreq = NEWtimeAnemometerFreq; //save the current time
AvgCountAnemometer ++; //add one to a counter that is later used to calculate average windspeed for the sampling interval

14 Garibaldi Provincial Park Weather Station: Technical Overview
currentMPH = (1/(TimerAnemometerFreq))*1250; //for my particular anemometer, 1Hz equals approx 1.25 mph of wind. from this
relationship windspeed can be found
winddirection = analogRead(vaneinput); //read the wind vane, save the 10 bit value as winddirection
u_wind = sin((3.1415/180)*(winddirection/2.84)); //since 10bit vals have 1024 steps, divide the 10 bit val by 2.84 to get
degrees, then convert to radians
v_wind = cos((3.1415/180)*(winddirection/2.84)); //take the value in radians take the sin or cosine to get the NS and EW
components of the wind
u_windavgcount = u_windavgcount + u_wind; //add the components to a running total (for the sampling period) that is used for
average windspeed
v_windavgcount = v_windavgcount + v_wind;
if (currentMPH > gustMPH) { //if this is the highest wind so far in the interval, save the speed and direction
gustMPH = currentMPH;
gustdirection = winddirection/2.84;
}
}
}
//Refer to the block diagram "5 Minute Sampling Loop" for a visual representation of the following:
if (now.unixtime() - oldunixtime > samplingtime) { //if the time since the last sampling period is the specified interval, sample
the sensors
oldunixtime = now.unixtime(); //save the current time so we know when to start the next sampling period
//Windspeed
avgmph = ((AvgCountAnemometer/samplingtime)*1.25); //calculate average windspeed over the sampling interval
//Temperature
TemperatureSensorValue = analogRead(TemperaturePin); //poll the temperature sensor
value1 = log(resistor/((5000/(4.9*(TemperatureSensorValue)))-1))+6.913; //factory calibration equation to get
TempValueCelcius = 5078/(value1)-315.39; //temperature in celcius
//Radiation
PyraPinVal = analogRead(PyranometerPin); //Read A2 (the third of 6 analog to digital converters on the arduino uno), save the
value as the variable PyraPinVal
RadiationIntensity = (PyraPinVal*2.45); //convert to watts/m^2
//Wind Direction
u_windavgfinal = u_windavgcount/AvgCountAnemometer; //average the u component of the direction vector (EW)
v_windavgfinal = v_windavgcount/AvgCountAnemometer; //average the v component of the direction vector (NS)
WindAvgRads = atan2(u_windavgfinal, v_windavgfinal); //take the 2 coordinate arctan of the two vector components
if (WindAvgRads < 0) { //if the arctan of these two is negative...
WindAvgRads = 6.28318 + WindAvgRads; //convert it from ranging from -pi to +pi to ranging from 0 to 2pi
}
avgwinddirection = (180/3.14159)*(WindAvgRads); //convert units from radians to degrees
//Barometric Pressure
BarPinVal = analogRead(BarometerPin); //read the pin that is attached to the barometric pressure sensor
PressureMillibars = ((BarPinVal)*1.0682)+114; //convert the signal to millibars
//Rainfall
rainfall = (RainGaugeCounter)*RainGaugeCalibrationFactor; //calibration constant * # of bucket tips equals rainfall in the
sampling period
/*
//Write all the data to the csv file
File (datafile) = SD.open("wxdata.csv" , FILE_WRITE);
if(datafile) {
datafile.print(now.year(), DEC);
datafile.print("/");
datafile.print(now.month(), DEC);
datafile.print("/");
datafile.print(now.day(), DEC);
datafile.print(",");
datafile.print(now.hour(), DEC);

15 Garibaldi Provincial Park Weather Station: Technical Overview
datafile.print(":");
datafile.print(now.minute(), DEC);
datafile.print(":");
datafile.print(now.second(), DEC);
datafile.print(",");
datafile.print(AvgCountAnemometer);
datafile.print(",");
datafile.print(gustMPH);
datafile.print(",");
datafile.print(avgwinddirection);
datafile.print(",");
datafile.print(gustdirection);
datafile.print(",");
datafile.print(TempValueCelcius);
datafile.print(",");
datafile.print(rainfall);
datafile.print(",");
datafile.print(RadiationIntensity);
datafile.print(",");
datafile.println(PressureMillibars);
datafile.close();
}
*/
//spit the data out to the serial port too
Serial.print(now.year(), DEC);
Serial.print("/");
Serial.print(now.month(), DEC);
Serial.print("/");
Serial.print(now.day(), DEC);
Serial.print(",");
Serial.print(now.hour(), DEC);
Serial.print(":");
Serial.print(now.minute(), DEC);
Serial.print(":");
Serial.print(now.second(), DEC);
Serial.print("\t");
Serial.print(AvgCountAnemometer);
Serial.print("\t");
Serial.print(gustMPH);
Serial.print("\t");
Serial.print(avgwinddirection);
Serial.print("\t");
Serial.print(gustdirection);
Serial.print("\t");
Serial.print(TempValueCelcius);
Serial.print("\t");
Serial.print(rainfall);
Serial.print("\t");
Serial.print(RadiationIntensity);
Serial.print("\t");
Serial.println(PressureMillibars);
AvgCountAnemometer = 0; //reset the anemometer counter
u_windavgcount = 0; //reset all values that are sums for the sampling period
v_windavgcount = 0;
RainGaugeCounter = 0;
gustMPH = 0;
}

16 Garibaldi Provincial Park Weather Station: Technical Overview
OldStateAnemometerReedSwitch = NewStateAnemometerReedSwitch; //for state change detection or edge detection of the anemometer
}