Embed Size (px)
Citation preview
Gambling and Problem Gambling in Prince Edward Island February 2006
Doiron i
Gambling and Problem Gambling in Prince Edward Island
Prepared by
Jason Doiron, Ph.D.
Submitted to Prince Edward Island Department of Health
February, 2006
Gambling and Problem Gambling in Prince Edward Island February 2006
Doiron i
TABLE OF CONTENTS
Table of Contents……………………………………………………………………... i
Executive Summary…………………………………………………………………... iii
Introduction…………………………………………………………………………… 1
Gambling and Problem Gambling……………………………………………. 1
The Gambling Landscape in Prince Edward Island…………………………... 3
Rationale and Goals…………………………………………………………... 4
Method………………………………………………………………………... 5
Survey Instrument…………………………………………………….. 5
Sampling Procedure…………………………………………………... 7
Statistical Procedures…………………………………………………. 8
Results………………………………………………………………………………… 9
Gambling in Prince Edward Island…………………………………………… 9
Past Year Participation………………………………………………... 9
Changes in Gambling Involvement in PEI since 1999……………….. 13
Activity by Activity Analyses………………………………………… 14
Bingo………………………………………………………….. 15
Cards with Acquaintances…………………………………….. 17
Cards in Non-regulated Settings……………………………… 19
Charitable Gambling………………………………………….. 21
Daily Lottery………………………………………………….. 23
Games of Skill………………………………………………… 25
Horse Races…………………………………………………… 27
Instant-win……………………………………………………. 29
Lottery………………………………………………………… 31
Casino Slot Machines…………………………………………. 33
Sports Lotteries……………………………………………….. 35
Sports Pools…………………………………………………… 37
Casino Table Games………………………………………….. 39
Video Lottery Terminals……………………………………… 41
Gambling and Problem Gambling in Prince Edward Island February 2006
Doiron ii
Problem Gambling in Prince Edward Island………………………………….. 50
Demographic Characteristics…………………………………………. 51
Participation Patterns…………………………………………………. 53
Links Between Problem Gambling and Specific Gambling Activities.. 57
Motivations for Gambling…………………………………………….. 58
Early Gambling Experiences…………………………………………. 60
Consequences of Gambling…………………………………………... 62
Gambling and Mental Health…………………………………………. 63
Alcohol / Drug Problems …………………………………………….. 65
Treatment Issues……………………………………………………… 65
Conclusions and Recommendations………………………………………………….. 68
References…………………………………………………………………………….. 74
Appendix…………………………………………………………………………….... 75
Gambling and Problem Gambling in Prince Edward Island February 2006
Doiron iii
EXECUTIVE SUMMARY
Background
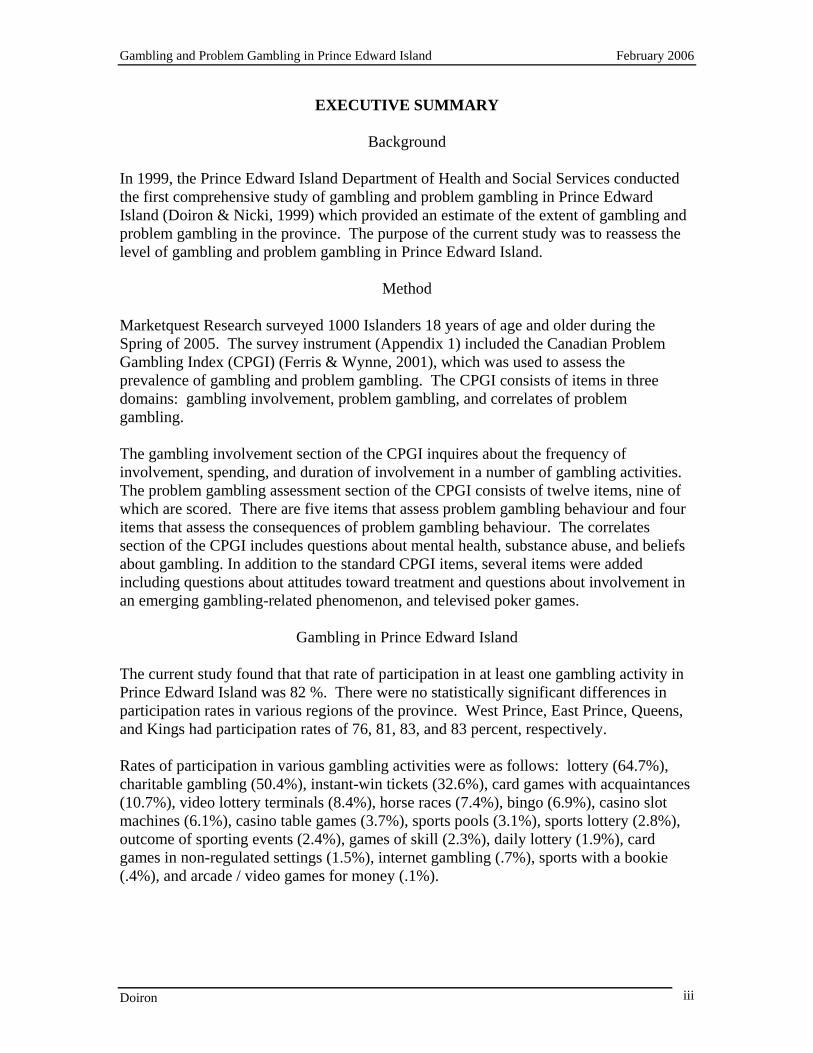
In 1999, the Prince Edward Island Department of Health and Social Services conducted the first comprehensive study of gambling and problem gambling in Prince Edward Island (Doiron & Nicki, 1999) which provided an estimate of the extent of gambling and problem gambling in the province. The purpose of the current study was to reassess the level of gambling and problem gambling in Prince Edward Island.
Method Marketquest Research surveyed 1000 Islanders 18 years of age and older during the Spring of 2005. The survey instrument (Appendix 1) included the Canadian Problem Gambling Index (CPGI) (Ferris & Wynne, 2001), which was used to assess the prevalence of gambling and problem gambling. The CPGI consists of items in three domains: gambling involvement, problem gambling, and correlates of problem gambling. The gambling involvement section of the CPGI inquires about the frequency of involvement, spending, and duration of involvement in a number of gambling activities. The problem gambling assessment section of the CPGI consists of twelve items, nine of which are scored. There are five items that assess problem gambling behaviour and four items that assess the consequences of problem gambling behaviour. The correlates section of the CPGI includes questions about mental health, substance abuse, and beliefs about gambling. In addition to the standard CPGI items, several items were added including questions about attitudes toward treatment and questions about involvement in an emerging gambling-related phenomenon, and televised poker games.
Gambling in Prince Edward Island The current study found that that rate of participation in at least one gambling activity in Prince Edward Island was 82 %. There were no statistically significant differences in participation rates in various regions of the province. West Prince, East Prince, Queens, and Kings had participation rates of 76, 81, 83, and 83 percent, respectively. Rates of participation in various gambling activities were as follows: lottery (64.7%), charitable gambling (50.4%), instant-win tickets (32.6%), card games with acquaintances (10.7%), video lottery terminals (8.4%), horse races (7.4%), bingo (6.9%), casino slot machines (6.1%), casino table games (3.7%), sports pools (3.1%), sports lottery (2.8%), outcome of sporting events (2.4%), games of skill (2.3%), daily lottery (1.9%), card games in non-regulated settings (1.5%), internet gambling (.7%), sports with a bookie (.4%), and arcade / video games for money (.1%).
Gambling and Problem Gambling in Prince Edward Island February 2006
Doiron iv
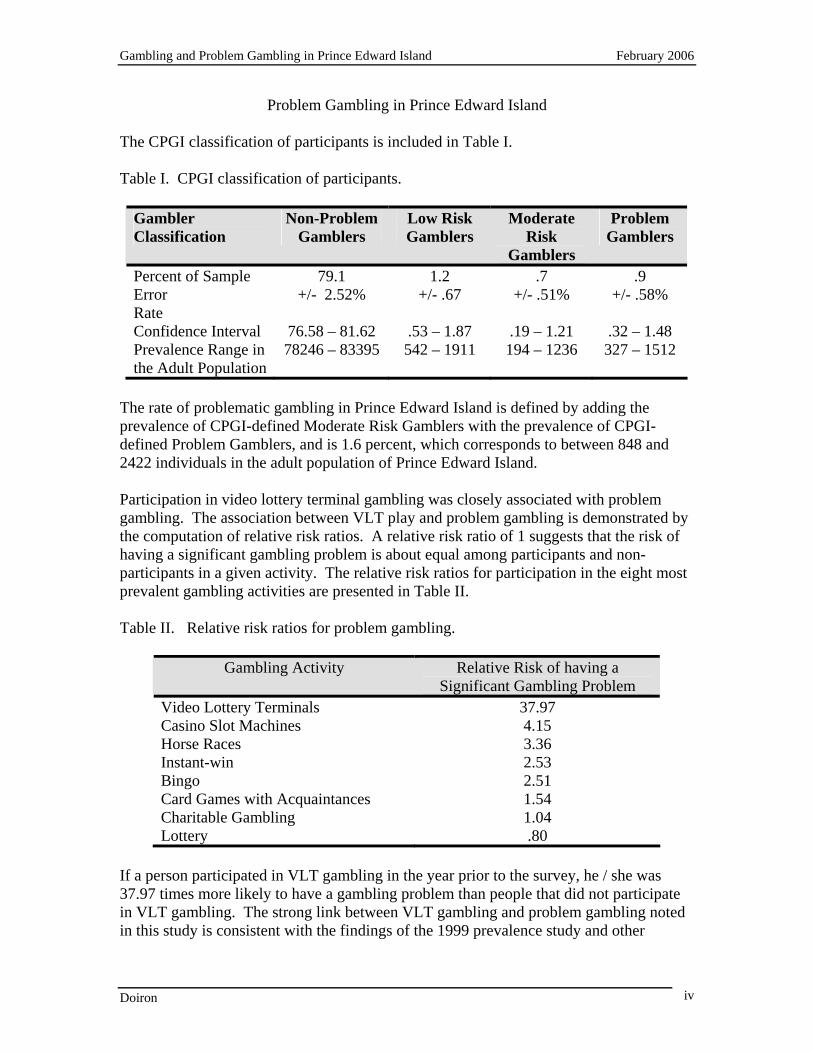
Problem Gambling in Prince Edward Island The CPGI classification of participants is included in Table I. Table I. CPGI classification of participants.
Gambler Classification
Non-Problem Gamblers
Low Risk Gamblers
Moderate Risk
Gamblers
Problem Gamblers
Percent of Sample 79.1 1.2 .7 .9 Error Rate
+/- 2.52% +/- .67 +/- .51% +/- .58%
Confidence Interval 76.58 – 81.62 .53 – 1.87 .19 – 1.21 .32 – 1.48 Prevalence Range in the Adult Population
78246 – 83395 542 – 1911 194 – 1236 327 – 1512
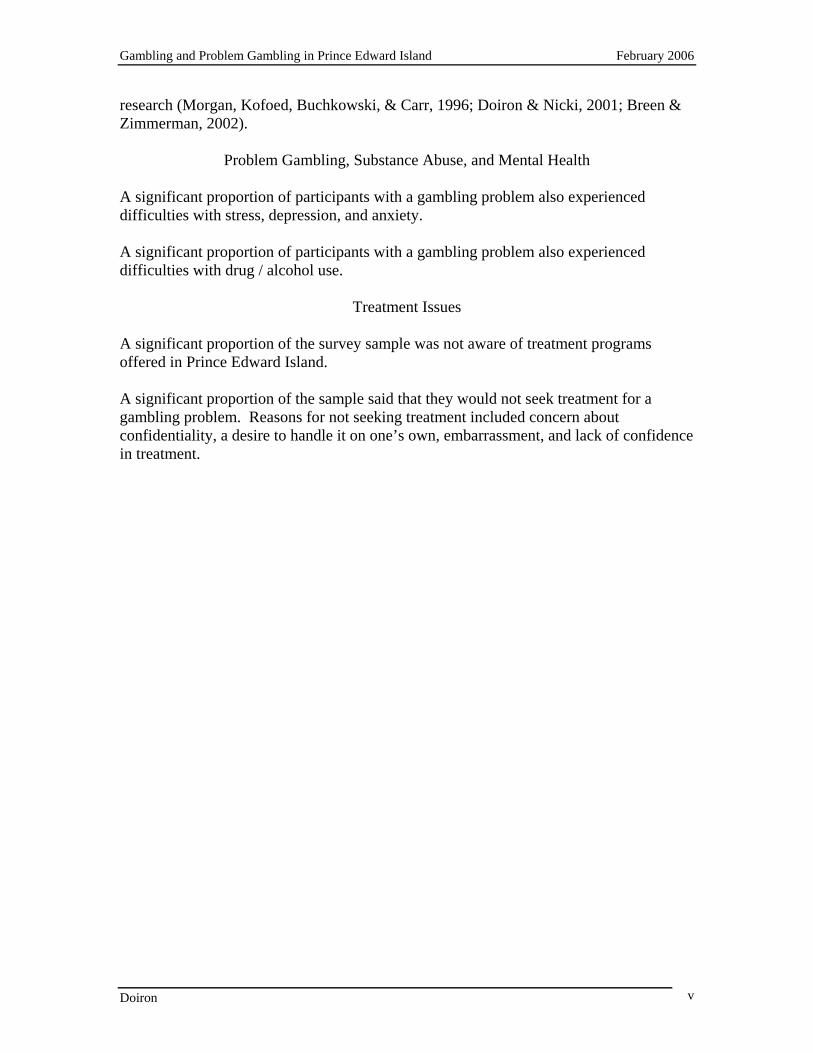
The rate of problematic gambling in Prince Edward Island is defined by adding the prevalence of CPGI-defined Moderate Risk Gamblers with the prevalence of CPGI-defined Problem Gamblers, and is 1.6 percent, which corresponds to between 848 and 2422 individuals in the adult population of Prince Edward Island. Participation in video lottery terminal gambling was closely associated with problem gambling. The association between VLT play and problem gambling is demonstrated by the computation of relative risk ratios. A relative risk ratio of 1 suggests that the risk of having a significant gambling problem is about equal among participants and non-participants in a given activity. The relative risk ratios for participation in the eight most prevalent gambling activities are presented in Table II. Table II. Relative risk ratios for problem gambling.
Gambling Activity Relative Risk of having a Significant Gambling Problem
Video Lottery Terminals 37.97 Casino Slot Machines 4.15 Horse Races 3.36 Instant-win 2.53 Bingo 2.51 Card Games with Acquaintances 1.54 Charitable Gambling 1.04 Lottery .80
If a person participated in VLT gambling in the year prior to the survey, he / she was 37.97 times more likely to have a gambling problem than people that did not participate in VLT gambling. The strong link between VLT gambling and problem gambling noted in this study is consistent with the findings of the 1999 prevalence study and other
Gambling and Problem Gambling in Prince Edward Island February 2006
Doiron v
research (Morgan, Kofoed, Buchkowski, & Carr, 1996; Doiron & Nicki, 2001; Breen & Zimmerman, 2002).
Problem Gambling, Substance Abuse, and Mental Health A significant proportion of participants with a gambling problem also experienced difficulties with stress, depression, and anxiety. A significant proportion of participants with a gambling problem also experienced difficulties with drug / alcohol use.
Treatment Issues A significant proportion of the survey sample was not aware of treatment programs offered in Prince Edward Island. A significant proportion of the sample said that they would not seek treatment for a gambling problem. Reasons for not seeking treatment included concern about confidentiality, a desire to handle it on one’s own, embarrassment, and lack of confidence in treatment.
Gambling and Problem Gambling in Prince Edward Island February 2006
Doiron 1
INTRODUCTION In 1999, the Prince Edward Island Department of Health and Social Services conducted the first comprehensive study of gambling and problem gambling in Prince Edward Island (Doiron & Nicki, 1999) which provided an estimate of the extent of gambling and problem gambling in the province. It was found that the participation rate in gambling was 83 percent and the rate of problem gambling, assessed by the South Oaks Gambling Screen (SOGS, Lesieur & Bloom, 1987) was 3.1 percent. The purpose of the current study was to reassess the level of gambling and problem gambling in Prince Edward Island.
Gambling and Problem Gambling
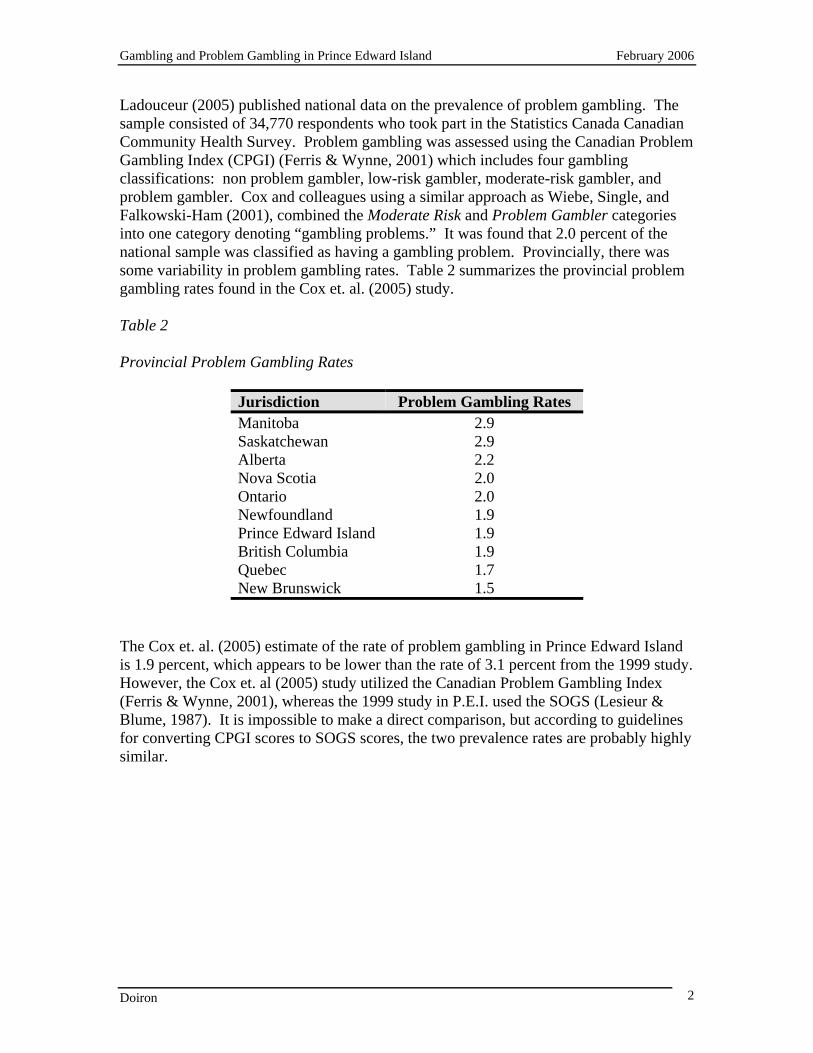
It has long been established that gambling is a popular activity in Canada, with the large majority of Canadians gambling on at least one activity in any given 12 month period. Revenue from gambling reflects this popularity. Net revenue (i.e., revenue after prize payouts) from lotteries, video lottery terminals, and casinos increased from $2.7 billion in 1992 to $11.3 billion in 2002. Employment in the gambling industry rose from 12,000 in 1992 to 42,000 in 2002. Per capita expenditures on gambling are reported in Table 1. (Statistics Canada, 2003). Table 1 Per Capita Expenditures on Gambling by Jurisdiction
Jurisdiction 1992 2001 Alberta 120 604 Manitoba 185 538 Nova Scotia 180 473 Saskatchewan 85 467 Quebec 130 466 Ontario 105 441 Newfoundland & Labrador 190 438 British Columbia 155 319 New Brunswick 210 311 Prince Edward Island 205 283 Yukon, Northwest Territories, Nunavut 80 105
Per capita expenditures on gambling have increased substantially in all jurisdictions, including Prince Edward Island where the average annual gambling expenditures of adult Prince Edward Islanders rose from $205 in 1992 to $283 in 2001, a 38 percent increase. The average Canadian per capita expenditure on gambling was $447 in 2001 (Statistics Canada, 2003). In light of the expanding gambling industry it is not surprising that some Canadians develop a problem with their gambling behaviour. Recently, Cox, Yu, Afifi, and
Gambling and Problem Gambling in Prince Edward Island February 2006
Doiron 2
Ladouceur (2005) published national data on the prevalence of problem gambling. The sample consisted of 34,770 respondents who took part in the Statistics Canada Canadian Community Health Survey. Problem gambling was assessed using the Canadian Problem Gambling Index (CPGI) (Ferris & Wynne, 2001) which includes four gambling classifications: non problem gambler, low-risk gambler, moderate-risk gambler, and problem gambler. Cox and colleagues using a similar approach as Wiebe, Single, and Falkowski-Ham (2001), combined the Moderate Risk and Problem Gambler categories into one category denoting “gambling problems.” It was found that 2.0 percent of the national sample was classified as having a gambling problem. Provincially, there was some variability in problem gambling rates. Table 2 summarizes the provincial problem gambling rates found in the Cox et. al. (2005) study.
Table 2 Provincial Problem Gambling Rates
Jurisdiction Problem Gambling Rates Manitoba 2.9 Saskatchewan 2.9 Alberta 2.2 Nova Scotia 2.0 Ontario 2.0 Newfoundland 1.9 Prince Edward Island 1.9 British Columbia 1.9 Quebec 1.7 New Brunswick 1.5
The Cox et. al. (2005) estimate of the rate of problem gambling in Prince Edward Island is 1.9 percent, which appears to be lower than the rate of 3.1 percent from the 1999 study. However, the Cox et. al (2005) study utilized the Canadian Problem Gambling Index (Ferris & Wynne, 2001), whereas the 1999 study in P.E.I. used the SOGS (Lesieur & Blume, 1987). It is impossible to make a direct comparison, but according to guidelines for converting CPGI scores to SOGS scores, the two prevalence rates are probably highly similar.
Gambling and Problem Gambling in Prince Edward Island February 2006
Doiron 3
The Gambling Landscape in Prince Edward Island Prince Edward Island is home to 379 video lottery terminals in 81 separate locations, and another 225 video lottery terminals (also known as “electronic gaming devices) at the newly opened Charlottetown Driving Park and Entertainment Centre. There are also 170 lottery ticket sales locations, and an additional 26 licensed establishments offering sports lottery (S. Costen, Atlantic Lottery Corporation, personal communication, August 29, 2005). Recent financial data from the Atlantic Lottery Corporation (Atlantic Lottery Corporation, 2005) (presented in Table 3) suggests that gambling remains a popular activity in the province. Table 3 Atlantic Lottery Corporation Financial Data on Gambling in Prince Edward Island 2004 2005 Change
(2005-2004) Ticket Sales minus prize payouts
14,859,000 14,322,000 -537,000
Video Lottery Terminal Sales minus prize payouts
18,828,000 19,667,000 839,000
The finding that net VLT revenue has increased over the past year is noteworthy in light of evidence that VLTs are associated with the development of problem gambling. For example, the 1999 prevalence study in P.E.I. indicated that problem gambling in Prince Edward Island was uniquely associated with video lottery terminal gambling: Most people who gamble at problematic levels do so using video lottery terminals (Doiron & Nicki, 2001), which is consistent with other studies that have identified a strong link between VLT gambling and the development of problem gambling. For example, Breen and Zimmerman (2002) found that VLT players develop problems with gambling significantly faster than participants who engage in other forms of gambling (3.58 vs.1.08 years, respectively). Morgan, Kofoed, Buchkowski, and Carr (1996) examined the effects of VLT use among pathological gamblers seeking treatment. The results of this study indicated that 87.9% of problem gambling treatment seekers had engaged in VLT play at some point in their gambling career. Of those who played VLTs, 94.1% were actively playing VLTs 6 months prior to seeking treatment. Moreover, significantly more symptoms of pathological gambling were associated with VLT play than with other gambling activities.
The expansion of gambling and the presence of problem gambling in P.E.I. underlines the importance of establishing gambling treatment programs. Following the 1999 prevalence study, the Department of Health and Social Services, established a problem gambling treatment program (Sperry, 2001). The treatment program was designed to serve as a “client-centered community-based mobile gambling program for problem and
Gambling and Problem Gambling in Prince Edward Island February 2006
Doiron 4
pathological gamblers and their families” (Sperry, 2001; p.1) with a hope that the services would be standardized in all regions of the province so that problem gamblers could receive the same service regardless of geographical location. The treatment philosophy was abstinence-based and a gambling-free lifestyle was advocated. The program adopted a cognitive behavioural approach with the focus on how to change behaviour, thoughts and feelings. Recent data from treatment services in Prince Edward Island suggests that some Prince Edward Islanders with gambling problems have sought treatment. Between April 1, 2004 and March 31, 2005 there were 76 referrals to the provincial gambling treatment program. Of these clients, 19 (25%) participated in the inpatient detoxification program (most of this subgroup had alcohol or drug issues), 57 (75%) participated in individual counseling, 7 (9%) attended the three week group rehabilitation program, and 5 (7%) participated in an aftercare program. The majority of participants in the treatment program were VLT gamblers. Several observations about this data are noteworthy. Firstly a large proportion of referrals seem to have been struggling with a concurrent problem (e.g., alcohol and/or drugs). Secondly, while a significant number of people with gambling problems accessed treatment, it is likely (based on the 1999 prevalence study rate of problem gambling) that a large number of Islanders with a gambling problem did not. An important adjunct to treatment is prevention. That is, it is important to provide appropriate interventions (e.g., education / information) at different levels of gambling behaviour. For example, people who gamble recreationally will benefit from acquiring knowledge about gambling and problem gambling so that they can make informed decisions about their gambling behaviour and avoid future problems. Furthermore, persons who are at-risk for a gambling problem but don’t yet meet the criteria for problem gambling, may not be appropriate for treatment programs, but may nonetheless benefit from prevention-focused interventions. Following the 1999 prevalence study, the Department of Health and Social Services developed a prevention program designed for at-risk gamblers. This program is currently being implemented. The process of implementing this program has been slowed due to the recent reorganization of the government health system.
Rationale and Goals While the 1999 study provided valuable baseline estimates of gambling and problem gambling in Prince Edward Island, the 6-year-old data are now of limited utility. Moreover, a key recommendation of the 1999 study was to continually monitor the prevalence of gambling and problem gambling in the province. The purpose of the present study is to gather updated data on the prevalence of gambling and problem gambling in Prince Edward Island. More specifically, the present study will:
Gambling and Problem Gambling in Prince Edward Island February 2006
Doiron 5
• utilize the Canadian Problem Gambling Index (CPGI), which has become the
accepted survey instrument in most Canadian jurisdictions,
• re-assess the links between problem gambling and participation in various forms of gambling,
• provide a more detailed understanding of the concurrent health issues that are
most prevalent among those with a gambling problem,
• assess the public’s knowledge of and attitudes toward gambling treatment services provided in the province,
• assess the impact of emerging gambling-related phenomena, such as gambling on
the internet and relatively pervasive gambling-related television programs (e.g., “Texas Holdem”), and
• offer recommendations which follow directly from the data gathered.
Method
Survey Instrument The survey instrument (Appendix) included the Canadian Problem Gambling Index (CPGI) (Ferris & Wynne, 2001), which was used to assess the prevalence of gambling and problem gambling. The CPGI consists of items in three domains: gambling involvement, problem gambling, and correlates of problem gambling. The Gambling involvement section of the CPGI inquires about the frequency of involvement, spending, and duration of involvement in a number of gambling activities. The gambling activities included in the CPGI are summarized in Table 4.
Gambling and Problem Gambling in Prince Edward Island February 2006
Doiron 6
Table 4 Gambling Activities Included in the CPGI
Gambling Activity Description Charitable Gambling Gambling used to raise money for non-profit groups. Daily Lottery Pick 3 etc. Lottery Traditional lotteries of the 6-49 type. Instant-win Tickets (e.g., scratch, “pull tabs). Horse Races Betting on the outcome of races involving horses. Cards with acquaintances Card games for money with friends / family etc. Cards in a non-regulated Setting Card games played in bars and other establishments. Casino Slot Machines Slot machines that are found in a casino. Video Lottery Terminals Electronic gambling machines in licensed venues. Bingo Traditional, radio, televised bingo games. Internet Gambling Gambling via the Internet for money. Sports Lottery Betting on the outcome of sporting events (Proline). Video Games Playing of video games for money. Sports Pools Betting on sporting events in a pool. Sporting Events Betting on sporting events outside pools. Sporting Events with a bookie. Betting on sporting events with a bookie. Games of Skill Includes betting games such as billiards or golf. Casino Table Games Table games in a casino, such as blackjack.
The problem gambling assessment section of the CPGI consists of twelve items, nine of which are scored. There are five items that address problem gambling behaviour and four items that assess the consequences of problem gambling behaviour. Table 5 includes the nine scored CPGI items, which ask about the previous 12 months. The response choices for these items are: a) Never (Scored 0), b) Sometimes (Scored 1), c) Most of the time (Scored 2) and d) Almost always (Scored 3). Table 5 CPGI Scored Problem Gambling Assessment Items
1. Have you bet more than you could really afford to lose 2. Have you needed to gamble with larger amounts of money to get the same feeling
of excitement? 3. When you gambled, did you go back another day to win back money you lost? 4. Have you borrow money or sold anything to get money to gamble? 5. Have you felt that you might have a problem with gambling? 6. Has gambling caused you any health problems including stress or anxiety?
Gambling and Problem Gambling in Prince Edward Island February 2006
Doiron 7
7. Have people criticized your betting or told you that you had a gambling problem, regardless of whether or not you thought it was true?
8. Has your gambling caused any financial problems for you or your household? 9. Have you felt guilty about the way you gamble or what happens when you
gamble? The maximum score on the CPGI problem gambling assessment instrument is 27. Four gambling classifications are derived from responses to the CPGI:
Non Problem Gamblers are those respondents who gamble but have a score of 0 on the CPGI. Low Risk Gamblers are those respondents who score 1 to 2 on the CPGI. Moderate Risk Gamblers are those respondents who score 3 to 7 on the CPGI. Problem Gamblers are those respondents who score 8 or more on the CPGI.
Following the same procedure as Cox, Yu, Afifi, and Ladouceur (2005) and Wiebe, Single, and Falkowski-Ham (2001), the moderate risk and problem categories on the CPGI were combined into one category denoting a “gambling problem.” The correlates of problem gambling section of the CPGI includes questions about mental health, substance abuse, and beliefs about gambling. In addition to the standard CPGI items, several items were added including questions about attitudes toward treatment and questions about involvement in an emerging gambling-related phenomenon, televised poker games. Sampling Procedure Telephone interviews were carried out by a private research firm, Marketquest Research, with demonstrated experience with surveys of this type. All Marketquest interviewers participated in training designed for interviews of this type. Interviews were monitored by senior Marketquest staff for quality assurance. The sample of 1000 respondents was selected so that it was representative of the Prince Edward Island population in terms of age, sex, and region of the province. With a sample of 1000 respondents, we can be confident that the maximum resulting error rate is 3.08 percent at the 95% confidence level. It is important to note that the error rate for a particular proportion presented in this study is likely to be lower than 3.08 percent. It is also important to note that proportions taken from less than the full sample will result in an increased error rate. The response rate for the survey was 38 percent, and was defined as the total number of cooperative contacts (i.e., the number of persons that completed the survey plus the
Gambling and Problem Gambling in Prince Edward Island February 2006
Doiron 8
number of persons that agreed but were disqualified due to quotas being filled etc.) (1523) divided by the total number of contacts asked to participate (4051). This response rate is somewhat lower than the response rate in the 1999 study (43%). Statistical Procedures Chi-square analyses are used throughout the report to compare proportions. In some cases, when an overall chi-square test is significant (p.<.05) post-hoc chi square analyses are completed to determine which specific proportions differ. In these post-hoc analyses a p-value of .025 or smaller is required for statistical significance to help reduce the probability of error related to multiple statistical analyses. One caution about the use of chi-square tests is warranted. In some circumstances, the number of participants in a particular subgroup is very small, which can make the chi-square test unstable. In these situations, it is often helpful to focus on trends visible in the data, as opposed to focusing solely on whether or not the chi-square result is significant or not. At times, proportions (percentages) do not equal 100%, due to non-response or multiple responses on a particular question.
Gambling and Problem Gambling in Prince Edward Island February 2006
Doiron 9
RESULTS
Gambling in Prince Edward Island
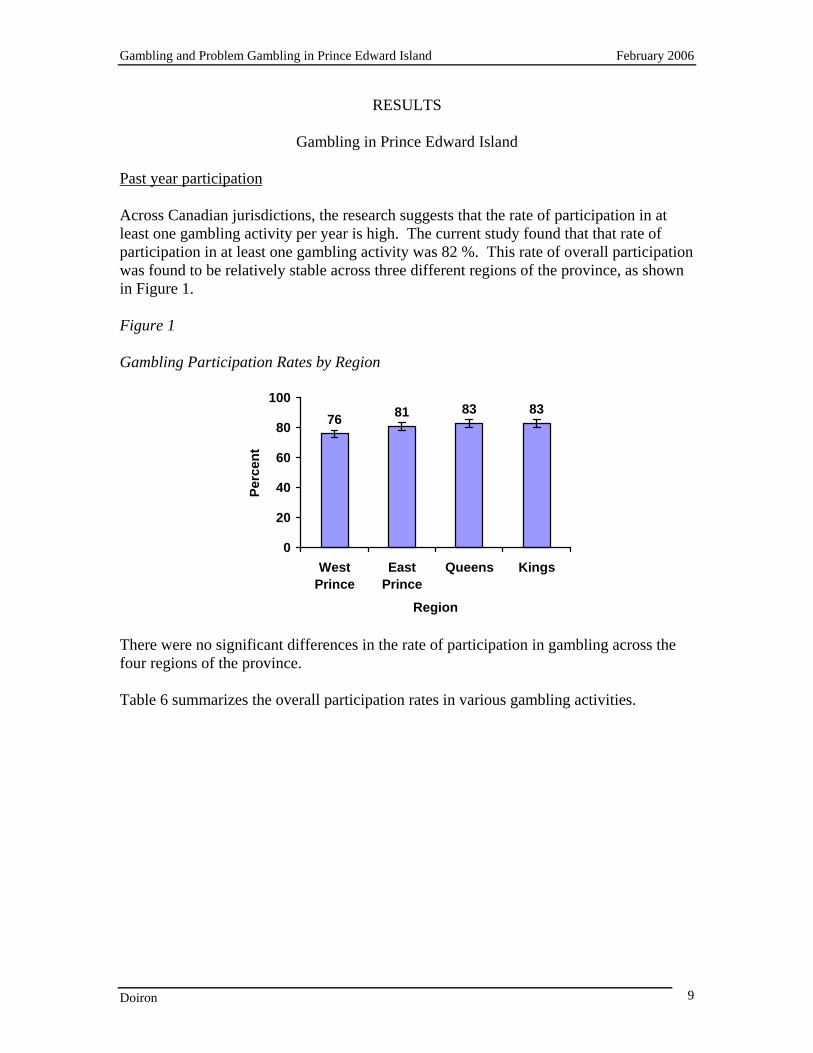
Past year participation Across Canadian jurisdictions, the research suggests that the rate of participation in at least one gambling activity per year is high. The current study found that that rate of participation in at least one gambling activity was 82 %. This rate of overall participation was found to be relatively stable across three different regions of the province, as shown in Figure 1. Figure 1 Gambling Participation Rates by Region
76 81 83 83
0
20
40
60
80
100
WestPrince
EastPrince
Queens Kings
Region
Perc
ent
There were no significant differences in the rate of participation in gambling across the four regions of the province. Table 6 summarizes the overall participation rates in various gambling activities.
Gambling and Problem Gambling in Prince Edward Island February 2006
Doiron 10
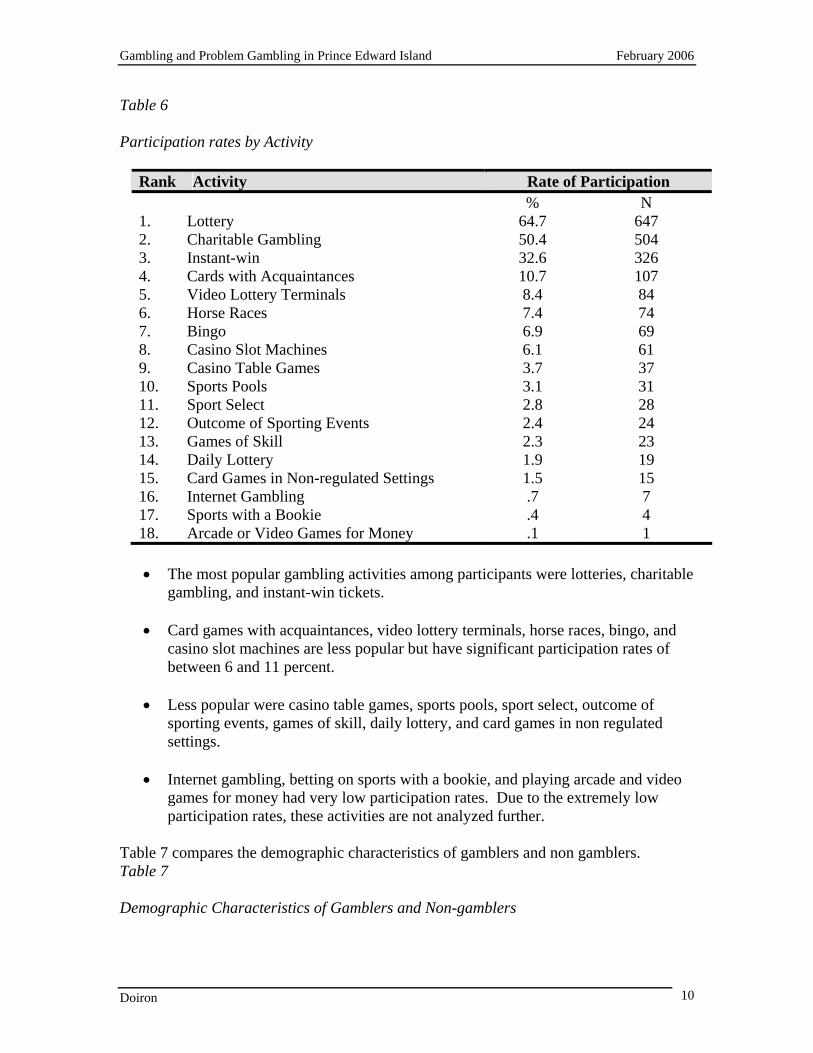
Table 6 Participation rates by Activity
Rank Activity Rate of Participation % N 1. Lottery 64.7 647 2. Charitable Gambling 50.4 504 3. Instant-win 32.6 326 4. Cards with Acquaintances 10.7 107 5. Video Lottery Terminals 8.4 84 6. Horse Races 7.4 74 7. Bingo 6.9 69 8. Casino Slot Machines 6.1 61 9. Casino Table Games 3.7 37 10. Sports Pools 3.1 31 11. Sport Select 2.8 28 12. Outcome of Sporting Events 2.4 24 13. Games of Skill 2.3 23 14. Daily Lottery 1.9 19 15. Card Games in Non-regulated Settings 1.5 15 16. Internet Gambling .7 7 17. Sports with a Bookie .4 4 18. Arcade or Video Games for Money .1 1
• The most popular gambling activities among participants were lotteries, charitable
gambling, and instant-win tickets.
• Card games with acquaintances, video lottery terminals, horse races, bingo, and casino slot machines are less popular but have significant participation rates of between 6 and 11 percent.
• Less popular were casino table games, sports pools, sport select, outcome of
sporting events, games of skill, daily lottery, and card games in non regulated settings.
• Internet gambling, betting on sports with a bookie, and playing arcade and video
games for money had very low participation rates. Due to the extremely low participation rates, these activities are not analyzed further.
Table 7 compares the demographic characteristics of gamblers and non gamblers. Table 7 Demographic Characteristics of Gamblers and Non-gamblers
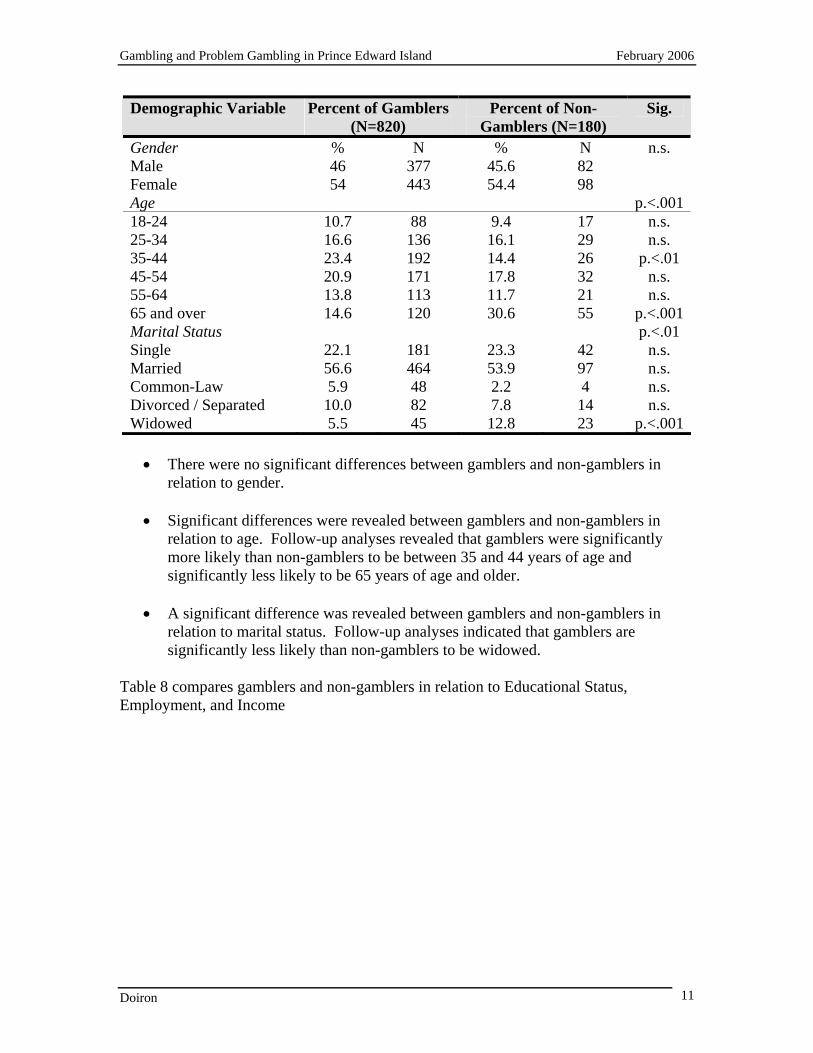
Gambling and Problem Gambling in Prince Edward Island February 2006
Doiron 11
Demographic Variable Percent of Gamblers (N=820)
Percent of Non- Gamblers (N=180)
Sig.
Gender % N % N n.s. Male 46 377 45.6 82 Female 54 443 54.4 98 Age p.<.00118-24 10.7 88 9.4 17 n.s. 25-34 16.6 136 16.1 29 n.s. 35-44 23.4 192 14.4 26 p.<.01 45-54 20.9 171 17.8 32 n.s. 55-64 13.8 113 11.7 21 n.s. 65 and over 14.6 120 30.6 55 p.<.001Marital Status p.<.01 Single 22.1 181 23.3 42 n.s. Married 56.6 464 53.9 97 n.s. Common-Law 5.9 48 2.2 4 n.s. Divorced / Separated 10.0 82 7.8 14 n.s. Widowed 5.5 45 12.8 23 p.<.001
• There were no significant differences between gamblers and non-gamblers in
relation to gender.
• Significant differences were revealed between gamblers and non-gamblers in relation to age. Follow-up analyses revealed that gamblers were significantly more likely than non-gamblers to be between 35 and 44 years of age and significantly less likely to be 65 years of age and older.
• A significant difference was revealed between gamblers and non-gamblers in
relation to marital status. Follow-up analyses indicated that gamblers are significantly less likely than non-gamblers to be widowed.
Table 8 compares gamblers and non-gamblers in relation to Educational Status, Employment, and Income
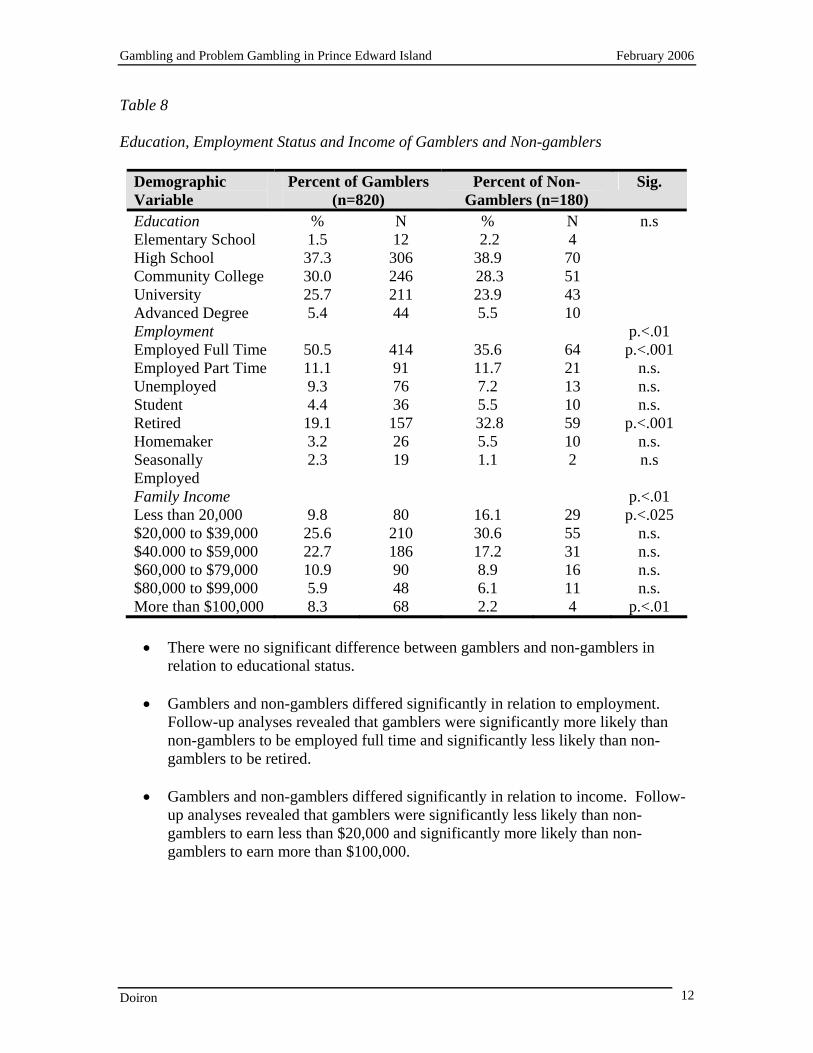
Gambling and Problem Gambling in Prince Edward Island February 2006
Doiron 12
Table 8 Education, Employment Status and Income of Gamblers and Non-gamblers
Demographic Variable
Percent of Gamblers (n=820)
Percent of Non- Gamblers (n=180)
Sig.
Education % N % N n.s Elementary School 1.5 12 2.2 4 High School 37.3 306 38.9 70 Community College 30.0 246 28.3 51 University 25.7 211 23.9 43 Advanced Degree 5.4 44 5.5 10 Employment p.<.01 Employed Full Time 50.5 414 35.6 64 p.<.001 Employed Part Time 11.1 91 11.7 21 n.s. Unemployed 9.3 76 7.2 13 n.s. Student 4.4 36 5.5 10 n.s. Retired 19.1 157 32.8 59 p.<.001 Homemaker 3.2 26 5.5 10 n.s. Seasonally Employed
2.3 19 1.1 2 n.s
Family Income p.<.01 Less than 20,000 9.8 80 16.1 29 p.<.025 $20,000 to $39,000 25.6 210 30.6 55 n.s. $40.000 to $59,000 22.7 186 17.2 31 n.s. $60,000 to $79,000 10.9 90 8.9 16 n.s. $80,000 to $99,000 5.9 48 6.1 11 n.s. More than $100,000 8.3 68 2.2 4 p.<.01
• There were no significant difference between gamblers and non-gamblers in
relation to educational status.
• Gamblers and non-gamblers differed significantly in relation to employment. Follow-up analyses revealed that gamblers were significantly more likely than non-gamblers to be employed full time and significantly less likely than non-gamblers to be retired.
• Gamblers and non-gamblers differed significantly in relation to income. Follow-
up analyses revealed that gamblers were significantly less likely than non-gamblers to earn less than $20,000 and significantly more likely than non-gamblers to earn more than $100,000.
Gambling and Problem Gambling in Prince Edward Island February 2006
Doiron 13
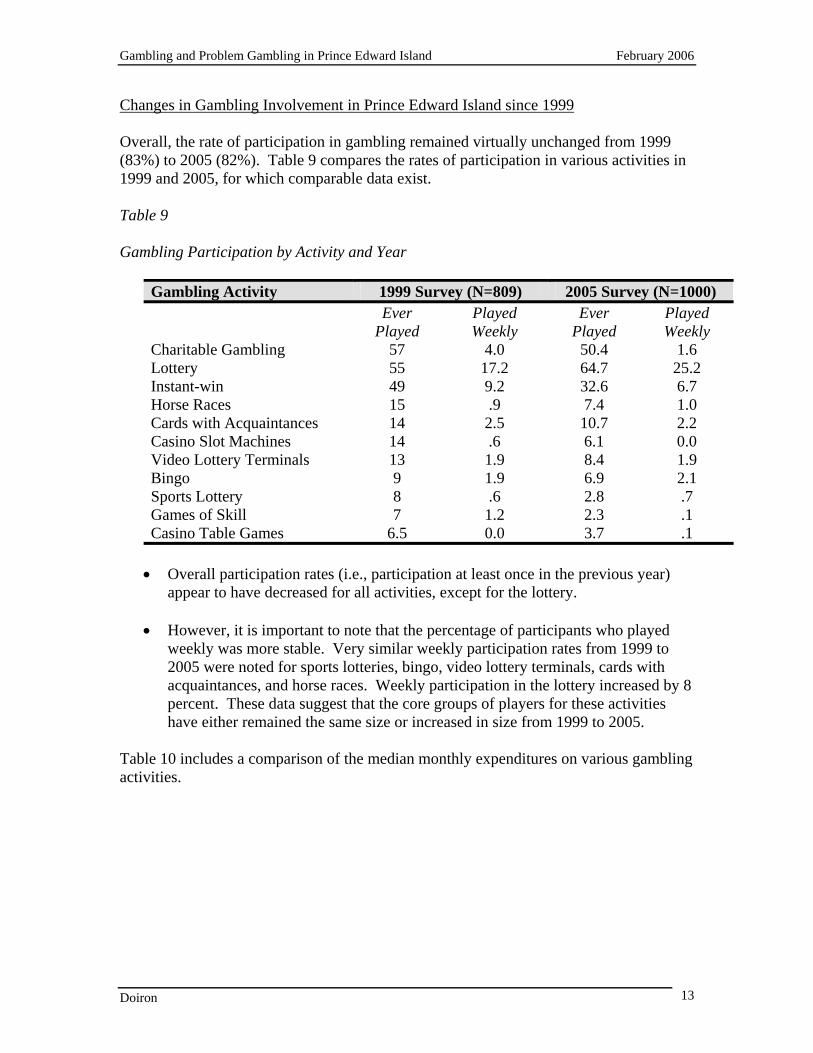
Changes in Gambling Involvement in Prince Edward Island since 1999 Overall, the rate of participation in gambling remained virtually unchanged from 1999 (83%) to 2005 (82%). Table 9 compares the rates of participation in various activities in 1999 and 2005, for which comparable data exist.
Table 9 Gambling Participation by Activity and Year
Gambling Activity 1999 Survey (N=809) 2005 Survey (N=1000) Ever
Played Played Weekly
Ever Played
Played Weekly
Charitable Gambling 57 4.0 50.4 1.6 Lottery 55 17.2 64.7 25.2 Instant-win 49 9.2 32.6 6.7 Horse Races 15 .9 7.4 1.0 Cards with Acquaintances 14 2.5 10.7 2.2 Casino Slot Machines 14 .6 6.1 0.0 Video Lottery Terminals 13 1.9 8.4 1.9 Bingo 9 1.9 6.9 2.1 Sports Lottery 8 .6 2.8 .7 Games of Skill 7 1.2 2.3 .1 Casino Table Games 6.5 0.0 3.7 .1
• Overall participation rates (i.e., participation at least once in the previous year)
appear to have decreased for all activities, except for the lottery.
• However, it is important to note that the percentage of participants who played weekly was more stable. Very similar weekly participation rates from 1999 to 2005 were noted for sports lotteries, bingo, video lottery terminals, cards with acquaintances, and horse races. Weekly participation in the lottery increased by 8 percent. These data suggest that the core groups of players for these activities have either remained the same size or increased in size from 1999 to 2005.
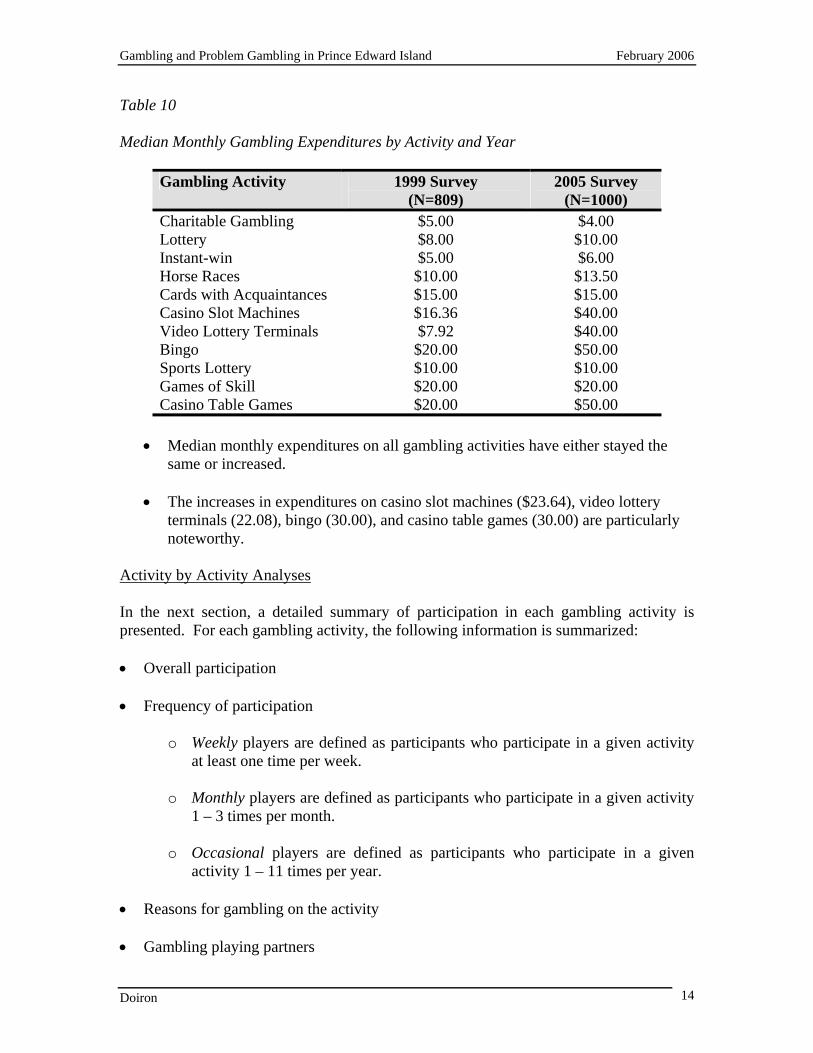
Table 10 includes a comparison of the median monthly expenditures on various gambling activities.
Gambling and Problem Gambling in Prince Edward Island February 2006
Doiron 14
Table 10 Median Monthly Gambling Expenditures by Activity and Year
Gambling Activity 1999 Survey
(N=809) 2005 Survey
(N=1000) Charitable Gambling $5.00 $4.00 Lottery $8.00 $10.00 Instant-win $5.00 $6.00 Horse Races $10.00 $13.50 Cards with Acquaintances $15.00 $15.00 Casino Slot Machines $16.36 $40.00 Video Lottery Terminals $7.92 $40.00 Bingo $20.00 $50.00 Sports Lottery $10.00 $10.00 Games of Skill $20.00 $20.00 Casino Table Games $20.00 $50.00
• Median monthly expenditures on all gambling activities have either stayed the
same or increased.
• The increases in expenditures on casino slot machines ($23.64), video lottery terminals (22.08), bingo (30.00), and casino table games (30.00) are particularly noteworthy.
Activity by Activity Analyses In the next section, a detailed summary of participation in each gambling activity is presented. For each gambling activity, the following information is summarized: • Overall participation • Frequency of participation
o Weekly players are defined as participants who participate in a given activity at least one time per week.
o Monthly players are defined as participants who participate in a given activity
1 – 3 times per month.
o Occasional players are defined as participants who participate in a given activity 1 – 11 times per year.
• Reasons for gambling on the activity • Gambling playing partners
Gambling and Problem Gambling in Prince Edward Island February 2006
Doiron 15
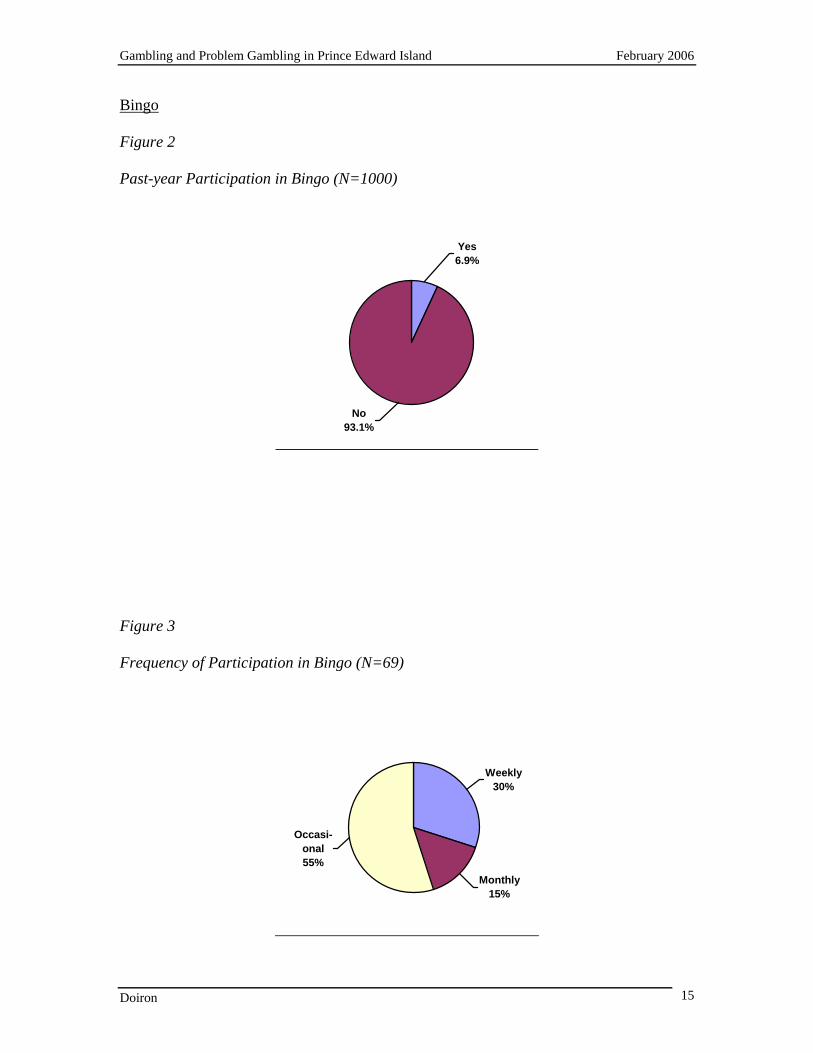
Bingo Figure 2 Past-year Participation in Bingo (N=1000)
No93.1%
Yes6.9%
Figure 3 Frequency of Participation in Bingo (N=69)
Occasi-onal55%
Monthly15%
Weekly30%
Gambling and Problem Gambling in Prince Edward Island February 2006
Doiron 16
Figure 4 Reasons for Playing Bingo (N=69)
0 20 40 60 80 100
Other
To be with friends
Excitement / Challenge
As a hobby
To win
Worthy causes
Curiosity
Entertainment
Percent
Figure 5 Bingo Playing Partners (N=69)
0 20 40 60 80 100
Other
Alone
Spouse /Partner
Other FamilyMembers
Friends /Coworkers
Percent
Gambling and Problem Gambling in Prince Edward Island February 2006
Doiron 17
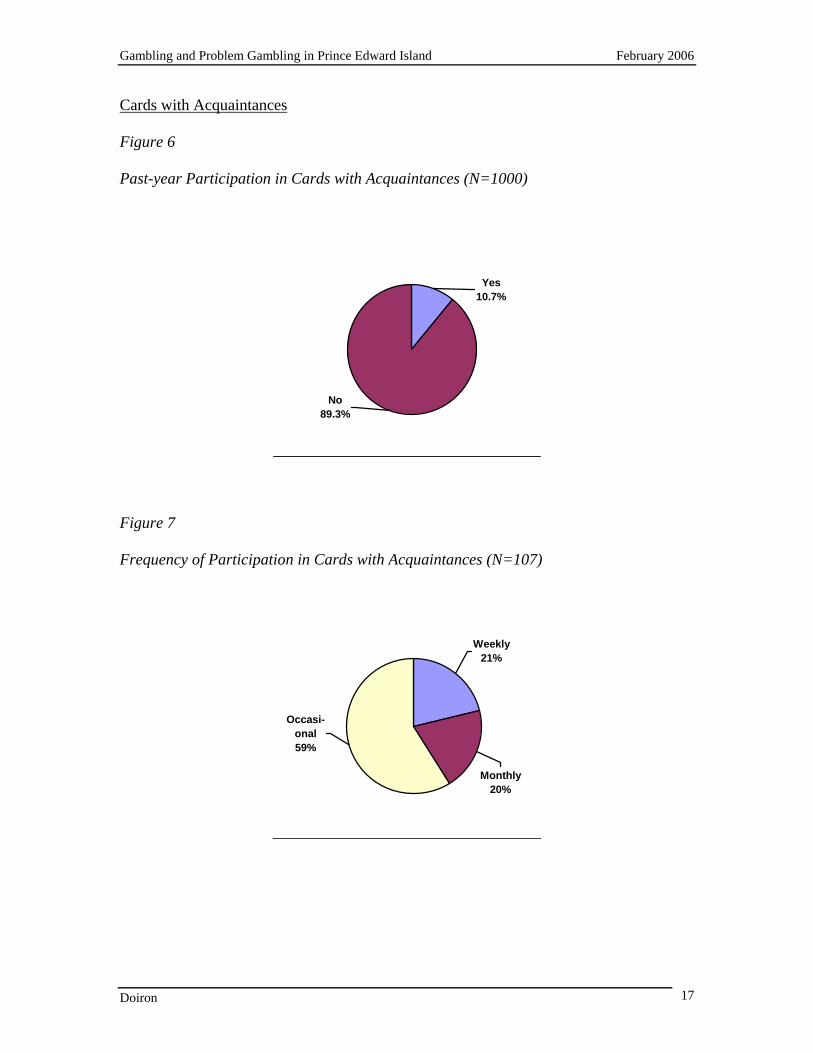
Cards with Acquaintances
Figure 6 Past-year Participation in Cards with Acquaintances (N=1000)
No89.3%
Yes10.7%
Figure 7 Frequency of Participation in Cards with Acquaintances (N=107)
Occasi-onal59%
Monthly20%
Weekly21%
Gambling and Problem Gambling in Prince Edward Island February 2006
Doiron 18
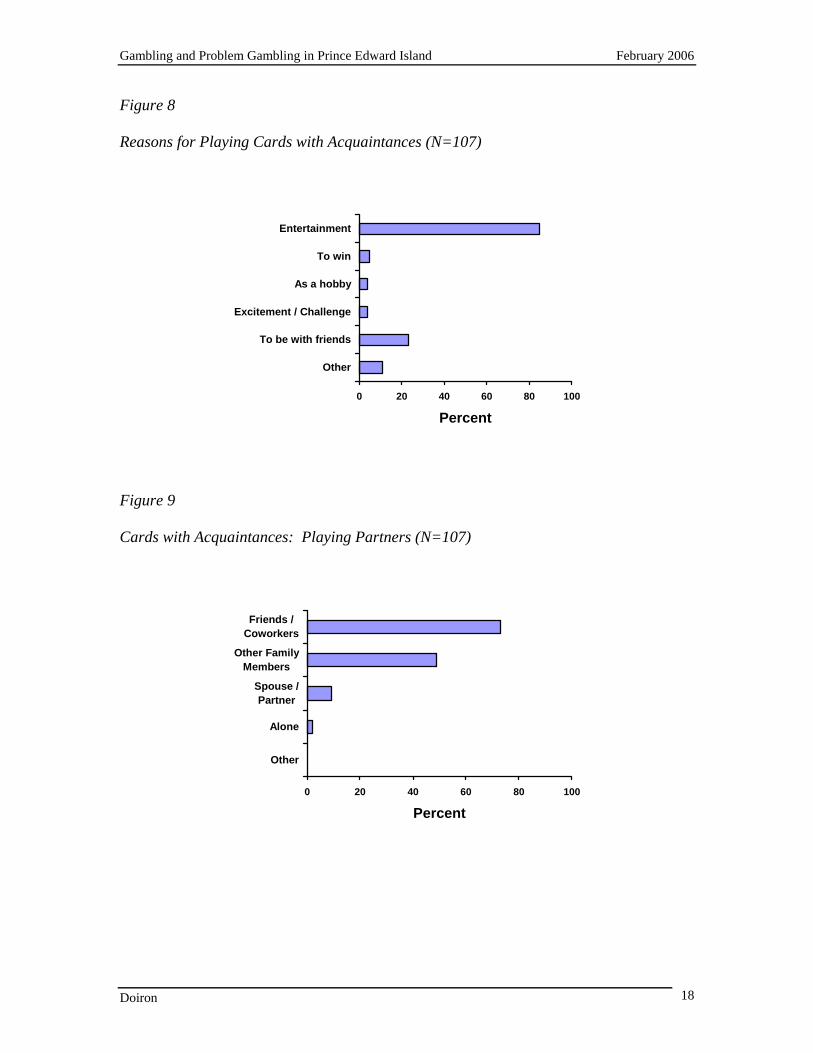
Figure 8 Reasons for Playing Cards with Acquaintances (N=107)
0 20 40 60 80 100
Other
To be with friends
Excitement / Challenge
As a hobby
To win
Entertainment
Percent
Figure 9 Cards with Acquaintances: Playing Partners (N=107)
0 20 40 60 80 100
Other
Alone
Spouse /Partner
Other FamilyMembers
Friends /Coworkers
Percent
Gambling and Problem Gambling in Prince Edward Island February 2006
Doiron 19
Cards in Non-regulated Settings
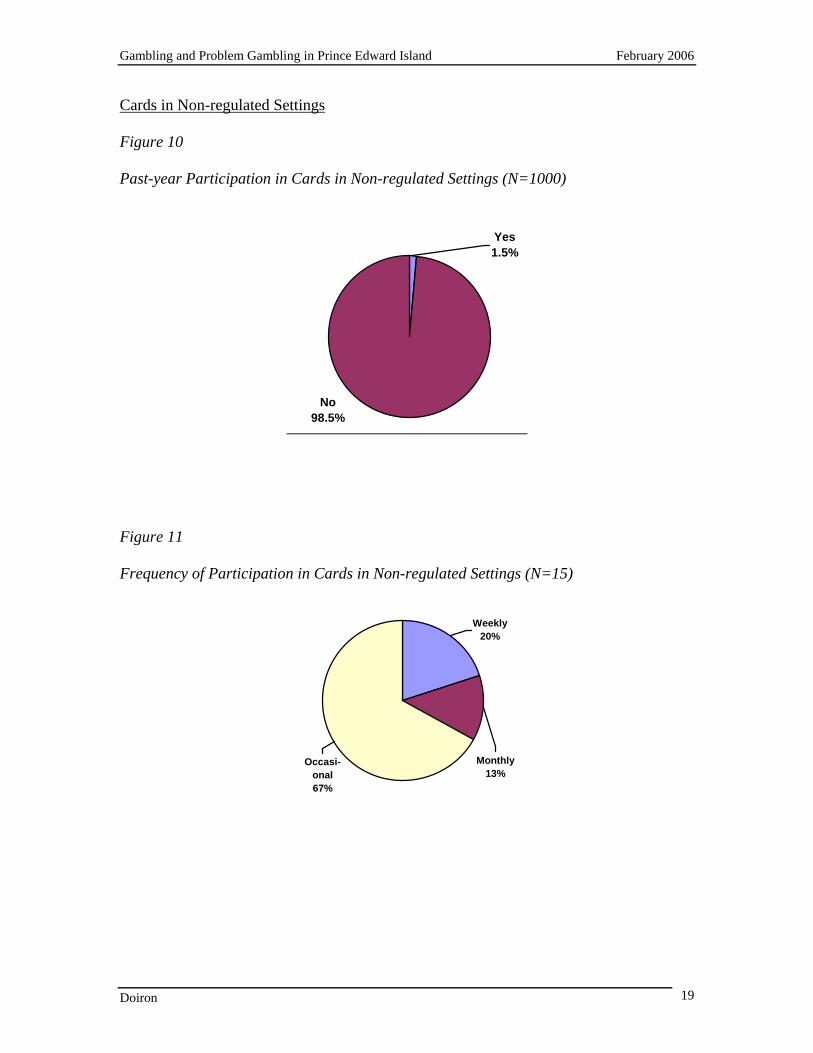
Figure 10 Past-year Participation in Cards in Non-regulated Settings (N=1000)
No98.5%
Yes1.5%
Figure 11 Frequency of Participation in Cards in Non-regulated Settings (N=15)
Occasi-onal67%
Monthly13%
Weekly20%
Gambling and Problem Gambling in Prince Edward Island February 2006
Doiron 20
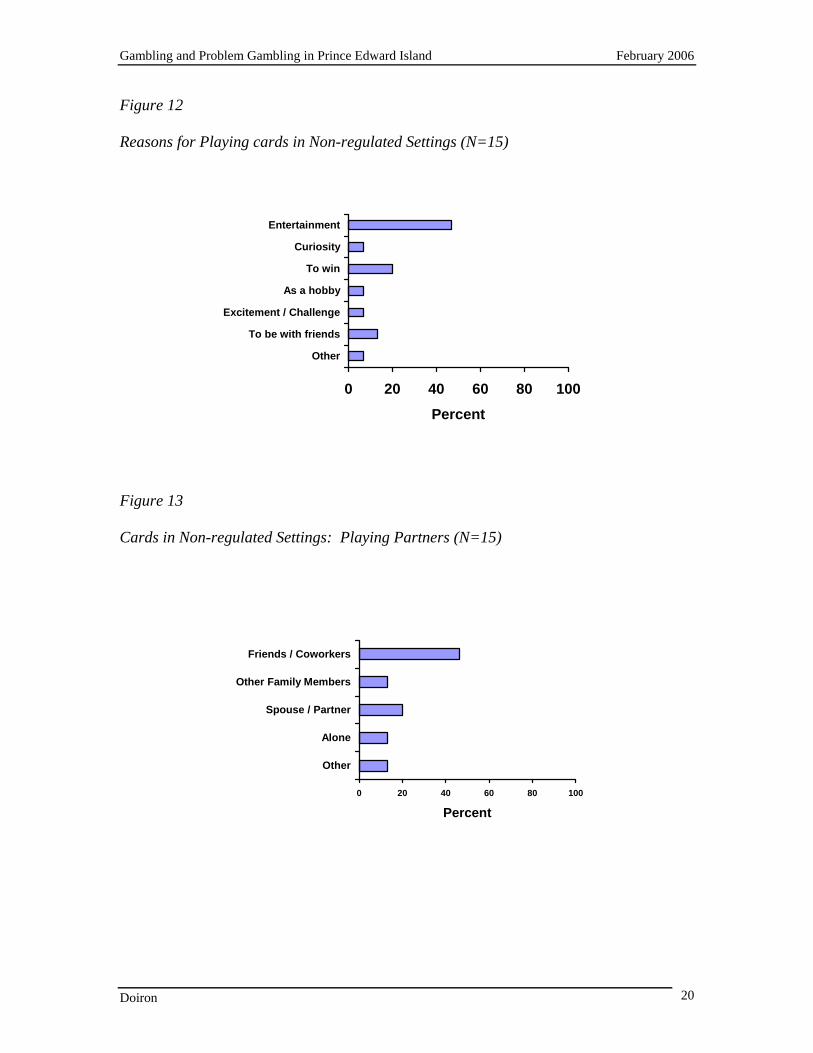
Figure 12 Reasons for Playing cards in Non-regulated Settings (N=15)
0 20 40 60 80 100
Other
To be with friends
Excitement / Challenge
As a hobby
To win
Curiosity
Entertainment
Percent
Figure 13 Cards in Non-regulated Settings: Playing Partners (N=15)
0 20 40 60 80 100
Other
Alone
Spouse / Partner
Other Family Members
Friends / Coworkers
Percent
Gambling and Problem Gambling in Prince Edward Island February 2006
Doiron 21
Charitable Gambling
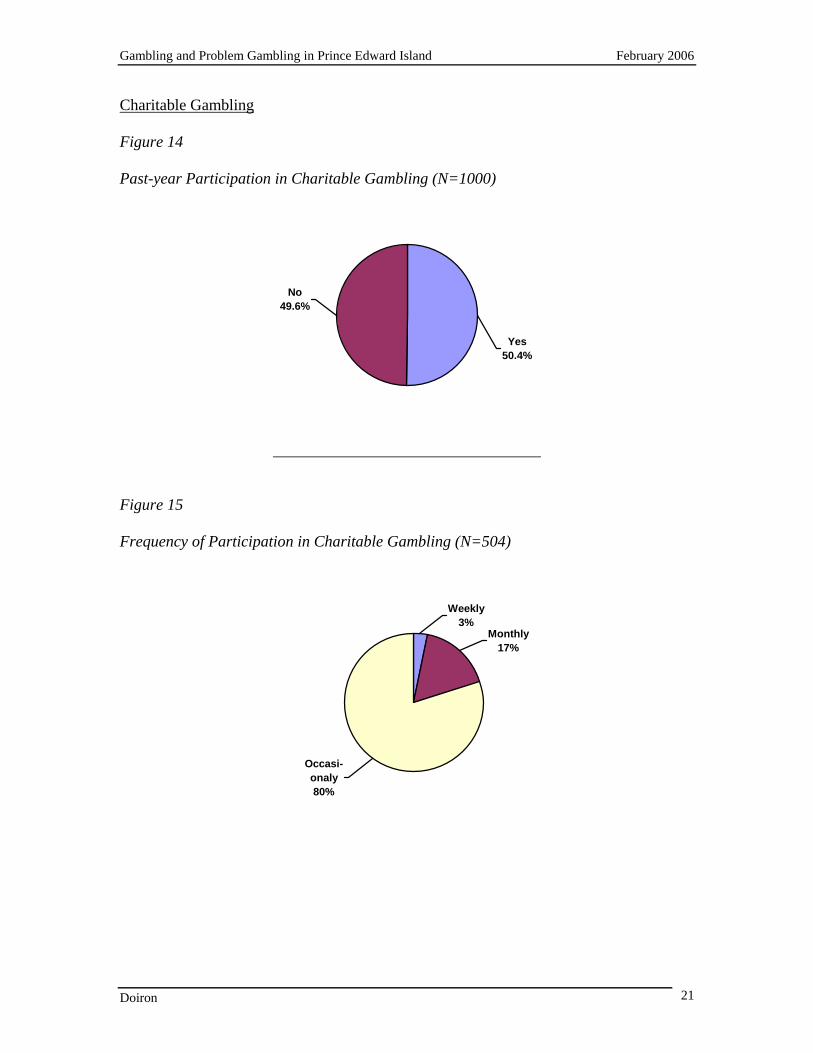
Figure 14 Past-year Participation in Charitable Gambling (N=1000)
Yes50.4%
No49.6%
Figure 15 Frequency of Participation in Charitable Gambling (N=504)
Occasi-onaly80%
Monthly17%
Weekly3%
Gambling and Problem Gambling in Prince Edward Island February 2006
Doiron 22
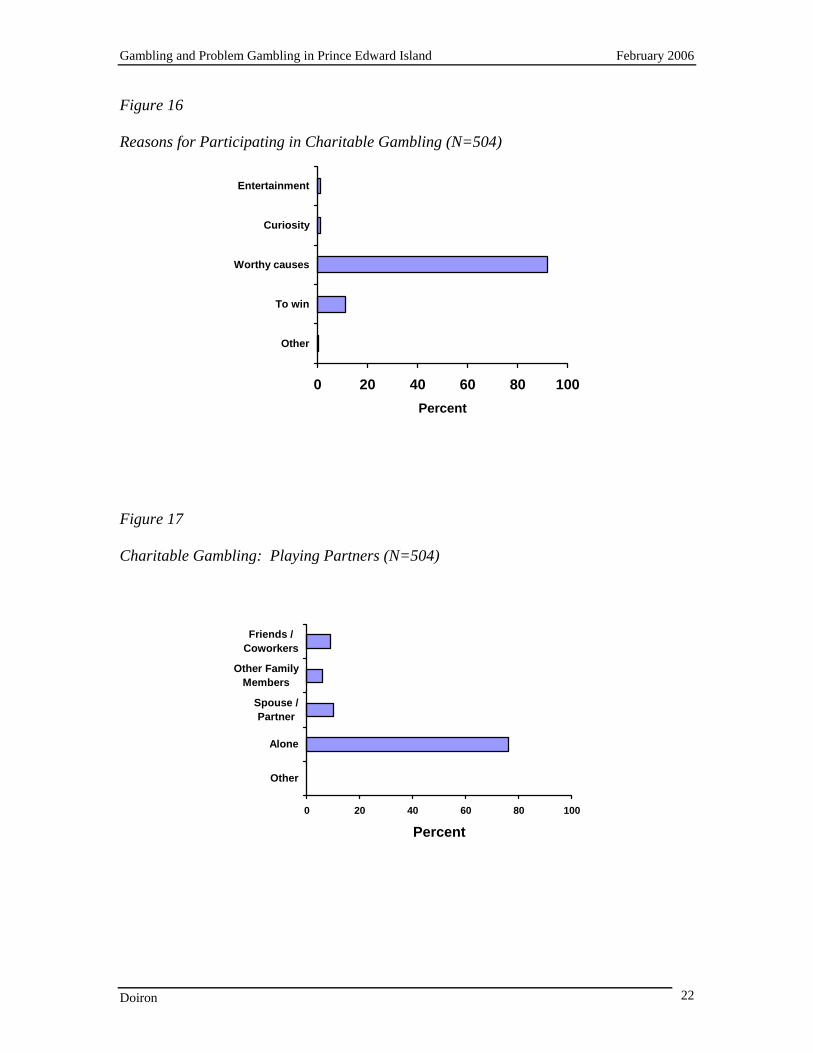
Figure 16 Reasons for Participating in Charitable Gambling (N=504)
0 20 40 60 80 100
Other
To win
Worthy causes
Curiosity
Entertainment
Percent
Figure 17 Charitable Gambling: Playing Partners (N=504)
0 20 40 60 80 100
Other
Alone
Spouse /Partner
Other FamilyMembers
Friends /Coworkers
Percent
Gambling and Problem Gambling in Prince Edward Island February 2006
Doiron 23
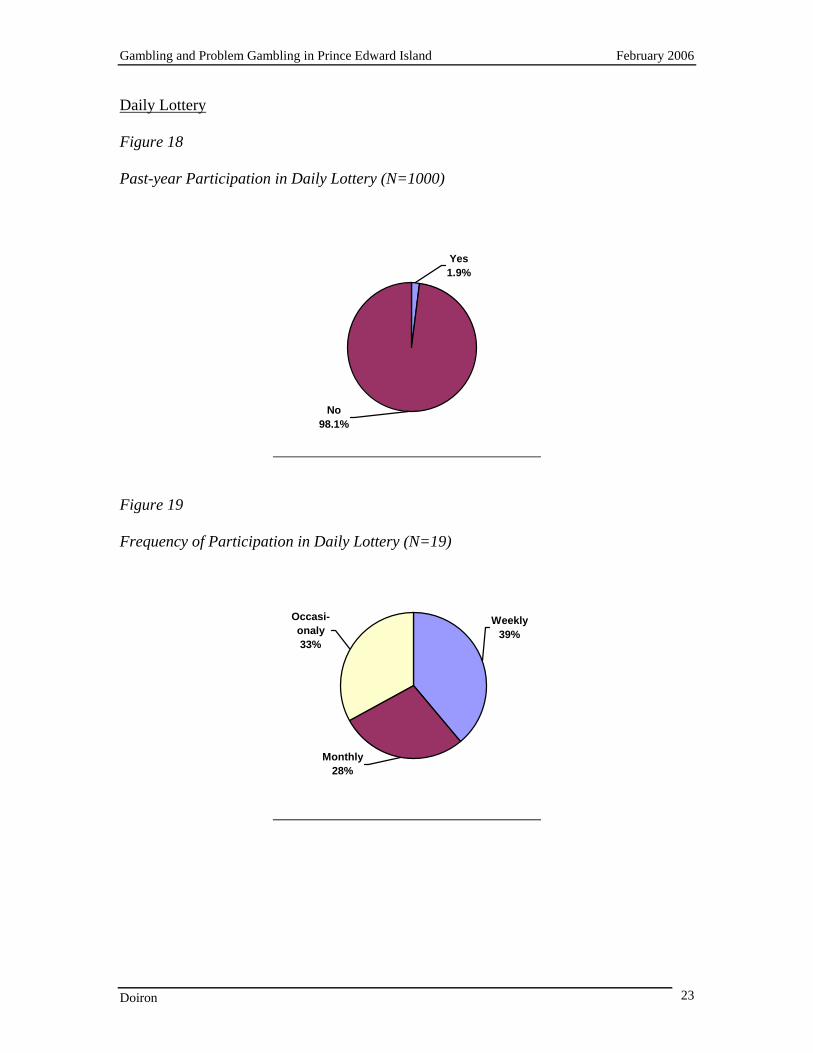
Daily Lottery
Figure 18 Past-year Participation in Daily Lottery (N=1000)
No98.1%
Yes1.9%
Figure 19 Frequency of Participation in Daily Lottery (N=19)
Occasi-onaly33%
Monthly28%
Weekly39%
Gambling and Problem Gambling in Prince Edward Island February 2006
Doiron 24
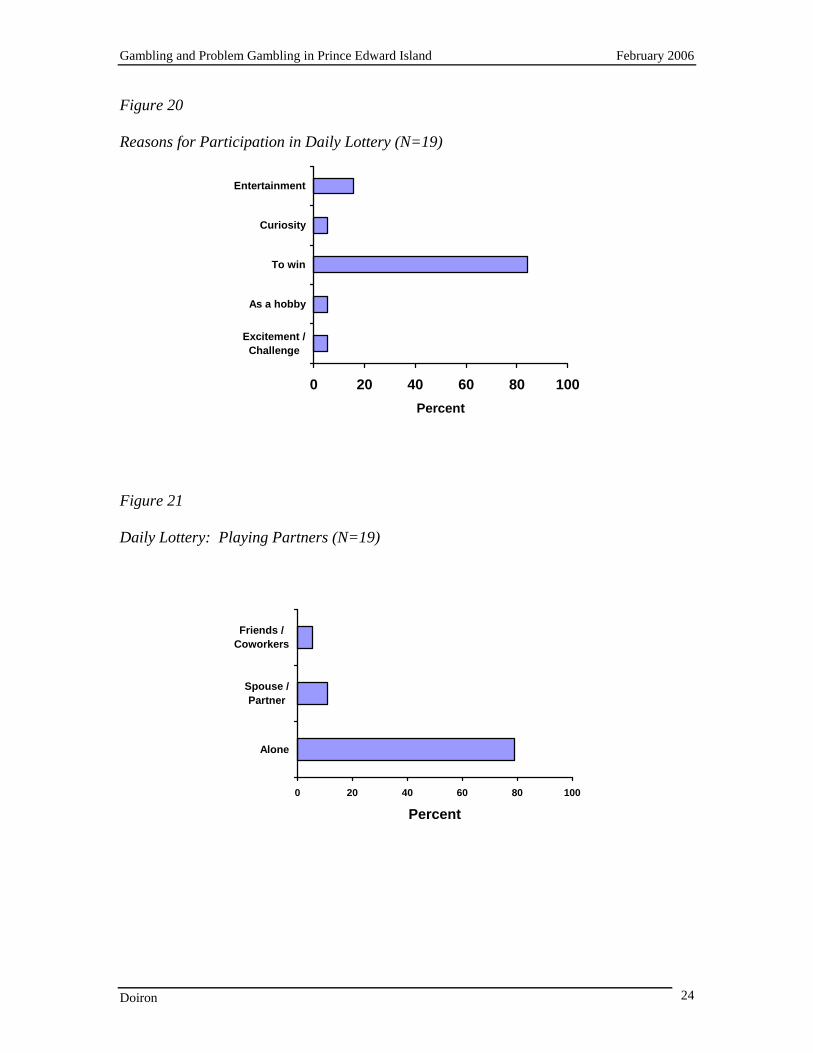
Figure 20 Reasons for Participation in Daily Lottery (N=19)
0 20 40 60 80 100
Excitement /Challenge
As a hobby
To win
Curiosity
Entertainment
Percent
Figure 21 Daily Lottery: Playing Partners (N=19)
0 20 40 60 80 100
Alone
Spouse /Partner
Friends /Coworkers
Percent
Gambling and Problem Gambling in Prince Edward Island February 2006
Doiron 25
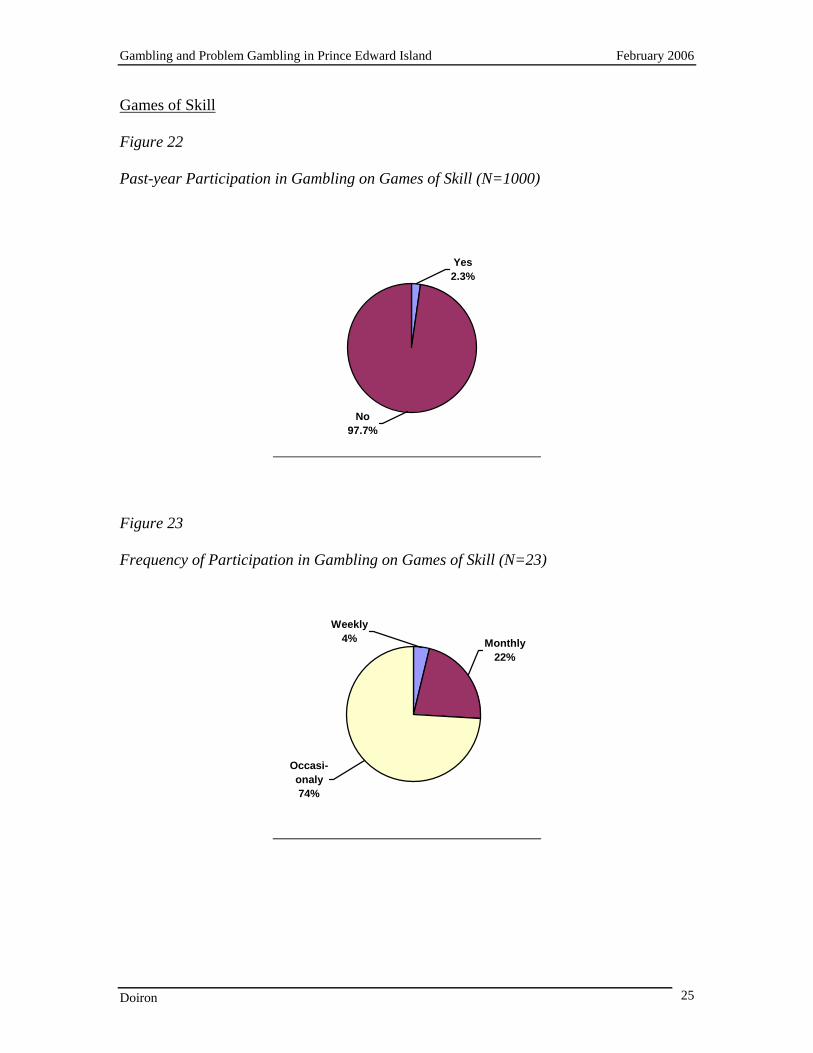
Games of Skill
Figure 22 Past-year Participation in Gambling on Games of Skill (N=1000)
No97.7%
Yes2.3%
Figure 23 Frequency of Participation in Gambling on Games of Skill (N=23)
Occasi-onaly74%
Monthly22%
Weekly4%
Gambling and Problem Gambling in Prince Edward Island February 2006
Doiron 26
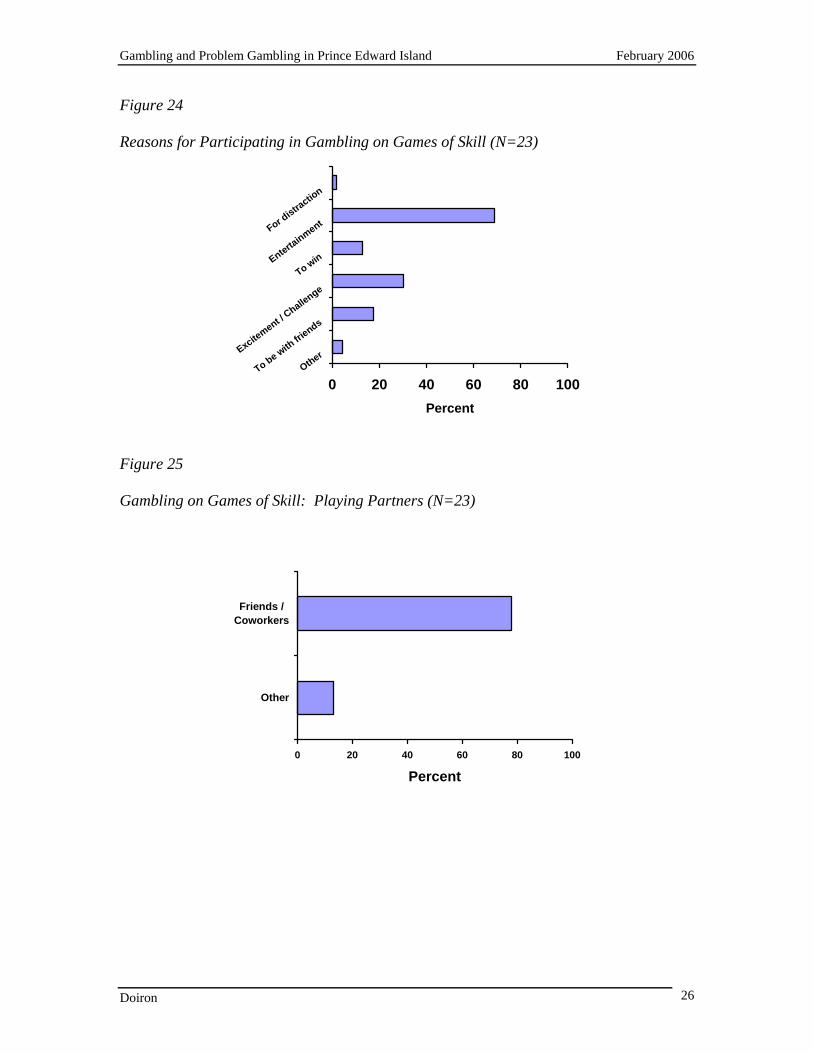
Figure 24 Reasons for Participating in Gambling on Games of Skill (N=23)
0 20 40 60 80 100Other
To be with fri
ends
Excitement /
Challenge
To winEntertainmentFor d
istractio
n
Percent
Figure 25 Gambling on Games of Skill: Playing Partners (N=23)
0 20 40 60 80 100
Other
Friends /Coworkers
Percent
Gambling and Problem Gambling in Prince Edward Island February 2006
Doiron 27
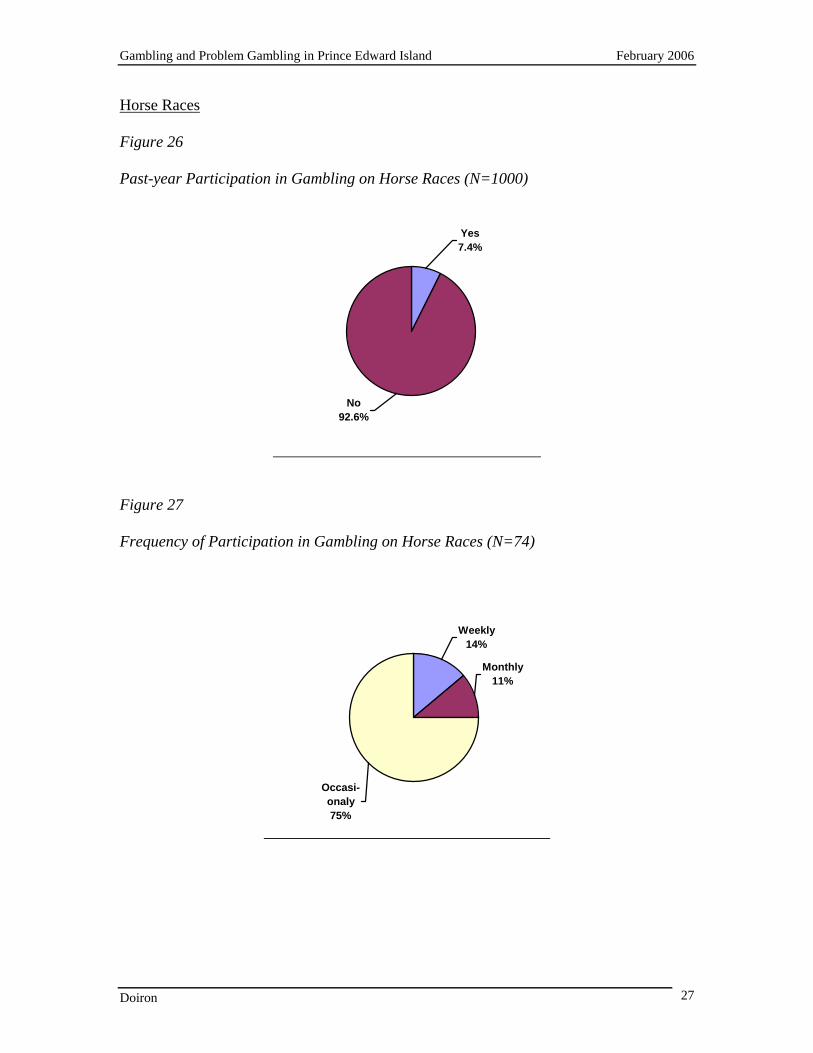
Horse Races
Figure 26 Past-year Participation in Gambling on Horse Races (N=1000)
No92.6%
Yes7.4%
Figure 27 Frequency of Participation in Gambling on Horse Races (N=74)
Weekly14%
Monthly11%
Occasi-onaly75%
Gambling and Problem Gambling in Prince Edward Island February 2006
Doiron 28
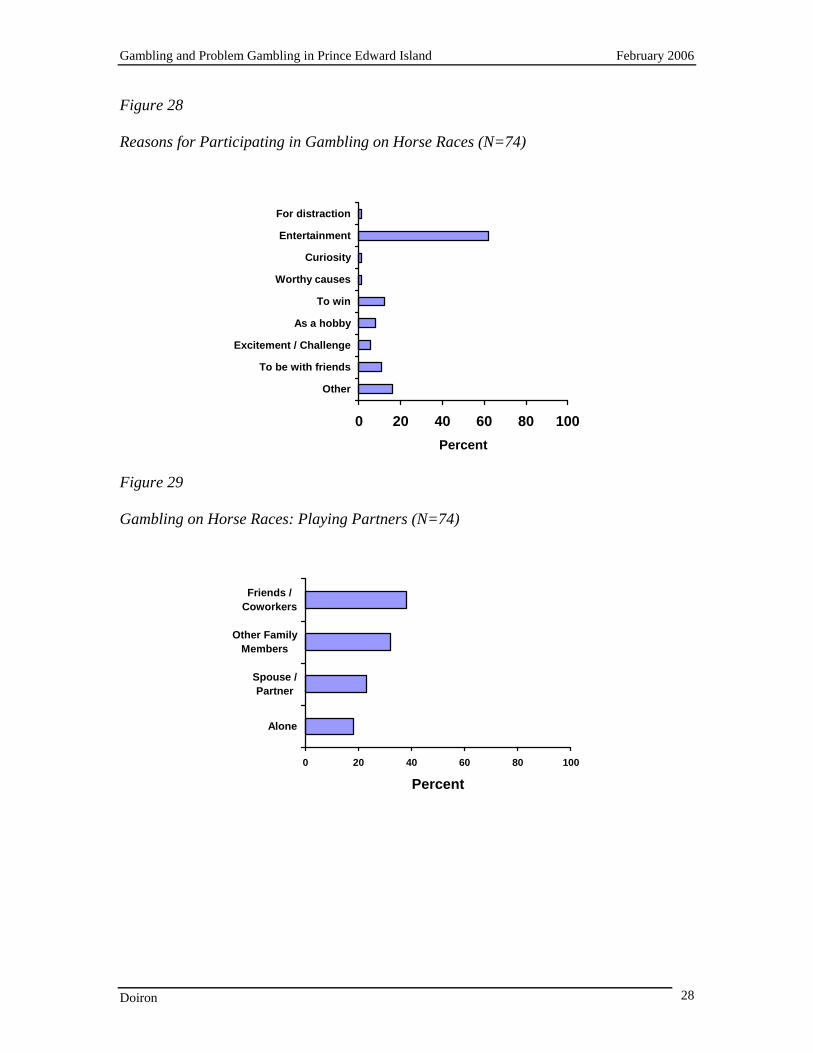
Figure 28 Reasons for Participating in Gambling on Horse Races (N=74)
0 20 40 60 80 100
Other
To be with friends
Excitement / Challenge
As a hobby
To win
Worthy causes
Curiosity
Entertainment
For distraction
Percent
Figure 29 Gambling on Horse Races: Playing Partners (N=74)
0 20 40 60 80 100
Alone
Spouse /Partner
Other FamilyMembers
Friends /Coworkers
Percent
Gambling and Problem Gambling in Prince Edward Island February 2006
Doiron 29
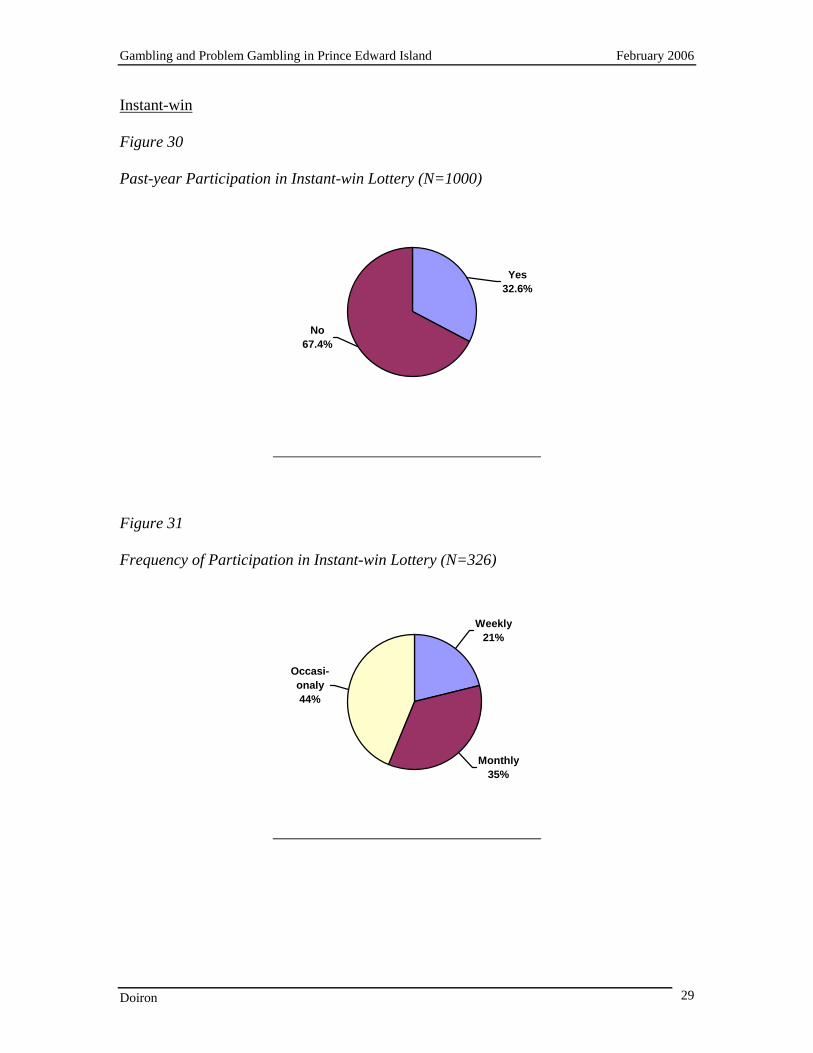
Instant-win
Figure 30 Past-year Participation in Instant-win Lottery (N=1000)
No67.4%
Yes32.6%
Figure 31 Frequency of Participation in Instant-win Lottery (N=326)
Occasi-onaly44%
Monthly35%
Weekly21%
Gambling and Problem Gambling in Prince Edward Island February 2006
Doiron 30
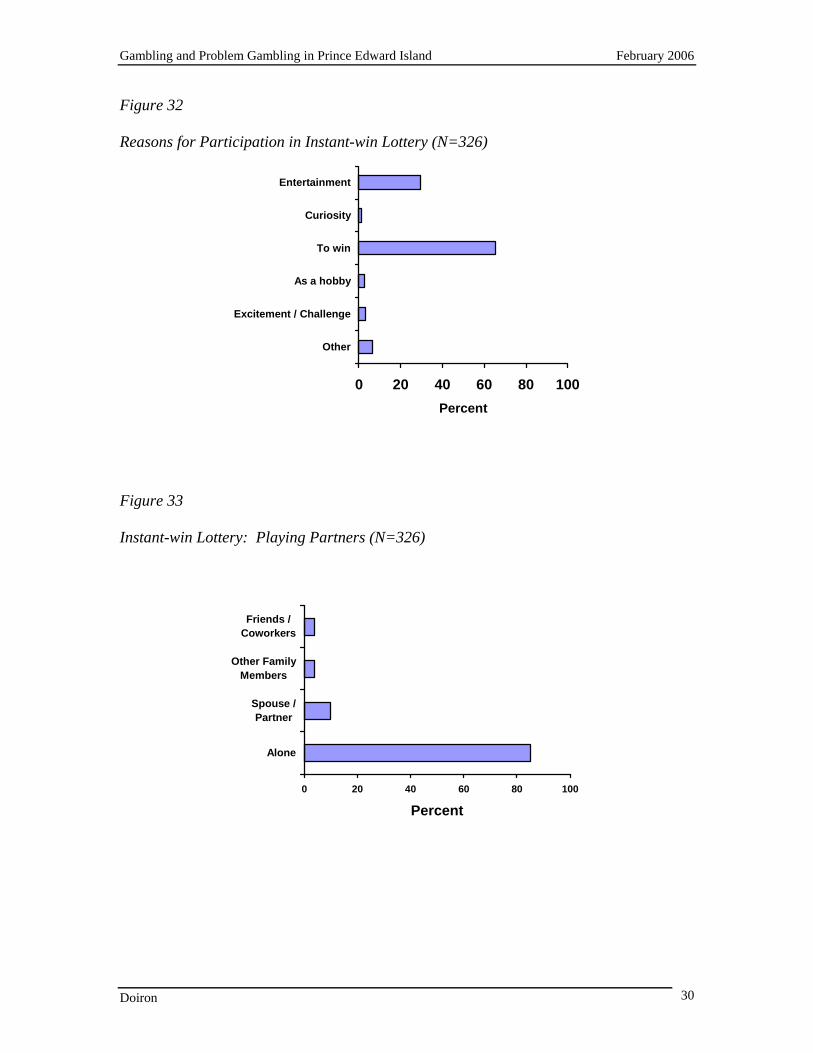
Figure 32 Reasons for Participation in Instant-win Lottery (N=326)
0 20 40 60 80 100
Other
Excitement / Challenge
As a hobby
To win
Curiosity
Entertainment
Percent
Figure 33 Instant-win Lottery: Playing Partners (N=326)
0 20 40 60 80 100
Alone
Spouse /Partner
Other FamilyMembers
Friends /Coworkers
Percent
Gambling and Problem Gambling in Prince Edward Island February 2006
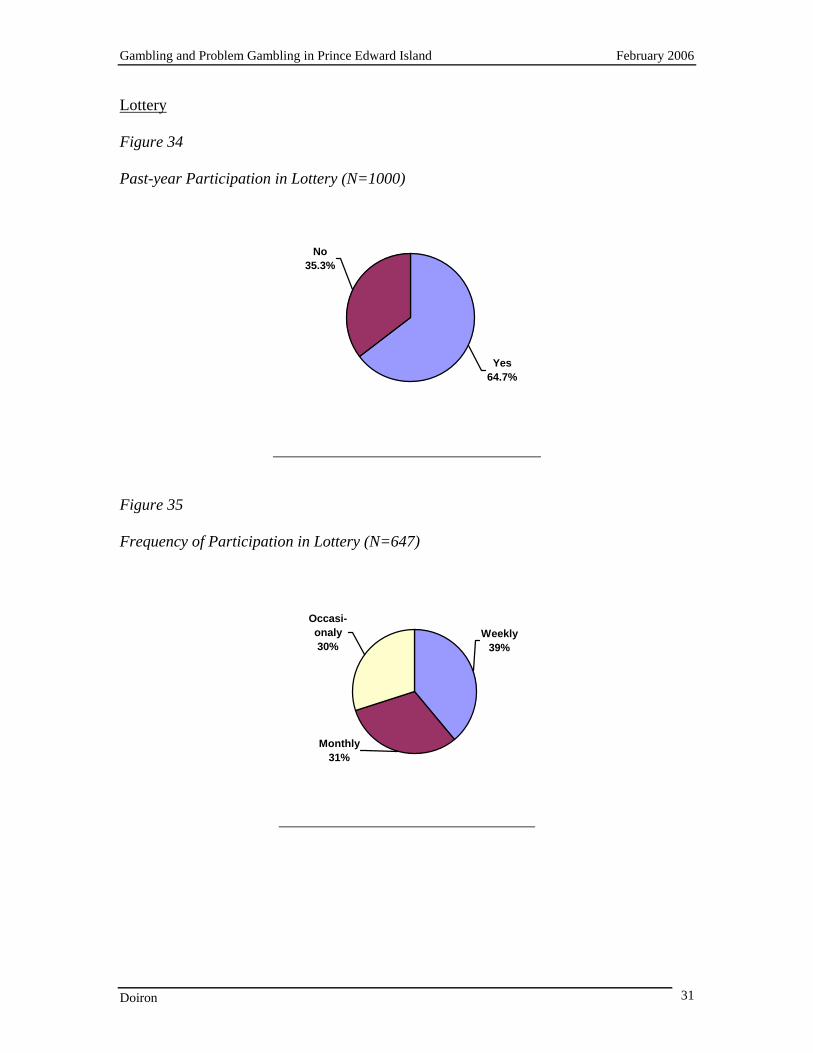
Doiron 31
Lottery
Figure 34 Past-year Participation in Lottery (N=1000)
No35.3%
Yes64.7%
Figure 35 Frequency of Participation in Lottery (N=647)
Occasi-onaly30%
Monthly31%
Weekly39%

Gambling and Problem Gambling in Prince Edward Island February 2006
Doiron 32
Figure 36 Reasons for Participating in Lottery (N=647)
0 20 40 60 80 100
Other
To be with friends
Excitement / Challenge
As a hobby
To win
Worthy causes
Entertainment
Percent
Figure 37 Lottery: Playing Partners (N=647)
0 20 40 60 80 100
Alone
Spouse /Partner
Other FamilyMembers
Friends /Coworkers
Percent
Gambling and Problem Gambling in Prince Edward Island February 2006
Doiron 33
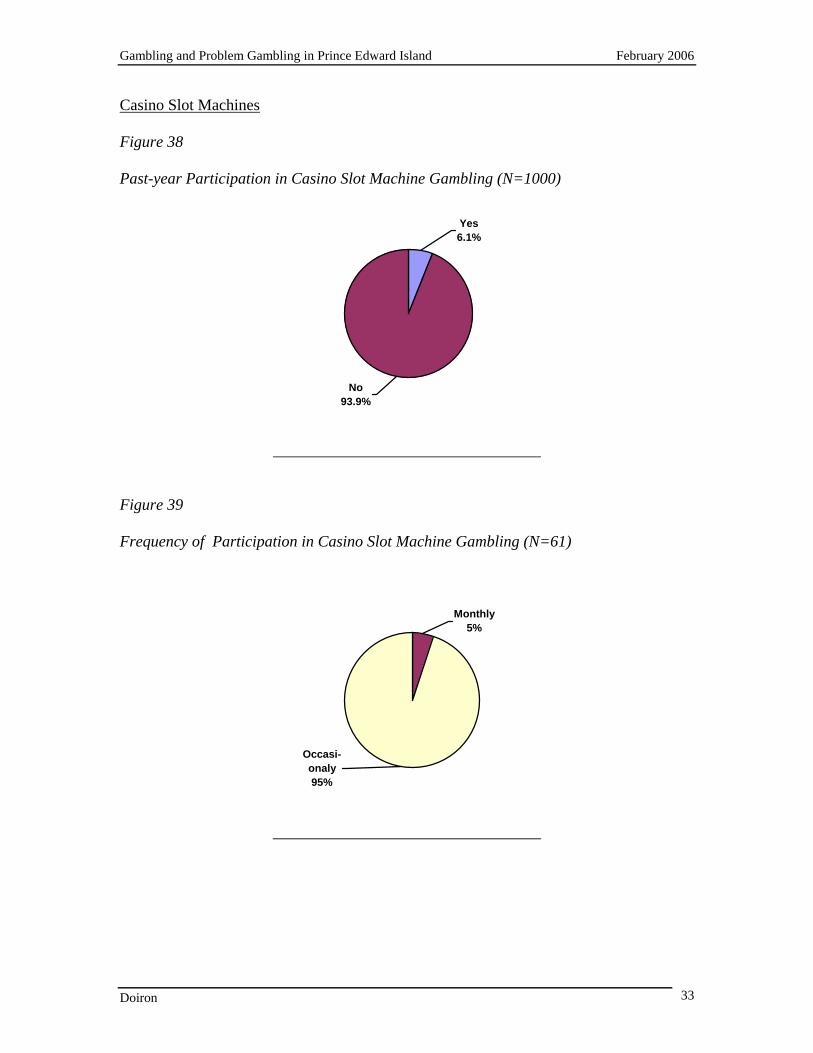
Casino Slot Machines
Figure 38 Past-year Participation in Casino Slot Machine Gambling (N=1000)
No93.9%
Yes6.1%
Figure 39 Frequency of Participation in Casino Slot Machine Gambling (N=61)
Monthly5%
Occasi-onaly95%
Gambling and Problem Gambling in Prince Edward Island February 2006
Doiron 34
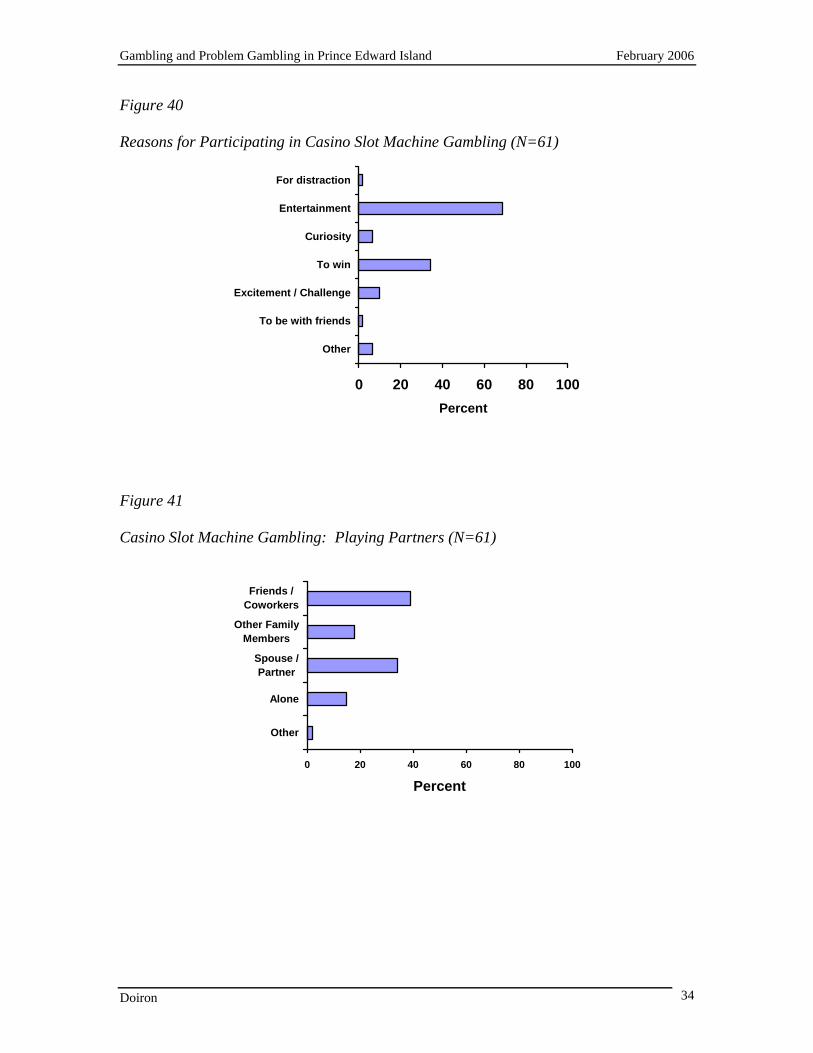
Figure 40 Reasons for Participating in Casino Slot Machine Gambling (N=61)
0 20 40 60 80 100
Other
To be with friends
Excitement / Challenge
To win
Curiosity
Entertainment
For distraction
Percent
Figure 41 Casino Slot Machine Gambling: Playing Partners (N=61)
0 20 40 60 80 100
Other
Alone
Spouse /Partner
Other FamilyMembers
Friends /Coworkers
Percent
Gambling and Problem Gambling in Prince Edward Island February 2006
Doiron 35
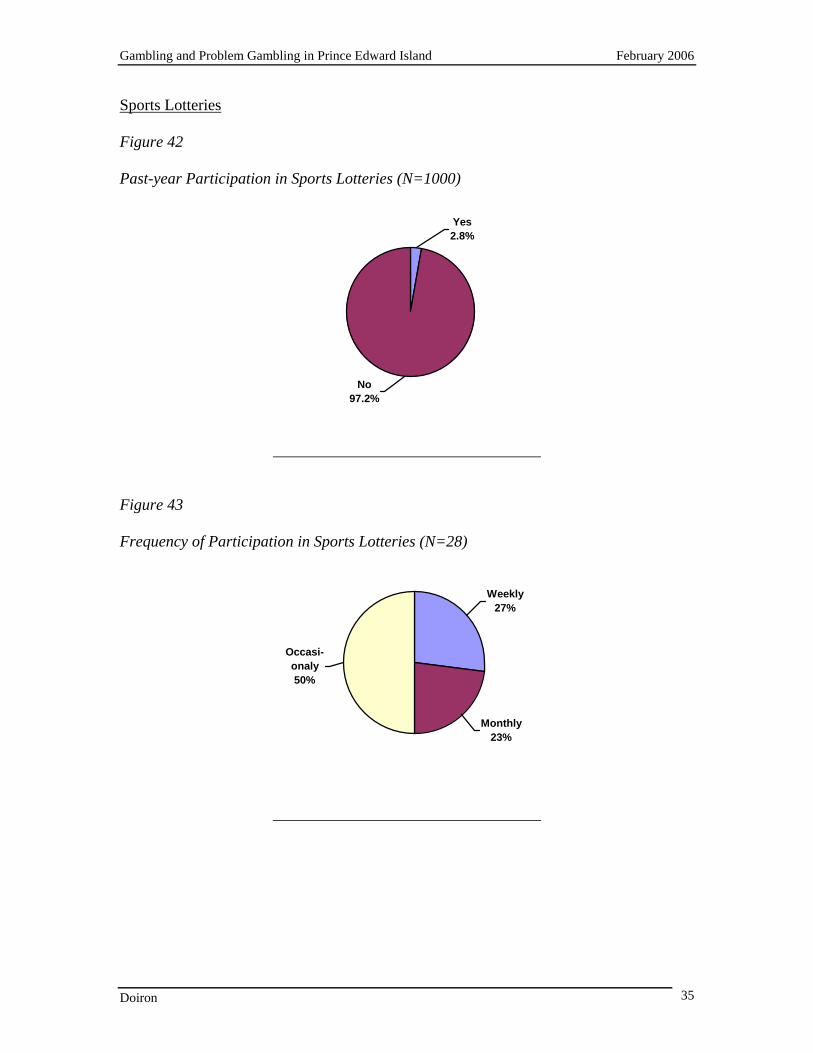
Sports Lotteries
Figure 42 Past-year Participation in Sports Lotteries (N=1000)
No97.2%
Yes2.8%
Figure 43 Frequency of Participation in Sports Lotteries (N=28)
Occasi-onaly50%
Monthly23%
Weekly27%
Gambling and Problem Gambling in Prince Edward Island February 2006
Doiron 36
Figure 44 Reasons for Participation in Sports Lotteries (N=28)
0 20 40 60 80 100
Other
Excitement / Challenge
As a hobby
To win
Worthy causes
Curiosity
Entertainment
Percent
Figure 45 Sports Lotteries: Playing Partners (N=28)
0 20 40 60 80 100
Alone
Spouse /Partner
Other FamilyMembers
Percent
Gambling and Problem Gambling in Prince Edward Island February 2006
Doiron 37
Sports Pools
Figure 46 Past-year Participation in Sports Pools (N=1000)
No96.9%
Yes3.1%
Figure 47 Frequency of Participation in Sports Pools (N=31)
Occasi-onaly90%
Weekly10%
Gambling and Problem Gambling in Prince Edward Island February 2006
Doiron 38
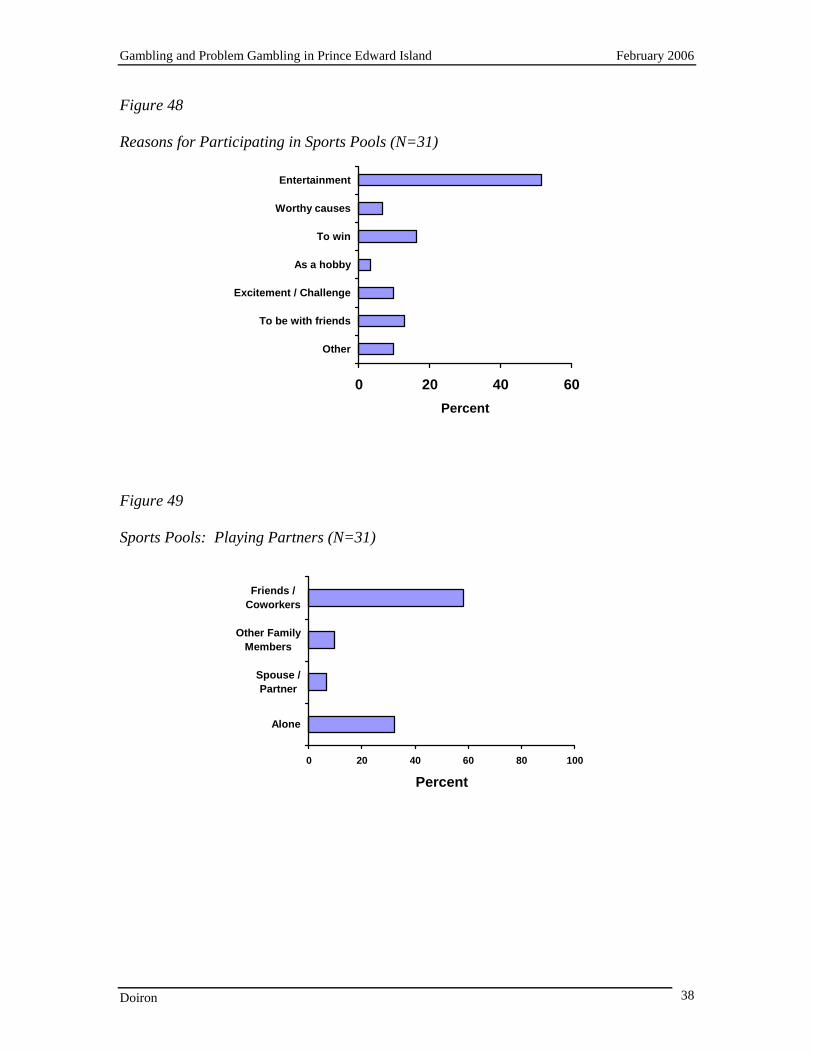
Figure 48 Reasons for Participating in Sports Pools (N=31)
0 20 40 60
Other
To be with friends
Excitement / Challenge
As a hobby
To win
Worthy causes
Entertainment
Percent
Figure 49 Sports Pools: Playing Partners (N=31)
0 20 40 60 80 100
Alone
Spouse /Partner
Other FamilyMembers
Friends /Coworkers
Percent
Gambling and Problem Gambling in Prince Edward Island February 2006
Doiron 39
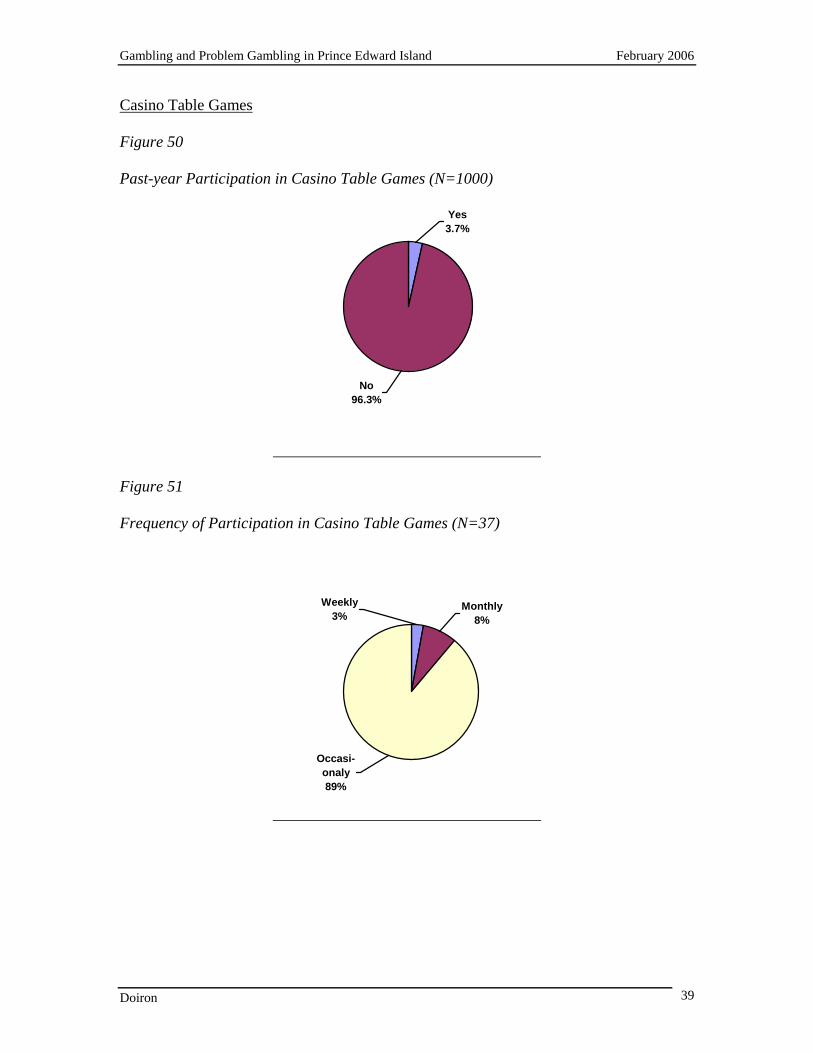
Casino Table Games
Figure 50 Past-year Participation in Casino Table Games (N=1000)
No96.3%
Yes3.7%
Figure 51 Frequency of Participation in Casino Table Games (N=37)
Occasi-onaly89%
Monthly8%
Weekly3%
Gambling and Problem Gambling in Prince Edward Island February 2006
Doiron 40
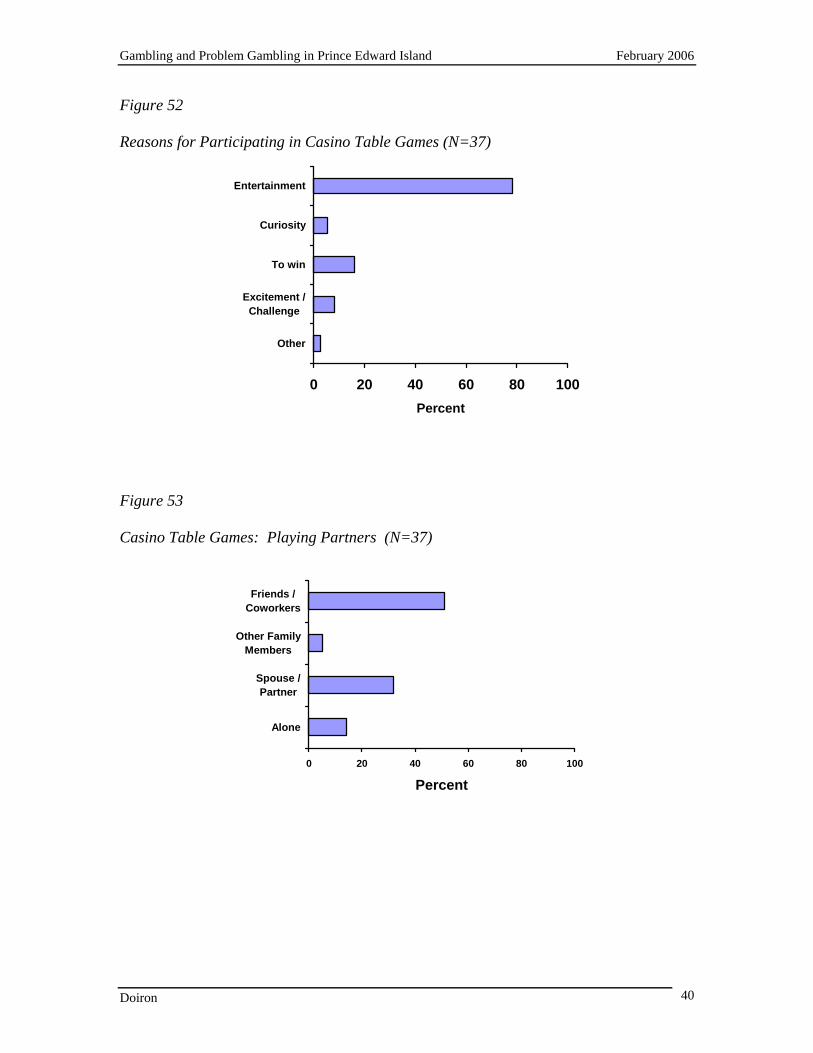
Figure 52 Reasons for Participating in Casino Table Games (N=37)
0 20 40 60 80 100
Other
Excitement /Challenge
To win
Curiosity
Entertainment
Percent
Figure 53 Casino Table Games: Playing Partners (N=37)
0 20 40 60 80 100
Alone
Spouse /Partner
Other FamilyMembers
Friends /Coworkers
Percent
Gambling and Problem Gambling in Prince Edward Island February 2006
Doiron 41
Video Lottery Terminals
Figure 54 Past-year Participation in Video Lottery Terminal Gambling (N=1000)
No91.6%
Yes8.4%
Figure 55 Frequency of Participation in Video Lottery Terminal Gambling (N=84)
Occasi-onaly50%
Monthly27%
Weekly23%
Gambling and Problem Gambling in Prince Edward Island February 2006
Doiron 42
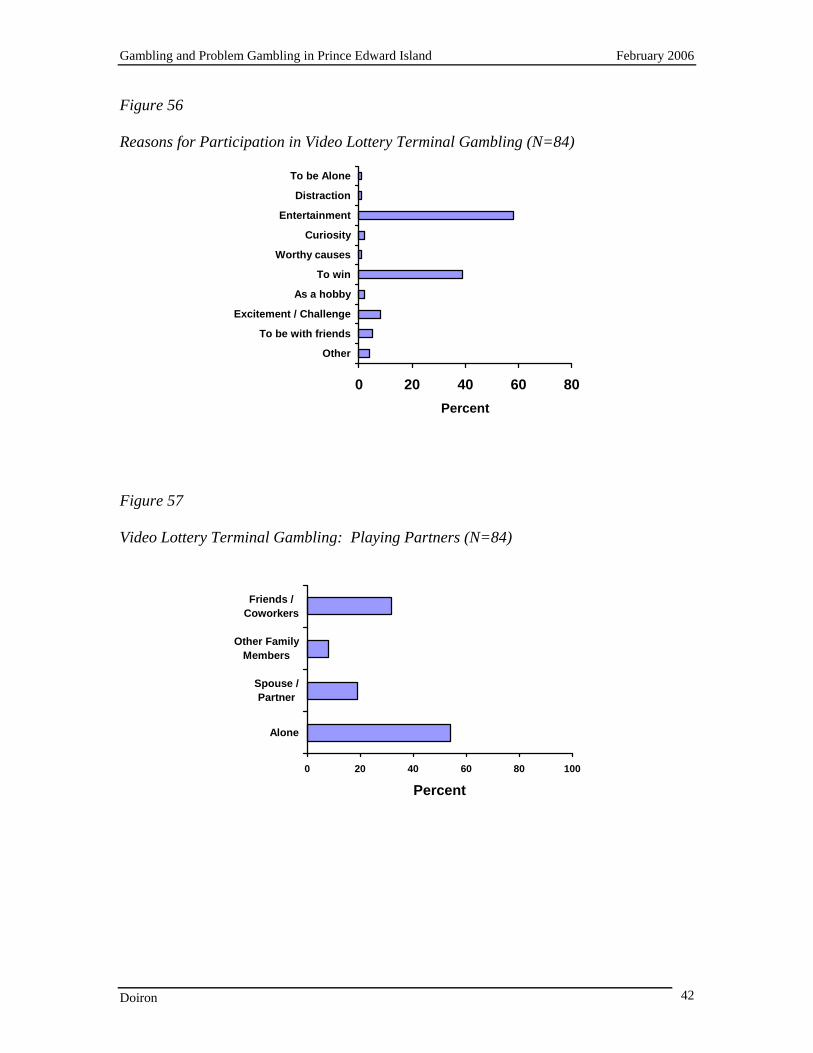
Figure 56 Reasons for Participation in Video Lottery Terminal Gambling (N=84)
0 20 40 60 80
Other
To be with friends
Excitement / Challenge
As a hobby
To win
Worthy causes
Curiosity
Entertainment
Distraction
To be Alone
Percent
Figure 57 Video Lottery Terminal Gambling: Playing Partners (N=84)
0 20 40 60 80 100
Alone
Spouse /Partner
Other FamilyMembers
Friends /Coworkers
Percent
Gambling and Problem Gambling in Prince Edward Island February 2006
Doiron 43
Bingo
• Seven percent (n=70) of the survey sample had participated in bingo at least once in the 12 months prior to the survey.
• Thirty percent of bingo participants were weekly players (at least once per
week).
• Fifteen percent of bingo participants were monthly players (1-3 times per month).
• Fifty-five percent of bingo participants were yearly players (1-11 times per
year).
• Most respondents that reported playing bingo stated that they did so for entertainment. A significant proportion of bingo players also reported playing bingo to win, and to be with friends.
• Most respondents who played bingo reported that they played with others. A
significant proportion indicated that they played bingo alone.
Cards with Acquaintances
• Ten percent (n=104) of the survey sample had played cards for money outside a casino at least once in the 12 months prior to the survey.
• Twenty-one percent of card players were weekly players (at least once per
week).
• Twenty percent of card players were monthly players (1-3 times per month).
• Fifty-nine percent of card players were yearly players (1-11 times per year).
• Most respondents who had played card games with friends or family reported that they did so for entertainment. A significant proportion also reported that they played so that they could spend time with friends.
• Cards, by definition, are played with others. Most people who played cards
did so with friends or coworkers or family members other than their spouse or partner.
Cards in Non-regulated Settings
• One-point-five percent (n=15) of the survey sample had played cards in non-regulated settings at least once in the 12 months prior to the survey.
Gambling and Problem Gambling in Prince Edward Island February 2006
Doiron 44
• Twenty percent of cards in non-regulated settings players were weekly players
(at least once per week).
• Thirteen percent of cards in non-regulated settings players were monthly players (1-3 times per month).
• Sixty-seven percent of cards in non-regulated settings players were occasional
players (1-11 times per year).
• A large proportion of respondents who played cards in non-regulated settings (i.e., other than in the home) reported that they did so for entertainment. A significant proportion also stated that they played to win money.
• Most respondents who played cards in non-regulated settings did so with
friends or coworkers. A significant proportion also reported playing cards in non-regulated settings with family members (including spouse / partner) and alone (i.e., without someone they knew personally).
Charitable Gambling
• Fifty percent (n=500) of the survey sample had participated in charitable gambling at least once in the 12 months prior to the survey.
• Three percent of charitable gambling participants were weekly players (at
least once per week).
• Seventeen percent of charitable gambling participants were monthly players (1-3 times per month).
• Eighty percent of charitable gambling participants were yearly players (1-11
times per year).
• Not surprisingly almost everyone who participated in charitable gambling did so to support worthy causes.
• Most respondents who participated in charitable gambling did so alone.
Daily Lottery
• One-point-nine percent (n=19) of the survey sample had played the daily lottery at least once in the 12 months prior to the survey.
Gambling and Problem Gambling in Prince Edward Island February 2006
Doiron 45
• Thirty-nine percent of daily lottery players were weekly players (at least once per week).
• Twenty-eight percent of daily lottery players were monthly players (1-3 times
per month).
• Thirty-three percent of daily lottery players were occasional players (1-11 times per year).
• Most respondents who played daily lotteries did so to win money. A
significant proportion also reported that they played daily lotteries for entertainment.
• Most respondents who played daily lotteries did so alone.
Games of Skill
• Two percent (n=20) of the survey sample had wagered on games of skill at least once in the 12 months prior to the survey.
• Four percent of games of skill participants were weekly players (at least once
per week).
• Twenty-two percent of games of skill participants were weekly players (1-3 times per month).
• Seventy-four percent of games of skill participants were yearly players (1-11
times per year).
• Most respondents who had wagered on games of skill reported that they did so for entertainment. A significant proportion also reported that they wagered on games of skill for excitement / challenge, to be with friends, and to win money.
• Most respondents that wagered on games of skill participated with friends or
coworkers. Horse Races
• Seven percent of the survey (n=70) sample had participated in horse race betting at least once in the 12 months prior to the survey.
• Fourteen percent of horse race participants were weekly players (at least once
per week).
Gambling and Problem Gambling in Prince Edward Island February 2006
Doiron 46
• Eleven percent of horse race participants were monthly players (1-3 times per month).
• Seventy-five percent of horse race participants were yearly players (1-11
times per year)
• Most respondents who had engaged in horse race gambling reported that they did so for entertainment. A range of other reasons were also reported, including a small proportion that reported engaging in horse race gambling as a distraction.
• Most respondents who engaged in wagering on horse races did so with others,
although a significant proportion of respondents did so alone. Instant-win
• Thirty-three percent (n=330) of the survey sample had bought pull tabs / scratch tickets at least once in the 12 months prior to the survey.
• Twenty-one percent of charitable gambling participants were weekly players
(at least once per week).
• Thirty-five percent of charitable gambling participants were monthly players (1-3 times per month).
• Forty-four percent of charitable gambling participants were yearly players (1-
11 times per year).
• Most respondents that reported gambling on instant-win lottery tickets did so to win money. A large proportion also reported doing so for entertainment.
• The majority of respondents that reported gambling on instant-win lottery
tickets did so alone. Lottery
• Sixty-five percent (n=650) of the survey sample had played the lottery at least once in the 12 months prior to the survey.
• Thirty-nine percent of lottery players were weekly players (at least once per
week).
• Thirty-one percent of lottery players were monthly players (1-3 times per month).
• Thirty percent of lottery players were yearly players (1-11 times per year).
Gambling and Problem Gambling in Prince Edward Island February 2006
Doiron 47
• Most respondents who gambled on lottery tickets did so to win money. A
significant proportion also reported doing so for entertainment.
• Most respondents that gambled on lottery tickets did so alone.
Casino Slot Machines
• Six percent (n=60) of the survey sample reported that they had played casino slot machines at least once in the 12 months prior to the survey.
• Five percent of slot machine participants were monthly players (1-3 times per
month).
• Ninety-five percent of slot machine participants were yearly players (1-11 times per year).
• Most respondents who engaged in gambling on slot machines reported that
they did so for entertainment. A significant proportion reported that they engaged in slot machine gambling to win money.
• Most respondents who gambled on slot machines did so with others.
Sports Lotteries
• Three percent (n=30) of the survey sample had participated in sports lotteries at least once in the 12 months prior to the survey.
• Twenty-seven percent of sports lottery participants were weekly players (at
least once per week).
• Twenty-three percent of sports lottery participants were monthly players (1-3 times per month).
• Fifty percent of sports lottery participants were yearly players (1-11 times per
year).
• Most respondents who participated in sports lotteries did so to win money. Many respondents also indicated that they did so for entertainment.
• Most people who gamble on sports lotteries do so alone.

Gambling and Problem Gambling in Prince Edward Island February 2006
Doiron 48
Sports Pools
• Three-point-one percent (n=31) of the survey sample had bet in sports pools at least once in the 12 months prior to the survey.
• Ten percent of sports pool players were weekly players (at least once per
year).
• Ninety percent of sports pool players were occasional players (1-11 times per year).
• Most people who reported participating in sports pools did so for
entertainment. A significant proportion also reported doing so to win money or to be with friends.
• Most respondents who participated in sports pools did so with friends or
coworkers. A significant proportion also reported participating alone. Casino Table Games
• Four percent (n=40) of the survey sample had played casino table games at least once in the 12 months prior to the survey.
• Three percent of casino table game participants were weekly players (at least
once per week).
• Eight percent of casino table game participants were monthly players (1-3 times per month).
• Eighty-nine percent of casino table game participants were yearly players (1-
11 times per year).
• Most respondents who gambled on casino table games did so for entertainment.
• Most people who gambled on casino table games did do with other people.
Video Lottery Terminals
• Eight percent (n=80) of the survey sample played video lottery terminals at least once in the 12 months prior to the survey.
• Twenty-three percent of VLT participants were weekly players (at least once
per week).
Gambling and Problem Gambling in Prince Edward Island February 2006
Doiron 49
• Twenty-seven percent of VLT participants were monthly players (1-3 times per month).
• Fifty percent of VLT participants were yearly players (1-11 times per year).
• Most respondents who gambled on video lottery terminals did so for
entertainment or to win money. A wide range of other reasons for play were also noted, including for excitement or as a challenge, to be with friends, to be alone, and as a distraction.
• Most respondents who gambled on video lottery terminals did so alone. Of
the respondents who reported gambling with other people, most gambled with friends or coworkers and not with family members.
Gambling and Problem Gambling in Prince Edward Island February 2006
Doiron 50
Problem Gambling in Prince Edward Island
Table 11 summarizes the prevalence of the CPGI gambler subtypes. The table also includes an estimate of the number of adults in the adult population of P.E.I. that fall into each category. Table 11 CPGI Gambler Classification of Participants
Gambler Classification
Non-Problem Gamblers (N=791)
Low Risk Gamblers
(N=12)
Moderate Risk
Gamblers (N=7)
Problem Gamblers
(N=9)
Percent of Sample 79.1 1.2 .7 .9 Error Rate
+/- 2.52% +/- .67 +/- .51% +/- .58%
Confidence Interval 76.58 – 81.62 .53 – 1.87 .19 – 1.21 .32 – 1.48 Prevalence Range in the Population
78246 – 83395 542 – 1911 194 – 1236 327 – 1512
As stated earlier, the prevalence of problematic gambling has been defined as the total of the CPGI problem gambling rate and the CPGI Moderate Risk gambling rate. Therefore the rate of gambling problems in the survey is 1.6%, which, based on the size of the adult population in Prince Edward Island, suggests a problem gambling prevalence range between 848 and 2422 persons. It is also important to note that participants who fall into the Low Risk category endorsed at least one symptom of problem gambling on the CPGI, and some endorsed more than one symptom. Although the CPGI describes this group as “low risk” it is possible that this group might be at increased vulnerability for the development of a problem gambling. While it is difficult to compare the prevalence of problem gambling in 1999 with the prevalence of problem gambling in 2005 due to the use of different assessment instruments (SOGS in 1999 vs. CPGI in 2005), according to the score conversion guidelines offered by the authors of the CPGI, the prevalence of problem gambling in Prince Edward Island is estimated to be unchanged between 1999 and 2005. It is noteworthy that the estimate provided in the current report is very similar to the estimate provided by Cox et. al (2005). In the next sections of the report, which describes various characteristics of each gambling group, the CPGI Moderate Risk and Problem categories are combined.
Gambling and Problem Gambling in Prince Edward Island February 2006
Doiron 51
Demographic Characteristics Table 12 summarizes the gender, age and marital status of the four CPGI gambler subtypes. Table 12 Gender, Age, Marital Status by CPGI Gambler Subtypes
Gambler Classification
Non-Problem Gamblers (n)
(N=791)
Low Risk Gamblers (n)
(N=12)
Gambling Problem (N=16)
Sig.
Gender % N % N % N p.< .10 Male 45.3 358 50 6 75 12 Female 54.7 433 50 6 25 4 Age n.s 18-34 27.1 214 8.3 1 25.0 4 35-54 44.2 350 75.0 9 50.0 8 55 and over 28.7 227 16.6 2 25.0 4 Marital Status n.s Single 21.7 172 16.7 2 37.5 6 Married / Common-Law
62.7 496 66.7 8 50.0 8
Divorced / Separated
10.1 80 16.7 2 0 0
Widowed 5.4 43 0 0 12.5 2
• Participants that experienced a gambling problem were somewhat more likely to be male.
• There were no significant differences among the groups in relation to age or
marital status.
Gambling and Problem Gambling in Prince Edward Island February 2006
Doiron 52
Table 13 summarizes the education, employment and income of the CPGI gambler subtypes. Table 13 Education, Employment, Income by CPGI Gambler Subtypes
Gambler Classification Non-Problem Gamblers (N=791)
Low Risk Gamblers
(N=12)
Gambling Problem (N=16)
Sig.
Education % N % N % N n.s. Elementary School 1.4 11 0 0 6.3 1 High School 54.7 293 58.3 () 7 37.5 6 Community College 37.0 237 25.0 () 3 37.5 6 University 25.9 205 8.3 () 2 18.8 3 Advanced Degree 5.7 45 0 0 0 0 Employment n.s. Employed Full Time 50.4 399 58.3 7 43.8 7 Employed Part Time 11.3 89 16.7 2 0 0 Unemployed 9.1 72 0 0 25.0 4 Student 4.4 35 8.3 1 0 0 Retired 19.3 153 8.3 1 18.8 3 Homemaker 3.3 26 0 0 0 0 Seasonally Employed 2.1 17 8.3 1 6.3 1 Other 0 0 0 6.3 1 Income n.s. Less than 20,000 9.9 78 0 0 12.5 2 $20,000 to $39,000 25.5 202 25.0 3 25.0 4 $40.000 to $59,000 22.1 175 5.8 7 25.0 4 $60,000 to $79,000 11.3 89 0 0 6.3 1 $80,000 to $99,000 5.9 47 0 0 6.3 1 More than $100,000 8.3 66 0 0 0 0
• There were no significant differences among the groups in relation to education,
employment or income. In addition to understanding the demographic characteristics of participants with a gambling problem, it is also important to determine whether these people are over represented in relation to receiving various forms of financial assistance. Indeed, anecdotal reports suggest concern that many of those who have gambling problems are among the most financially disadvantaged groups in society. Table 14 summarizes the number within each gambling subtype that received various forms of government financial assistance.
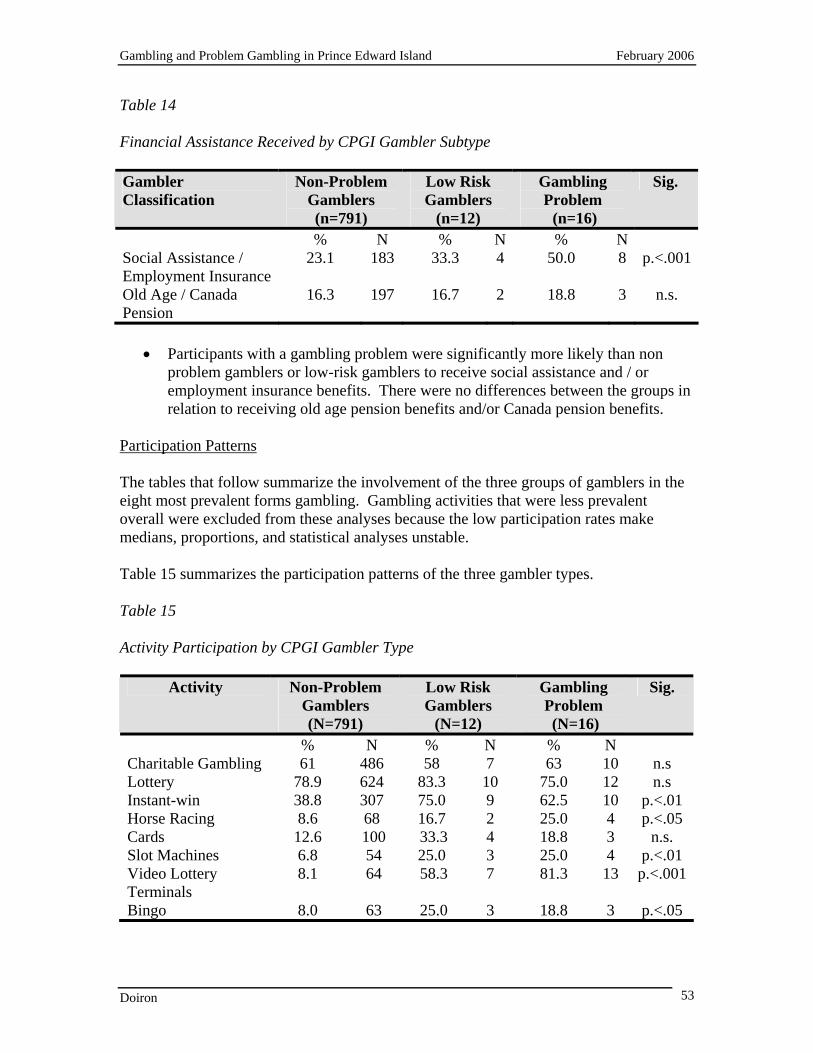
Gambling and Problem Gambling in Prince Edward Island February 2006
Doiron 53
Table 14 Financial Assistance Received by CPGI Gambler Subtype Gambler Classification
Non-Problem Gamblers (n=791)
Low Risk Gamblers
(n=12)
Gambling Problem (n=16)
Sig.
% N % N % N Social Assistance / Employment Insurance
23.1 183 33.3 4 50.0 8 p.<.001
Old Age / Canada Pension
16.3 197 16.7 2 18.8 3 n.s.
• Participants with a gambling problem were significantly more likely than non
problem gamblers or low-risk gamblers to receive social assistance and / or employment insurance benefits. There were no differences between the groups in relation to receiving old age pension benefits and/or Canada pension benefits.
Participation Patterns The tables that follow summarize the involvement of the three groups of gamblers in the eight most prevalent forms gambling. Gambling activities that were less prevalent overall were excluded from these analyses because the low participation rates make medians, proportions, and statistical analyses unstable. Table 15 summarizes the participation patterns of the three gambler types. Table 15 Activity Participation by CPGI Gambler Type
Activity Non-Problem Gamblers (N=791)
Low Risk Gamblers
(N=12)
Gambling Problem (N=16)
Sig.
% N % N % N Charitable Gambling 61 486 58 7 63 10 n.s Lottery 78.9 624 83.3 10 75.0 12 n.s Instant-win 38.8 307 75.0 9 62.5 10 p.<.01 Horse Racing 8.6 68 16.7 2 25.0 4 p.<.05 Cards 12.6 100 33.3 4 18.8 3 n.s. Slot Machines 6.8 54 25.0 3 25.0 4 p.<.01 Video Lottery Terminals
8.1 64 58.3 7 81.3 13 p.<.001
Bingo 8.0 63 25.0 3 18.8 3 p.<.05
Gambling and Problem Gambling in Prince Edward Island February 2006
Doiron 54
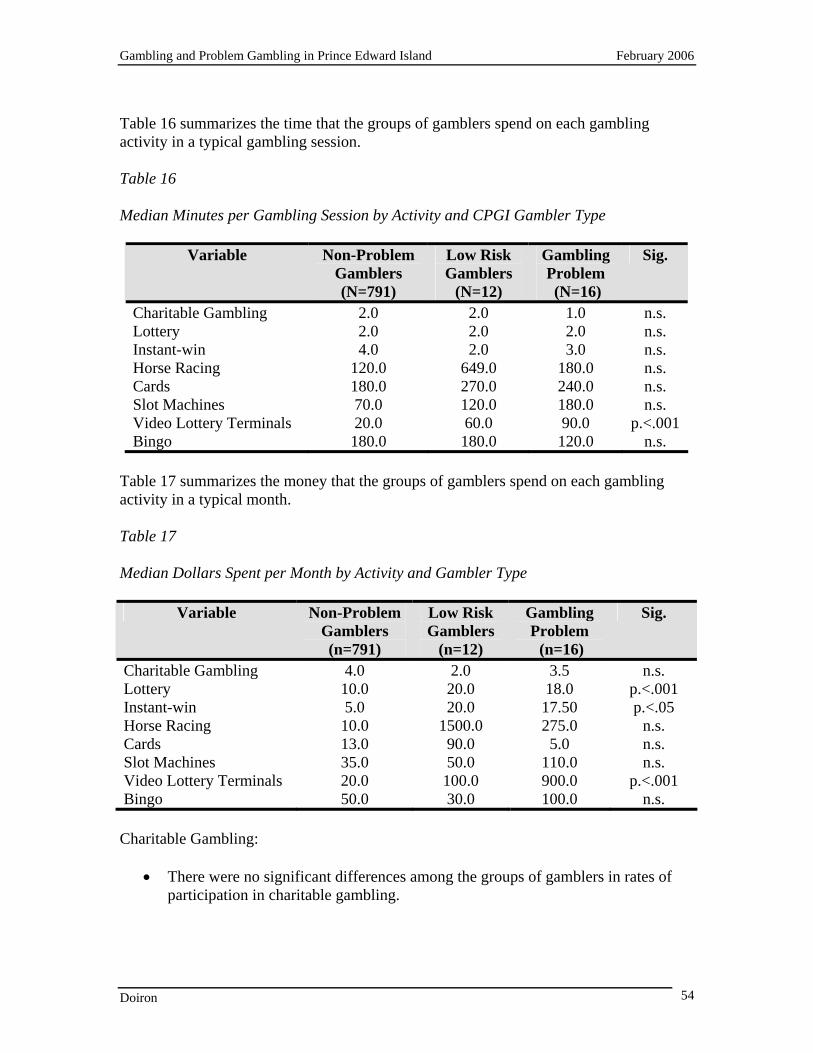
Table 16 summarizes the time that the groups of gamblers spend on each gambling activity in a typical gambling session. Table 16 Median Minutes per Gambling Session by Activity and CPGI Gambler Type
Variable Non-Problem Gamblers (N=791)
Low Risk Gamblers
(N=12)
Gambling Problem (N=16)
Sig.
Charitable Gambling 2.0 2.0 1.0 n.s. Lottery 2.0 2.0 2.0 n.s. Instant-win 4.0 2.0 3.0 n.s. Horse Racing 120.0 649.0 180.0 n.s. Cards 180.0 270.0 240.0 n.s. Slot Machines 70.0 120.0 180.0 n.s. Video Lottery Terminals 20.0 60.0 90.0 p.<.001 Bingo 180.0 180.0 120.0 n.s.
Table 17 summarizes the money that the groups of gamblers spend on each gambling activity in a typical month. Table 17 Median Dollars Spent per Month by Activity and Gambler Type
Variable Non-Problem Gamblers (n=791)
Low Risk Gamblers
(n=12)
Gambling Problem (n=16)
Sig.
Charitable Gambling 4.0 2.0 3.5 n.s. Lottery 10.0 20.0 18.0 p.<.001 Instant-win 5.0 20.0 17.50 p.<.05 Horse Racing 10.0 1500.0 275.0 n.s. Cards 13.0 90.0 5.0 n.s. Slot Machines 35.0 50.0 110.0 n.s. Video Lottery Terminals 20.0 100.0 900.0 p.<.001 Bingo 50.0 30.0 100.0 n.s. Charitable Gambling:
• There were no significant differences among the groups of gamblers in rates of participation in charitable gambling.
Gambling and Problem Gambling in Prince Edward Island February 2006
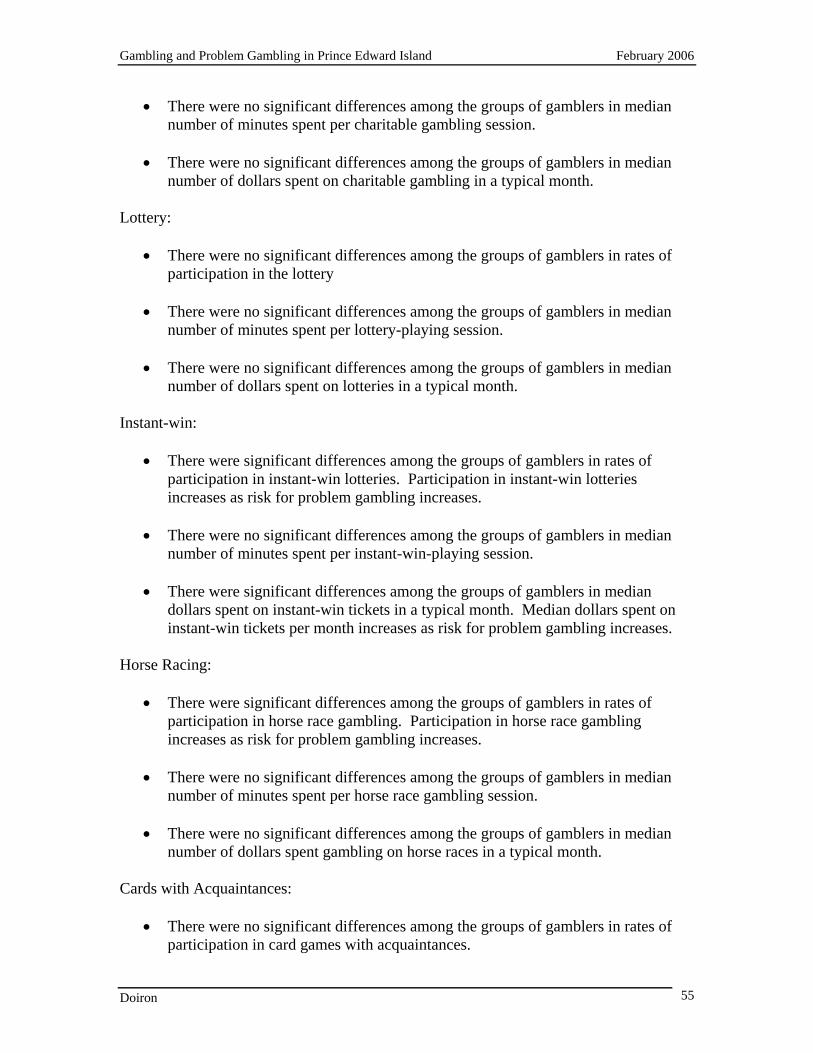
Doiron 55
• There were no significant differences among the groups of gamblers in median number of minutes spent per charitable gambling session.
• There were no significant differences among the groups of gamblers in median
number of dollars spent on charitable gambling in a typical month. Lottery:
• There were no significant differences among the groups of gamblers in rates of participation in the lottery
• There were no significant differences among the groups of gamblers in median
number of minutes spent per lottery-playing session.
• There were no significant differences among the groups of gamblers in median number of dollars spent on lotteries in a typical month.
Instant-win:
• There were significant differences among the groups of gamblers in rates of participation in instant-win lotteries. Participation in instant-win lotteries increases as risk for problem gambling increases.
• There were no significant differences among the groups of gamblers in median
number of minutes spent per instant-win-playing session.
• There were significant differences among the groups of gamblers in median dollars spent on instant-win tickets in a typical month. Median dollars spent on instant-win tickets per month increases as risk for problem gambling increases.
Horse Racing:
• There were significant differences among the groups of gamblers in rates of participation in horse race gambling. Participation in horse race gambling increases as risk for problem gambling increases.
• There were no significant differences among the groups of gamblers in median
number of minutes spent per horse race gambling session.
• There were no significant differences among the groups of gamblers in median number of dollars spent gambling on horse races in a typical month.
Cards with Acquaintances:
• There were no significant differences among the groups of gamblers in rates of participation in card games with acquaintances.
Gambling and Problem Gambling in Prince Edward Island February 2006
Doiron 56
• There were no significant differences among the groups of gamblers in median
number of minutes spent per session of card games with acquaintances.
• There were no significant differences among the groups of gamblers in median number of dollars spent on card games with acquaintances in a typical month.
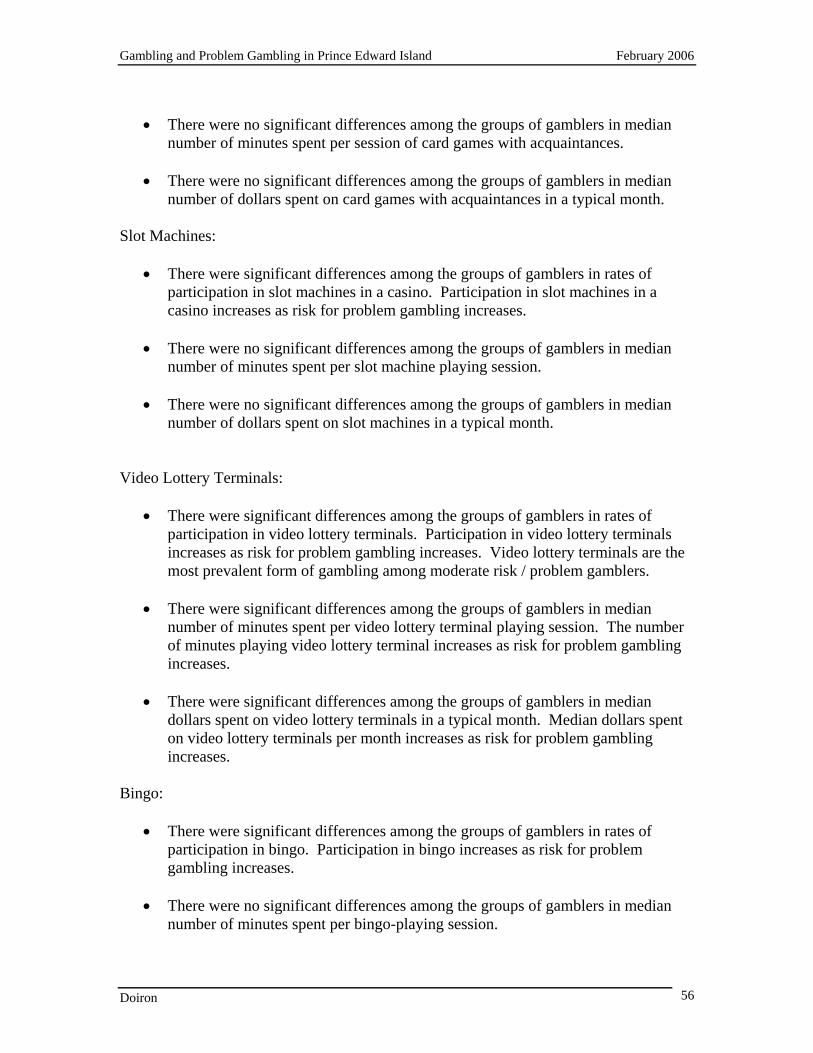
Slot Machines:
• There were significant differences among the groups of gamblers in rates of participation in slot machines in a casino. Participation in slot machines in a casino increases as risk for problem gambling increases.
• There were no significant differences among the groups of gamblers in median
number of minutes spent per slot machine playing session.
• There were no significant differences among the groups of gamblers in median number of dollars spent on slot machines in a typical month.
Video Lottery Terminals:
• There were significant differences among the groups of gamblers in rates of participation in video lottery terminals. Participation in video lottery terminals increases as risk for problem gambling increases. Video lottery terminals are the most prevalent form of gambling among moderate risk / problem gamblers.
• There were significant differences among the groups of gamblers in median
number of minutes spent per video lottery terminal playing session. The number of minutes playing video lottery terminal increases as risk for problem gambling increases.
• There were significant differences among the groups of gamblers in median
dollars spent on video lottery terminals in a typical month. Median dollars spent on video lottery terminals per month increases as risk for problem gambling increases.
Bingo:
• There were significant differences among the groups of gamblers in rates of participation in bingo. Participation in bingo increases as risk for problem gambling increases.
• There were no significant differences among the groups of gamblers in median
number of minutes spent per bingo-playing session.
Gambling and Problem Gambling in Prince Edward Island February 2006
Doiron 57
• There were no significant differences among the groups of gamblers in median number of dollars spent on bingo in a typical month.
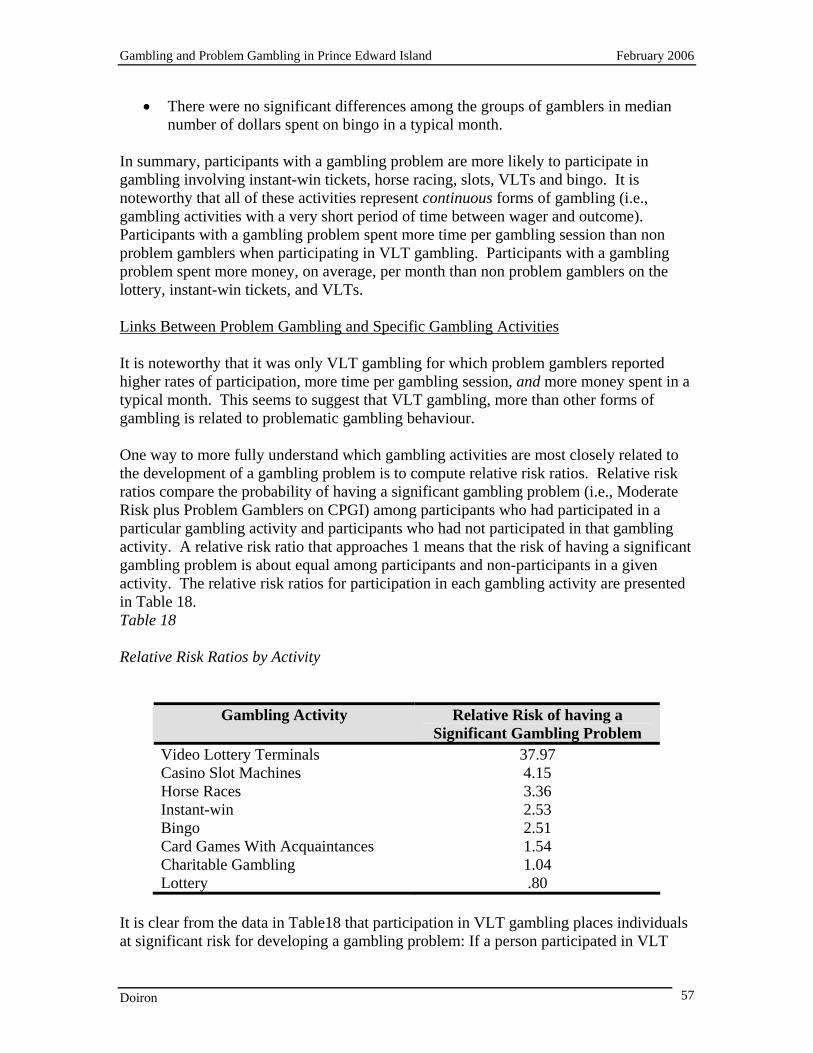
In summary, participants with a gambling problem are more likely to participate in gambling involving instant-win tickets, horse racing, slots, VLTs and bingo. It is noteworthy that all of these activities represent continuous forms of gambling (i.e., gambling activities with a very short period of time between wager and outcome). Participants with a gambling problem spent more time per gambling session than non problem gamblers when participating in VLT gambling. Participants with a gambling problem spent more money, on average, per month than non problem gamblers on the lottery, instant-win tickets, and VLTs. Links Between Problem Gambling and Specific Gambling Activities It is noteworthy that it was only VLT gambling for which problem gamblers reported higher rates of participation, more time per gambling session, and more money spent in a typical month. This seems to suggest that VLT gambling, more than other forms of gambling is related to problematic gambling behaviour. One way to more fully understand which gambling activities are most closely related to the development of a gambling problem is to compute relative risk ratios. Relative risk ratios compare the probability of having a significant gambling problem (i.e., Moderate Risk plus Problem Gamblers on CPGI) among participants who had participated in a particular gambling activity and participants who had not participated in that gambling activity. A relative risk ratio that approaches 1 means that the risk of having a significant gambling problem is about equal among participants and non-participants in a given activity. The relative risk ratios for participation in each gambling activity are presented in Table 18. Table 18 Relative Risk Ratios by Activity
Gambling Activity Relative Risk of having a Significant Gambling Problem
Video Lottery Terminals 37.97 Casino Slot Machines 4.15 Horse Races 3.36 Instant-win 2.53 Bingo 2.51 Card Games With Acquaintances 1.54 Charitable Gambling 1.04 Lottery .80
It is clear from the data in Table18 that participation in VLT gambling places individuals at significant risk for developing a gambling problem: If a person participated in VLT
Gambling and Problem Gambling in Prince Edward Island February 2006
Doiron 58
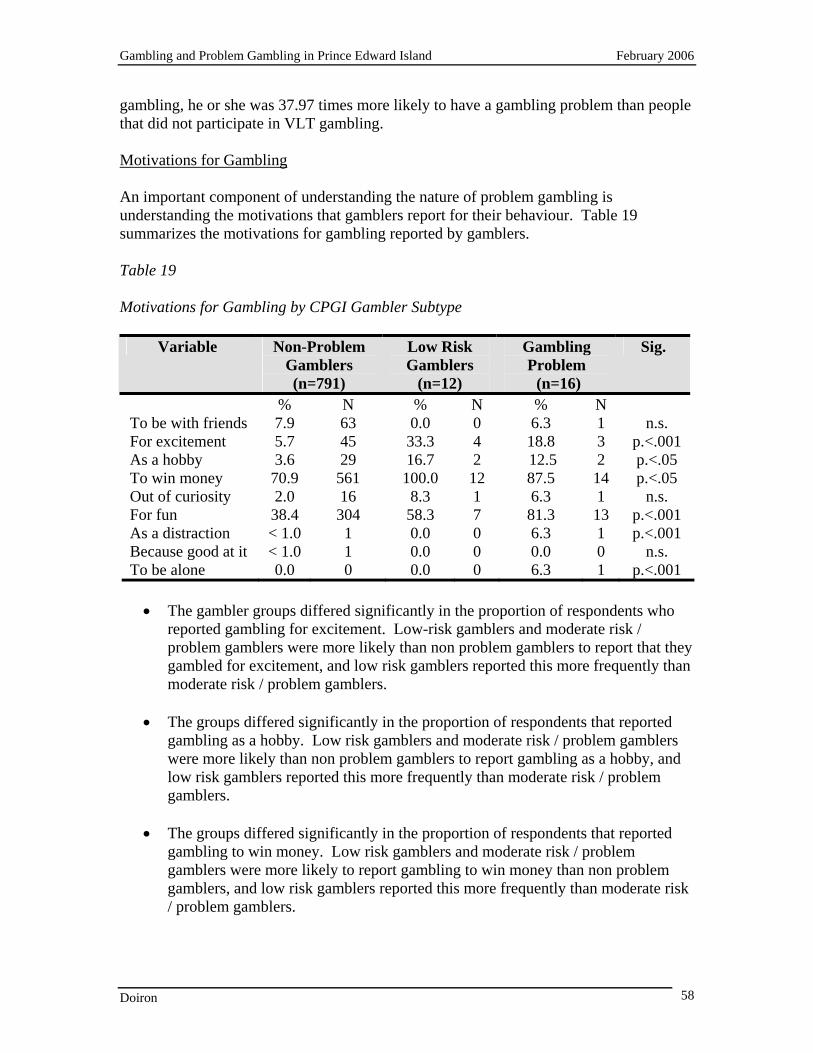
gambling, he or she was 37.97 times more likely to have a gambling problem than people that did not participate in VLT gambling. Motivations for Gambling An important component of understanding the nature of problem gambling is understanding the motivations that gamblers report for their behaviour. Table 19 summarizes the motivations for gambling reported by gamblers. Table 19 Motivations for Gambling by CPGI Gambler Subtype
Variable Non-Problem Gamblers (n=791)
Low Risk Gamblers
(n=12)
Gambling Problem (n=16)
Sig.
% N % N % N To be with friends 7.9 63 0.0 0 6.3 1 n.s. For excitement 5.7 45 33.3 4 18.8 3 p.<.001 As a hobby 3.6 29 16.7 2 12.5 2 p.<.05 To win money 70.9 561 100.0 12 87.5 14 p.<.05 Out of curiosity 2.0 16 8.3 1 6.3 1 n.s. For fun 38.4 304 58.3 7 81.3 13 p.<.001 As a distraction < 1.0 1 0.0 0 6.3 1 p.<.001 Because good at it < 1.0 1 0.0 0 0.0 0 n.s. To be alone 0.0 0 0.0 0 6.3 1 p.<.001
• The gambler groups differed significantly in the proportion of respondents who
reported gambling for excitement. Low-risk gamblers and moderate risk / problem gamblers were more likely than non problem gamblers to report that they gambled for excitement, and low risk gamblers reported this more frequently than moderate risk / problem gamblers.
• The groups differed significantly in the proportion of respondents that reported
gambling as a hobby. Low risk gamblers and moderate risk / problem gamblers were more likely than non problem gamblers to report gambling as a hobby, and low risk gamblers reported this more frequently than moderate risk / problem gamblers.
• The groups differed significantly in the proportion of respondents that reported
gambling to win money. Low risk gamblers and moderate risk / problem gamblers were more likely to report gambling to win money than non problem gamblers, and low risk gamblers reported this more frequently than moderate risk / problem gamblers.
Gambling and Problem Gambling in Prince Edward Island February 2006
Doiron 59
• The groups differed significantly in the proportion of respondents that reported gambling for fun. Low risk and moderate risk / problem gamblers were more likely to report gambling for fun than non problem gamblers, and moderate risk / problem gamblers were more likely to report this than low risk gamblers.
• The groups differed significantly in the proportion of respondents that reported
gambling as a means of distraction. Moderate risk / problem gamblers were more likely than low risk and non problem gamblers to report gambling as means of distraction.
• The groups differed significantly in the proportion of respondents that reported
gambling as a means to be alone. Moderate risk / problem gamblers were more likely than low risk and non problem gamblers to report gambling as means to be alone.
• There were no significant differences between the groups in the proportion of
respondents who reported gambling to be with friends, out of curiosity, or because they were good at it.
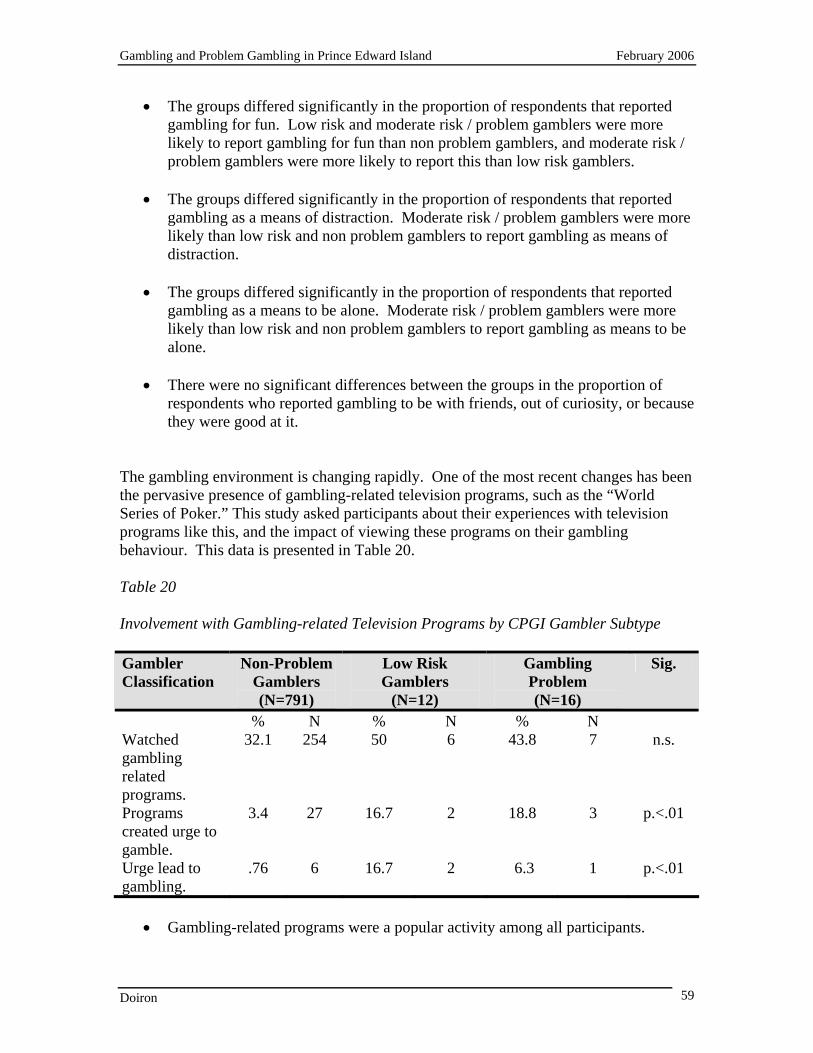
The gambling environment is changing rapidly. One of the most recent changes has been the pervasive presence of gambling-related television programs, such as the “World Series of Poker.” This study asked participants about their experiences with television programs like this, and the impact of viewing these programs on their gambling behaviour. This data is presented in Table 20. Table 20 Involvement with Gambling-related Television Programs by CPGI Gambler Subtype Gambler Classification
Non-Problem Gamblers (N=791)
Low Risk Gamblers
(N=12)
Gambling Problem (N=16)
Sig.
% N % N % N Watched gambling related programs.
32.1 254 50 6 43.8 7 n.s.
Programs created urge to gamble.
3.4 27 16.7 2 18.8 3 p.<.01
Urge lead to gambling.
.76 6 16.7 2 6.3 1 p.<.01
• Gambling-related programs were a popular activity among all participants.
Gambling and Problem Gambling in Prince Edward Island February 2006
Doiron 60
• Watching these programs was significantly more likely to lead to an urge to gamble among Low-risk participants and participants with a gambling problem than non-problem participants.
• Participants in the Low-Risk and Gambling Problem groups were significantly
more likely to report that they had an urge to gamble that resulted in actual gambling behaviour.
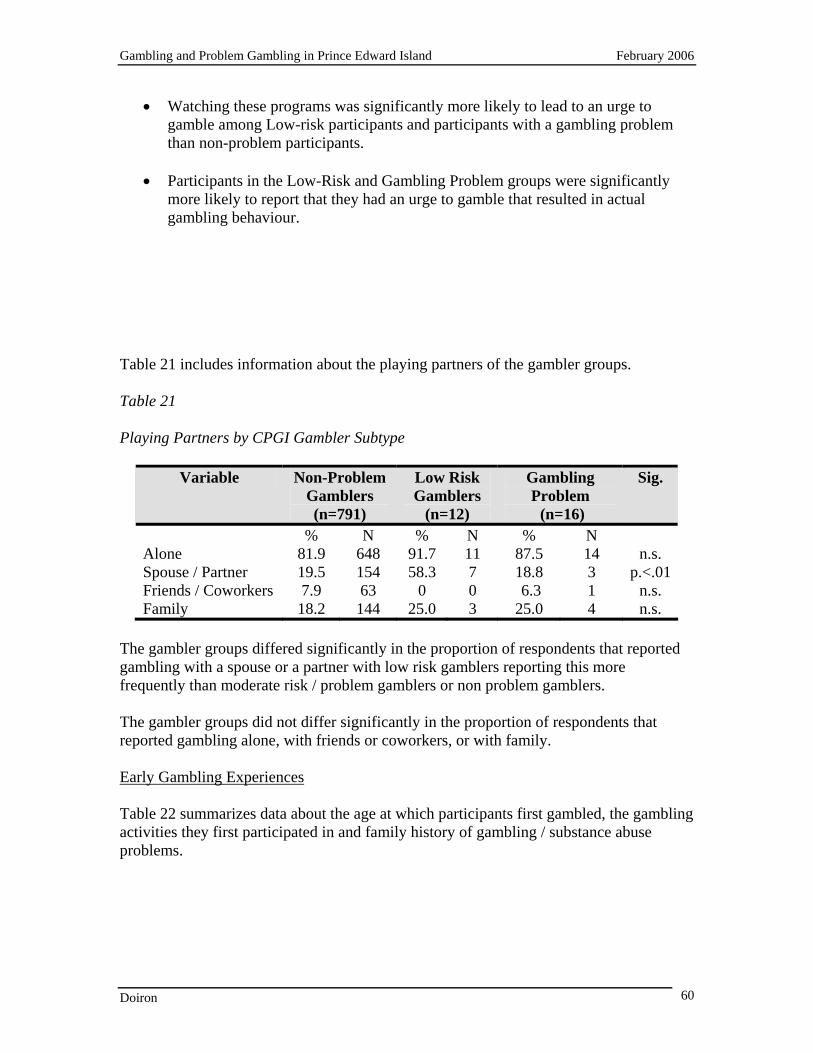
Table 21 includes information about the playing partners of the gambler groups. Table 21 Playing Partners by CPGI Gambler Subtype
Variable Non-Problem Gamblers (n=791)
Low Risk Gamblers
(n=12)
Gambling Problem (n=16)
Sig.
% N % N % N Alone 81.9 648 91.7 11 87.5 14 n.s. Spouse / Partner 19.5 154 58.3 7 18.8 3 p.<.01Friends / Coworkers 7.9 63 0 0 6.3 1 n.s. Family 18.2 144 25.0 3 25.0 4 n.s.
The gambler groups differed significantly in the proportion of respondents that reported gambling with a spouse or a partner with low risk gamblers reporting this more frequently than moderate risk / problem gamblers or non problem gamblers. The gambler groups did not differ significantly in the proportion of respondents that reported gambling alone, with friends or coworkers, or with family. Early Gambling Experiences Table 22 summarizes data about the age at which participants first gambled, the gambling activities they first participated in and family history of gambling / substance abuse problems.
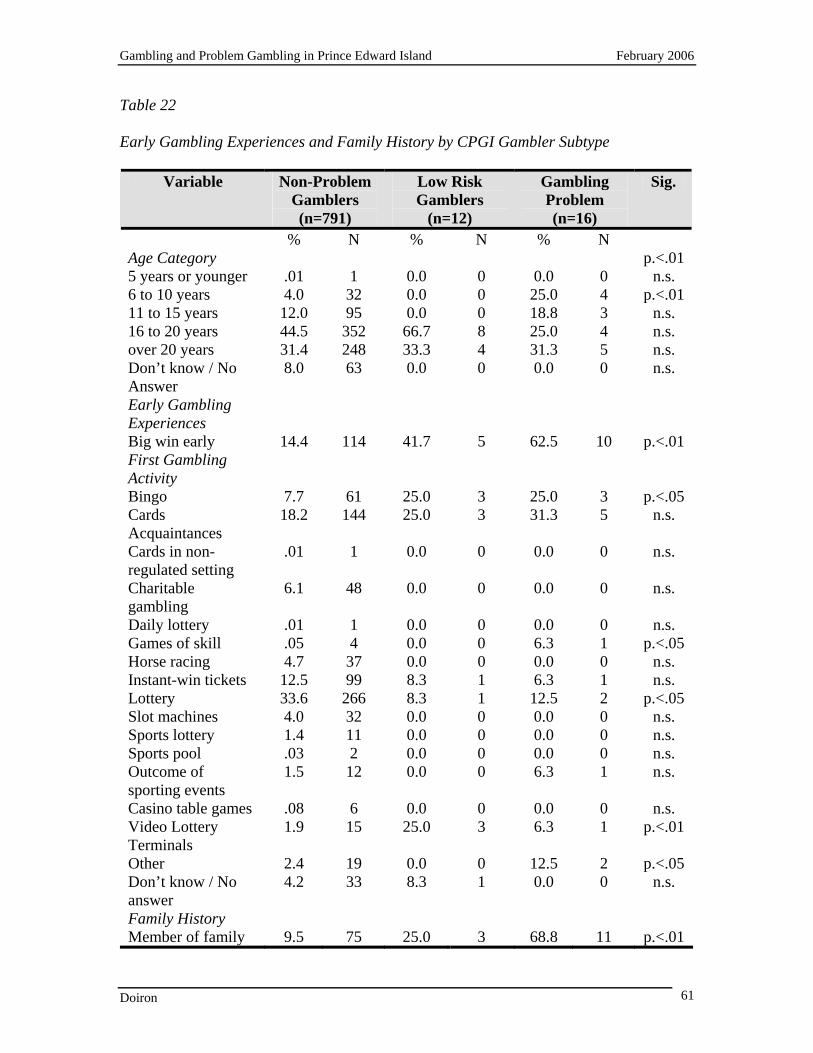
Gambling and Problem Gambling in Prince Edward Island February 2006
Doiron 61
Table 22 Early Gambling Experiences and Family History by CPGI Gambler Subtype
Variable Non-Problem Gamblers (n=791)
Low Risk Gamblers
(n=12)
Gambling Problem (n=16)
Sig.
% N % N % N Age Category p.<.01 5 years or younger .01 1 0.0 0 0.0 0 n.s. 6 to 10 years 4.0 32 0.0 0 25.0 4 p.<.01 11 to 15 years 12.0 95 0.0 0 18.8 3 n.s. 16 to 20 years 44.5 352 66.7 8 25.0 4 n.s. over 20 years 31.4 248 33.3 4 31.3 5 n.s. Don’t know / No Answer
8.0 63 0.0 0 0.0 0 n.s.
Early Gambling Experiences
Big win early 14.4 114 41.7 5 62.5 10 p.<.01 First Gambling Activity
Bingo 7.7 61 25.0 3 25.0 3 p.<.05 Cards Acquaintances
18.2 144 25.0 3 31.3 5 n.s.
Cards in non-regulated setting
.01 1 0.0 0 0.0 0 n.s.
Charitable gambling
6.1 48 0.0 0 0.0 0 n.s.
Daily lottery .01 1 0.0 0 0.0 0 n.s. Games of skill .05 4 0.0 0 6.3 1 p.<.05 Horse racing 4.7 37 0.0 0 0.0 0 n.s. Instant-win tickets 12.5 99 8.3 1 6.3 1 n.s. Lottery 33.6 266 8.3 1 12.5 2 p.<.05 Slot machines 4.0 32 0.0 0 0.0 0 n.s. Sports lottery 1.4 11 0.0 0 0.0 0 n.s. Sports pool .03 2 0.0 0 0.0 0 n.s. Outcome of sporting events
1.5 12 0.0 0 6.3 1 n.s.
Casino table games .08 6 0.0 0 0.0 0 n.s. Video Lottery Terminals
1.9 15 25.0 3 6.3 1 p.<.01
Other 2.4 19 0.0 0 12.5 2 p.<.05 Don’t know / No answer
4.2 33 8.3 1 0.0 0 n.s.
Family History Member of family 9.5 75 25.0 3 68.8 11 p.<.01
Gambling and Problem Gambling in Prince Edward Island February 2006
Doiron 62
Variable Non-Problem Gamblers (n=791)
Low Risk Gamblers
(n=12)
Gambling Problem (n=16)
Sig.
with gambling problem Member of family with alcohol / drug problem
41.8 331 83.3 10 38.8 11 p.<.01
• Participants with a gambling problem were significantly more likely than non-
problem participants to report gambling for the first time between the ages of 6 and 10 years.
• Low Risk participants and participants with a gambling problem were
significantly more likely than non problem participants to report experiencing a big win early in their gambling careers.
• Low Risk participants and participants with a gambling problem were
significantly more likely than non problem participants to report that bingo and VLTs were the gambling activities that they participated in first. Participants with a gambling problem were significantly morel likely than low risk and non problem gamblers to report betting on games of skill as their first gambling experience.
• Low risk and participants and participants with a gambling problem were
significantly less likely than non problem participants to report participation in the lottery as their first gambling experience.
Consequences of Gambling Problem gambling has negative impacts for both the gambler and for those around him or her such as family and friends. Table 23 summarizes some of the personal and social consequences of problem gambling behaviour among the gambler groups.
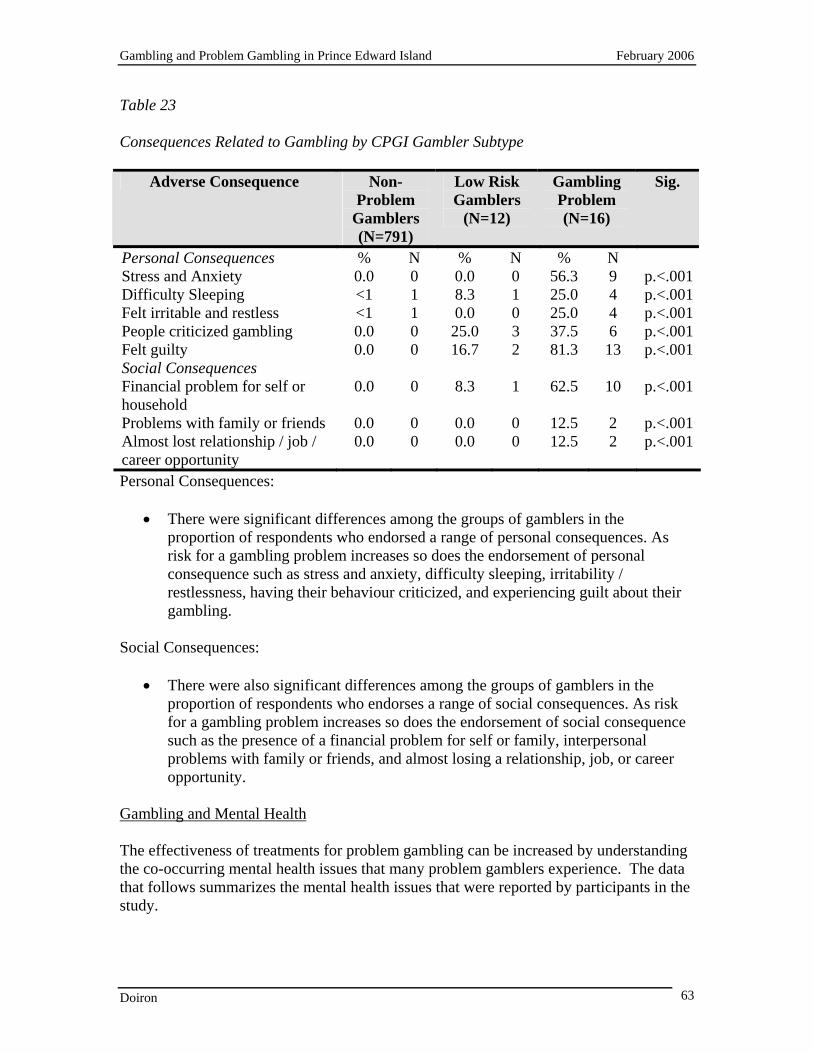
Gambling and Problem Gambling in Prince Edward Island February 2006
Doiron 63
Table 23 Consequences Related to Gambling by CPGI Gambler Subtype
Adverse Consequence Non-Problem
Gamblers (N=791)
Low Risk Gamblers
(N=12)
Gambling Problem (N=16)
Sig.
Personal Consequences % N % N % N Stress and Anxiety 0.0 0 0.0 0 56.3 9 p.<.001Difficulty Sleeping <1 1 8.3 1 25.0 4 p.<.001Felt irritable and restless <1 1 0.0 0 25.0 4 p.<.001People criticized gambling 0.0 0 25.0 3 37.5 6 p.<.001Felt guilty 0.0 0 16.7 2 81.3 13 p.<.001Social Consequences Financial problem for self or household
0.0 0 8.3 1 62.5 10 p.<.001
Problems with family or friends 0.0 0 0.0 0 12.5 2 p.<.001Almost lost relationship / job / career opportunity
0.0 0 0.0 0 12.5 2 p.<.001
Personal Consequences:
• There were significant differences among the groups of gamblers in the proportion of respondents who endorsed a range of personal consequences. As risk for a gambling problem increases so does the endorsement of personal consequence such as stress and anxiety, difficulty sleeping, irritability / restlessness, having their behaviour criticized, and experiencing guilt about their gambling.
Social Consequences:
• There were also significant differences among the groups of gamblers in the proportion of respondents who endorses a range of social consequences. As risk for a gambling problem increases so does the endorsement of social consequence such as the presence of a financial problem for self or family, interpersonal problems with family or friends, and almost losing a relationship, job, or career opportunity.
Gambling and Mental Health The effectiveness of treatments for problem gambling can be increased by understanding the co-occurring mental health issues that many problem gamblers experience. The data that follows summarizes the mental health issues that were reported by participants in the study.
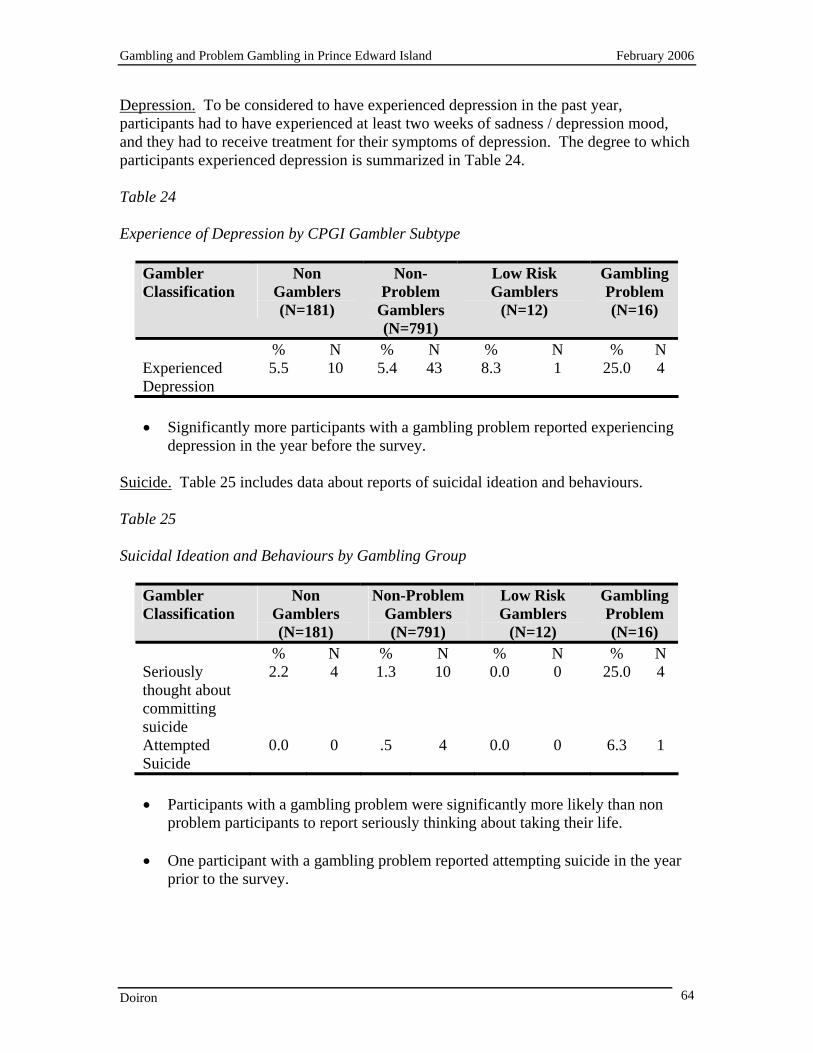
Gambling and Problem Gambling in Prince Edward Island February 2006
Doiron 64
Depression. To be considered to have experienced depression in the past year, participants had to have experienced at least two weeks of sadness / depression mood, and they had to receive treatment for their symptoms of depression. The degree to which participants experienced depression is summarized in Table 24. Table 24 Experience of Depression by CPGI Gambler Subtype
Gambler Classification
Non Gamblers (N=181)
Non-Problem
Gamblers (N=791)
Low Risk Gamblers
(N=12)
Gambling Problem (N=16)
% N % N % N % N Experienced Depression
5.5 10 5.4 43 8.3 1 25.0 4
• Significantly more participants with a gambling problem reported experiencing
depression in the year before the survey. Suicide. Table 25 includes data about reports of suicidal ideation and behaviours. Table 25 Suicidal Ideation and Behaviours by Gambling Group
Gambler Classification
Non Gamblers (N=181)
Non-Problem Gamblers (N=791)
Low Risk Gamblers
(N=12)
Gambling Problem (N=16)
% N % N % N % N Seriously thought about committing suicide
2.2 4 1.3 10 0.0 0 25.0 4
Attempted Suicide
0.0 0 .5 4 0.0 0 6.3 1
• Participants with a gambling problem were significantly more likely than non
problem participants to report seriously thinking about taking their life. • One participant with a gambling problem reported attempting suicide in the year
prior to the survey.
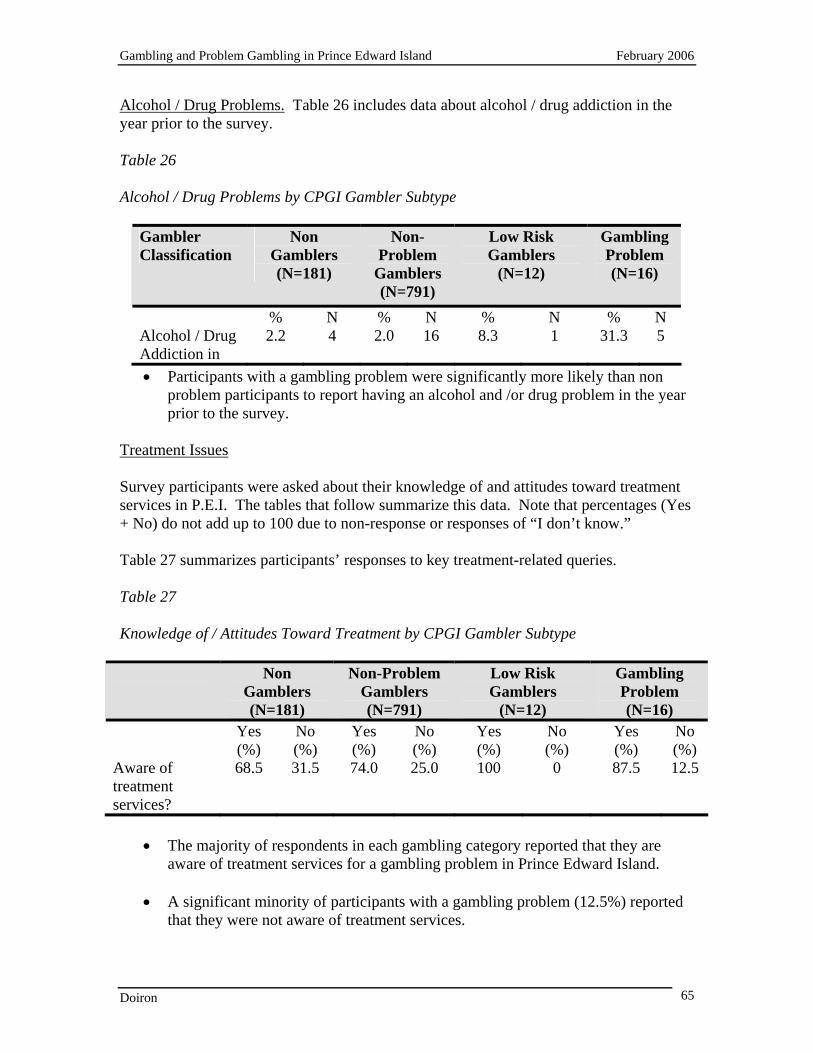
Gambling and Problem Gambling in Prince Edward Island February 2006
Doiron 65
Alcohol / Drug Problems. Table 26 includes data about alcohol / drug addiction in the year prior to the survey. Table 26 Alcohol / Drug Problems by CPGI Gambler Subtype
Gambler Classification
Non Gamblers (N=181)
Non-Problem
Gamblers (N=791)
Low Risk Gamblers
(N=12)
Gambling Problem (N=16)
% N % N % N % N Alcohol / Drug Addiction in
2.2 4 2.0 16 8.3 1 31.3 5
• Participants with a gambling problem were significantly more likely than non problem participants to report having an alcohol and /or drug problem in the year prior to the survey.
Treatment Issues Survey participants were asked about their knowledge of and attitudes toward treatment services in P.E.I. The tables that follow summarize this data. Note that percentages (Yes + No) do not add up to 100 due to non-response or responses of “I don’t know.” Table 27 summarizes participants’ responses to key treatment-related queries. Table 27 Knowledge of / Attitudes Toward Treatment by CPGI Gambler Subtype
Non Gamblers (N=181)
Non-Problem Gamblers (N=791)
Low Risk Gamblers
(N=12)
Gambling Problem (N=16)
Yes (%)
No (%)
Yes (%)
No (%)
Yes (%)
No (%)
Yes (%)
No (%)
Aware of treatment services?
68.5 31.5 74.0 25.0 100 0 87.5 12.5
• The majority of respondents in each gambling category reported that they are
aware of treatment services for a gambling problem in Prince Edward Island. • A significant minority of participants with a gambling problem (12.5%) reported
that they were not aware of treatment services.
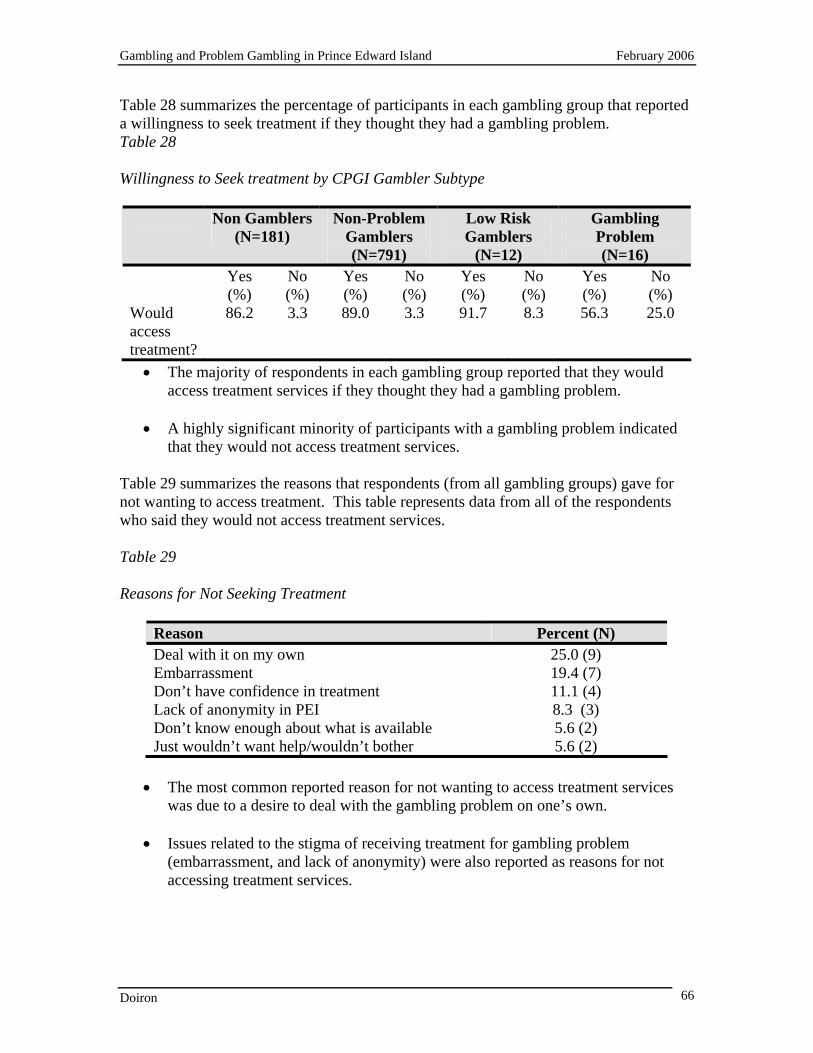
Gambling and Problem Gambling in Prince Edward Island February 2006
Doiron 66
Table 28 summarizes the percentage of participants in each gambling group that reported a willingness to seek treatment if they thought they had a gambling problem. Table 28 Willingness to Seek treatment by CPGI Gambler Subtype
Non Gamblers (N=181)
Non-Problem Gamblers (N=791)
Low Risk Gamblers
(N=12)
Gambling Problem (N=16)
Yes (%)
No (%)
Yes (%)
No (%)
Yes (%)
No (%)
Yes (%)
No (%)
Would access treatment?
86.2 3.3 89.0 3.3 91.7 8.3 56.3 25.0
• The majority of respondents in each gambling group reported that they would access treatment services if they thought they had a gambling problem.
• A highly significant minority of participants with a gambling problem indicated
that they would not access treatment services. Table 29 summarizes the reasons that respondents (from all gambling groups) gave for not wanting to access treatment. This table represents data from all of the respondents who said they would not access treatment services. Table 29 Reasons for Not Seeking Treatment
Reason Percent (N) Deal with it on my own 25.0 (9) Embarrassment 19.4 (7) Don’t have confidence in treatment 11.1 (4) Lack of anonymity in PEI 8.3 (3) Don’t know enough about what is available 5.6 (2) Just wouldn’t want help/wouldn’t bother 5.6 (2)
• The most common reported reason for not wanting to access treatment services
was due to a desire to deal with the gambling problem on one’s own. • Issues related to the stigma of receiving treatment for gambling problem
(embarrassment, and lack of anonymity) were also reported as reasons for not accessing treatment services.

Gambling and Problem Gambling in Prince Edward Island February 2006
Doiron 67
• Lack of confidence in treatment, not having enough knowledge about what is available, and lack of motivation to change were also reported as reasons for not wanting to access treatment services in Prince Edward Island.
Gambling and Problem Gambling in Prince Edward Island February 2006
Doiron 68
CONCLUSIONS AND RECOMMENDATIONS In the following section, key conclusions are presented, along with recommendations that follow from these conclusions.
1. Gambling in Prince Edward Island • Eighty-two percent of survey respondents indicated that they gambled at least
one time in the previous year. The rate of participation across various regions of the province (i.e., West Prince, East Prince, Queens, and Kings) was stable. The most popular forms of gambling in Prince Edward Island are lottery, charitable gambling, and instant-win tickets.
Recommendation 1.1: Given the popularity of gambling in Prince Edward Island it is recommended that the public be provided with more information about gambling and problem gambling so that they can make more informed choices. For example, designing and displaying key messages about gambling and problem gambling, using multiple mediums (e.g., television, radio, internet, posters etc.) should be considered. One key message that could be helpful if distributed widely is clear information on the “addiction potential” of various gambling activities (i.e., the probability of problem play on various gambling activities).
• Gamblers and non-gamblers did not differ in relation to gender. Gamblers
were significantly more likely than non gamblers to be between 35 and 44 years of age and significantly less likely to be 65 years of age and older.
• Gamblers were significantly more likely than non gamblers to be employed
full time and significantly less likely than non-gamblers to be retired.
• Gamblers were significantly less likely than non-gamblers to earn less than $20,000 and significantly more likely to earn more than $100,000.
• The overall rate of participation in gambling in Prince Edward Island appears
to have remained virtually unchanged (83% in 1999 vs. 82% in 2005). • Overall participation rates in specific activities appear to have decreased in all
activities, except for participation in lottery, which increased. However, weekly participation rates were more stable across many activities including sports lotteries, bingo, VLTs, cards with acquaintances, and horse races, and increased for participation in the lottery.
• Median monthly expenditures on gambling either remained the same or increased for all activities from 1999 to 2005 with particularly large increases in median expenditures on slot machines, VLTs, bingo, and casino table games.
Gambling and Problem Gambling in Prince Edward Island February 2006
Doiron 69
2. Problem Gambling in Prince Edward Island • The rate of problem gambling among survey participants was 1.6%. It is
estimated that the problem gambling rate in Prince Edward Island has remained stable since 1999.
• Participants with a gambling problem were somewhat more likely to be male.
They did not differ from non problem gamblers in relation to age, marital status, education, employment status, or income.
• Participants with a gambling problem were significantly more likely than non
problem gamblers to have received social assistance or employment insurance benefits in the year prior to the survey.
Recommendation 2.1: Integration of educational information with the social assistance / employment insurance process would be helpful. For example, perhaps information about gambling and problem gambling could be made available at Employment Insurance and / or social assistance offices.
3. Risk Factors for Problem Gambling • Participants with a gambling problem were significantly more likely than non-
problem gamblers to participate in instant-win, horse race, slot machine, bingo, and VLT gambling, which are all continuous forms of gambling (i.e., forms of gambling with a very brief period of time between wager and outcome).
• Participants with a gambling problem spent significantly more time gambling
on VLTs per gambling session than non problem gamblers. • Participants with a gambling problem spent significantly more money
gambling on the lottery, instant-win tickets, and VLTs than non-problem gamblers.
• Problem gambling in Prince Edward Island has been shown – for the second
time – to be uniquely related to involvement in video lottery terminal gambling. Participants who engaged in VLT gambling in the year prior to the survey were 37.97 times more likely to have a gambling problem than participants who did not participate in VLT gambling in the year prior to the survey. Most Prince Edward Islanders who develop problems with gambling do so in relation to VLT play. The observed link between problem gambling and VLT involvement is consistent with the research literature (Breen & Zimmerman, 2002; Doiron & Nicki, 2001; Morgan, Kofoed, Buchkowski, &
Gambling and Problem Gambling in Prince Edward Island February 2006
Doiron 70
Carr, 1996) and with reports from treatment providers who suggest that the majority of treatment seekers in PEI are VLT gamblers.
Recommendation 3.1: It is recommended that the availability of video lottery terminals in Prince Edward Island be decreased. Availability of VLTs is related both to the total number of VLTs in the province and the total number of venues containing VLTs. The most effective approach to decreasing availability would be lowering both of these numbers.
Recommendation 3.2: Before introducing new forms of gambling in the province, it is recommended that the potential impact of the new forms of gambling on overall health and well-being of the population be assessed. The impact assessment should attempt to gain an understanding of the relation between the particular form of gambling being considered and problem gambling. Replacing one form of gambling that is known to be particularly addictive (e.g., VLTs) with another form that might also have a high potential for problem gambling would be unfortunate.
• Participants with a gambling problem were significantly more likely than non-
problem gamblers to report that they were motivated to gamble as a distraction and/or to be alone.
4. Correlates of Problem Gambling • Participants with a gambling problem were significantly more likely than non-
problem gamblers to report a range of personal and social correlates of gambling. Personal correlates included: stress and anxiety, difficulty sleeping, irritability and restlessness, being criticized for their gambling, and feeling guilty. Social correlates included financial problems, problems with family or friends, and damage to a relationship, work or career opportunity.
Recommendation 4.1: Gambling to be alone or for a distraction, along with the range of negative correlates of gambling underline the need for research on the needs of people who develop gambling problems. One goal of this research should be to determine which factors are consequences of gambling and which factors play a causal role in the development of a gambling problem.
5. Mental Health / Addiction Correlates of Problem Gambling • Participants with a gambling problem were significantly more likely than non-
problem gamblers to experience significant symptom of depression and to have experienced problems with drugs and / or alcohol in the year prior to the survey.
Gambling and Problem Gambling in Prince Edward Island February 2006
Doiron 71
Recommendation 5.1: Effective treatment of problem gambling must be capable of addressing these mental health and addiction issues. Referring people to several services and or service providers for treatment does not promote the building or maintenance of the strong therapeutic relationships that are a necessary prerequisite to therapeutic change. While referrals to other services or professionals will always be necessary in some circumstances, moving towards a system in which this is the exception as opposed to the rule is an important goal.
• Participants with a gambling problem were significantly more likely than non-
problem participants to report having engaged in suicidal thinking and behaviours in the previous year.
Recommendation 5.2: It is important that people who experience gambling problems have access to supports in times of crisis when suicidal ideation and behaviours are most likely to occur. Twenty-four hour support (e.g., via telephone) provides a measure of support in times of crisis.
6. Knowledge of / Attitudes Toward Treatment Services • The majority of participants, regardless of their degree of involvement with
gambling, were aware of the gambling treatment services available in Prince Edward Island. However, it is important to note that a significant minority of participants with a gambling problem (12.5%) were not aware that treatment services were available.
Recommendation 6.1: Due to the regulation of gambling, government has a relatively high degree of control over the messages that gamblers get when they engage in gambling behaviour. It is recommended that information about treatment services, including contact and referral information be made visible and available at all gambling venues in the province. Messages aimed at the general public are also recommended.
• Twenty-five percent of participants with a gambling problem stated that they
would not access treatment services if they thought they had a problem with gambling. This represents a significant proportion of a group of people that are particularly in need of help. The most common reason for not seeking treatment was a desire to handle the problem on one’s own.
Recommendation 6.2: Reaching out with self-help resources might be particularly helpful. These resources could include referral information for self-help groups, but might also include “minimal intervention treatments” which have shown promise in the research literature (Hodgins, Currie, el-Guebaly, 2001). These minimal intervention treatments, for example, could take the form of self-help materials (e.g., manuals, videos
Gambling and Problem Gambling in Prince Edward Island February 2006
Doiron 72
etc.) that a person could use on their own or in collaboration with a trained professional (e.g., via telephone contact).
• Feelings of embarrassment and concerns about lack of anonymity were also
reported as reasons that respondents would not access treatment services.
Recommendation 6.3: Efforts to decrease these feeling and concerns are recommended. Clear statements about confidentiality of services might be one way to allay concerns. Treatments for problem gambling might be more attractive if they are delivered within the communities of treatment seekers. For example, receiving treatment for a gambling problem in a community health centre might produce fewer feelings of embarrassment than receiving treatment at an addiction treatment facility.
• Lack of confidence in treatment was another reason that respondents gave for
not wanting to access treatment services.
Recommendation 6.4: The perception that treatment would not be helpful needs to be corrected. One way of changing this perception is by educating the public on the empirically-supported treatment that is available, and on the well-trained staff that offer the treatment etc. Accurately assessing and communicating treatment outcomes might also help to change perceptions.
7. Motivations for Gambling / Early Gambling Experiences / Family History • The majority of gamblers, regardless of gambling status reported that they
gambled to have fun or to win money. Participants with a gambling problem seem to be more likely to gamble as a distraction and to be alone.
• Gambling-related television programs such as the World Series of Poker and
Texas Holdem tournaments are popular. These television programs provide pro-gambling messages that reach a wide audience, including children and adolescents. They also reach those at risk for developing a gambling problem, and problem gamblers, two groups that may be particularly vulnerable to experiencing urges to gamble in relation to these programs, which in turn can lead to actual gambling behaviour.
Recommendation 7.1: To counteract the pro-gambling messages delivered by these programs it is recommended that televised responsible gambling messages be delivered as well. Parents and others caring for children and teens need to be made aware that these programs can promote gambling behaviour. One way to moderate the negative impact of these programs is to use the programs as a starting point of a discussion about problem gambling.
Gambling and Problem Gambling in Prince Edward Island February 2006
Doiron 73
• Participants with a gambling problem reported that they started gambling at an earlier age than non-problem gambling participants. Twenty-five percent of the problem gambling group reported gambling for the first time between the ages of 6 and 10 years; 18.8 percent of this group reported gambling for the first time between the ages of 11 and 15. Participants with a gambling problem reported bingo (25%), cards with friends / family (31.3%), and lottery (12.5%) as the gambling activity that they first engaged in.
Recommendation 7.2: Development of new legislation and intensified enforcement of existing legislation related to prohibiting of gambling among minors is recommended. It is also important that organizers of gambling-related charities (e.g., bingo, “casino nights” etc.) play a role in preventing children from participating in these activities.
• Participants with a gambling problem were significantly more likely to report
having a family member with a gambling problem than non-problem gambling participants.
Recommendation 7.3: A range of interventions (from education / prevention through to treatment) should be available so that at-risk groups (such as children of problem gamblers) can be reached.
Gambling and Problem Gambling in Prince Edward Island February 2006
Doiron 74
REFERENCES Atlantic Lottery Corporation (2005). Making a difference: 2004-05 annual report.
Author: Moncton. Breen, R.B., & Zimmerman, M. (2002). Rapid onset of pathological gambling in
machine gamblers. Journal of Gambling Studies, 18, 31-43. Cox, B., Yu, N., Afifi, T., & Ladouceur, R. (2005). A national survey of gambling
problems in Canada. Canadian Journal of Psychiatry, 50, 213-217. Doiron, J.P. & Nicki, R.M. (2001). The epidemiology of problem gambling in Prince
Edward Island: A Canadian microcosm? Canadian Journal of Psychiatry, 46, 413-417.
Ferris, J., & Wynne, H. (2001). The Canadian Problem Gambling Index draft user
manual. Toronto: Canadian Centre on Substance Abuse. Hodgins, D. C., Currie, S. R. & el-Guebaly, N. (2001). Motivational enhancement and
self-help treatments for problem gambling. Journal of Consulting and Clinical Psychology, 69, 50-57.
Lesieur, H., & Blume, S. (1987). The South Oaks Gambling Screen (SOGS): A new
instrument for the identification of pathological gamblers. American Journal of Psychiatry, 144, 1184-1188.
Morgan, T., Kofoed, L., Buchkoski, J., & Carr, R.D. (1996). Video lottery gambling:
Effects on pathological gamblers seeking treatment in South Dakota. Journal of Gambling Studies, 12, 451-460.
Sperry, E.A. (2001). Prince Edward Island community mobile gambling addiction
program facilitator’s manual. Author: Halifax. Statistics Canada (2003). Perspectives on labour and income: The online edition
(volume 4). Author: Ottawa. Wiebe, J., Single, E., & Falkowski-Ham, A. (2001). Measuring gambling and problem
gambling in Ontario. Ontario: Canadian Centre on Substance Abuse / Responsible Gambling Council (Ontario).
Gambling and Problem Gambling in Prince Edward Island February 2006
Doiron 75
Appendix 1. INTRODUCTION Hello, my name is __________________ and I am calling on behalf of the P.E.I. Department of Health. Have I dialled (repeat the telephone number)? We are conducting a research survey on the gambling activities and attitudes of P.E.I. residents and we would like to include your views. Your response will help researchers better understand gambling behaviour and develop programs and services for Islanders with a gambling problem. Your household is one of 1000 being randomly surveyed throughout P.E.I. First of all, can you tell me how many adults 18 years or older live in this household? (Record the number).
99. Refused (Terminate call and thank them for their time) INTERVIEWER: If no one 18 or older in household, terminate interview. If only one person 18 years or older in household say: I would like to speak to that person--would that be you? INTERVIEWER: If more than one person 18 years or older in household say: I would like to speak to the person in your household 18 years or older who has the next birthday--would that be you? INTERVIEWER: If no, ask to speak to that person. If the person is not available, arrange call-back. Great! I would like to interview you and I’m hoping that now is a good time for you. The interview will take about 15 minutes, depending on how many of the questions apply to you. Before we start, I’d like to assure you that your participation is voluntary and that any information you provide will be kept completely confidential. If there are any questions that you do not wish to answer, please feel free to point these out to me and I’ll go on to the next question. You have the right to terminate the interview at any time.
Gambling and Problem Gambling in Prince Edward Island February 2006
Doiron 76
If you have any questions about the survey, you can phone the Study Supervisor in Charlottetown at (902) 368-6714 (call collect) for further information. INTERVIEWER: If the person never gambles, doesn’t believe in it, etc. say: We understand that not everyone gambles, but your opinions are still very important to us. 1. Agreed to do interview (Thank them and go to Q.1) 2. Refused to do interview (Terminate and thank them for
their time) II. GAMBLING INVOLVEMENT First, we’d like to ask some questions about gambling activities you may participate in. People spend money and gamble on many different things including buying lottery tickets, playing bingo, or card games with their friends. I am going to list some activities that you might have bet money on. 1. In the past 12 months, have you bet or spent money on (______________)?
(Read list). 1. Lottery tickets (e.g. 649, Super 7, POGO) 2. Daily lottery tickets (e.g. Pick 3) 3. Instant-win or scratch tickets (e.g. break-open, pull-tab, Nevada strips) 4. Raffles or fundraising tickets
5. Bingo 6. Cards or board games with family or friends for money 7. Video lottery terminals (VLTs) in a bar or restaurant lounge
8. Casino slot machines 9. Arcade or video games for money
10. Gambling on the Internet 11. Sport Select (e.g. Pro Line, Over/Under, Point Spread)
12. Sports pools [formal (e.g. charity-sponsored) or informal (e.g. at work)] 13. Outcome of sporting events (i.e. other than sports pool or Sports Select) 14. Sports with a bookie 15. Horse races (i.e. live at track and/or off-track) 16. Games at casinos [i.e. other than coin slots or VLTs (e.g. poker, blackjack,
roulette)] 17. Stocks, options, commodities markets (i.e. not mutual funds or RRSPs) 18. Games of skill for money (e.g. pool, golf, bowling, darts) 19. Card games in non-regulated settings other than with family/friends (e.g.
card rooms)
Gambling and Problem Gambling in Prince Edward Island February 2006
Doiron 77
20. Any other form of gambling (____________specify) <1> Yes <2> No <98> Don’t know <99> Refused INTERVIEWER: If respondent does not say “Yes” to any activity, go to Q28. INTERVIEWER: Repeat Q2 to Q7 for all activities selected in Q1 2. In the past 12 months, how often did you bet or spend money on
___________________? (Name activity from Q1) <1> Daily
<2> 2 to 6 times/week <3> About once/week <4> 2-3 times/month <5> About once/month <6> Between 6-11 times/year <7> Between 1-5 times/year <8> never
<98> Don't know <99> Refused
3. In the past 12 months, how many minutes or hours did you normally spend each
time betting or spending money on ___________________? (Name activity from Q1)
<1-480> Enter number of MINUTES <481> more than 8 hours <998> Don't know
<999> refused INTERVIEWER: Enter EXACT # of MINUTES here please. DO NOT ROUND! 4. In the past 12 months, how much money, not including winnings, did you spend
on ___________________ (Name activity from Q1) in a typical month? <N> enter number of dollars <9998> don't know
<9999> refused
Gambling and Problem Gambling in Prince Edward Island February 2006
Doiron 78
INTERVIEWER: If asked for clarification, we mean spending that is out of pocket, and doesn't include money won and THEN spent.
5. In the past 12 months, what is the largest amount of money you ever spent on
________________ (Name activity from Q1) in any one day? <N> enter number of dollars <9998> don't know
<9999> refused 6. When you spend money on __________________ (Name activity from Q1) who
do you participate or go with? (Read to prompt if necessary. If more than one response, choose #6 and input all answers).
<1> Alone <2> With spouse or partner <3> With other family members <4> With friends or co-workers, or <5> With some other individual or group (Specify)______________________ <98> Don’t know <99> Refused 7. What are the main reasons why you participate in _____________________?
(Name activity from Q1) (Read to prompt ONLY if necessary. If more than one answer, choose #12 and input all answers).
<1> In order to do things with your friends <2> For excitement or as a challenge <3> As a hobby <4> To win money <5> To support worthy causes <6> Out of curiosity <7> For entertainment or fun <8> To distract yourself from everyday problems <9> Because you’re good at it <10> To be alone <11> For some other reason (Specify) ___________________________ <98> Don’t know <99> Refused
Gambling and Problem Gambling in Prince Edward Island February 2006
Doiron 79
III. PROBLEM GAMBLING BEHAVIOUR AND ADVERSE CONSEQUENCES
The next questions are part of a standard measurement scale that was recently developed in Canada for use in gambling surveys similar to this one. Some of these questions may not apply to you but please try to answer as accurately as possible. Remember that all your answers are strictly confidential. Thinking about the past 12 months, how often… 8. Have you bet more than you could really afford to lose?
Would you say: <1> Never <2> Sometimes <3> Most of the time <4> Almost always <98> Don't know <99> Refused
9. Have you needed to gamble with larger amounts of money to get the same feeling
of excitement? <1> Never <2> Sometimes <3> Most of the time <4> Almost always <98> Don't know <99> Refused
10. Have you gone back another day to try to win back the money you lost?
<1> Never <2> Sometimes <3> Most of the time <4> Almost always <98> Don't know <99> Refused
11. Have you borrowed money or sold anything to get money to gamble?
<1> Never <2> Sometimes <3> Most of the time <4> Almost always <98> Don't know <99> Refused
12. Have you felt that you might have a problem with gambling?
<1> Never <2> Sometimes <3> Most of the time
Gambling and Problem Gambling in Prince Edward Island February 2006
Doiron 80
<4> Almost always <98> Don't know <99> Refused
13. Have people criticized your betting or told you that you had a gambling problem, regardless of whether or not you thought it was true?
<1> Never <2> Sometimes <3> Most of the time <4> Almost always <98> Don't know <99> Refused
14. Have you ever felt guilty about the way you gamble, or what happens when you gamble?
<1> Never <2> Sometimes <3> Most of the time <4> Almost always <98> Don't know <99> Refused
15. Has gambling caused you any health problems, including stress or anxiety? <1> Never <2> Sometimes <3> Most of the time <4> Almost always <98> Don't know <99> Refused
16. Has your gambling caused any financial problems for you or your household? <1> Never <2> Sometimes <3> Most of the time <4> Almost always <98> Don't know <99> Refused
17. Have you felt like you would like to stop betting money or gambling but you
didn't think you could? <1> Never <2> Sometimes <3> Most of the time <4> Almost always <98> Don't know <99> Refused
Gambling and Problem Gambling in Prince Edward Island February 2006
Doiron 81
18. Have you hidden betting slips, lottery tickets, gambling money, IOUs or other
signs of betting or gambling from your partner, children or other important people in your life?
<1> Never <2> Sometimes <3> Most of the time <4> Almost always <98> Don't know <99> Refused
19. Have you gambled as a way of escaping problems or to help you feel better when you were depressed?
<1> Never <2> Sometimes <3> Most of the time <4> Almost always <98> Don't know <99> Refused
20. Have you lied to family members or others to hide your gambling?
<1> Never <2> Sometimes <3> Most of the time <4> Almost always <98> Don't know <99> Refused
21. Have you bet or spent more money than you wanted to on gambling?
<1> Never <2> Sometimes <3> Most of the time <4> Almost always <98> Don't know <99> Refused
22. Have you tried to quit, or cut down on your gambling but were unable to do it?
<1> Never <2> Sometimes <3> Most of the time <4> Almost always <98> Don't know <99> Refused
Gambling and Problem Gambling in Prince Edward Island February 2006
Doiron 82
23. Have you had difficulty sleeping because of your gambling? <1> Never <2> Sometimes <3> Most of the time <4> Almost always <98> Don't know <99> Refused
24. Have you felt irritable or restless when you tried to cut down or stop gambling for a while?
<1> Never <2> Sometimes <3> Most of the time <4> Almost always <98> Don't know <99> Refused
25. Has your gambling caused any problems between you and any of your family
members or friends? <1> Never <2> Sometimes <3> Most of the time <4> Almost always <98> Don't know <99> Refused
26. Have you stolen anything or done anything else illegal such as write bad cheques
so that you could have money to gamble? <1> Never <2> Sometimes <3> Most of the time <4> Almost always <98> Don't know <99> Refused
27. Have you almost lost a relationship, a job, or an educational or career opportunity
because of your gambling? <1> Never <2> Sometimes <3> Most of the time <4> Almost always <98> Don't know <99> Refused
Gambling and Problem Gambling in Prince Edward Island February 2006
Doiron 83
IV. PROBLEM GAMBLING CORRELATES The next questions explore some of your gambling experiences, beliefs, alcohol and drug use, and health-related issues. Once again, all your answers will be kept strictly confidential. 28. How old were you when you first gambled for money? (If “never tried
gambling,” SKIP to Q32) <1> Never tried gambling <5> five years of age or younger <N> enter age in years <98> Don't Know <99> Refused 29. What type of gambling was that? 1. Lottery tickets (e.g. 649, Super 7, POGO) 2. Daily lottery tickets (e.g. Pick 3) 3. Instant-win or scratch tickets (e.g. break-open, pull-tab, Nevada strips) 4. Raffles or fundraising tickets
5. Bingo 6. Cards or board games with family or friends for money 7. Video lottery terminals (VLTs) in a bar or restaurant lounge
8. Casino slot machines 9. Arcade or video games for money
10. Gambling on the Internet 11. Sport Select (e.g. Pro Line, Over/Under, Point Spread)
12. Sports pools [formal (e.g. charity-sponsored) or informal (e.g. at work)] 13. Outcome of sporting events (i.e. other than sports pool or Sports Select) 14. Sports with a bookie 15. Horse races (i.e. live at track and/or off-track) 16. Games at casinos [i.e. other than coin slots or VLTs (e.g. poker, blackjack,
roulette)] 17. Stocks, options, commodities markets (i.e. not mutual funds or RRSPs) 18. Games of skill for money (e.g. pool, golf, bowling, darts) 19. Card games in non-regulated settings other than with family/friends (e.g.
card rooms) 20. Any other form of gambling (____________specify)
<1> Yes <2> No <98> Don’t know <99> Refused
Gambling and Problem Gambling in Prince Edward Island February 2006
Doiron 84
30. Do you remember a big WIN when you first started gambling? <1> Yes <2> No <98> Don’t know <99> Refused
31. Do you remember a big LOSS when you first started gambling? <1> Yes <2> No <98> Don’t know <99> Refused
32. Please tell me if you strongly agree, agree, disagree, or strongly disagree with the
following statement: “While gambling, after losing many times in a row, you are more likely to win.”
<1> Strongly agree <2> Agree <3> Disagree <4> Strongly disagree <98> Don’t know <99> Refused
33. Please tell me if you strongly agree, agree, disagree, or strongly disagree with the
following statement: “While gambling, you could win more if you used a certain system or strategy.”
<1> Strongly agree <2> Agree <3> Disagree <4> Strongly disagree <98> Don’t know <99> Refused
34. Has anyone in your family EVER had a gambling problem? <1> yes <2> no <98> Don't know
<99> Refused
35. Has anyone in your family EVER had an alcohol or drug problem? <1> yes <2> no <98> Don't know
<99> Refused
Gambling and Problem Gambling in Prince Edward Island February 2006
Doiron 85
36. IN THE PAST 12 MONTHS, have you used alcohol or drugs while gambling?
(Skip if NEVER gambled) <1> yes <2> no <98> Don't know
<99> Refused 37. IN THE PAST 12 MONTHS, have you gambled when drunk or high? (Skip if
NEVER gambled) <1> yes <2> no <98> Don't know
<99> Refused 38. IN THE PAST 12 MONTHS, have you felt you might have an alcohol or drug
problem? <1> yes <2> no <98> Don't know
<99> Refused 39. IN THE PAST 12 MONTHS, if something painful happened in your life, did you
have the urge to gamble? <1> yes (includes doing as well as having the urge) <2> no <98> Don't know
<99> Refused 40. IN THE PAST 12 MONTHS, if something painful happened in your life, did you
have the urge to have a drink? <1> yes (includes doing as well as having the urge) <2> no <98> Don't know
<99> Refused 41. IN THE PAST 12 MONTHS, if something painful happened in your life, did you
have the urge to use drugs? <1> yes (includes doing as well as having the urge) <2> no <98> Don't know
<99> Refused
Gambling and Problem Gambling in Prince Edward Island February 2006
Doiron 86
42. STILL THINKING ABOUT THE PAST 12 MONTHS, have you been under a doctor’s care because of physical or emotional problems brought on by stress?
<1> yes <2> no <98> Don't know
<99> Refused 43. IN THE PAST 12 MONTHS, was there ever a time when you felt sad, blue, or
depressed for two weeks or more in a row? (If NO, SKIP to 45) <1> yes <2> no <98> Don't know
<99> Refused
44. During this time, did you take medication or antidepressants for your depression? <1> yes
<2> no <98> Don't know <99> Refused
45. IN THE PAST 12 MONTHS, have you seriously thought about committing
suicide? <1> yes <5> no <98> Don't know <99> Refused
46. During this time, have you ever attempted suicide? <1> yes <2> no <98> Don't know <99> Refused
47. Were these suicidal thoughts or attempts related to your gambling? (Do not ask if
NO response to both Q45 and Q46) <1> yes <2> no <98> Don't know <99> Refused
Gambling and Problem Gambling in Prince Edward Island February 2006
Doiron 87
48. THE PAST 12 MONTHS, have you watched gambling events on television (e.g., World Series of Poker”; “Texas Holdem”)? (If NO Skip questions 49 & 50)
<1> yes <2> no <98> Don't know <99> Refused
49. Did watching these events on television give you the urge to gamble yourself? (If
NO Skip question 50) <1> yes <2> no <98> Don't know <99> Refused
50. Did this urge to gamble lead you to actually gamble?
<1> yes <2> no <98> Don't know <99> Refused
51. Are you aware of problem gambling treatment services available in P.E.I.?
<1> yes <2> no <98> Don't know <99> Refused
52. If you thought you had a gambling problem would you know how to access
treatment services in P.E.I.?
<1> yes <2> no <98> Don't know <99> Refused
53. If you thought you had a gambling problem, would you attempt to access treatment services in P.E.I.? (If NO ask question 54).
<1> yes <2> no <98> Don't know <99> Refused
54. What are some reasons that you would not attempt to access treatment services in
P.E.I.? (List all verbatim)
Gambling and Problem Gambling in Prince Edward Island February 2006
Doiron 88
DEMOGRAPHICS
Finally, we would like to ask you some basic background questions. Like all your other answers, this information will be kept strictly confidential. 55. In what year were you born? <________> Enter year <9998> don’t know <9999> Refused
56. What is your marital status? <1> Single (never married) <2> Married <3> Common-law <4> Divorced or separated <5> Widowed <98> Don’t know <99> Refused 57. What is the highest level of education you have completed?
<1> No schooling <2> Some elementary school <3> Completed elementary school <4> Some high school/junior high <5> Completed high school <6> Some community college <7> Some technical school <8> Completed community college (certificate, diploma) <9> Completed technical school (certificate, diploma) <10> Some University <11> Completed Bachelor's Degree (Arts, Science, Engineering) <12> Completed Master's degree: (MA, MSc, MLS, MSW) <13> Completed Doctoral Degree: (PhD, EdD) <14> Professional Degree (Law, Medicine, Dentistry) <98> Don't know
<99> Refused 58. Which racial or ethnic group do you consider yourself to be a member of? If you have
multiple racial/ethnic origins, please select the one with which you identify most. (Read from the list to prompt if necessary).
Gambling and Problem Gambling in Prince Edward Island February 2006
Doiron 89
Aboriginal ..............00.........(1st Nation, Metis, Inuit) Austrian..................01 Indonesian ..............21 Scottish...................41 Black ......................02 Iranian ....................22 Serbian ...................42 Belgian ...................03 Irish ........................23 Slovakian................43 Bohemian ...............04 Italian .....................24 Spanish...................44 Bulgarian................05 Jamaican.................25 Swedish ..................45 Chilean ...................06 Japanese .................26 Trinidian.................46 Chinese...................07 Jewish.....................27 Tobagan..................47 Croatian..................08 Korean ...................28 Ukranian.................48 Czech......................09 Laotian ..................29 Vietnamese.............49 Danish ....................10 Latvian ...................30 Welsh .....................50 Dutch......................11 Lebanese ................31 West Indian ............51 East Indian .............12 Mennonite ..............32 Yugoslavian ...........52 English ...................13 Norwegian..............33 Other ___________53 (Specify) Filipino/a ................14 Pakistani.................34 Finnish....................15 Peruvian .................35 French ....................16 Polish......................36 German...................17 Romanian ...............37 Greek......................18 Russian...................38 Hungarian...............19 Salvadorian ............39 Icelandic.................20 Scandinavian ..........40 .......<98> ...Don’t know .......<99> ...Refused
59. What is your present job status? Are you employed full-time, employed part-
time, unemployed, a student, retired or a homemaker? <1> Employed full-time (30 or more hrs/week) [go to 60]
<2> Employed part-time (less than 30hrs/week) [go to 60] <3> Unemployed (out of work but looking for work) [go to 60] <4> Student--employed part-time or full-time [go to 60] <5> Student--not employed [go to 61] <6> Retired [go to 61] <7> Homemaker [go to 61] <0> Other (Specify) [go to 60] <98> Don't know [go to 61] <99> Refused [go to 61]
INTERVIEWER: If respondent says “Canadian” or “American,” say: “Most Canadians/Americans have some other racial or ethnic origin, even if it is from many generations ago. Thinking about this, would you say you are: (refer to list again putting “Canadian” or “American” after each response (e.g. Chinese-Canadian).
Gambling and Problem Gambling in Prince Edward Island February 2006
Doiron 90
INTERVIEWER: If respondent gives more than one answer, record the one that appears first on the list. 60. What type of work do you currently do (or, do you do when you are employed)?
<________________> Specify <98> Don't know
<99> Refused INTERVIEWER: If necessary, say "what is your job title?" 61. How many people under 18 years-of-age live with you?
<0> None <1-6> enter number of people <7> seven or more <98> don't know
<99> refused 62. Are you male or female? (Do not ask UNLESS unsure)
<1> Male <2> Female
63. Which of the following categories best describes your total household income in
the last 12 months? That’s the combined income before taxes and from all
sources for all persons in your household. (If “farm/self employed,” record
amount after deducting operating expenses). Is it ...
<1> less than $20,000 <2> between $20,000 and $30,000 ($29,999.99) <3> between $30,000 and $40,000 <4> between $40,000 and $50,000 <5> between $50,000 and $60,000 <6> between $60,000 and $70,000 <7> between $70,000 and $80,000 <8> between $80,000 and $90,000 <9> between $90,000 and $100,000 <10> between $100,000 and $120,000 <11> between $120,000 and $150,000, <12> or more than $150,000? <98> Don't know
Gambling and Problem Gambling in Prince Edward Island February 2006
Doiron 91
<99> Refused
VI. COMPLETION INFORMATION
64. This ends our survey. In the event that my supervisor wishes to verify this
interview, may I please have your first name? (Record last name if offered).
<1> _____________First name <2> _____________Last name
65. We may conduct gambling research that is a follow-up to this study and to do this,
we may wish to speak to some people again. May we call you for a short follow up interview? Once again, any information you provide in a future related study will be kept strictly confidential.
<1> Yes <2> No/Refused
66. Is there another phone number where you can be reached?
<1> record phone number
Thank you for helping us with this survey. Your responses are very important to us, and we do appreciate the time it has taken to answer our questions.
TO BE COMPLETED BY THE INTERVIEWER: Please record the length of the interview in minutes______________________ Please enter the respondents sex as a verification check <1> Male <2> Female Please note anything about the respondent or the interview situation that seems important to interpreting the information given.__________________________
INTERVIEWER DECLARATION: I declare that this interview was conducted in accordance with the interviewing and sampling instructions given by Prairie Research Associates. I agree that the information given by the respondent will be kept confidential.