Embed Size (px)
Citation preview
MNRAS 449, 4277–4287 (2015) doi:10.1093/mnras/stv589
Galaxy And Mass Assembly (GAMA) blended spectra catalogue: stronggalaxy–galaxy lens and occulting galaxy pair candidates
B. W. Holwerda,1‹ I. K. Baldry,2 M. Alpaslan,3 A. Bauer,4 J. Bland-Hawthorn,5
S. Brough,4 M. J. I. Brown,6 M. E. Cluver,7 C. Conselice,8 S. P. Driver,9,10
A. M. Hopkins,4 D. H. Jones,11 A. R. Lopez-Sanchez,4,11 J. Loveday,12 M. J. Meyer9
and A. Moffett91University of Leiden, Sterrenwacht Leiden, Niels Bohrweg 2, NL-2333 CA Leiden, the Netherlands2Astrophysics Research Institute, Liverpool John Moores University, IC2, Liverpool Science Park, 146 Brownlow Hill, Liverpool L3 5RF, UK3NASA Ames Research Centre, N232, Moffett Field, Mountain View, CA 94034, USA4Australian Astronomical Observatory, 105 Delhi Rd, North Ryde, NSW 2113, Australia5Sydney Institute for Astronomy, School of Physics A28, University of Sydney, NSW 2006, Australia6School of Physics, Monash University, Clayton, Vic 3800, Australia7Department of Physics, University of the Western Cape, Robert Sobukwe Road, Bellville 7530, South Africa8University of Nottingham, School of Physics & Astronomy, Nottingham NG7 2RD, UK9ICRAR M468, University of Western Australia, 35 Stirling Hwy, Crawley, WA 6009, Australia10School of Physics & Astronomy, University of St Andrews, North Haugh, St Andrews KY16 9SS, Scotland11Department of Physics and Astronomy, Macquarie University, NSW 2109, Australia12Astronomy Centre, University of Sussex, Falmer, Brighton BN1 9QH, UK
Accepted 2015 March 16. Received 2015 March 16; in original form 2014 December 17
ABSTRACTWe present the catalogue of blended galaxy spectra from the Galaxy And Mass Assembly(GAMA) survey. These are cases where light from two galaxies are significantly detectedin a single GAMA fibre. Galaxy pairs identified from their blended spectrum fall into twoprincipal classes: they are either strong lenses, a passive galaxy lensing an emission-linegalaxy; or occulting galaxies, serendipitous overlaps of two galaxies, of any type. Blendedspectra can thus be used to reliably identify strong lenses for follow-up observations (high-resolution imaging) and occulting pairs, especially those that are a late-type partly obscuringan early-type galaxy which are of interest for the study of dust content of spiral and irregulargalaxies. The GAMA survey setup and its AUTOZ automated redshift determination were usedto identify candidate blended galaxy spectra from the cross-correlation peaks. We identify 280blended spectra with a minimum velocity separation of 600 km s−1, of which 104 are lens paircandidates, 71 emission-line-passive pairs, 78 are pairs of emission-line galaxies and 27 arepairs of galaxies with passive spectra. We have visually inspected the candidates in the SloanDigital Sky Survey (SDSS) and Kilo Degree Survey (KiDS) images. Many blended objectsare ellipticals with blue fuzz (Ef in our classification). These latter ‘Ef’ classifications arecandidates for possible strong lenses, massive ellipticals with an emission-line galaxy in oneor more lensed images. The GAMA lens and occulting galaxy candidate samples are similar insize to those identified in the entire SDSS. This blended spectrum sample stands as a testamentof the power of this highly complete, second-largest spectroscopic survey in existence andoffers the possibility to expand e.g. strong gravitational lens surveys.
Key words: gravitational lensing: strong – catalogues – dust, extinction – galaxies: distancesand redshifts – galaxies: statistics.
� E-mail: [email protected]
1 IN T RO D U C T I O N
Interstellar dust is still a dominant astrophysical unknown in cos-mological distance estimates (Albrecht et al. 2006; Holwerda 2008;Holwerda et al. 2014) and models of how starlight is re-processed
C© 2015 The AuthorsPublished by Oxford University Press on behalf of the Royal Astronomical Society
4278 B. W. Holwerda et al.
within a galaxy (e.g. Baes et al. 2010; Bianchi & Xilouris 2011;Popescu et al. 2011; de Looze et al. 2012; Holwerda et al. 2012)because some 10–30 per cent of all the starlight is re-emitted by thedust in the far-infrared (Popescu et al. 2000). Interstellar dust canbe found in two ways; by its emission or through the extinction ofstellar light.
Characterization of emission has made great strides with theSpitzer and Herschel Space Observatories (e.g. Hinz et al. 2009,2012; Bendo et al. 2012, 2015; Baes et al. 2010; Smith et al. 2010;Galametz et al. 2012; Xilouris et al. 2012; Verstappen et al. 2013;Draine et al. 2014; Hughes et al. 2014, 2015). A library of far-infrared and sub-mm images of nearby galaxies is currently be-ing collated and more insight into the physics and distributionof interstellar dust in nearby galaxies can be expected with thegreat improvements in spectral coverage, sensitivity and spatialresolution.
Extinction measures of dust have some specific advantages overemission; they do not depend on the dust temperature, allowing forthe detection of much colder dusty structures, and typically havethe high resolution of the optical imaging observations. The singledrawback is that one needs a known background light source. In thecase of the transparency of spiral galaxies, two techniques have justsuch a proven background source: background galaxies counts andocculting galaxy pairs. The technique that uses the number of back-ground galaxies (Gonzalez et al. 1998, 2003; Cuillandre et al. 2001;Holwerda 2005; Holwerda et al. 2005a,b,c,e,d, 2007b,a, 2013) isnearing obsolescence as its inherent resolution and accuracy, lim-ited by the intrinsic cosmic variance of background sources, arenow surpassed by the accuracy and sensitivity of Herschel SpaceObservatory observations of dust surface density in nearby galaxies.
The occulting galaxies technique, however, has increased steadilyin accuracy and usefulness, owing in a large part to the increasingsample sizes. Estimating dust extinction and mass from differen-tial photometry in occulting pairs of galaxies was first proposedby White & Keel (1992). Their technique was then applied to allknown pairs using ground-based optical images (Andredakis &van der Kruit 1992; Berlind et al. 1997; Domingue et al. 1999;White, Keel & Conselice 2000) and spectroscopy (Domingue, Keel& White 2000). Subsequently, some pairs were imaged with theHubble Space Telescope (HST; Elmegreen et al. 2001; Keel &White 2001a,b; Holwerda et al. 2009; Holwerda & Keel 2013).These initial results, however, were limited by sample sizes (∼15pairs). More recently, new pairs were found in the Sloan DigitalSky Survey (SDSS) spectroscopic catalogue (86 pairs in Holwerda,Keel & Bolton 2007c) and through the GalaxyZOO project (Lintottet al. 2008); 1993 pairs reported in Keel et al. (2013). This wealthof new pairs provided opportunities for follow-up with IFU obser-vations (Holwerda & Keel 2013; Holwerda et al. 2013) and GALEX(Keel et al. 2014). A greatly expanded occulting galaxy catalogueimproves accuracy as ‘ideal pairs’ – an elliptical partially occultedby a late-type galaxy – can be selected for follow-up. Ellipticals arethe optimal background source as their light profile is smooth andvery symmetric.1
Results from the occulting galaxy pairs include: (1) a mean ex-tinction profile (Domingue et al. 2000; White et al. 2000; Holwerdaet al. 2007c), (2) an indication that the dust may be fractal (Keel &White 2001a) and (3) the observation that the colour-extinction re-lation is grey, i.e. there is little or no relation between the reddening
1 The one exception is where we attempt to measure blue light attenuation.In this case, a spiral galaxy, which is brighter in the blue, is preferred.
of the stellar populations and total extinction. The latter is due to thecoarse physical sampling of ground-based observations. The Galac-tic extinction law returns as soon as the physical sampling of theoverlap region resolves the molecular clouds in the foreground disc(<100 pc Elmegreen et al. 2001; Keel & White 2001a,b; Holwerdaet al. 2009).
A very reliable way to identify occulting galaxy pairs, i.e. purelyserendipitous overlaps of galaxies is through blended spectra. InHolwerda et al. (2007c), we used the rejects from the Strong Lenseswith ACS Survey (SLACS; Bolton et al. 2004, 2006), a highlysuccessful search for strong lenses, confirmed with HST (Koopmanset al. 2006; Treu et al. 2006, 2009; Gavazzi et al. 2007, 2008; Boltonet al. 2008a,b), with spectroscopic selection extended now to theBOSS survey (Bolton et al. 2012; Brownstein et al. 2012). Bothtypes of blended spectral sources have two things in common, veryclose association on the sky (within an SDSS spectroscopic fibre of3 arcsec diameter) and clear spectroscopic signal from both galaxiesat distinct redshifts.
In this paper, we present the blended spectra catalogue basedon the Galaxy And Mass Assembly (GAMA) survey (Driver et al.2009, 2011; Baldry et al. 2010) as candidates for either stronglensing follow-up or occulting galaxy analysis (e.g. HST imagingor spectroscopy). The GAMA data is an improvement over SDSSas the target galaxies can be fainter, the aperture is smaller (i.e. acloser overlap of the galaxies) and the AUTOZ detection algorithmis a marked improvement on the SDSS detections. The paper isorganized as follows. Section 2 briefly introduces the GAMA sur-vey, Section 3 the redshift determination and selection of blendedspectra, Section 4 presents the visual classifications of the blendedobjects, Section 5 presents the blended spectra catalogue and wediscuss the pair classification and their possible future uses inSection 6.
2 G A M A SU RV E Y
The GAMA survey has obtained over 250 000 galaxy redshifts se-lected to r < 19.8 mag over 290 deg2 of sky (Driver et al. 2009,2011; Baldry et al. 2010; Liske 2015). At the heart of this survey isthe redshift survey with the upgraded 2dF spectrograph AAOmega(Saunders et al. 2006; Sharp et al. 2006) on the Anglo-AustralianTelescope. The GAMA survey extends over three equatorial surveyregions of 60 deg2 each (called G09, G12 and G15) and two South-ern regions of similar area (G02, G23). See Baldry et al. (2010) for adetailed description of the GAMA input catalogue for the equatorialregions.
The redshift survey in combination with a wealth of imagingdata has led to many science results already. We use for this workthe GAMA II redshifts (Liske 2015), which were obtained using arobust cross-correlation method for spectra with and without strongemission lines (Baldry et al. 2014).
3 SE L E C T I O N O F B L E N D E D SP E C T R A
Galaxy redshifts were initially determined by a supervised fit (Liske2015) but a recent upgrade to the GAMA survey pipeline includesa fully automated template-based redshift determination (AUTOZ;Baldry et al. 2014). In certain cases, the fits for different templatesresulted in two high fidelity, but different redshifts; these are thecandidate blended objects of interest to us here.
The AUTOZ code obtains cross-correlation redshifts against stellarand galaxy templates with varying strength of emission and absorp-tion line features. The height and position of the first four peaks
MNRAS 449, 4277–4287 (2015)
GAMA blended spectra catalogue 4279
R =
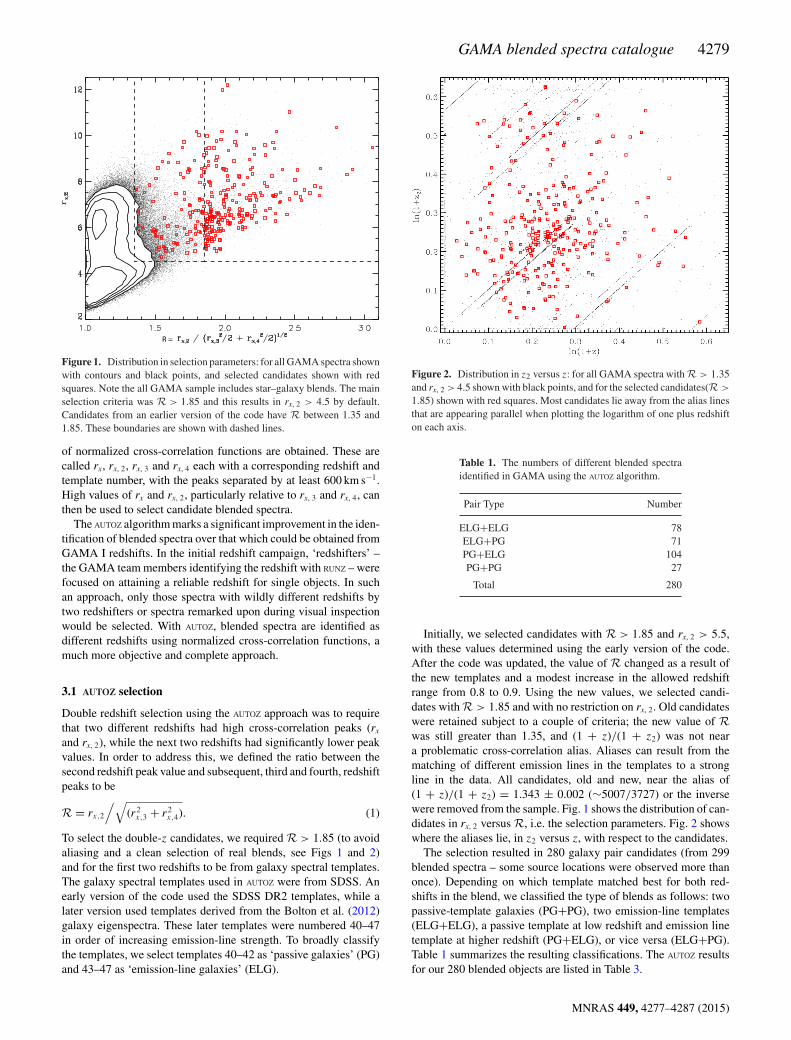
Figure 1. Distribution in selection parameters: for all GAMA spectra shownwith contours and black points, and selected candidates shown with redsquares. Note the all GAMA sample includes star–galaxy blends. The mainselection criteria was R > 1.85 and this results in rx, 2 > 4.5 by default.Candidates from an earlier version of the code have R between 1.35 and1.85. These boundaries are shown with dashed lines.
of normalized cross-correlation functions are obtained. These arecalled rx, rx, 2, rx, 3 and rx, 4 each with a corresponding redshift andtemplate number, with the peaks separated by at least 600 km s−1.High values of rx and rx, 2, particularly relative to rx, 3 and rx, 4, canthen be used to select candidate blended spectra.
The AUTOZ algorithm marks a significant improvement in the iden-tification of blended spectra over that which could be obtained fromGAMA I redshifts. In the initial redshift campaign, ‘redshifters’ –the GAMA team members identifying the redshift with RUNZ – werefocused on attaining a reliable redshift for single objects. In suchan approach, only those spectra with wildly different redshifts bytwo redshifters or spectra remarked upon during visual inspectionwould be selected. With AUTOZ, blended spectra are identified asdifferent redshifts using normalized cross-correlation functions, amuch more objective and complete approach.
3.1 AUTOZ selection
Double redshift selection using the AUTOZ approach was to requirethat two different redshifts had high cross-correlation peaks (rx
and rx, 2), while the next two redshifts had significantly lower peakvalues. In order to address this, we defined the ratio between thesecond redshift peak value and subsequent, third and fourth, redshiftpeaks to be
R = rx,2
/√(r2
x,3 + r2x,4). (1)
To select the double-z candidates, we required R > 1.85 (to avoidaliasing and a clean selection of real blends, see Figs 1 and 2)and for the first two redshifts to be from galaxy spectral templates.The galaxy spectral templates used in AUTOZ were from SDSS. Anearly version of the code used the SDSS DR2 templates, while alater version used templates derived from the Bolton et al. (2012)galaxy eigenspectra. These later templates were numbered 40–47in order of increasing emission-line strength. To broadly classifythe templates, we select templates 40–42 as ‘passive galaxies’ (PG)and 43–47 as ‘emission-line galaxies’ (ELG).
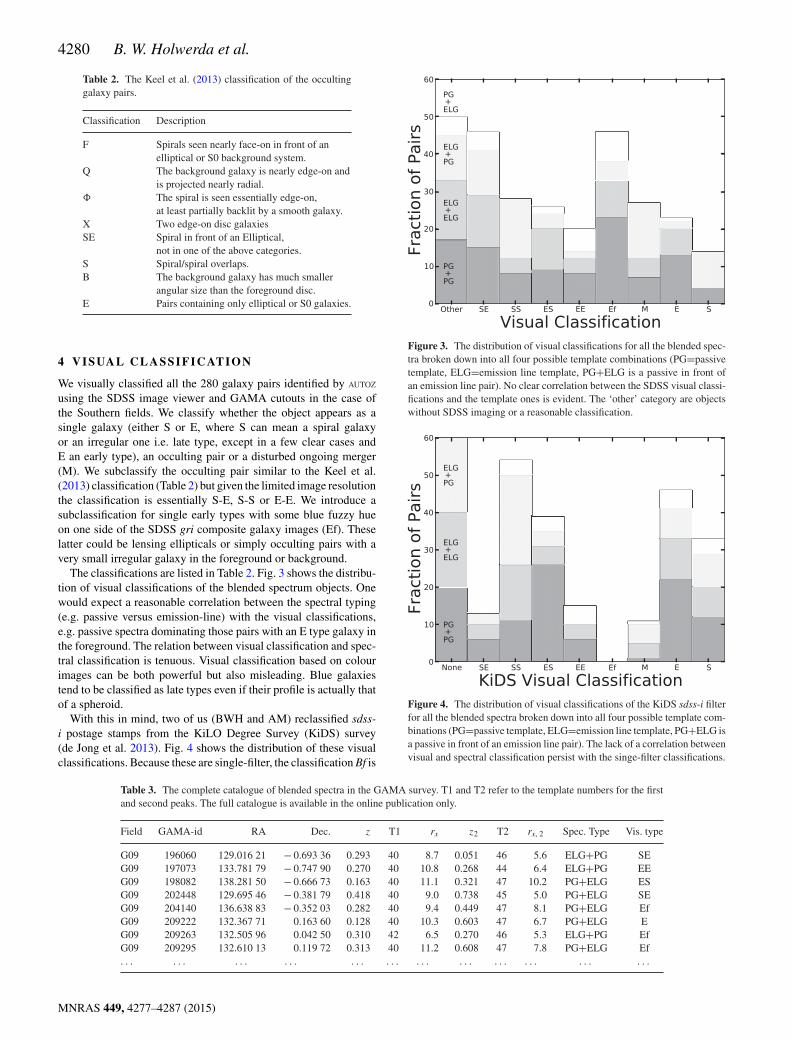
Figure 2. Distribution in z2 versus z: for all GAMA spectra with R > 1.35and rx, 2 > 4.5 shown with black points, and for the selected candidates(R >
1.85) shown with red squares. Most candidates lie away from the alias linesthat are appearing parallel when plotting the logarithm of one plus redshifton each axis.
Table 1. The numbers of different blended spectraidentified in GAMA using the AUTOZ algorithm.
Pair Type Number
ELG+ELG 78ELG+PG 71PG+ELG 104PG+PG 27
Total 280
Initially, we selected candidates with R > 1.85 and rx, 2 > 5.5,with these values determined using the early version of the code.After the code was updated, the value of R changed as a result ofthe new templates and a modest increase in the allowed redshiftrange from 0.8 to 0.9. Using the new values, we selected candi-dates with R > 1.85 and with no restriction on rx, 2. Old candidateswere retained subject to a couple of criteria; the new value of Rwas still greater than 1.35, and (1 + z)/(1 + z2) was not neara problematic cross-correlation alias. Aliases can result from thematching of different emission lines in the templates to a strongline in the data. All candidates, old and new, near the alias of(1 + z)/(1 + z2) = 1.343 ± 0.002 (∼5007/3727) or the inversewere removed from the sample. Fig. 1 shows the distribution of can-didates in rx, 2 versus R, i.e. the selection parameters. Fig. 2 showswhere the aliases lie, in z2 versus z, with respect to the candidates.
The selection resulted in 280 galaxy pair candidates (from 299blended spectra – some source locations were observed more thanonce). Depending on which template matched best for both red-shifts in the blend, we classified the type of blends as follows: twopassive-template galaxies (PG+PG), two emission-line templates(ELG+ELG), a passive template at low redshift and emission linetemplate at higher redshift (PG+ELG), or vice versa (ELG+PG).Table 1 summarizes the resulting classifications. The AUTOZ resultsfor our 280 blended objects are listed in Table 3.
MNRAS 449, 4277–4287 (2015)
4280 B. W. Holwerda et al.
Table 2. The Keel et al. (2013) classification of the occultinggalaxy pairs.
Classification Description
F Spirals seen nearly face-on in front of anelliptical or S0 background system.
Q The background galaxy is nearly edge-on andis projected nearly radial.
� The spiral is seen essentially edge-on,at least partially backlit by a smooth galaxy.
X Two edge-on disc galaxiesSE Spiral in front of an Elliptical,
not in one of the above categories.S Spiral/spiral overlaps.B The background galaxy has much smaller
angular size than the foreground disc.E Pairs containing only elliptical or S0 galaxies.
4 V ISUA L C LASSIFICATION
We visually classified all the 280 galaxy pairs identified by AUTOZ
using the SDSS image viewer and GAMA cutouts in the case ofthe Southern fields. We classify whether the object appears as asingle galaxy (either S or E, where S can mean a spiral galaxyor an irregular one i.e. late type, except in a few clear cases andE an early type), an occulting pair or a disturbed ongoing merger(M). We subclassify the occulting pair similar to the Keel et al.(2013) classification (Table 2) but given the limited image resolutionthe classification is essentially S-E, S-S or E-E. We introduce asubclassification for single early types with some blue fuzzy hueon one side of the SDSS gri composite galaxy images (Ef). Theselatter could be lensing ellipticals or simply occulting pairs with avery small irregular galaxy in the foreground or background.
The classifications are listed in Table 2. Fig. 3 shows the distribu-tion of visual classifications of the blended spectrum objects. Onewould expect a reasonable correlation between the spectral typing(e.g. passive versus emission-line) with the visual classifications,e.g. passive spectra dominating those pairs with an E type galaxy inthe foreground. The relation between visual classification and spec-tral classification is tenuous. Visual classification based on colourimages can be both powerful but also misleading. Blue galaxiestend to be classified as late types even if their profile is actually thatof a spheroid.
With this in mind, two of us (BWH and AM) reclassified sdss-i postage stamps from the KiLO Degree Survey (KiDS) survey(de Jong et al. 2013). Fig. 4 shows the distribution of these visualclassifications. Because these are single-filter, the classification Bf is
Figure 3. The distribution of visual classifications for all the blended spec-tra broken down into all four possible template combinations (PG=passivetemplate, ELG=emission line template, PG+ELG is a passive in front ofan emission line pair). No clear correlation between the SDSS visual classi-fications and the template ones is evident. The ‘other’ category are objectswithout SDSS imaging or a reasonable classification.
Figure 4. The distribution of visual classifications of the KiDS sdss-i filterfor all the blended spectra broken down into all four possible template com-binations (PG=passive template, ELG=emission line template, PG+ELG isa passive in front of an emission line pair). The lack of a correlation betweenvisual and spectral classification persist with the singe-filter classifications.
Table 3. The complete catalogue of blended spectra in the GAMA survey. T1 and T2 refer to the template numbers for the firstand second peaks. The full catalogue is available in the online publication only.
Field GAMA-id RA Dec. z T1 rx z2 T2 rx, 2 Spec. Type Vis. type
G09 196060 129.016 21 − 0.693 36 0.293 40 8.7 0.051 46 5.6 ELG+PG SEG09 197073 133.781 79 − 0.747 90 0.270 40 10.8 0.268 44 6.4 ELG+PG EEG09 198082 138.281 50 − 0.666 73 0.163 40 11.1 0.321 47 10.2 PG+ELG ESG09 202448 129.695 46 − 0.381 79 0.418 40 9.0 0.738 45 5.0 PG+ELG SEG09 204140 136.638 83 − 0.352 03 0.282 40 9.4 0.449 47 8.1 PG+ELG EfG09 209222 132.367 71 0.163 60 0.128 40 10.3 0.603 47 6.7 PG+ELG EG09 209263 132.505 96 0.042 50 0.310 42 6.5 0.270 46 5.3 ELG+PG EfG09 209295 132.610 13 0.119 72 0.313 40 11.2 0.608 47 7.8 PG+ELG Ef. . . . . . . . . . . . . . . . . . . . . . . . . . . . . . . . . . . .
MNRAS 449, 4277–4287 (2015)
GAMA blended spectra catalogue 4281
impossible. The new visual classifications remains poorly correlatedwith the spectral classification.
In our opinion, both the SDSS colour-images or the deeper andhigher resolution KiDS single-filter images are still too low res-olution to unambiguously disentangle and visually classify theseobjects. These objects are inherently blended ones. Even with an-other improvement in spatial resolution (i.e. HST imaging), visualclassifications will remain subjective – although it is encouragingthat BWH and AM agreed on the visual classifications. And it re-mains difficult to ascertain which object is in the foreground in avisual classification.
5 C ATA L O G U E
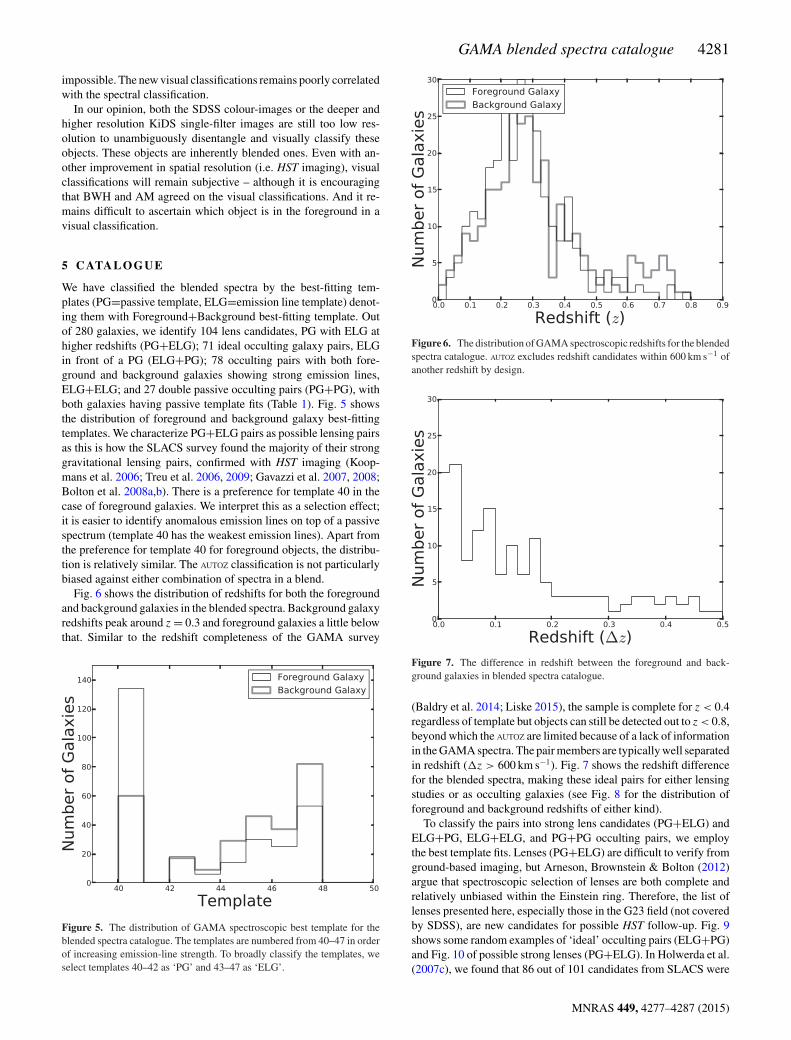
We have classified the blended spectra by the best-fitting tem-plates (PG=passive template, ELG=emission line template) denot-ing them with Foreground+Background best-fitting template. Outof 280 galaxies, we identify 104 lens candidates, PG with ELG athigher redshifts (PG+ELG); 71 ideal occulting galaxy pairs, ELGin front of a PG (ELG+PG); 78 occulting pairs with both fore-ground and background galaxies showing strong emission lines,ELG+ELG; and 27 double passive occulting pairs (PG+PG), withboth galaxies having passive template fits (Table 1). Fig. 5 showsthe distribution of foreground and background galaxy best-fittingtemplates. We characterize PG+ELG pairs as possible lensing pairsas this is how the SLACS survey found the majority of their stronggravitational lensing pairs, confirmed with HST imaging (Koop-mans et al. 2006; Treu et al. 2006, 2009; Gavazzi et al. 2007, 2008;Bolton et al. 2008a,b). There is a preference for template 40 in thecase of foreground galaxies. We interpret this as a selection effect;it is easier to identify anomalous emission lines on top of a passivespectrum (template 40 has the weakest emission lines). Apart fromthe preference for template 40 for foreground objects, the distribu-tion is relatively similar. The AUTOZ classification is not particularlybiased against either combination of spectra in a blend.
Fig. 6 shows the distribution of redshifts for both the foregroundand background galaxies in the blended spectra. Background galaxyredshifts peak around z = 0.3 and foreground galaxies a little belowthat. Similar to the redshift completeness of the GAMA survey
Figure 5. The distribution of GAMA spectroscopic best template for theblended spectra catalogue. The templates are numbered from 40–47 in orderof increasing emission-line strength. To broadly classify the templates, weselect templates 40–42 as ‘PG’ and 43–47 as ‘ELG’.
Figure 6. The distribution of GAMA spectroscopic redshifts for the blendedspectra catalogue. AUTOZ excludes redshift candidates within 600 km s−1 ofanother redshift by design.
Figure 7. The difference in redshift between the foreground and back-ground galaxies in blended spectra catalogue.
(Baldry et al. 2014; Liske 2015), the sample is complete for z < 0.4regardless of template but objects can still be detected out to z < 0.8,beyond which the AUTOZ are limited because of a lack of informationin the GAMA spectra. The pair members are typically well separatedin redshift (�z > 600 km s−1). Fig. 7 shows the redshift differencefor the blended spectra, making these ideal pairs for either lensingstudies or as occulting galaxies (see Fig. 8 for the distribution offoreground and background redshifts of either kind).
To classify the pairs into strong lens candidates (PG+ELG) andELG+PG, ELG+ELG, and PG+PG occulting pairs, we employthe best template fits. Lenses (PG+ELG) are difficult to verify fromground-based imaging, but Arneson, Brownstein & Bolton (2012)argue that spectroscopic selection of lenses are both complete andrelatively unbiased within the Einstein ring. Therefore, the list oflenses presented here, especially those in the G23 field (not coveredby SDSS), are new candidates for possible HST follow-up. Fig. 9shows some random examples of ‘ideal’ occulting pairs (ELG+PG)and Fig. 10 of possible strong lenses (PG+ELG). In Holwerda et al.(2007c), we found that 86 out of 101 candidates from SLACS were
MNRAS 449, 4277–4287 (2015)
4282 B. W. Holwerda et al.
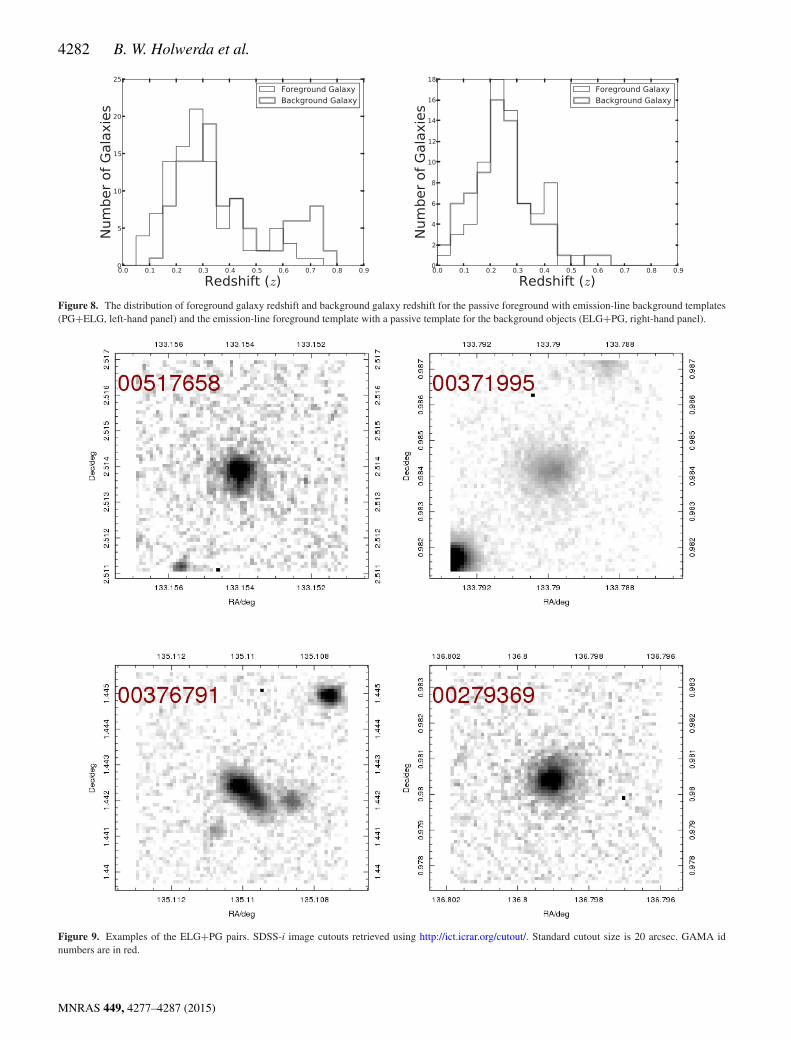
Figure 8. The distribution of foreground galaxy redshift and background galaxy redshift for the passive foreground with emission-line background templates(PG+ELG, left-hand panel) and the emission-line foreground template with a passive template for the background objects (ELG+PG, right-hand panel).
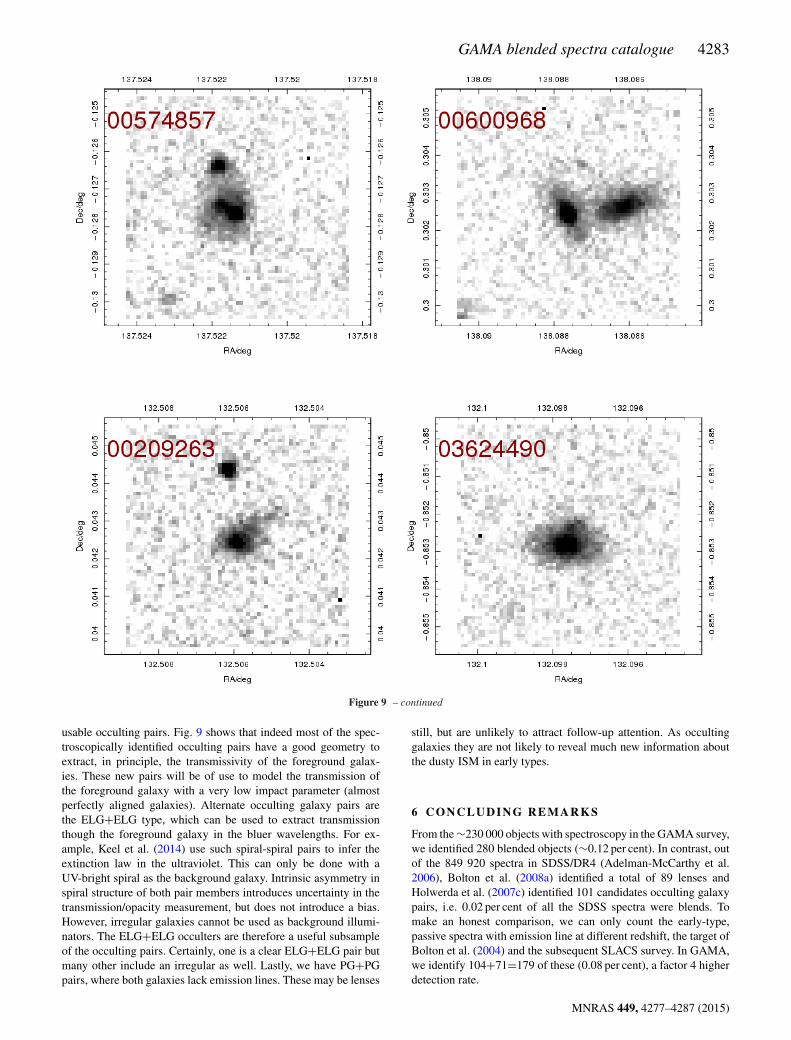
Figure 9. Examples of the ELG+PG pairs. SDSS-i image cutouts retrieved using http://ict.icrar.org/cutout/. Standard cutout size is 20 arcsec. GAMA idnumbers are in red.
MNRAS 449, 4277–4287 (2015)
GAMA blended spectra catalogue 4283
Figure 9 – continued
usable occulting pairs. Fig. 9 shows that indeed most of the spec-troscopically identified occulting pairs have a good geometry toextract, in principle, the transmissivity of the foreground galax-ies. These new pairs will be of use to model the transmission ofthe foreground galaxy with a very low impact parameter (almostperfectly aligned galaxies). Alternate occulting galaxy pairs arethe ELG+ELG type, which can be used to extract transmissionthough the foreground galaxy in the bluer wavelengths. For ex-ample, Keel et al. (2014) use such spiral-spiral pairs to infer theextinction law in the ultraviolet. This can only be done with aUV-bright spiral as the background galaxy. Intrinsic asymmetry inspiral structure of both pair members introduces uncertainty in thetransmission/opacity measurement, but does not introduce a bias.However, irregular galaxies cannot be used as background illumi-nators. The ELG+ELG occulters are therefore a useful subsampleof the occulting pairs. Certainly, one is a clear ELG+ELG pair butmany other include an irregular as well. Lastly, we have PG+PGpairs, where both galaxies lack emission lines. These may be lenses
still, but are unlikely to attract follow-up attention. As occultinggalaxies they are not likely to reveal much new information aboutthe dusty ISM in early types.
6 C O N C L U D I N G R E M A R K S
From the ∼230 000 objects with spectroscopy in the GAMA survey,we identified 280 blended objects (∼0.12 per cent). In contrast, outof the 849 920 spectra in SDSS/DR4 (Adelman-McCarthy et al.2006), Bolton et al. (2008a) identified a total of 89 lenses andHolwerda et al. (2007c) identified 101 candidates occulting galaxypairs, i.e. 0.02 per cent of all the SDSS spectra were blends. Tomake an honest comparison, we can only count the early-type,passive spectra with emission line at different redshift, the target ofBolton et al. (2004) and the subsequent SLACS survey. In GAMA,we identify 104+71=179 of these (0.08 per cent), a factor 4 higherdetection rate.
MNRAS 449, 4277–4287 (2015)
4284 B. W. Holwerda et al.
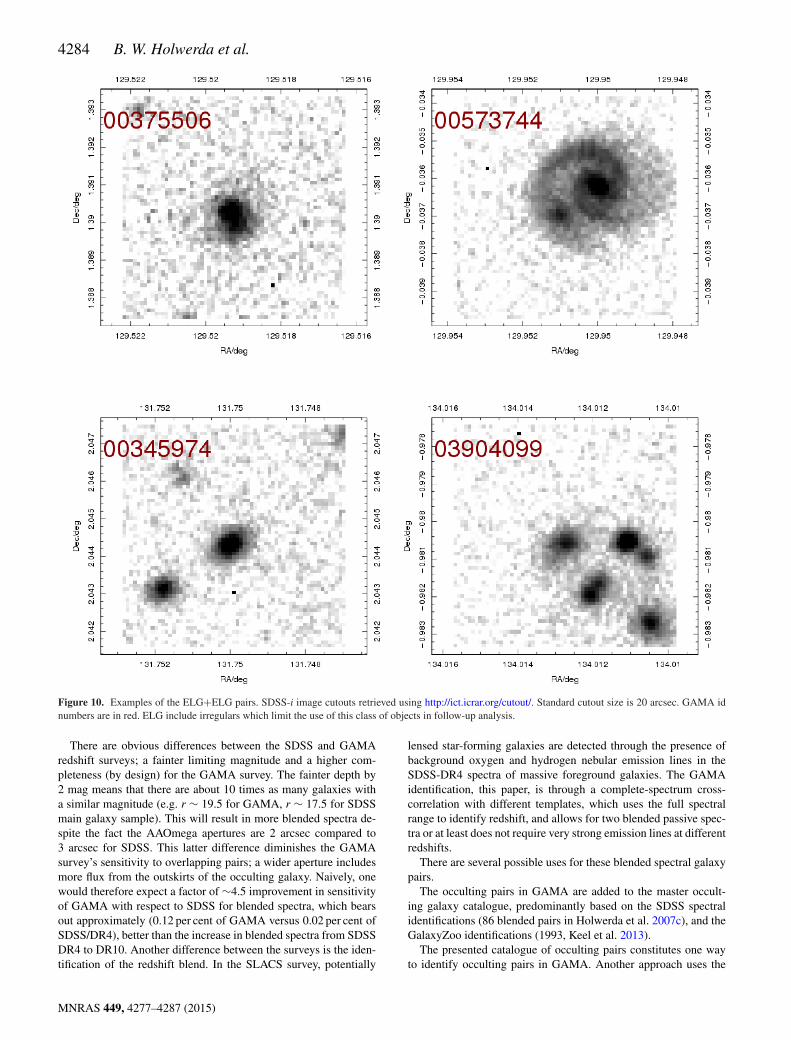
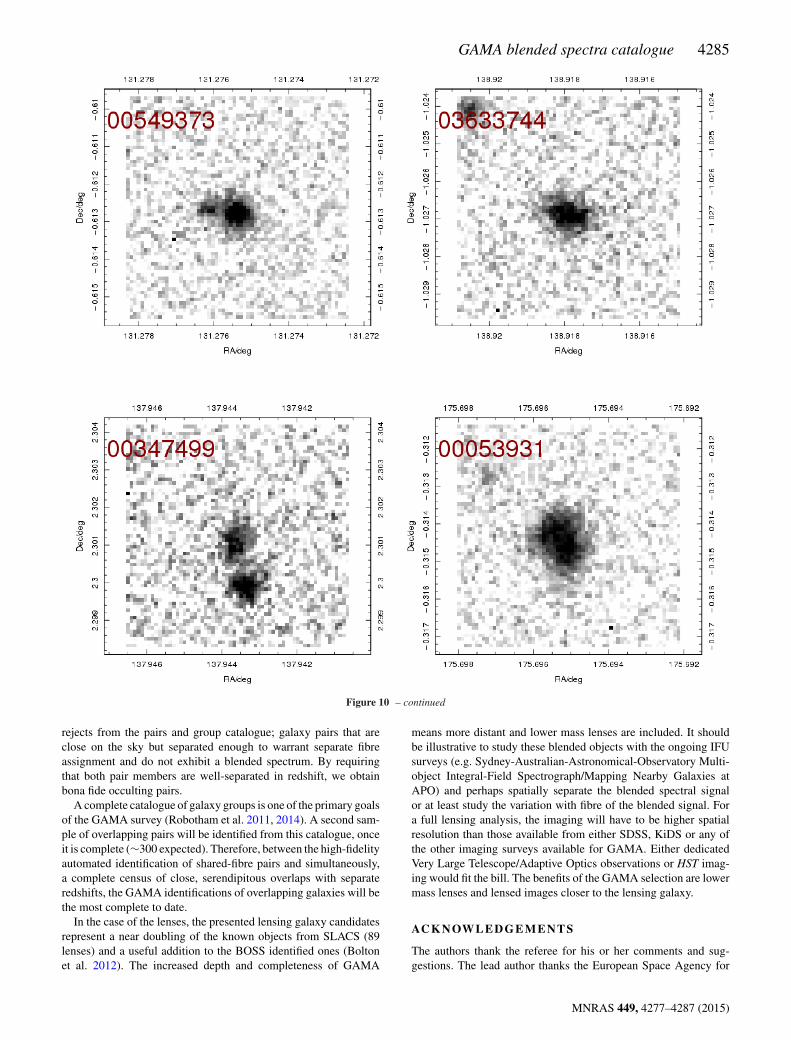
Figure 10. Examples of the ELG+ELG pairs. SDSS-i image cutouts retrieved using http://ict.icrar.org/cutout/. Standard cutout size is 20 arcsec. GAMA idnumbers are in red. ELG include irregulars which limit the use of this class of objects in follow-up analysis.
There are obvious differences between the SDSS and GAMAredshift surveys; a fainter limiting magnitude and a higher com-pleteness (by design) for the GAMA survey. The fainter depth by2 mag means that there are about 10 times as many galaxies witha similar magnitude (e.g. r ∼ 19.5 for GAMA, r ∼ 17.5 for SDSSmain galaxy sample). This will result in more blended spectra de-spite the fact the AAOmega apertures are 2 arcsec compared to3 arcsec for SDSS. This latter difference diminishes the GAMAsurvey’s sensitivity to overlapping pairs; a wider aperture includesmore flux from the outskirts of the occulting galaxy. Naively, onewould therefore expect a factor of ∼4.5 improvement in sensitivityof GAMA with respect to SDSS for blended spectra, which bearsout approximately (0.12 per cent of GAMA versus 0.02 per cent ofSDSS/DR4), better than the increase in blended spectra from SDSSDR4 to DR10. Another difference between the surveys is the iden-tification of the redshift blend. In the SLACS survey, potentially
lensed star-forming galaxies are detected through the presence ofbackground oxygen and hydrogen nebular emission lines in theSDSS-DR4 spectra of massive foreground galaxies. The GAMAidentification, this paper, is through a complete-spectrum cross-correlation with different templates, which uses the full spectralrange to identify redshift, and allows for two blended passive spec-tra or at least does not require very strong emission lines at differentredshifts.
There are several possible uses for these blended spectral galaxypairs.
The occulting pairs in GAMA are added to the master occult-ing galaxy catalogue, predominantly based on the SDSS spectralidentifications (86 blended pairs in Holwerda et al. 2007c), and theGalaxyZoo identifications (1993, Keel et al. 2013).
The presented catalogue of occulting pairs constitutes one wayto identify occulting pairs in GAMA. Another approach uses the
MNRAS 449, 4277–4287 (2015)
GAMA blended spectra catalogue 4285
Figure 10 – continued
rejects from the pairs and group catalogue; galaxy pairs that areclose on the sky but separated enough to warrant separate fibreassignment and do not exhibit a blended spectrum. By requiringthat both pair members are well-separated in redshift, we obtainbona fide occulting pairs.
A complete catalogue of galaxy groups is one of the primary goalsof the GAMA survey (Robotham et al. 2011, 2014). A second sam-ple of overlapping pairs will be identified from this catalogue, onceit is complete (∼300 expected). Therefore, between the high-fidelityautomated identification of shared-fibre pairs and simultaneously,a complete census of close, serendipitous overlaps with separateredshifts, the GAMA identifications of overlapping galaxies will bethe most complete to date.
In the case of the lenses, the presented lensing galaxy candidatesrepresent a near doubling of the known objects from SLACS (89lenses) and a useful addition to the BOSS identified ones (Boltonet al. 2012). The increased depth and completeness of GAMA
means more distant and lower mass lenses are included. It shouldbe illustrative to study these blended objects with the ongoing IFUsurveys (e.g. Sydney-Australian-Astronomical-Observatory Multi-object Integral-Field Spectrograph/Mapping Nearby Galaxies atAPO) and perhaps spatially separate the blended spectral signalor at least study the variation with fibre of the blended signal. Fora full lensing analysis, the imaging will have to be higher spatialresolution than those available from either SDSS, KiDS or any ofthe other imaging surveys available for GAMA. Either dedicatedVery Large Telescope/Adaptive Optics observations or HST imag-ing would fit the bill. The benefits of the GAMA selection are lowermass lenses and lensed images closer to the lensing galaxy.
AC K N OW L E D G E M E N T S
The authors thank the referee for his or her comments and sug-gestions. The lead author thanks the European Space Agency for
MNRAS 449, 4277–4287 (2015)
4286 B. W. Holwerda et al.
the support of the Research Fellowship programme and the wholeGAMA team for a magnificent observational effort. GAMA is ajoint European-Australasian project based around a spectroscopiccampaign using the Anglo-Australian Telescope. The GAMA inputcatalogue is based on data taken from the SDSS and the UnitedKingdom Infrared Telescope Infrared Deep Sky Survey. Comple-mentary imaging of the GAMA regions is being obtained by anumber of independent survey programmes including GALEX MIS,VST KiDS, VISTA VIKING,WISE, Herschel-ATLAS, GMRT andASKAP providing UV to radio coverage. GAMA is funded by theSTFC (UK), the ARC (Australia), the AAO, and the participating in-stitutions. The GAMA website is www.gamasurvey.org/. MJIB ac-knowledges financial support from the Australian Research Council(FT100100280) This research has made use of the NASA/IPAC Ex-tragalactic Database (NED) which is operated by the Jet PropulsionLaboratory, California Institute of Technology, under contract withthe National Aeronautics and Space Administration. This researchhas made use of NASA’s Astrophysics Data System.
R E F E R E N C E S
Adelman-McCarthy J. K. et al., 2006, ApJS, 162, 38Albrecht A. et al., 2006, preprint (astro-ph/0609591)Andredakis Y. C., van der Kruit P. C., 1992, A&A, 265, 396Arneson R. A., Brownstein J. R., Bolton A. S., 2012, ApJ, 753, 4Baes M. et al., 2010, A&A, 518, L39Baldry I. K. et al., 2010, MNRAS, 404, 86Baldry I. K. et al., 2014, MNRAS, 441, 2440Bendo G. J. et al., 2012, MNRAS, 419, 1833Bendo G. J. et al., 2015, MNRAS, 448, 135Berlind A. A., Quillen A. C., Pogge R. W., Sellgren K., 1997, AJ, 114, 107Bianchi S., Xilouris E. M., 2011, A&A, 531, L11Bolton A. S., Burles S., Schlegel D. J., Eisenstein D. J., Brinkmann J., 2004,
AJ, 127, 1860Bolton A. S., Burles S., Koopmans L. V. E., Treu T., Moustakas L. A., 2006,
ApJ, 638, 703Bolton A. S., Burles S., Koopmans L. V. E., Treu T., Gavazzi R., Moustakas
L. A., Wayth R., Schlegel D. J., 2008a, ApJ, 682, 964Bolton A. S., Treu T., Koopmans L. V. E., Gavazzi R., Moustakas L. A.,
Burles S., Schlegel D. J., Wayth R., 2008b, ApJ, 684, 248Bolton A. S. et al., 2012, ApJ, 757, 82Brownstein J. R. et al., 2012, ApJ, 744, 41Cuillandre J., Lequeux J., Allen R. J., Mellier Y., Bertin E., 2001, ApJ, 554,
190de Jong J. T. A., Verdoes Kleijn G. A., Kuijken K. H., Valentijn E. A., 2013,
Exp. Astron., 35, 25de Looze I. et al., 2012, MNRAS, 427, 2797Domingue D. L., Keel W. C., Ryder S. D., White R. E., III, 1999, AJ, 118,
1542Domingue D. L., Keel W. C., White R. E., III, 2000, ApJ, 545, 171Draine B. T. et al., 2014, ApJ, 780, 172Driver S. P. et al., 2009, Astron. Geophys., 50, 050000Driver S. P. et al., 2011, MNRAS, 413, 971Elmegreen D. M., Kaufman M., Elmegreen B. G., Brinks E., Struck C.,
Klaric M., Thomasson M., 2001, AJ, 121, 182Galametz M. et al., 2012, MNRAS, 425, 763Gavazzi R., Treu T., Rhodes J. D., Koopmans L. V. E., Bolton A. S., Burles
S., Massey R. J., Moustakas L. A., 2007, ApJ, 667, 176Gavazzi R., Treu T., Koopmans L. V. E., Bolton A. S., Moustakas L. A.,
Burles S., Marshall P. J., 2008, ApJ, 677, 1046Gonzalez R. A., Allen R. J., Dirsch B., Ferguson H. C., Calzetti D., Panagia
N., 1998, ApJ, 506, 152Gonzalez R. A., Loinard L., Allen R. J., Muller S., 2003, AJ, 125, 1182
Hinz J. L., Engelbracht C. W., Willmer C. N. A., Rieke G. H., RiekeM. J., Smith P. S., Blaylock M., Gordon K. D., 2009, in K. Sheth,A. Noriega -Crespo, J. Ingalls, and R. Paladini, eds, The Evolv-ing ISM in the Milky Way and Nearby Galaxies. Available at:http://ssc.spitzer.caltech.edu/mtgs/ismevol/
Hinz J. L. et al., 2012, ApJ, 756, 75Holwerda B. W., 2005, PhD thesis, Rijksuniversiteit GroningenHolwerda B. W., 2008, MNRAS, 386, 475Holwerda B. W., Keel W. C., 2013, A&A, 556, A42Holwerda B. W., Gonzalez R. A., Allen R. J., van der Kruit P. C., 2005a,
AJ, 129, 1381Holwerda B. W., Gonzalez R. A., Allen R. J., van der Kruit P. C., 2005b,
AJ, 129, 1396Holwerda B. W., Gonzalez R. A., Allen R. J., van der Kruit P. C., 2005c,
A&A, 444, 101Holwerda B. W., Gonzalez R. A., van der Kruit P. C., Allen R. J., 2005d,
A&A, 444, 109Holwerda B. W., Gonzalez R. A., Allen R. J., van der Kruit P. C., 2005e,
A&A, 444, 319Holwerda B. W. et al., 2007a, AJ, 134, 1655Holwerda B. W. et al., 2007b, AJ, 134, 2226Holwerda B. W., Keel W. C., Bolton A., 2007c, AJ, 134, 2385Holwerda B. W., Keel W. C., Williams B., Dalcanton J. J., de Jong R. S.,
2009, AJ, 137, 3000Holwerda B. W., Allen R. J., de Blok W. J. G., Bouchard A., Gonzalez-
Lopezlira R. A., van der Kruit P. C., Leroy A., 2013, Astron. Nachr.,334, 268
Holwerda B. W. et al., 2012, A&A, 541, L5Holwerda B. W., Boker T., Dalcanton J. J., Keel W. C., de Jong R. S., 2013,
MNRAS, 433, 47Holwerda B. W., Reynolds A., Smith M., Kraan-Korteweg R. C., 2015,
MNRAS, 446, 3768Hughes T. M. et al., 2014, A&A, 565, A4Hughes T. M. et al., 2015, A&A, 575, A17Keel W. C., White R. E., III, 2001a, AJ, 121, 1442Keel W. C., White R. E., III, 2001b, AJ, 122, 1369Keel W. C., Manning A. M., Holwerda B. W., Mezzoprete M., Lintott C. J.,
Schawinski K., Gay P., Masters K. L., 2013, PASP, 125, 2Keel W. C., Manning A. M., Holwerda B. W., Lintott C. J., Schawinski K.,
2014, AJ, 147, 44Koopmans L. V. E., Treu T., Bolton A. S., Burles S., Moustakas L. A., 2006,
ApJ, 649, 599Lintott C. J. et al., 2008, MNRAS, 389, 1179Liske J. et al., 2015, MNRAS, submittedPopescu C. C., Misiriotis A., Kylafis N. D., Tuffs R. J., Fischera J., 2000,
A&A, 362, 138Popescu C. C., Tuffs R. J., Dopita M. A., Fischera J., Kylafis N. D., Madore
B. F., 2011, A&A, 527, A109Robotham A. S. G. et al., 2011, MNRAS, 416, 2640Robotham A. S. G. et al., 2014, MNRAS, 444, 3986Saunders A., Goldman D. I., Full R. J., Buehler M., 2006, in Gerhart G. R.,
Shoemaker C. M., Gage D. W., eds, Proc. SPIE Conf. Ser. Vol. 6230,Unmanned Systems Technology VIII. SPIE, Bellingham, p. 17
Sharp R. et al., 2006, in McLean I. S., Iye M., eds, Proc. SPIE Conf. Ser.Vol. 6269, Ground-based and Airborne Instrumentation for Astronomy.SPIE, Bellingham, p. 62690
Smith M. W. L. et al., 2010, A&A, 518, L51Treu T., Koopmans L. V., Bolton A. S., Burles S., Moustakas L. A., 2006,
ApJ, 640, 662Treu T., Gavazzi R., Gorecki A., Marshall P. J., Koopmans L. V. E., Bolton
A. S., Moustakas L. A., Burles S., 2009, ApJ, 690, 670Verstappen J. et al., 2013, A&A, 556, A54White R. E., Keel W. C., 1992, Nature, 359, 129White R. E., III, Keel W. C., Conselice C. J., 2000, ApJ, 542, 761Xilouris E. M. et al., 2012, A&A, 543, A74
MNRAS 449, 4277–4287 (2015)
GAMA blended spectra catalogue 4287
S U P P O RTI N G IN F O R M AT I O N
Additional Supporting Information may be found in the online ver-sion of this article:
Table 3. The complete catalogue of blended spectra inthe GAMA survey (http://mnras.oxfordjournals.org/lookup/suppl/doi:10.1093/mnras/stv589/-/DC1).
Please note: Oxford University Press are not responsible for thecontent or functionality of any supporting materials supplied bythe authors. Any queries (other than missing material) should bedirected to the corresponding author for the article.
This paper has been typeset from a TEX/LATEX file prepared by the author.
MNRAS 449, 4277–4287 (2015)