Embed Size (px)
Citation preview
Gaining Visibility Into Application Performance
Using the Monitoring Capabilities Of Packeteer’s PacketShaper
As a Basis for Analyzing and Controlling Application and Network Performance
Packeteer, Inc. 10495 N De Anza Blvd. Cupertino, Ca. 95014
1-408-873-4400
Rev. D
Company and product names are trademarks or registered trademarks of their respective companies. Copyright 2001 Packeteer, Inc. All rights reserved. No part of this publication may be reproduced, photocopied, stored on a retrieval system, transmitted, or
translated into another language without the express written consent of Packeteer, Inc.
Table of Contents
What’s PacketShaper………………………….………………………………………….……...3
Discovery and Classification of Traffic Types……………………………………………….…4
Examples of Sophisticated Application Classification ............................................................... 4
Classification List ....................................................................................................................... 6
Performance Analysis ................................................................................................................... 6 PacketShaper’s Response-Time Advantage………………………………………………….…7
Response Measurements ............................................................................................................. 8
Utilization Analysis..................................................................................................................... 9
A Utilization Analysis Example............................................................................................. 10
Network-Efficiency Analysis ...................................................................................................... 11
Comparing PacketShaper with Network Probes ..................................................................... 11
Putting It All Together ............................................................................................................... 12
The PacketShaper Advantage.................................................................................................... 13
Technical Appendix: PacketShaper’s Response-Time Management Technology ................ 14
Working in a Variety of Topologies ......................................................................................... 14
Calculating Delays .................................................................................................................... 15
Determining the Server Delay............................................................................................... 16
Determining the Total Delay ................................................................................................. 16
Packeteer, Inc. 2
Gaining Visibility into Application Performance
• Which applications are running on your wide-area network? Are you sure? • Are users’ tempers your only measure of response time? Are your applications living up to
committed service levels? • Which servers have the worst performance records? Who are the top users of a particular
application? Which are the top applications?
Packeteer’s PacketShaper® answers these and many more questions about application performance and network utilization. Although PacketShaper’s primary mission is to fix application-performance problems by controlling hundreds of types of traffic and aligning their performance with business objectives, it’s the monitoring and analysis features that lay the foundation for exercising control and effectively managing a network. PacketShaper’s identification and analysis features can shed much-needed light on application and network behavior and are key components of performance management, capacity planning, service-level commitments, and ensuring employee and company productivity.
This paper describes PacketShaper’s monitoring and analysis capabilities, which enable network administrators to classify traffic through layer 7 of the standard OSI networking model and analyze their performance. However, rather than rely on monitoring as a means for passive observation, this paper explains how PacketShaper’s analysis enables network administrators to control their application performance.
What’s PacketShaper?
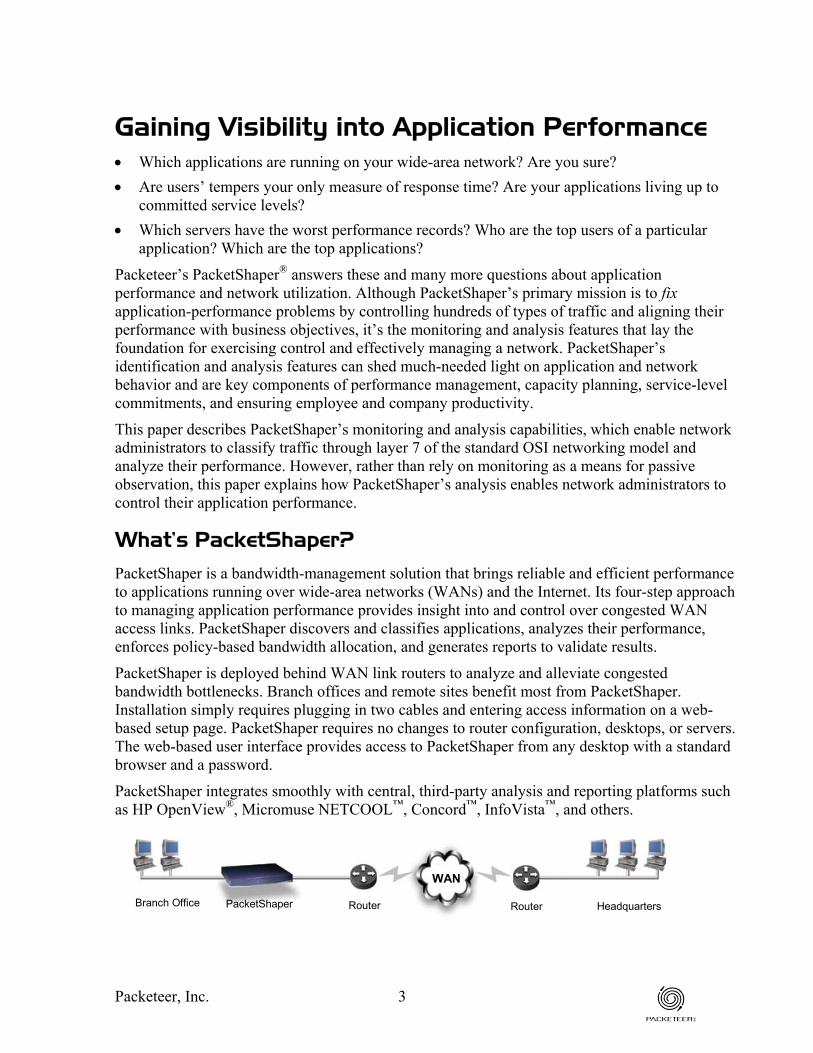
PacketShaper is a bandwidth-management solution that brings reliable and efficient performance to applications running over wide-area networks (WANs) and the Internet. Its four-step approach to managing application performance provides insight into and control over congested WAN access links. PacketShaper discovers and classifies applications, analyzes their performance, enforces policy-based bandwidth allocation, and generates reports to validate results.
PacketShaper is deployed behind WAN link routers to analyze and alleviate congested bandwidth bottlenecks. Branch offices and remote sites benefit most from PacketShaper. Installation simply requires plugging in two cables and entering access information on a web-based setup page. PacketShaper requires no changes to router configuration, desktops, or servers. The web-based user interface provides access to PacketShaper from any desktop with a standard browser and a password.
PacketShaper integrates smoothly with central, third-party analysis and reporting platforms such as HP OpenView®, Micromuse NETCOOL™, Concord™, InfoVista™, and others.
WAN
Router RouterPacketShaperBranch Office Headquarters
Packeteer, Inc. 3
Discovery and Classification of Traffic Types
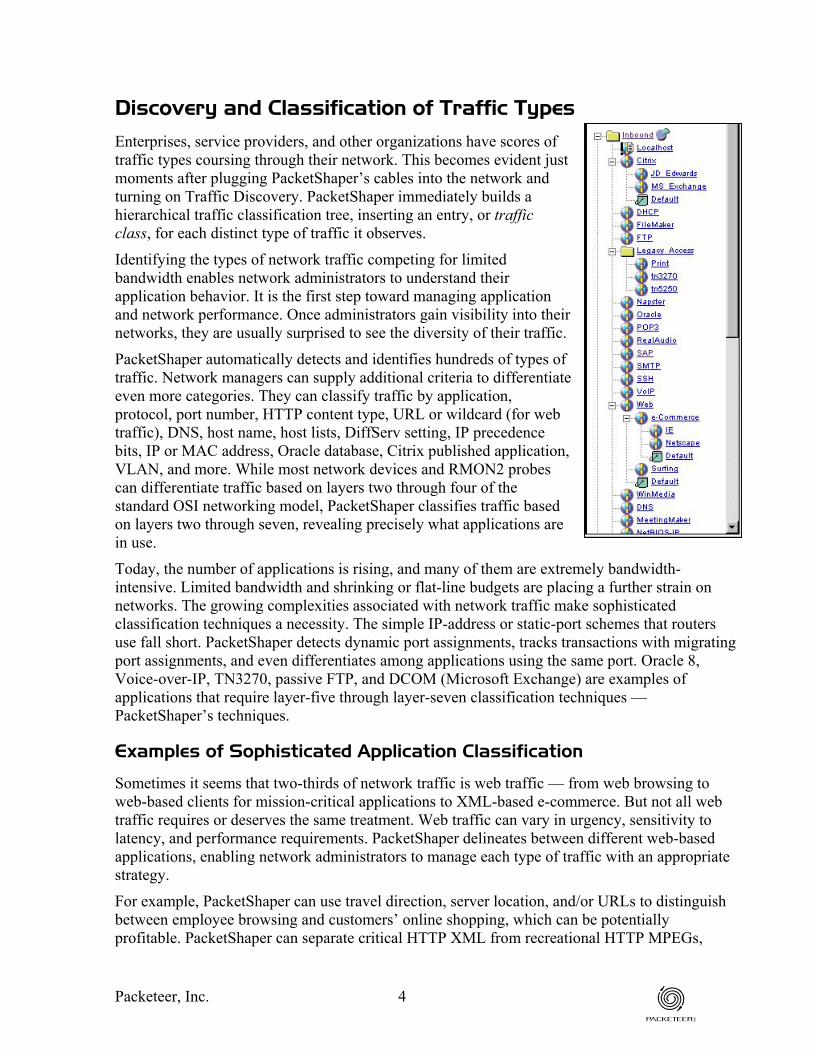
Enterprises, service providers, and other organizations have scores of traffic types coursing through their network. This becomes evident just moments after plugging PacketShaper’s cables into the network and turning on Traffic Discovery. PacketShaper immediately builds a hierarchical traffic classification tree, inserting an entry, or traffic class, for each distinct type of traffic it observes.
Identifying the types of network traffic competing for limited bandwidth enables network administrators to understand their application behavior. It is the first step toward managing application and network performance. Once administrators gain visibility into their networks, they are usually surprised to see the diversity of their traffic.
PacketShaper automatically detects and identifies hundreds of types of traffic. Network managers can supply additional criteria to differentiate even more categories. They can classify traffic by application, protocol, port number, HTTP content type, URL or wildcard (for web traffic), DNS, host name, host lists, DiffServ setting, IP precedence bits, IP or MAC address, Oracle database, Citrix published application, VLAN, and more. While most network devices and RMON2 probes can differentiate traffic based on layers two through four of the standard OSI networking model, PacketShaper classifies traffic based on layers two through seven, revealing precisely what applications are in use.
Today, the number of applications is rising, and many of them are extremely bandwidth-intensive. Limited bandwidth and shrinking or flat-line budgets are placing a further strain on networks. The growing complexities associated with network traffic make sophisticated classification techniques a necessity. The simple IP-address or static-port schemes that routers use fall short. PacketShaper detects dynamic port assignments, tracks transactions with migrating port assignments, and even differentiates among applications using the same port. Oracle 8, Voice-over-IP, TN3270, passive FTP, and DCOM (Microsoft Exchange) are examples of applications that require layer-five through layer-seven classification techniques — PacketShaper’s techniques.
Examples of Sophisticated Application Classification
Sometimes it seems that two-thirds of network traffic is web traffic — from web browsing to web-based clients for mission-critical applications to XML-based e-commerce. But not all web traffic requires or deserves the same treatment. Web traffic can vary in urgency, sensitivity to latency, and performance requirements. PacketShaper delineates between different web-based applications, enabling network administrators to manage each type of traffic with an appropriate strategy.
For example, PacketShaper can use travel direction, server location, and/or URLs to distinguish between employee browsing and customers’ online shopping, which can be potentially profitable. PacketShaper can separate critical HTTP XML from recreational HTTP MPEGs,
Packeteer, Inc. 4
preventing someone’s enthusiasm for Madonna or Metallica from interfering with e-business. Some very thin web-based clients, such as Oracle’s WebForms™ and web-based S390/AS400 host access, can appear to be normal HTTP traffic, but PacketShaper classifies them separately.
PacketShaper can automatically isolate each published application running within a Citrix environment. For example, it can distinguish Microsoft Word from PeopleSoft, and it can distinguish interactive PeopleSoft traffic from print.
PacketShaper distinguishes between many types of Oracle traffic, enabling network administrators to tailor their analysis or management strategies. For example, PacketShaper can separate Oracle applications accessing the “sales” database from those accessing the “accounting” database. PacketShaper identifies Oracle8i/9i and netv2 protocols using a multi-threaded server as well as the older Oracle 7 (or before) and netv1 protocols using a dedicated server.
When multiple applications use the same port, it is usually difficult to apply different management or analysis strategies because they appear as one application. Not so for PacketShaper. For example, PacketShaper can distinguish TN3270 and TN5250 sessions from other Telnet sessions even though all use well-known port 23.
In addition, an application that hops from port to port can be a challenge to identify, because it looks like different applications. But PacketShaper alleviates the difficulty in identifying these migrating applications. For example, AOL Instant Messenger and passive FTP can hop ports frequently, but PacketShaper tracks them throughout their journeys.
PacketShaper can also identify and track hosts by their DNS name, even if DHCP (Dynamic Host Configuration Protocol) changes the host’s IP address frequently. You can use LDAP (Lightweight Directory Access Protocol) host lists to isolate any traffic associated with a host in the list. In addition, PacketShaper can classify traffic based on Diffserv settings and MPLS labels, allowing traffic types to have uniform end-to-end treatment by multi-vendor devices.
Packeteer, Inc. 5
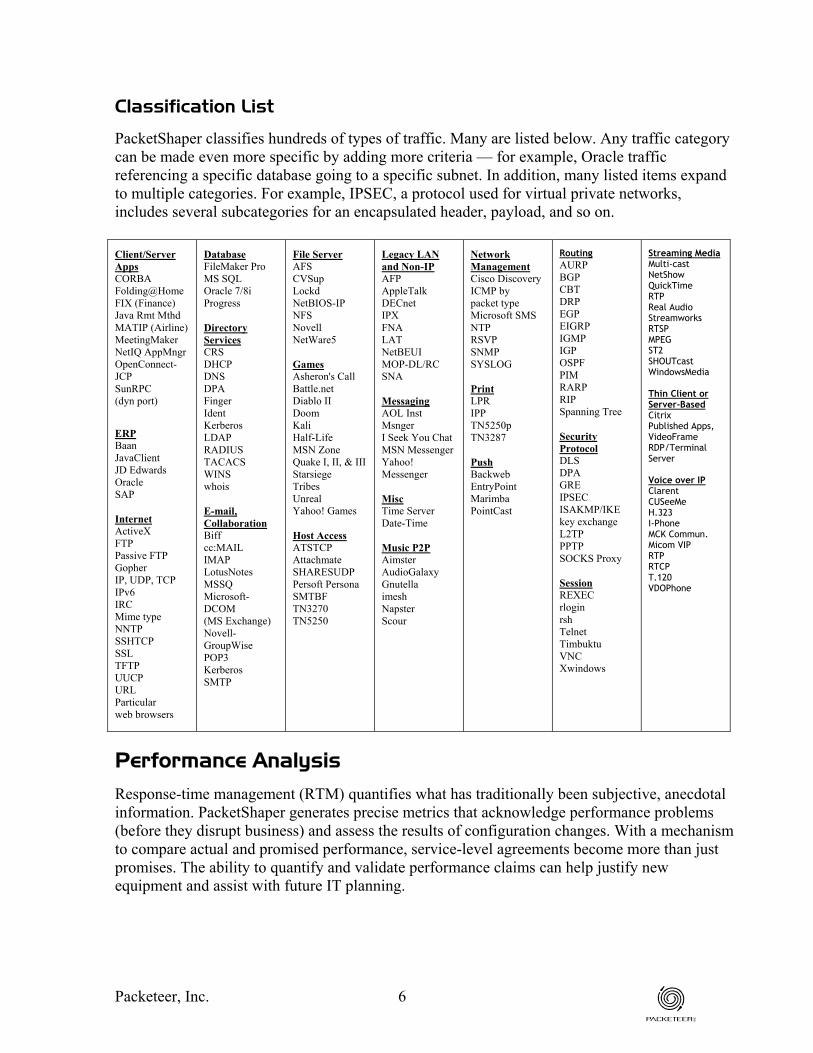
Classification List
PacketShaper classifies hundreds of types of traffic. Many are listed below. Any traffic category can be made even more specific by adding more criteria — for example, Oracle traffic referencing a specific database going to a specific subnet. In addition, many listed items expand to multiple categories. For example, IPSEC, a protocol used for virtual private networks, includes several subcategories for an encapsulated header, payload, and so on.
Client/Server Apps CORBA Folding@Home FIX (Finance) Java Rmt Mthd MATIP (Airline) MeetingMaker NetIQ AppMngr OpenConnect- JCP SunRPC (dyn port)
ERP Baan JavaClient JD Edwards Oracle SAP Internet ActiveX FTP Passive FTP Gopher IP, UDP, TCP IPv6 IRC Mime type NNTP SSHTCP SSL TFTP UUCP URL Particular web browsers
Database FileMaker Pro MS SQL Oracle 7/8i Progress Directory Services CRS DHCP DNS DPA Finger Ident Kerberos LDAP RADIUS TACACS WINS whois E-mail, Collaboration Biff cc:MAIL IMAP LotusNotes MSSQ Microsoft-DCOM (MS Exchange) Novell-GroupWise POP3 Kerberos SMTP
File Server AFS CVSup Lockd NetBIOS-IP NFS Novell NetWare5 Games Asheron's Call Battle.net Diablo II Doom Kali Half-Life MSN Zone Quake I, II, & III Starsiege Tribes Unreal Yahoo! Games Host Access ATSTCP Attachmate SHARESUDP Persoft Persona SMTBF TN3270 TN5250
Legacy LAN and Non-IP AFP AppleTalk DECnet IPX FNA LAT NetBEUI MOP-DL/RC SNA Messaging AOL Inst Msnger I Seek You Chat MSN Messenger Yahoo! Messenger Misc Time Server Date-Time Music P2P Aimster AudioGalaxy Gnutella imesh Napster Scour
Network Management Cisco Discovery ICMP by packet type Microsoft SMS NTP RSVP SNMP SYSLOG Print LPR IPP TN5250p TN3287 Push Backweb EntryPoint Marimba PointCast
Routing AURP BGP CBT DRP EGP EIGRP IGMP IGP OSPF PIM RARP RIP Spanning Tree Security Protocol DLS DPA GRE IPSEC ISAKMP/IKE key exchange L2TP PPTP SOCKS Proxy Session REXEC rlogin rsh Telnet Timbuktu VNC Xwindows
Streaming Media Multi-cast NetShow QuickTime RTP Real Audio Streamworks RTSP MPEG ST2 SHOUTcast WindowsMedia Thin Client or Server-Based Citrix Published Apps, VideoFrame RDP/Terminal Server Voice over IP Clarent CUSeeMe H.323 I-Phone MCK Commun. Micom VIP RTP RTCP T.120 VDOPhone
Performance Analysis
Response-time management (RTM) quantifies what has traditionally been subjective, anecdotal information. PacketShaper generates precise metrics that acknowledge performance problems (before they disrupt business) and assess the results of configuration changes. With a mechanism to compare actual and promised performance, service-level agreements become more than just promises. The ability to quantify and validate performance claims can help justify new equipment and assist with future IT planning.
Packeteer, Inc. 6
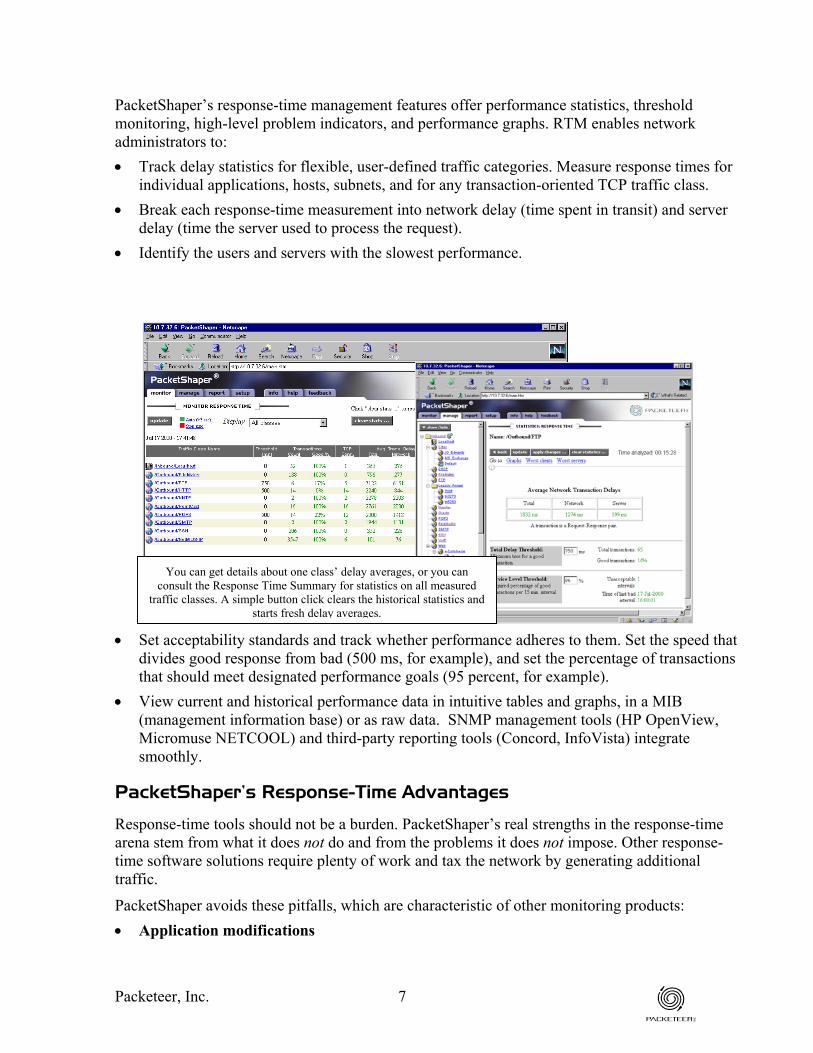
PacketShaper’s response-time management features offer performance statistics, threshold monitoring, high-level problem indicators, and performance graphs. RTM enables network administrators to: • Track delay statistics for flexible, user-defined traffic categories. Measure response times for
individual applications, hosts, subnets, and for any transaction-oriented TCP traffic class. • Break each response-time measurement into network delay (time spent in transit) and server
delay (time the server used to process the request). • Identify the users and servers with the slowest performance.
sta .
You can get details about one class’ delay averages, or you can consult the Response Time Summary for statistics on all measured
traffic classes. A simple button click clears the historical statistics and rts fresh delay averages
• Set acceptability standards and track whether performance adheres to them. Set the speed that divides good response from bad (500 ms, for example), and set the percentage of transactions that should meet designated performance goals (95 percent, for example).
• View current and historical performance data in intuitive tables and graphs, in a MIB (management information base) or as raw data. SNMP management tools (HP OpenView, Micromuse NETCOOL) and third-party reporting tools (Concord, InfoVista) integrate smoothly.
PacketShaper’s Response-Time Advantages
Response-time tools should not be a burden. PacketShaper’s real strengths in the response-time arena stem from what it does not do and from the problems it does not impose. Other response-time software solutions require plenty of work and tax the network by generating additional traffic.
PacketShaper avoids these pitfalls, which are characteristic of other monitoring products: • Application modifications
Packeteer, Inc. 7

PacketShaper does not require software wrappers around measured applications or the addition of API calls.
• Desktop and server changes PacketShaper does not need anything loaded on client desktops or any server.
• Artificial traffic overhead PacketShaper does not create extraneous application requests merely to time their responses, and PacketShaper does not issue pings.
• Router reconfiguration or topology changes PacketShaper requires no changes to router configuration, protocols, or topology. Additionally, PacketShaper is not a single point of network failure — if PacketShaper is turned off or experiences any problem, it acts just like a piece of cable.
• Location restrictions PacketShaper measures performance anywhere on the network, as long as it sees the traffic it is measuring. It can sit on the client side or on the server side of the topology, however edge deployment is highly recommended because the branch location enables network administrators to monitor and control client-server traffic as well as branch-to-branch traffic. If the Internet separates the client and server, it does not matter which side PacketShaper is deployed.
• Data collection overhead PacketShaper does not load the network with constant statistics downloads to a central console.
Response Measurements
Once traffic classes are defined to track your applications of interest, PacketShaper automatically tracks response times. Response-time measurement does not have to be configured or enabled. PacketShaper measures response times for any class with transaction-oriented TCP traffic.
PacketShaper divides each transaction response into three types of delay: • Network delay: The number of milliseconds spent in transit when a client and server
exchange data. If a transaction requires a large quantity of data to be transferred, it is divided and sent in multiple packets. Network delay includes the transit time for all packets involved in a request-response transaction. The amount of time the server uses for processing a request is not included in the network delay. PacketShaper also tracks a separate network-related figure—RTT (Round Trip Time). It’s the number of milliseconds spent in transit when a client and server exchange one small packet precisely once. Even if a transaction’s data is split into multiple packets, RTT includes only one round trip between client and server. RTT helps determine if a large network delay is due to large transactions or a slow network. In addition to RTT, PacketShaper acknowledges that many large transactions are common. As a result, PacketShaper can account for a transaction’s size and normalized network delay to determine whether or not a network delay is associated with a large transaction.
Packeteer, Inc. 8

• Server Delay: The number of milliseconds the server uses to process a client's request after it receives all required data. The Server Delay is the time after the server receives the last request packet and before it sends the first packet of the reply. It’s the time the server takes to process the client's request.
• Total Delay: The number of milliseconds beginning with a client's request and ending upon receipt of the response. A transaction’s total delay is the time spent in transit plus the time required for the server to process the request — the sum of the first two delay figures.
The network and total delays increase if router queues deepen and introduce queue-based latency. Therefore, network and total delays can be minimized by using PacketShaper’s performance-control features (not covered in this paper) to maximize throughput and guarantee service levels to mission-critical applications.
Utilization Analysis
Utilization analysis determines how bandwidth is used and gives answers to questions such as: • How is link capacity divided? • Which applications, which hosts, and which web destinations are the most popular? • What is Oracle traffic’s current bandwidth rate? What was its peak last month?
Although everyone is usually quite aware of the applications suffering from bandwidth starvation (or at least periodic hunger), it is a bigger challenge to identify the bandwidth-hogging culprits.
PacketShaper provides a breakdown of average and peak usage statistics in one easy real-time table. A high-level summary gives an at-a-glance review of the link’s history and status. A variety of context-specific graphs can be customized to include the traffic classes and time intervals of interest. In addition, graphs can be combined to compare the same measurements for
Peak Average
Packeteer, Inc. 9
multiple classes, as in the example comparing peak rates for both inbound and outbound traffic.
WAN links are expensive. Therefore it makes perfect sense to know which applications use what percentage of an IT budget. Companies, service providers, and other organizations frequently have an artificial sense of security if they examine graphs of average network usage over sizable chunks of time. When PacketShaper adds peak usage and more frequent intervals, these graphs can highlight a hidden contention problem. In the example graph, the average-rate line might mislead someone to think that usage never approaches link capacity. The peak-rate line tells the real story — frequent spikes that use the entire link.
PacketShaper tracks more than 60 separate variables on each traffic class, quantifying them in intuitive tables, graphs, and reports. For additional reports, statistics can be exported to any reporting tool that accepts comma-delimited format. In addition, all statistics are stored in a MIB and are accessible to any SNMP platform.
A Utilization Analysis Example
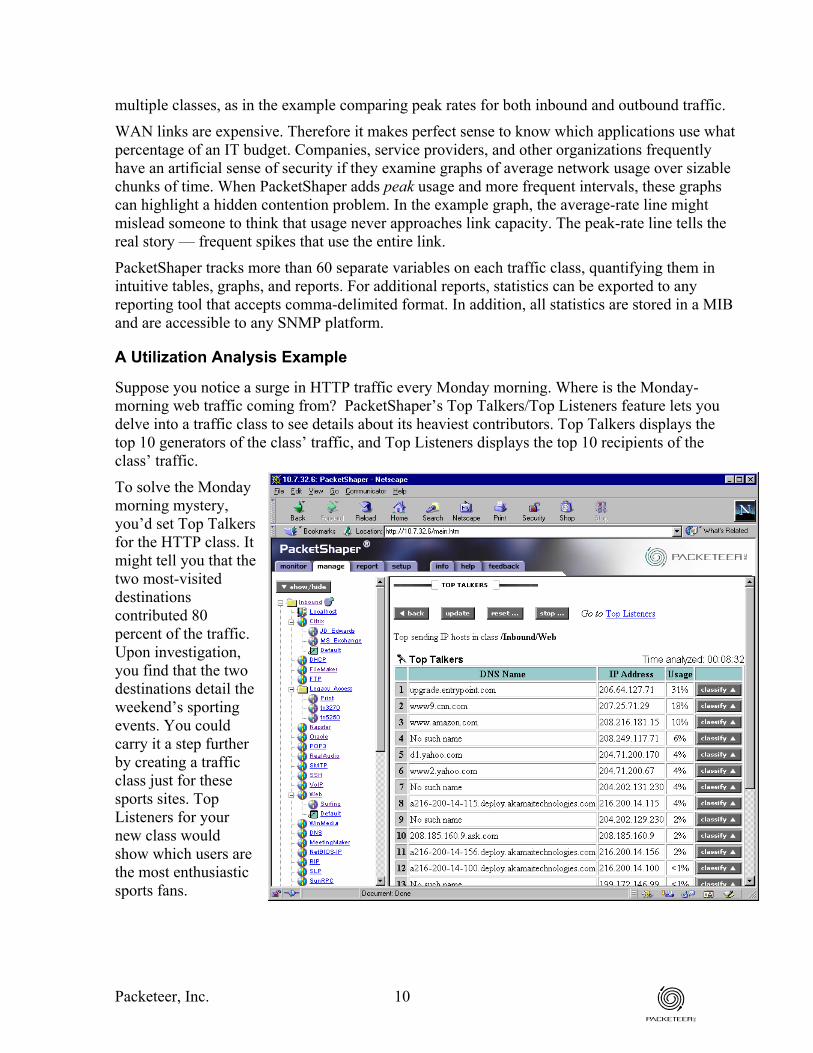
Suppose you notice a surge in HTTP traffic every Monday morning. Where is the Monday-morning web traffic coming from? PacketShaper’s Top Talkers/Top Listeners feature lets you delve into a traffic class to see details about its heaviest contributors. Top Talkers displays the top 10 generators of the class’ traffic, and Top Listeners displays the top 10 recipients of the class’ traffic.
To solve the Monday morning mystery, you’d set Top Talkers for the HTTP class. It might tell you that the two most-visited destinations contributed 80 percent of the traffic. Upon investigation, you find that the two destinations detail the weekend’s sporting events. You could carry it a step further by creating a traffic class just for these sports sites. Top Listeners for your new class would show which users are the most enthusiastic sports fans.
Packeteer, Inc. 10
Network Efficiency Analysis
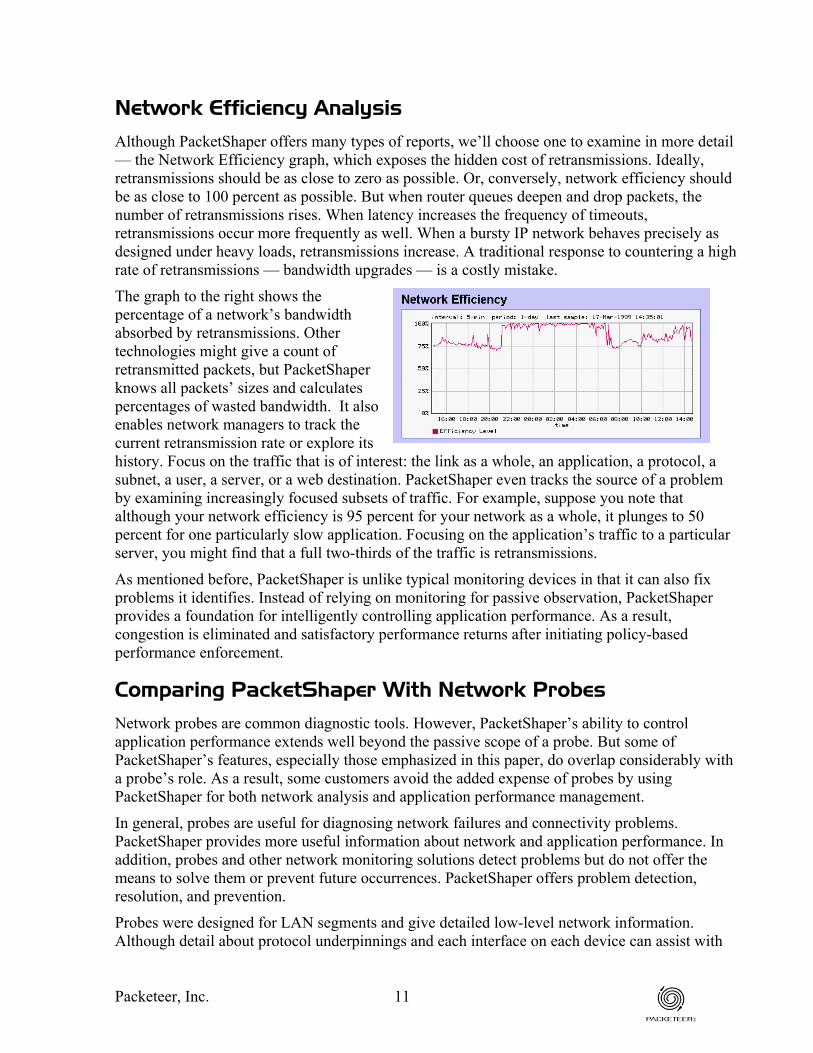
Although PacketShaper offers many types of reports, we’ll choose one to examine in more detail — the Network Efficiency graph, which exposes the hidden cost of retransmissions. Ideally, retransmissions should be as close to zero as possible. Or, conversely, network efficiency should be as close to 100 percent as possible. But when router queues deepen and drop packets, the number of retransmissions rises. When latency increases the frequency of timeouts, retransmissions occur more frequently as well. When a bursty IP network behaves precisely as designed under heavy loads, retransmissions increase. A traditional response to countering a high rate of retransmissions — bandwidth upgrades — is a costly mistake.
The graph to the right shows the percentage of a network’s bandwidth absorbed by retransmissions. Other technologies might give a count of retransmitted packets, but PacketShaper knows all packets’ sizes and calculates percentages of wasted bandwidth. It also enables network managers to track the current retransmission rate or explore its history. Focus on the traffic that is of interest: the link as a whole, an application, a protocol, a subnet, a user, a server, or a web destination. PacketShaper even tracks the source of a problem by examining increasingly focused subsets of traffic. For example, suppose you note that although your network efficiency is 95 percent for your network as a whole, it plunges to 50 percent for one particularly slow application. Focusing on the application’s traffic to a particular server, you might find that a full two-thirds of the traffic is retransmissions.
As mentioned before, PacketShaper is unlike typical monitoring devices in that it can also fix problems it identifies. Instead of relying on monitoring for passive observation, PacketShaper provides a foundation for intelligently controlling application performance. As a result, congestion is eliminated and satisfactory performance returns after initiating policy-based performance enforcement.
Comparing PacketShaper With Network Probes
Network probes are common diagnostic tools. However, PacketShaper’s ability to control application performance extends well beyond the passive scope of a probe. But some of PacketShaper’s features, especially those emphasized in this paper, do overlap considerably with a probe’s role. As a result, some customers avoid the added expense of probes by using PacketShaper for both network analysis and application performance management.
In general, probes are useful for diagnosing network failures and connectivity problems. PacketShaper provides more useful information about network and application performance. In addition, probes and other network monitoring solutions detect problems but do not offer the means to solve them or prevent future occurrences. PacketShaper offers problem detection, resolution, and prevention.
Probes were designed for LAN segments and give detailed low-level network information. Although detail about protocol underpinnings and each interface on each device can assist with
Packeteer, Inc. 11
detailed connectivity troubleshooting, it sometimes leaves users searching for a bigger picture or a broader conclusion.
PacketShaper can analyze LAN traffic or WAN links and correlate traffic that share characteristics other than host or protocol. Traffic classes are based on extremely flexible criteria — application, subnet, server, web site, travel direction, database, and so on. PacketShaper’s correlated statistics on each traffic class make investigative efforts and performance conclusions easier. Although a probe might give you packet rates on a per-interface or per-device basis, PacketShaper can offer packet rates on a per-application basis, independent of host. Or, if a host’s rate is needed, PacketShaper can do that too.
For example, suppose you receive complaints from Citrix MetaFrame users regarding unacceptable response time. They use Citrix to access PeopleSoft, Microsoft Word, and other applications from remote PCs. A probe might give you packet rates for one of the hosts using Citrix. But which portion is Citrix traffic? Which portion is one particular application such as PeopleSoft? What about the other Citrix users? PacketShaper gives you usage rates for only Citrix traffic — everyone’s, just certain hosts’, or just certain applications’. Best of all, PacketShaper also gives you the means to correct the problem and give Citrix traffic better response.
Putting It All Together
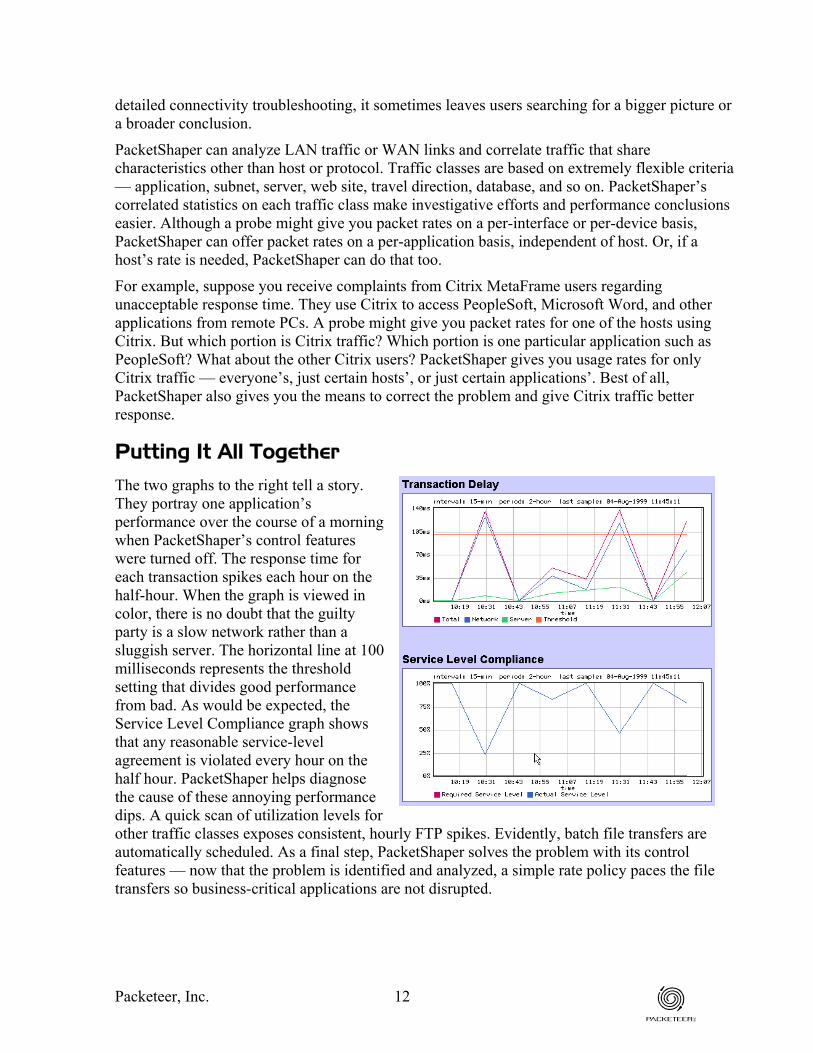
The two graphs to the right tell a story. They portray one application’s performance over the course of a morning when PacketShaper’s control features were turned off. The response time for each transaction spikes each hour on the half-hour. When the graph is viewed in color, there is no doubt that the guilty party is a slow network rather than a sluggish server. The horizontal line at 100 milliseconds represents the threshold setting that divides good performance from bad. As would be expected, the Service Level Compliance graph shows that any reasonable service-level agreement is violated every hour on the half hour. PacketShaper helps diagnose the cause of these annoying performance dips. A quick scan of utilization levels for other traffic classes exposes consistent, hourly FTP spikes. Evidently, batch file transfers are automatically scheduled. As a final step, PacketShaper solves the problem with its control features — now that the problem is identified and analyzed, a simple rate policy paces the file transfers so business-critical applications are not disrupted.
Packeteer, Inc. 12
The PacketShaper Advantage
Understanding the content, performance, and behavior of applications leads to better capacity planning and management. The combination of PacketShaper’s automatic application discovery, response-time measurements, utilization statistics, efficiency calculations, and graphs provide insight that has breadth and depth. Better analysis feeds a more effective performance-management strategy, and PacketShaper facilitates both.
If you’d like more information, consult Packeteer’s web site at www.packeteer.com or call 408.873.4400 or 800.697.2253.
Packeteer, Inc. 13
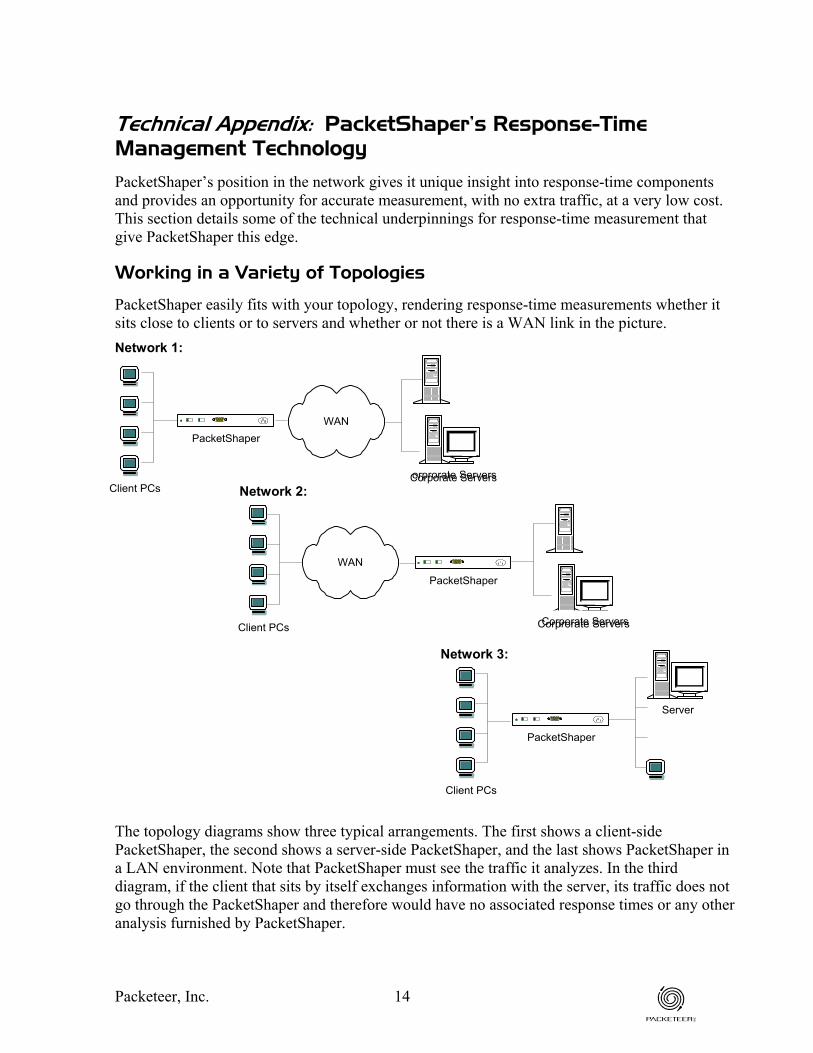
Technical Appendix: PacketShaper’s Response-Time Management Technology
PacketShaper’s position in the network gives it unique insight into response-time components and provides an opportunity for accurate measurement, with no extra traffic, at a very low cost. This section details some of the technical underpinnings for response-time measurement that give PacketShaper this edge.
Working in a Variety of Topologies
PacketShaper easily fits with your topology, rendering response-time measurements whether it sits close to clients or to servers and whether or not there is a WAN link in the picture.
PacketShaper
Client PCs
WAN
C
Client PCs
WAN
PacketShaper
Client PCs
PacketShaper
Server
Network 3:
Network 1:
Network 2:
Corprorate ServersCorporate Servers
orprorate ServersCorporate Servers
The topology diagrams show three typical arrangements. The first shows a client-side PacketShaper, the second shows a server-side PacketShaper, and the last shows PacketShaper in a LAN environment. Note that PacketShaper must see the traffic it analyzes. In the third diagram, if the client that sits by itself exchanges information with the server, its traffic does not go through the PacketShaper and therefore would have no associated response times or any other analysis furnished by PacketShaper.
Packeteer, Inc. 14
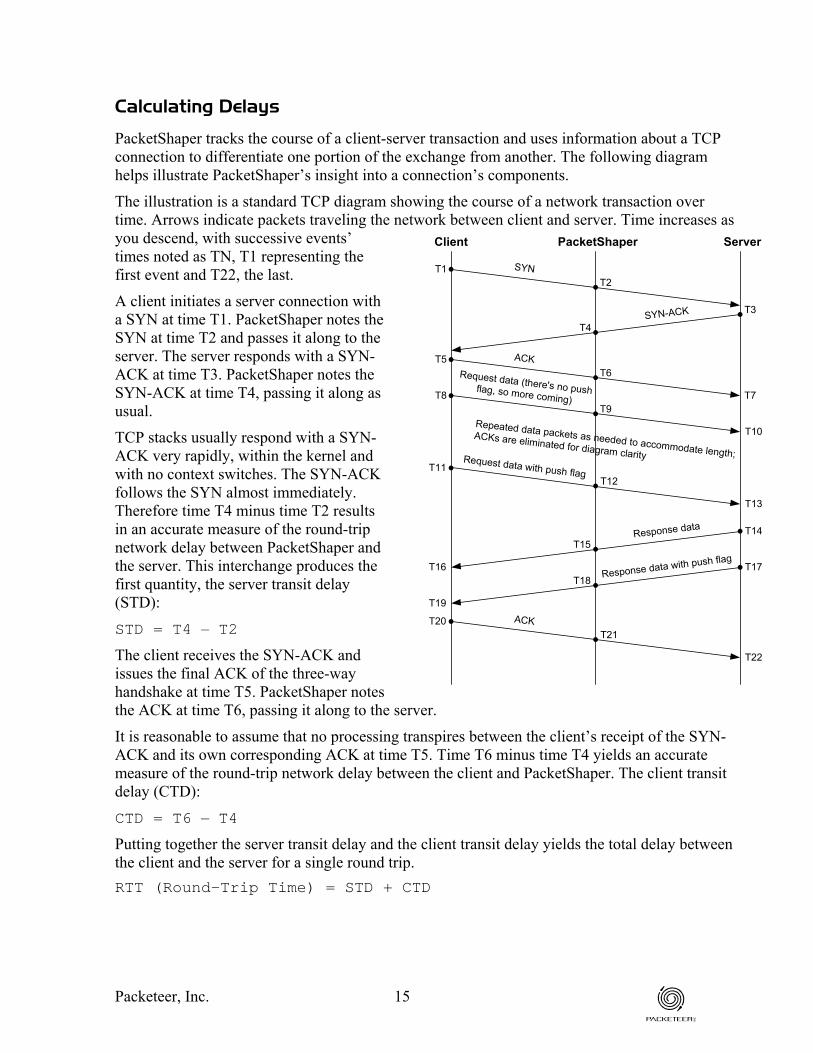
Calculating Delays
PacketShaper tracks the course of a client-server transaction and uses information about a TCP connection to differentiate one portion of the exchange from another. The following diagram helps illustrate PacketShaper’s insight into a connection’s components.
The illustration is a standard TCP diagram showing the course of a network transaction over time. Arrows indicate packets traveling the network between client and server. Time increases as you descend, with successive events’ times noted as TN, T1 representing the first event and T22, the last.
A client initiates a server connection with a SYN at time T1. PacketShaper notes the SYN at time T2 and passes it along to the server. The server responds with a SYN-ACK at time T3. PacketShaper notes the SYN-ACK at time T4, passing it along as usual.
TCP stacks usually respond with a SYN-ACK very rapidly, within the kernel and with no context switches. The SYN-ACK follows the SYN almost immediately. Therefore time T4 minus time T2 results in an accurate measure of the round-trip network delay between PacketShaper and the server. This interchange produces the first quantity, the server transit delay (STD):
STD = T4 – T2
The client receives the SYN-ACK and issues the final ACK of the three-way handshake at time T5. PacketShaper notes the ACK at time T6, passing it along to the server.
Client ServerPacketShaper
SYN
SYN-ACK
ACKRequest data (there's no pushflag, so more coming)
Request data with push flag
T2
T5
T3
T4
T1
T6
T7T8T9
Repeated data packets as needed to accommodate length;
ACKs are eliminated for diagram clarity
Response data
Response data with push flag
ACK
T11
T10
T12
T15
T16
T19
T20
T13
T14
T17
T22
T21
T18
It is reasonable to assume that no processing transpires between the client’s receipt of the SYN-ACK and its own corresponding ACK at time T5. Time T6 minus time T4 yields an accurate measure of the round-trip network delay between the client and PacketShaper. The client transit delay (CTD):
CTD = T6 – T4
Putting together the server transit delay and the client transit delay yields the total delay between the client and the server for a single round trip. RTT (Round-Trip Time) = STD + CTD
Packeteer, Inc. 15

Determining the Server Delay
The client initiates its request at time T8, arriving at the PacketShaper at time T9. For large requests, the request is divided into multiple packets. The TCP diagram eliminates the server’s corresponding ACKs to simplify the picture, because these ACKs are not material to PacketShaper’s calculations. The last request packet, sent at time T11, has its Push Flag set to one indicating it is the final packet. PacketShaper notes the time of this last request packet at T12.
After the last request packet arrives at the server at time T13, the server assembles the request, conducts whatever processing is required for the request, and assembles its response. The server sends the first packet (of potentially several response packets) at time T14. Time T14 minus time T13 is the actual server-processing time required for the request, but these times are not visible to PacketShaper.
PacketShaper knows that the server’s processing time occurred after it saw the last request packet and before it saw the first response packet (time T15 minus time T12). Additionally, it knows that another component of this interval was the transit time from PacketShaper to the server and back again. Conveniently, it already has that figure — it’s the server transit delay (STD). In addition, there is a small amount of time spent serializing the bits in the response packet and preparing them for their bit stream. This time was not included in the original server transit delay because the SYN and ACK packets are extremely small. PacketShaper knows the size of the packet, calculates this preparation time accordingly (∆1), and adds it to the STD before subtracting the sum from the time difference.
Server Delay = (T15 – T12) – (STD + ∆1)
Determining the Total Delay
The termination of a transaction is key to calculating the total delay; however, it’s not always obvious when a transaction ends. The combination of a Push flag from the server and its corresponding ACK from the client frequently signal the end. But long transactions often insert Push flags throughout the transaction.
In addition to monitoring Push flags, PacketShaper uses a timer to track transactions and uses the following rules: • If a Push flag seems to indicate a transaction’s end, but the server continues sending more
data, the timer continues to advance. • If the client sends a new request, PacketShaper ends the last transaction and records the last
time noted. • If there is no activity from either the server or the client, PacketShaper considers the
transaction complete and records the last time noted. • When the connection ends, PacketShaper sees the FIN and records the last time noted.
Using these techniques, PacketShaper notes the last response packet at time T18, makes sure that it saw all required ACKs for the request packets, and verifies that the last response packet indeed represented the end of the transaction.
Packeteer, Inc. 16
After the client receives the final response packet at time T19, it sends an ACK. The ACK reaches PacketShaper at time T21. The client’s perspective of response time starts with sending the first request packet (T8) and ends with receipt of the final response packet (T20). PacketShaper sees that interval as time T9 until time T21. Although this is a close estimate of the client’s view, it’s missing some extra preparation time for serializing the first request packet, assuming it is larger than the final ACK. Because PacketShaper knows the packet-size difference, it can calculate this small discrepancy (∆2).
Total delay = (T21 – T9) + ∆2
Once PacketShaper has the server delay and the total delay, it can calculate the amount of time the transaction spent in transit.
Network delay = (Total delay) – (Server delay)
Whereas the RTT represents the transit time for just one round trip, the network delay reflects all transit time for the transaction. If the transaction’s data is large, multiple packets need to make their way to and from the server. Only the network delay reflects this overhead. The network delay is not necessarily an even multiple of the RTT because multiple packets are not sent consecutively but tend to overlap to varying degrees. In addition, because network and total delay are products of transaction size, ping times and RTM measurements are not comparable.
As you can see, PacketShaper uses its intermediary position to make packet-time and size observations during a transaction. Then it incorporates TCP basics to render accurate performance figures.
Packeteer and PacketShaper are registered trademarks of Packeteer, Inc. All other products and services are the trademarks of their respective owners.
Packeteer, Inc. 17


![[INFOGRAPHIC] Perspective on TLDs: Business Opportunities and Consumers' Trust](https://img.dokumen.tips/doc/110x75/55ba268cbb61eb101c8b45d2/infographic-perspective-on-tlds-business-opportunities-and-consumers-trust.jpg)
