Embed Size (px)
Citation preview

General Aviation: ADS-B / GPS Trial Results
v2.1
December 2015

NATS
GA ADS-B ◊ v2.1 December 2015 Page 2 of 58
Notices
Any copies printed from the online version are to be treated as uncontrolled.
Action Role Name Signature Date
Author Systems Engineer
Richard Hayward Not required
01/12/2015
Co-Author Systems Engineer
Adrian Price
Approved Team Lead, Technical & Strategic Research
John Korna
03/12/2015
Accepted Head of NATS R&D
Mark Watson /12/2015
Publication history
Issue Month/Year Change Requests in this issue
Issue 1.0 August 2015 Initial report
Issue 2.0 December 2015 Final report.
Reviewers
Reviewers Name of individual
Mandatory (signatories) John Korna
Mark Watson
Blain Kelly
Optional Alistair Sloan
Peter Younger
Sacha Rossi

NATS
GA ADS-B ◊ v2.1 December 2015 Page 3 of 58
Referenced documents
List of documents referenced in this document:
(1) EUROCONTROL Specification for ATM Surveillance System Performance, Vol 1, Eurocontrol-SPEC-
0147, EUROCONTROL, March 2012 (2) EUROCONTROL Specification for ATM Surveillance System Performance, Vol 2, Eurocontrol-SPEC-
0147, EUROCONTROL, March 2012 (3) Trial Participation email 2015
(4) ARTAS V8A Tracker Parameter Classification(TRK-PARAM), V1.00, 17.05.2010
(5) Minimum Operational Performance Standards for 1090 MHz Extended Squitter Automatic
Dependent Surveillance – Broadcast (ADS-B) and Traffic Information Services –
Broadcast (TIS-B), ED-102A, January 2012 (ED-102A/DO-260B is a joint publication of
EUROCAE and RTCA)
(6) Trig TN70 price: http://www.gps.co.uk/trig-tn70-ads-b-out-solution/p-0-1711/
(7) Minimum Aviation System Performance Standards For Automatic Dependent Surveillance
Broadcast (ADS-B) DO-242a, June 2002
(8) STANDARD CHANGES AND STANDARD REPAIRS, CS-STAN, July 2015
(9) LPAT High Level Safety Performance and Certification Assessment, NATS (Helios), April
2013
(10) MINIMUM OPERATIONAL PERFORMANCE STANDARDS (MOPS) FOR AIRCRAFT
SURVEILLANCE APPLICATIONS (ASA) SYSTEM, ED-194A, June 2014
NATS
GA ADS-B ◊ v2.1 December 2015 Page 4 of 58
Contents
PAGE
Notices 2 Publication history 2 Reviewers 2 Referenced documents 3
Executive Summary 6
Acronyms and Terminology 8
1 Introduction 10
1.1 Purpose 10
1.2 Trial background 10
1.3 Trial Aim 10
1.3.1 Trial Objectives 11
1.4 Scope 11
1.4.1 Trial Temporal and Geographical Limits 12
2 Approval process for the Mode S GPS trial 12
2.1 CAA support for the trial 12
2.2 Transponder manufacturers’ support for the trial 13
2.3 Invitation to participate in the trial 13
3 Methodology 13
3.1 Data collection 13
3.2 Surveillance requirements 15
3.2.1 Airborne surveillance applications 17
3.3 Metrics 18
3.3.1 Horizontal position error 18 3.3.1.1 Along track error 18 3.3.1.2 Across track error 19 3.3.2 Consecutive errors 19 3.3.3 Probability of Update 19 3.3.4 Mode C 19 3.3.5 Ground speed 19 3.3.6 Altitude reporting capability 19 3.3.7 Mode A 19 3.3.8 Aircraft identification 20 3.3.9 MOPS version 20 3.3.10 Navigational Integrity Category 20 3.3.11 Navigation Accuracy Code for position 20 3.3.12 Source Integrity Level 21 3.3.13 Priority status 21
4 Results 22
4.1 Overview 22
4.2 Horizontal position error 23
4.2.1 Along track error 27 4.2.2 Across track error 28
4.3 Consecutive errors 29

NATS
GA ADS-B ◊ v2.1 December 2015 Page 5 of 58
4.4 Probability of update 31
4.5 Mode C & Altitude Reporting Capability 34
4.5.1 Mode C 34 4.5.2 Altitude reporting capability (ARC) 35
4.6 Ground speed 36
4.7 Mode A 37
4.8 Aircraft identification 37
4.9 MOPS version 37
4.10 Navigational Integrity Category 37
4.11 Navigation Accuracy Code for position 38
4.12 Surveillance Integrity Level 39
4.13 Priority status 40
4.14 Airborne surveillance applications compatibility 40
4.15 Observations and investigations 42
4.15.1 Maximum Horizontal position error 42 4.15.2 Mode S Address Identification 47 4.15.3 GA responses and applications to the trial 51
5 Summary 52
6 Conclusions 54
7 Recommendations 54
Appendices 56
A1 GA Trial Airframe & Equipment Details (anonamised) 56
A2 Overview of process for LAA minor modification 57

NATS
GA ADS-B ◊ v2.1 December 2015 Page 6 of 58
Executive Summary
This report details the results and findings of the recent CAA backed study to assess the quality of
Automatic Dependent Surveillance – Broadcast (ADS-B) data. Specifically, ADS-B generated by
general aviation (GA) airframes equipped with Mode S transponders capable of extended squitter
(ES) and where the broadcast position information is taken from a non-certified Global Positioning
System (GPS) source.
The comparative assessment was conducted against key ESASSP ATC surveillance requirements
using NATS NODE-L multi-radar data as the truth track for conformance. The quality of the
ADS-B horizontal position updates derived from the non-certified GPS sources was also compared
to a baseline of aircraft equipped with certified GPS sources (DO-260B/ED-102A compliant
airframes); albeit with different flight profiles.
The assessment necessitated the use of several assumptions, namely that the GPS satellites were
in a fault free condition and that the accuracy of the multi-radar track data was sufficiently high
to apportion any position errors to the ADS-B reports.
The accuracy of the non-certified GPS position reports was found to be very similar to that of the
certified aircraft; however the trial did record several extremely large horizontal position errors.
Investigation of these errors determined they were broadcast by one particular airframe and were
caused when the reported longitude position swapped from negative to positive for an update. It
is not expected that a single large error would lead to significant issues to ATC as a single report
would be considered as an outlier by a surveillance tracker and not lead to credible corruption.
When assessed against the ESASSP requirements, the mean horizontal position error (HPE) was
measured to be 43.94m well within the required 300m and recommended 210m, Overall 99.84%
of ADS-B HPE’s recorded by the non-certified fleet were below 300m, which was a higher
percentage than that of the certified comparison fleet which recorded 99.7% and a mean HPE of
40.35m.
In terms of acceptability for the airborne situational awareness application in uncontrolled
airspace, the GA fleet mean HPE of 43.94m is also well within 103m which equates to an error of
+/- 12.5 degrees at 3NM range, which is the cited acceptable error limit.
The Navigational Accuracy Code for Position (NACp) quality indicator that reports the expected
accuracy of the position reported, was on the whole found to be very conservative in the non-
certified fleet; however this is better than over-estimating the accuracy capability.
With regards to consecutive errors that could cause credible corruption, the distribution generated
by the non-certified GPS fleet was similar in proportion to that of the certified comparator fleet,
however the number generated does highlight the potential need for an independent means of
validating ADS-B reported position on a continual/concurrent basis.
The trial has identified that the probability of update of the reported ADS-B positions was very
low for both the GA and comparator fleet. Although it is not possible to determine the reasons for
the low probability of update (given the absence of data), it is likely that the low-level coverage
of the available ADS-B receiver network is poorer than that of the NATS secondary radar network.
Based on the results of this trial, it can be seen that the quality of non-certified GPS is sufficient
for use in enhancing visual acquisition / electronic conspicuity of general aviation. There was no
identified impact on the current or planned UK ATC use of 1090MHz / regulated uses of
surveillance on 1090MHz, although it makes sense to ensure some form of periodic monitoring of
installations to ensure transmission remain of suitable quality.

NATS
GA ADS-B ◊ v2.1 December 2015 Page 7 of 58
Therefore, General Aviation should be encouraged forthwith to enable ADS-B from capable
transponders to start creating an ADS-B based EC environment to support the introduction of
dedicated EC devices, such as NATS LPAT.
NATS
GA ADS-B ◊ v2.1 December 2015 Page 8 of 58
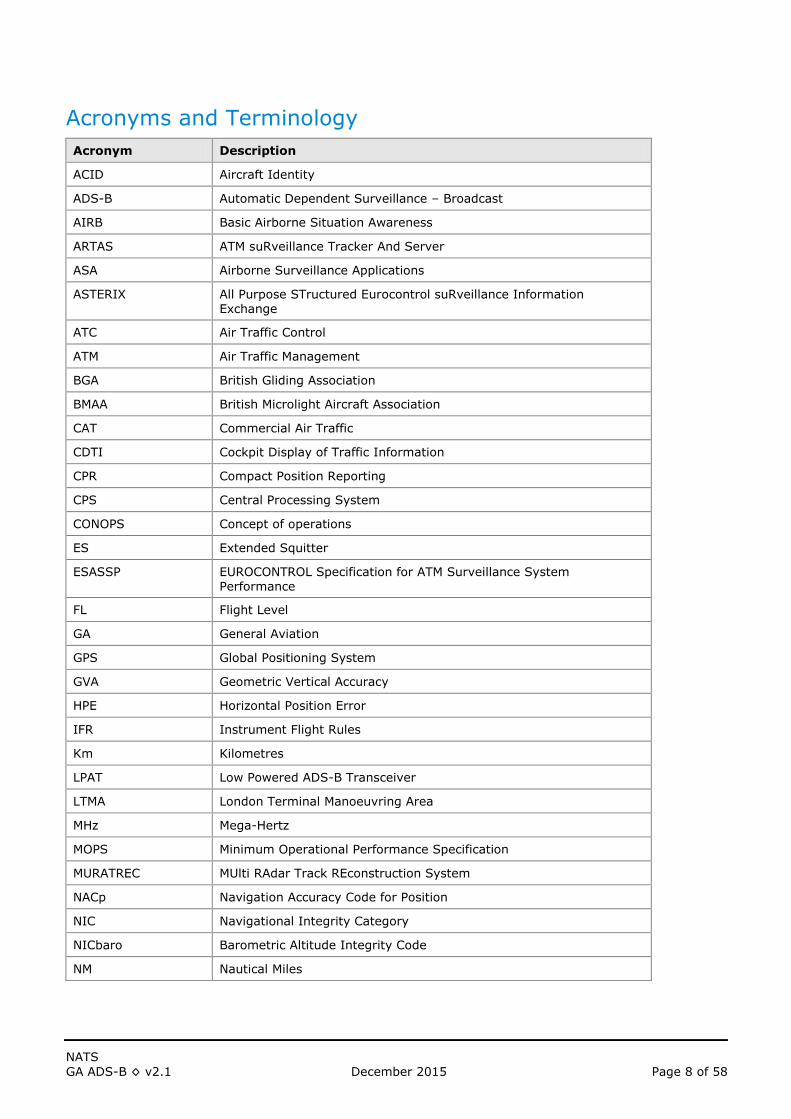
Acronyms and Terminology
Acronym Description
ACID Aircraft Identity
ADS-B Automatic Dependent Surveillance – Broadcast
AIRB Basic Airborne Situation Awareness
ARTAS ATM suRveillance Tracker And Server
ASA Airborne Surveillance Applications
ASTERIX All Purpose STructured Eurocontrol suRveillance Information Exchange
ATC Air Traffic Control
ATM Air Traffic Management
BGA British Gliding Association
BMAA British Microlight Aircraft Association
CAT Commercial Air Traffic
CDTI Cockpit Display of Traffic Information
CPR Compact Position Reporting
CPS Central Processing System
CONOPS Concept of operations
ES Extended Squitter
ESASSP EUROCONTROL Specification for ATM Surveillance System Performance
FL Flight Level
GA General Aviation
GPS Global Positioning System
GVA Geometric Vertical Accuracy
HPE Horizontal Position Error
IFR Instrument Flight Rules
Km Kilometres
LPAT Low Powered ADS-B Transceiver
LTMA London Terminal Manoeuvring Area
MHz Mega-Hertz
MOPS Minimum Operational Performance Specification
MURATREC MUlti RAdar Track REconstruction System
NACp Navigation Accuracy Code for Position
NIC Navigational Integrity Category
NICbaro Barometric Altitude Integrity Code
NM Nautical Miles
NATS
GA ADS-B ◊ v2.1 December 2015 Page 9 of 58
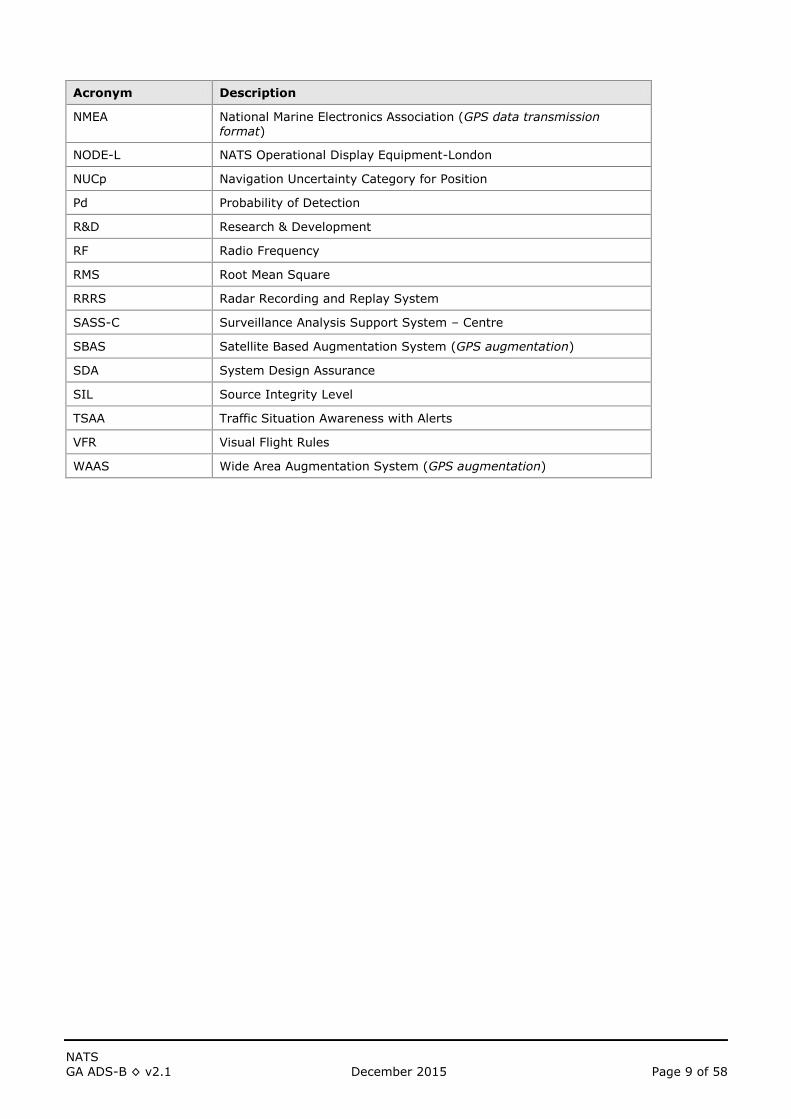
Acronym Description
NMEA National Marine Electronics Association (GPS data transmission format)
NODE-L NATS Operational Display Equipment-London
NUCp Navigation Uncertainty Category for Position
Pd Probability of Detection
R&D Research & Development
RF Radio Frequency
RMS Root Mean Square
RRRS Radar Recording and Replay System
SASS-C Surveillance Analysis Support System – Centre
SBAS Satellite Based Augmentation System (GPS augmentation)
SDA System Design Assurance
SIL Source Integrity Level
TSAA Traffic Situation Awareness with Alerts
VFR Visual Flight Rules
WAAS Wide Area Augmentation System (GPS augmentation)

NATS
GA ADS-B ◊ v2.1 December 2015 Page 10 of 58
1 Introduction
1.1 Purpose
This report details the results and findings of the recent CAA backed study to assess the quality of
Automatic Dependent Surveillance – Broadcast (ADS-B) data. Specifically; ADS-B generated by
general aviation (GA) airframes equipped with Mode S transponders capable of extended squitter
(ES) and where the broadcast position information is taken from a non-certified Global Positioning
System (GPS) source.
1.2 Trial background
Controlled airspace infringements by non-transponding aircraft, in ATC surveillance terms
referred to as ‘primary’ only contacts, pose a significant risk to NATS operations, particularly at
low level within the London Terminal Manoeuvring Area (LTMA).
The risk posed by these infringing aircraft could be more readily managed if they were clearly
identifiable from clutter and other artefacts inherent with primary only returns. Cooperative
surveillance, facilitated by transponder equipage, is currently the only option available to reduce
this risk. However the uptake of Mode S transponders within the lower end of the GA market,
viz. those aircraft which do not require access to airspace requiring transponder equipage is low.
This is seen to be on grounds of transponder cost, weight, availability of electrical power,
airframe constraints and a perceived lack of user benefit.
However, any improvement in electronic situational awareness will not be fully realised until other
GA aircraft already equipped with transponders also provide ADS-B data. Although LPAT can
provide non-directional proximity warnings against nearby Mode A/C/S transponders based on
signal strength.
Therefore, NATS R&D and Swanwick Safety are exploring the provision of ADS-B by GA users
already equipped with extended squitter capable Mode S transponders, but lacking the connection
to a GPS source. Currently within the GA domain, equipping with an aeronautical certified GPS
receiver is often economically prohibitive due to the units cost typically starting from around
£2,500 ref (6), installation and aircraft downtime costs. The unit costs are in part driven by the
certification costs and increased part costs. Certified GPS units enable the provision of ADS-B
quality indicators for integrity and development assurance to support the provision of separation
services.
GPS receivers not certified for aeronautical navigation have a significantly lower cost, but due to
historical guidance by the CAA have not been permitted to be connected to Mode S transponders
capable of broadcasting ADS-B. This is because they typically lack certain features and
capabilities required by the applicable GNSS and ADS-B MOPS and MASPS applicable to certified
units, most notably GPS integrity and interference protection mechanisms for the 1090MHz band.
This trial, in agreement with the CAA, will explore the quality of ADS-B position information
provided by GA airframes equipped with non-certified GPS receivers connected to Mode S
transponders capable of broadcasting extended squitter messages.
1.3 Trial Aim
The overarching aim of the trials is to assess the intrinsic quality of ADS-B horizontal positions
and associated quality indicators derived from non-certified GPS receivers.

NATS
GA ADS-B ◊ v2.1 December 2015 Page 11 of 58
1.3.1 Trial Objectives
The trial objectives are:
Gather and collate empirical evidence as to the quality of ADS-B data items transmitted by
participant GA airframes equipped with non-certified GPS receivers connected to ES capable
Mode S Transponders
To specifically assess;
o Accuracy (e.g. position error referenced to secondary radar, altitude and
identification) of the reported ADS-B data content,
o Track continuity (e.g. large deltas between consecutive reports…),
o Correct setting of parameters (e.g. Quality indicators should be set to zero for non-
certified GPS sources),
o Reporting of false data (e.g. population of Selected Flight Level (SFL))
o Frequently reported information.
Identify nominal quality data,
Identify frequency of trial ‘worst case’ data and assess and/or identify its potential impact
on NATS systems,
Investigate any significant failings in data quality to determine the root causes (e.g. GPS
receiver, transponder model or version, or receiver and Transponder combination),
To assess the interest of GA users in ‘situational awareness’ applications that augment the
pilots ability to visually acquire nearby traffic,
Assess the reliability of the data over time (e.g. does the data degrade?)
1.4 Scope
The initially envisaged scope of the trial was to undertake the connection of existing Mode S ES
transponder installations to a non-certified GPS source within any powered or non-powered
airframes.
Following discussions with a number of transponder manufacturers this aspiration was limited to a
subset of manufacturers’ transponder equipment, so as to ensure that the certification and
warranties of certain existing Mode S ES transponders were not invalidated. This unfortunately
led to a number of applicants being excluded.
GA Aircraft fitted with certified GPS units were also excluded as they would misrepresent the
quality provided by non-certified GPS sources. However, a dataset of airframes with certified GPS
sources was used as a baseline for comparison of the non-certified units. These airframes were
identified from a DO-260B/ED-102A (5) ‘whitelist’ of Mode S addresses supplied by
EUROCONTROL.
The trial was open to both EASA regulated and nationally regulated airframes. The trial did not
seek to demonstrate that the use of non-certified GPS is safe for use in any type of aviation or
ATC safety relevant service or application.
NATS
GA ADS-B ◊ v2.1 December 2015 Page 12 of 58
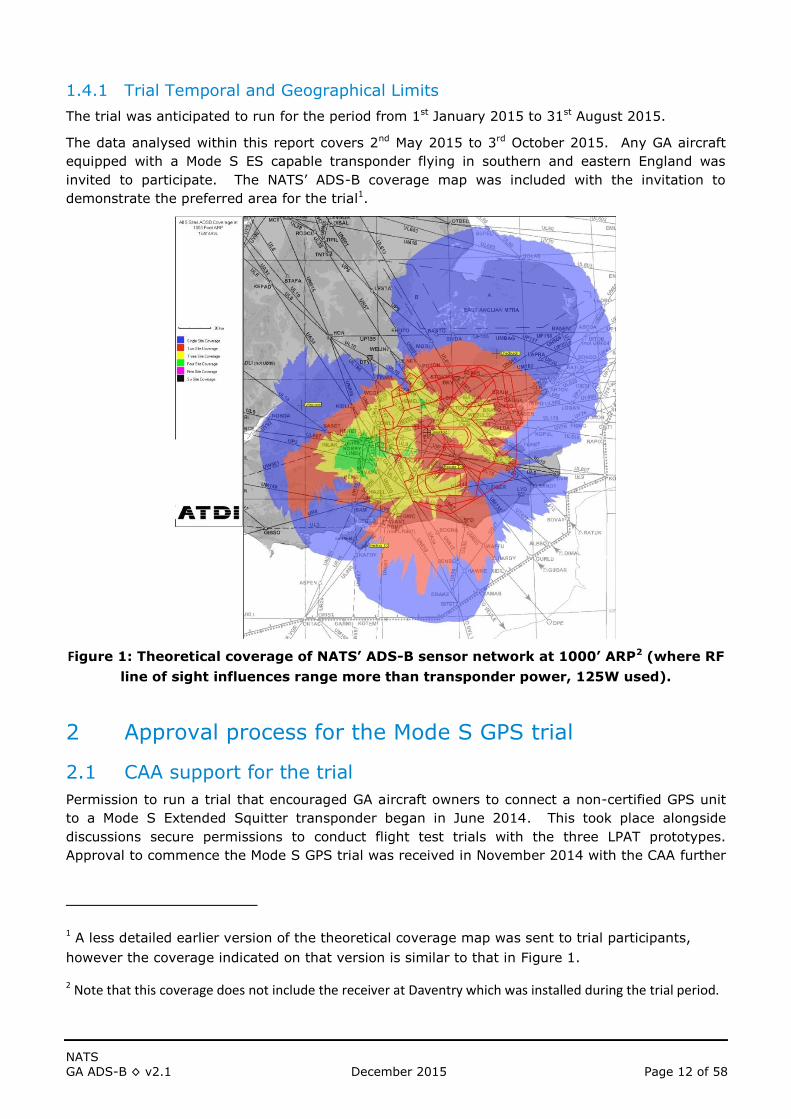
1.4.1 Trial Temporal and Geographical Limits
The trial was anticipated to run for the period from 1st January 2015 to 31st August 2015.
The data analysed within this report covers 2nd May 2015 to 3rd October 2015. Any GA aircraft
equipped with a Mode S ES capable transponder flying in southern and eastern England was
invited to participate. The NATS’ ADS-B coverage map was included with the invitation to
demonstrate the preferred area for the trial1.
Figure 1: Theoretical coverage of NATS’ ADS-B sensor network at 1000’ ARP2 (where RF
line of sight influences range more than transponder power, 125W used).
2 Approval process for the Mode S GPS trial
2.1 CAA support for the trial
Permission to run a trial that encouraged GA aircraft owners to connect a non-certified GPS unit
to a Mode S Extended Squitter transponder began in June 2014. This took place alongside
discussions secure permissions to conduct flight test trials with the three LPAT prototypes.
Approval to commence the Mode S GPS trial was received in November 2014 with the CAA further
1 A less detailed earlier version of the theoretical coverage map was sent to trial participants,
however the coverage indicated on that version is similar to that in Figure 1.
2 Note that this coverage does not include the receiver at Daventry which was installed during the trial period.

NATS
GA ADS-B ◊ v2.1 December 2015 Page 13 of 58
demonstrating their support for this trial by agreeing to waive their minor modification fees for
the trial participants. This gesture was a key element for the success of the trial.
2.2 Transponder manufacturers’ support for the trial
Trig Avionics and Funke Avionics responded positively to the technical support request and
provided extensive information for connecting and configuring their respective transponders.
Some avionics manufacturers questioned the impact on the certification of the transponder in the
trial and were therefore reluctant to support the trial or allow users with their devices to
participate in the trial.
2.3 Invitation to participate in the trial
The trial initially started by contacting flying clubs. The contact list was constructed from the
“Flyer” distribution list provided by Ian Seager. The Flyer distribution list was in a non-standard
database format and the contact points were a mixture of email, postal and web page types. It
was a very ‘mandraulic’ exercise to construct a usable list and to contact 163 flying clubs through
the variety of contact points.
The response from the invitation to the flying clubs was very low with only three clubs responding
and none of them had aircraft with compatible transponders.
A decision was taken to broaden the scope of the trial to include all GA pilots3. A great majority
of the responses came from owners of Annex II aircraft so NATS, the CAA, the LAA, the BMAA
and the BGA held joint discussions to propose a process for submitting and approving a minor
modification, which allowed an aircraft owner to connect a non-certified GPS source to a Mode S
ES transponder.
An overview of the process flow for LAA participants can be found in Appendix A2. The process
flow for BGA and BMAA participants was essentially identical to the LAA process except the owner
had to consult their respective association.
3 Methodology
3.1 Data collection
The comparative assessment of the reported ADS-B messages necessitated that the trial was
limited to southern and eastern England where the NATS R&D ADS-B receiver network could
provide overlapping coverage with NATS secondary surveillance radar.
This report compares the ADS-B and NATS NODE-L4 track data for the airframes of interest
(approved GA Trial aircraft and certified DO-260B/ED-102A (5) compliant aircraft) from the 2nd of
May 2015 to 3rd of October 2015 (156 days).
Nine GA airframes were used in the comparative assessment of ADS-B based on un-certified GPS
Analysis
3 Due to the manner in which the trial was publicised and coordinated, there were delays in
replying to applicants who had applied via different routes.
4 NODE-L is the current multi-radar track surveillance source for NATS provision of 3 NM
separation services in the LTMA.
NATS
GA ADS-B ◊ v2.1 December 2015 Page 14 of 58
The ADS-B messages were recorded from six receiver ground stations located in the South of
England into a single stream of ASTERIX CAT021 v2.1 data (see Figure 1 in section 1.4.1).
It should be noted that raw ADS-B position reports are different to those reported in the ASTERIX
CAT021 data. In the raw ADS-B broadcast the WGS84 latitude and longitude is encoded using
‘compact position reporting’ (CPR) in consecutive ‘odd and even’ ADS-B position message reports
to reduce the bandwidth required to continually broadcast what is essentially small changes in
position from the aircraft. Different data collections are broadcast in different messages. The
ASTERIX records assessed within this report concatenate several ADS-B reports into a single line
of data.
The Multi-radar tracker output of NODE-L recorded in ASTERIX CAT062 format was used as the
comparator ’truth track’.
In formal radar assessments undertaken by the NATS Radar Analysis Team; the MURATREC tool
within the SASS-C analysis suite is used to provide the ’truth track’, as given the benefit of
hindsight of contributing radar sources, the accuracy of the reconstructed trajectory is better than
that of the multi-radar tracker. Typically 99.9% of horizontal position errors for NODE-L are less
than 200m (99% are less than 100m) which only slightly larger than for MURATREC accuracy,
when certain effects in turns are excluded.
However, as SASS-C analysis is resource intensive and given the large number of data samples to
be analysed and as this is an R&D study to look at the feasibility of non-certified ADS-B, a
simplified comparison5 between the NODE-L track data was deemed tolerable. If feasible, further
validation work would be required to ensure the system was fit for purpose.
Several data processing scripts, spread sheets and statistical and geographical software packages
were used to convert the ASTERIX CAT021 and CAT062 binary data in to text readable format,
process, calculate and compare the metrics listed in section 3.3.
To put the results from the non-certified GPS into context, ADS-B data from DO-260B/ED-102A
(5) compliant airframes with certified GPS receivers were used as a comparison baseline. The
‘whitelist’ of the airframes was produced by EUROCONTROL and compiled in September 2015.
This list contained 1,935 Mode S addresses, of which 878 were detected within a spatially filtered
coverage assessment volume. A spatial filter was necessary due to the large proportion of
aircraft in the baseline comparator fleet undertaking high-level typically straight and level en-
route flights over the UK, which is in contrast to the low level often manoeuvring GA flights in the
trial. The spatial filter rejects all data plots above FL100 and outside of a rectangle bounded by
WGS84 coordinates 002E, 003W, 53N and 50.5N.
A number of the charts used within the assessment display the metrics in terms of ‘fraction of
total ADS-B plots’ to allow direct population comparison between the non-certified GA and
certified baseline fleets.
5 The simplified comparison did not exclude turns from the analysis as the typical flight of GA
aircraft involves many turns.

NATS
GA ADS-B ◊ v2.1 December 2015 Page 15 of 58
3.2 Surveillance requirements
The appropriate European requirements for ATC TMA separation surveillance performance is given by ESASSP (see ref(1) and (2)).
Although the ADS-B derived position data will not be used for separation provision, the measurements recorded in the trial will be assessed
to the following applicable ESASSP requirements below, for compliance to highlight limitations of the data.
Requirement Description Evaluation criteria Assessment Justification
3N_C-R1 Measurement interval for probability
of update assessments (R2, R7 and
R14)
Less than or equal to 5 seconds Assessment uses 4 seconds (however
ADS-B broadcasts position
approximately twice a second;
odd/even broadcasts)
3N_C-R2 Probability of update of horizontal
position
Greater than or equal to 97% for 100%
of the flights, any flight below 97%
shall be investigated as defined in R22
Assessed
3N_C-R3 Ratio of missed 3D position involved
in long gaps (larger than 16.5 s = 3 x
5 s + 10%)
Less than or equal to 0.5 % Assessed
3N_C-R4 Horizontal position RMS error Less than or equal to 300 metres global
and less than 330 metres for 100% of
the flights, any flight below 550 m shall
be investigated as defined in R22
Assessed
3N_C-R5 Ratio of target reports involved in sets
of 3 consecutive correlated horizontal
position errors larger than 555 m -
0.3 NM
Less than or equal to 0.03 % Assessed
3N_C-R6 Relative time of applicability of
horizontal position for aircraft in close
proximity (less than 11110 m - 6 NM)
Less than or equal to 0.3 seconds RMS N/A: Out of scope of assessment.
3N_C-R7 Probability of update of pressure
altitude with correct value
Greater than or equal to 96 % global N/A: Out of scope of assessment.
3N_C-R8 Forwarded pressure altitude average
data age (see Note 7 in § 3.4.5)
Less than or equal to 2.5 seconds N/A

NATS
GA ADS-B ◊ v2.1 December 2015 Page 16 of 58
3N_C-R9 Forwarded pressure altitude
maximum data age Any forwarded pressure altitude data
item with an age greater than or equal
to 16 s shall be considered as not
available when assessing R3, R7, R8
and R10
N/A: Out of scope of assessment.
3N_C-R10 Ratio of incorrect forwarded pressure
altitude (see Note 7 in § 3.4.5) Less than or equal to 0.1 % N/A: Out of scope of assessment.
3N_C-R11 Pressure altitude unsigned error (see
Note 7 in § 3.4.5)
Less than or equal to 200/300 ft in
99.9% of the cases for stable flights
and less than or equal to 300 ft in
98.5% of the cases for
climbing/descending flights
Assessed.
3N_C-R12 Delay of change in emergency
indicator/SPI report
Less than or equal to 7.5 s for 100% of
the cases, case above 7.5 s shall be
investigated as defined in R22
N/A: Instances of SPI in sample will be
investigated.
3N_C-R13 Delay of change in aircraft identity Less than or equal to 15 s for 100% of
the cases, case above 15 s shall be
investigated as defined in R22
N/A: Assessment of aircraft identity
matches will be undertaken.
3N_C-R14 Probability of update of aircraft
identity with correct value (see Note 8
in § 3.4.5)
Greater than or equal to 98 % global Assessed.
3N_C-R15 Ratio of incorrect aircraft identity Less than or equal to 0.1 % Not assessed.
3N_C-R16 Rate of climb/descent RMS error Less than or equal to 250 ft/mn for
stable flights and less than or equal to
500 ft/mn for climbing/descending
flights
N/A: Out of scope
3N_C-R17 Track velocity RMS error Less than or equal to 4 m/s for straight
line and less than or equal to 8 m/s for
turn
N/A: Out of scope
3N_C-R18 Track velocity angle RMS error Less than or equal to 10° for straight
line and less than or equal to 25° for
turn
N/A: Out of scope

NATS
GA ADS-B ◊ v2.1 December 2015 Page 17 of 58
Table 1: ESASSP requirements
Note: A number of the requirements are out of scope as it is anticipated that ADS-B data for ATC separation services would be fed into a
tracker prior to display on an ATCO’s terminal. As such the requirements would be made at the tracker level rather than the on the raw
data.
3.2.1 Airborne surveillance applications
In addition to assessment against the ESASSP requirements, the assessment will also consider the requirements established for the
airborne surveillance applications of EvAcq/AIRB (Enhanced visual Acquisition / Basic Airborne Situation Awareness) and TSAA (Traffic
Situational Awareness with Alerts) as specified in ED-194A (10).
3N_C-R19 Density of uncorrelated false target
reports
Less than or equal to 2 false target
reports per area of 100 NM2 and over a
duration of 720 applicable
measurement intervals
N/A: Out of scope
3N_C-R20 Number per hour of falsely confirmed
track close to true tracks
Less than or equal to 1 falsely
confirmed track per hour that are
closer than 16700 m - 9 NM from true
tracks
N/A: Out of scope
3N_C-R21 Continuity (probability of critical
failure)
Less than or equal to 2.5 10-5 per hour
of operation
N/A: Out of scope
3N_C-R22 Investigations Flights/cases for which requirements
R2, R4, R12 or R13 are not achieved
shall be investigated and an impact
assessment conducted and appropriate
risk mitigation/reduction measures
introduced if necessary.
N/A: Out of scope

NATS
GA ADS-B ◊ v2.1 December 2015 Page 18 of 58
3.3 Metrics
This section provides an overview of the metrics collected in the trial to support the assessment
of the requirements listed in section 3.2.
3.3.1 Horizontal position error
ADS-B data item compared: ASTERIX I021/130 (Position in WGS-84 co-ordinates).
Assessed against ESSASP 3N_C-R4.
The horizontal position error, along track and across track errors6 were computed against a
‘pseudo radar plot’ taken along the interpolation between two consecutive radar plots for the
same ADS-B position receive time. The horizontal position error is the absolute distance between
the ADS-B reported position and the pseudo radar plot. An example of this process is given in
Figure 2 below.
Figure 2: Overview of horizontal position error (HPE) assessment
3.3.1.1 Along track error
The along track error is the component of the horizontal position error of a direct, straight line
course between the two consecutive radar plots. See Figure 2 above. It is expected that due to
delays between the transponder broadcasting the position in the ADS-B message, the distribution
of the along track error will be shifted negatively from the track position.
6 This document uses the term ‘error’ to describe the distances measured between the ADS-B
reported position and the NODE-L tracked position; however for some consecutive error instances
it is not possible to determine whether it is the ADS-B positions or track positions that are in
error.

NATS
GA ADS-B ◊ v2.1 December 2015 Page 19 of 58
3.3.1.2 Across track error
The across track error is the component of the horizontal position error that is tangential to the
interpolation between the two consecutive radar plots. See Figure 2 above. It is expected that
the across track distribution will follow a Gaussian distribution centred on the interpolation of the
track data.
3.3.2 Consecutive errors
Assessed against ESASSP 3N_C-R5.
Consecutive errors are a concern as infrequent single large plot deviations can often be
considered as outliers by a tracking algorithm or visually discarded by controllers. Consecutive
errors, can cause credible corruption of the tracker output, and therefore present a significant
concern.
3.3.3 Probability of Update
Assessed against ESASSP 3N_C-R2 and 3N_C-R3.
The ‘probability of update’ metric is used to demonstrate that the position is consistently reported
to, and received by the ATC surveillance tracking systems. Infrequent and/or sporadic updates
could generate an erroneous or confusing display picture to air traffic controllers. It should be
noted that the probability of update can be affected by the detection coverage of the ground
systems and/or the reporting capabilities of the airframes assessed.
3.3.4 Mode C
ADS-B data item compared: ASTERIX I021/145.
Assessed against ESASSP 3N_C-R11.
The ‘Mode C’ metric measures the difference between the Mode C (FL) reported by the
interrogation of the transponder (Mode S) and the flight level broadcast via ADS-B. It is not
anticipated that this will be different given the same source of the data.
3.3.5 Ground speed
ADS-B data item compared: ASTERIX I021/160 Airborne Ground Vector.
The ADS-B ground speed measurement is derived from the GPS of the airframe, while the radar
groundspeed measurement is based on the tracking of successive radar plots. This metric
records the difference between the two measurements.
3.3.6 Altitude reporting capability
ADS-B data item examined ASTERIX I021/040 Target Report Descriptor
The altitude reporting capability details whether the aircraft is providing 25ft or 100ft reporting
capability via ADS-B.
3.3.7 Mode A
ADS-B data item compared: ASTERIX I021/070 Mode 3/A Code.
Assessed against ESASSP 3N_C-R14.

NATS
GA ADS-B ◊ v2.1 December 2015 Page 20 of 58
This metric records whether the four digit octal identification code provided via ADS-B matches
the code derived via interrogation of the transponder (Mode S). It is not anticipated that this will
be different given the same source of the data.
3.3.8 Aircraft identification
ADS-B data item compared: ASTERIX I021/170 Target Identification.
Assessed against ESASSP 3N_C-R14.
This metric records whether the eight character aircraft identification (ACID) provided via ADS-B
matches the ACID derived via interrogation of the Mode S transponder.
3.3.9 MOPS version
ADS-B data item examined: ASTERIX I021/210.
Minimum Operational Performance Specification version (MOPS) ‘Version 0’ is given to aircraft
compliant with DO-260, ‘version 1’ with DO-260A and ‘version 2’ Do-260B / ED-102A (5). All
participant aircraft are either ‘version 1’ ‘version 2’; it should be noted however that if the
message type field that reports the MOPS capability has not been received for a while the ADS-B
CPS will assume the MOPS capability is ‘version 0’.
3.3.10 Navigational Integrity Category
ADS-B data item examined: ASTERIX I021/090.
Navigational Integrity Category (NIC) is quality indicator provided by ADS-B installations
compliant with MOPS ‘version 1’ and ‘version 2’. The indicator provides the containment radius of
the reported position (similar to RNP containment radius). The NIC is reported in conjunction
with the SIL (see section 3.3.12).
For the purposes of the trial the airframes were permitted to participate if either the NIC and / or
the SIL were set to zero to indicate ‘no integrity’ of the reported ADS-B position.
Table 2: NIC quality indicator values (ref(7))
3.3.11 Navigation Accuracy Code for position
ADS-B data item examined: ASTERIX I021/090.

NATS
GA ADS-B ◊ v2.1 December 2015 Page 21 of 58
Navigation Accuracy Code for position (NACp) provides the expected accuracy of the reported
geometric position.
Table 3 below details the breakdown of NACp possible values.
Table 3: NACp quality indicator values (ref (7))
3.3.12 Source Integrity Level
ADS-B data item examined: ASTERIX I021/090
Source Integrity Level (SIL) is an ADS-B quality indicator that is complementary to the NIC. The
SIL specifies the probability of the actual position lying outside of the containment radius
specified by the NIC without alerting the flight crew.
3.3.13 Priority status
ADS-B data item examined: ASTERIX I021/200 (Target Status)
Priority status (PS) bits are set to indicate an emergency on the airframe.
As an emergency within the trial is an unlikely event, any indication of the PS bits would be
investigated for authenticity.
NATS
GA ADS-B ◊ v2.1 December 2015 Page 22 of 58
4 Results
4.1 Overview
Nine general aviation aircraft were accepted into the GPS Trial on a rolling basis from April 2015.
This comparative assessment examines 156 days of data collected between 1st of May 2015 to 3rd
of October 2015.
Spatial filtering was used to reduce aircraft performance variation between the datasets as a
result of effects observed in a previous assessment. This variation was due to the large
proportion of aircraft in the baseline comparator fleet undertaking high-level typically straight and
level en-route flights over the UK, which is in contrast to the low level often turning GA flights in
the trial. The spatial filter rejects all data plots above FL100 and outside of a rectangle bounded
by WGS84 coordinates 002E, 003W, 53N and 50.5N.
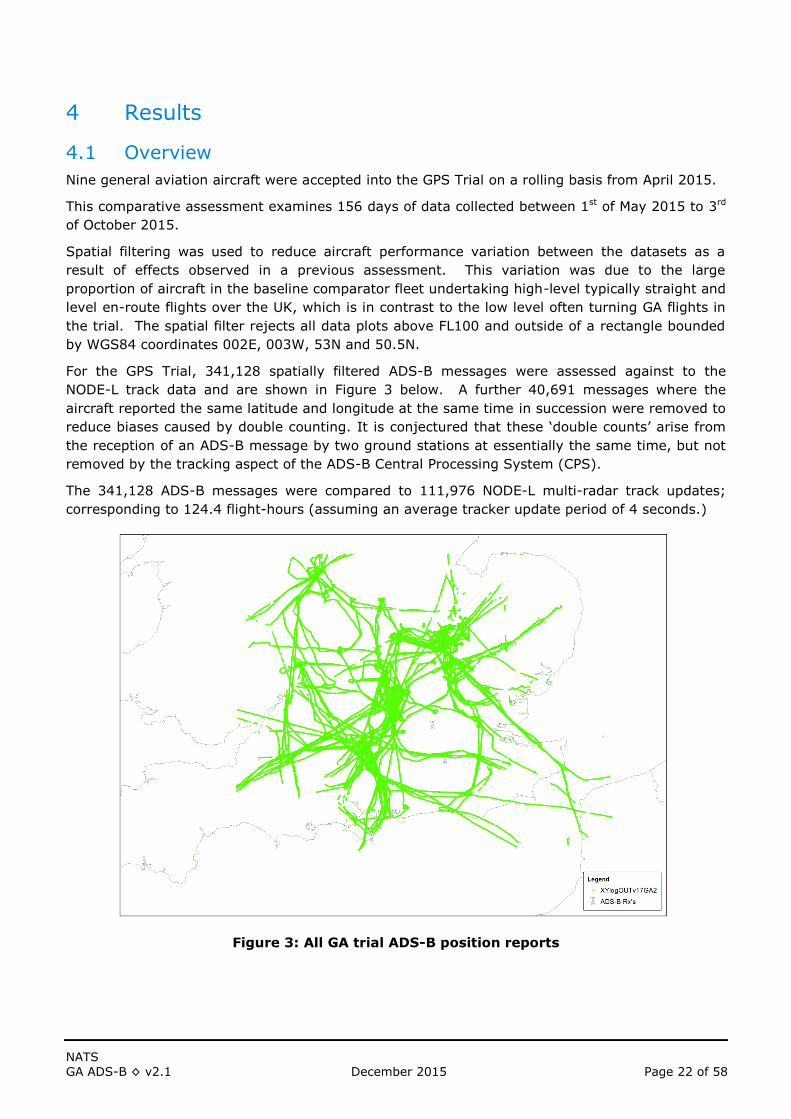
For the GPS Trial, 341,128 spatially filtered ADS-B messages were assessed against to the
NODE-L track data and are shown in Figure 3 below. A further 40,691 messages where the
aircraft reported the same latitude and longitude at the same time in succession were removed to
reduce biases caused by double counting. It is conjectured that these ‘double counts’ arise from
the reception of an ADS-B message by two ground stations at essentially the same time, but not
removed by the tracking aspect of the ADS-B Central Processing System (CPS).
The 341,128 ADS-B messages were compared to 111,976 NODE-L multi-radar track updates;
corresponding to 124.4 flight-hours (assuming an average tracker update period of 4 seconds.)
Figure 3: All GA trial ADS-B position reports
NATS
GA ADS-B ◊ v2.1 December 2015 Page 23 of 58
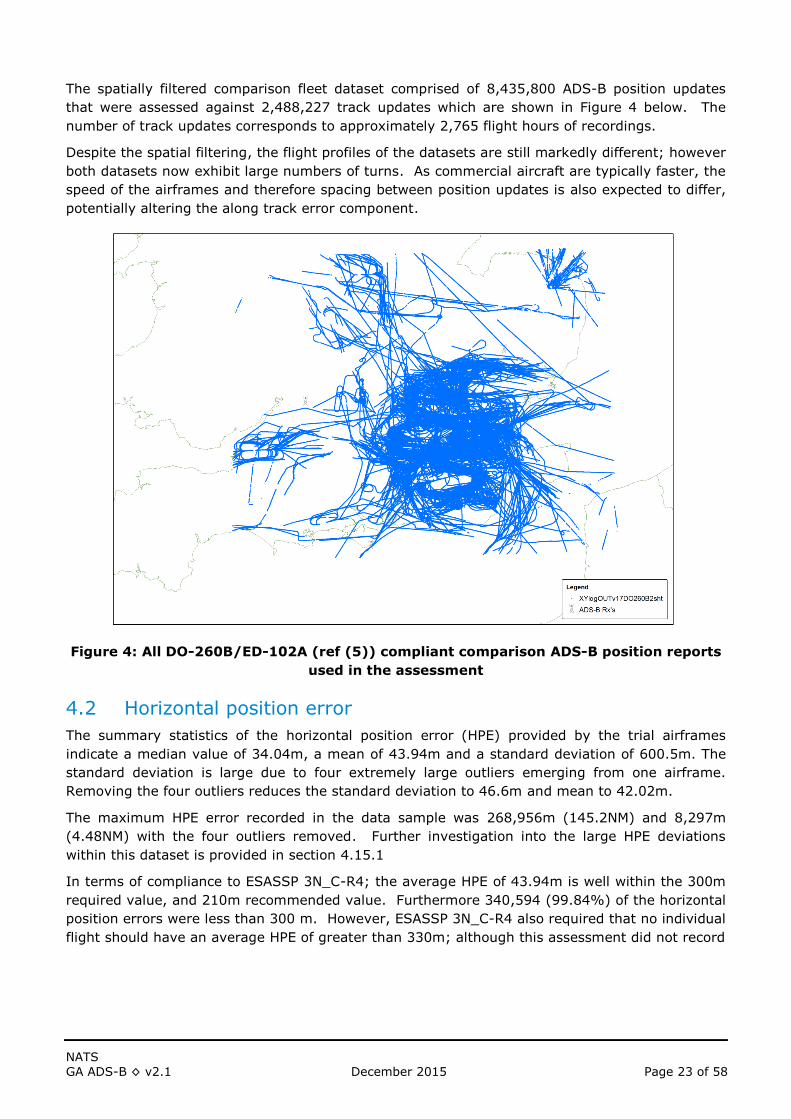
The spatially filtered comparison fleet dataset comprised of 8,435,800 ADS-B position updates
that were assessed against 2,488,227 track updates which are shown in Figure 4 below. The
number of track updates corresponds to approximately 2,765 flight hours of recordings.
Despite the spatial filtering, the flight profiles of the datasets are still markedly different; however
both datasets now exhibit large numbers of turns. As commercial aircraft are typically faster, the
speed of the airframes and therefore spacing between position updates is also expected to differ,
potentially altering the along track error component.
Figure 4: All DO-260B/ED-102A (ref (5)) compliant comparison ADS-B position reports
used in the assessment
4.2 Horizontal position error
The summary statistics of the horizontal position error (HPE) provided by the trial airframes
indicate a median value of 34.04m, a mean of 43.94m and a standard deviation of 600.5m. The
standard deviation is large due to four extremely large outliers emerging from one airframe.
Removing the four outliers reduces the standard deviation to 46.6m and mean to 42.02m.
The maximum HPE error recorded in the data sample was 268,956m (145.2NM) and 8,297m
(4.48NM) with the four outliers removed. Further investigation into the large HPE deviations
within this dataset is provided in section 4.15.1
In terms of compliance to ESASSP 3N_C-R4; the average HPE of 43.94m is well within the 300m
required value, and 210m recommended value. Furthermore 340,594 (99.84%) of the horizontal
position errors were less than 300 m. However, ESASSP 3N_C-R4 also required that no individual
flight should have an average HPE of greater than 330m; although this assessment did not record

NATS
GA ADS-B ◊ v2.1 December 2015 Page 24 of 58
metrics on individual flights, it did record metrics on each airframe where all airframes recorded
average HPE’s well within 300m (32.53m – 83.63m)7..
When compared to the DO-260B/ED-102A (5) compliant comparison fleet; 8,412,563 (99.7%) of
the 8,435,800 ADS-B messages had a horizontal position error of less than 300m, providing a
mean HPE of 40.35m. It should be noted that the ‘whitelist’ used to define the comparison fleet
contained 1,935 aircraft, of which 878 flew within the spatially filtered coverage assessment
volume and were therefore eligible for assessment. As was the case with the GA trial fleet, there
were several large outliers (max HPE was 216,000m) that increased the entire sample standard
deviation to 702.7m.
The location of the GA trial horizontal position errors greater than 300m, are highlighted in pink in
Figure 5 below. No statistical analysis has been conducted on the geographical location of the
HPE to ascertain any possible correlation
It was noticed that one particular airframe was contributing to the very large outliers observed.
Section 4.15.2 investigates the effect this airframe had on the horizontal position assessment.
Figure 5: GA Trial Horizontal Position Errors > 300m
The location of the HPE’s > 300m in the comparator dataset are displayed in Figure 6 below. The
figure indicates that two distinct collections of very large horizontal position errors. See section
4.15.2 for further investigation of these errors.
7 The requirement for ESASSP 3N_C-R4 is clearer in ESASSP volume 2 (2)

NATS
GA ADS-B ◊ v2.1 December 2015 Page 25 of 58
Figure 6: Comparator Horizontal Position Errors > 300 m
The summary statistics for the HPE recorded by the comparison fleet indicated a median value of
28.09m, a mean of 40.35m and a maximum value of 215,600m which contributed to giving a
standard deviation of 702.7.
A ‘1 – Cumulative Distribution Function’ of the horizontal position errors in each sample recorded
in the trial is displayed in Figure 7 below. Note the log scale on the y axis.

NATS
GA ADS-B ◊ v2.1 December 2015 Page 26 of 58
Figure 7: HPE distributions as ‘1 – Cumulative Distribution Function’ of total plots in
each dataset (log 10 scale), GA fleet in blue, Comparator fleet in red
In Figure 7 above, it can be seen that initially for low HPE values (less than 50m) the distributions
are quite similar. However, for HPE values between 50 and 300m, the comparator fleet is
observed to be more accurate than the GA trial fleet. Beyond 450m, the number of total plots
available in each sample to generate the fractions dominates, limiting the confidence in the
comparison. Both samples have long tail residuals.
Overall, the flatter distribution of the GA trial fleet indicates that the GA fleet has larger errors
and is therefore less accurate than the certified GPS comparator fleet. This is to be expected, as
these effects may be due to functions or installed nature of certified installations.
It should be noted that the analysis of the horizontal position error is conservative, as the ‘truth
track’ in this assessment is provided by the multi-radar tracker and is therefore subject to track
delay when aircraft begin to manoeuvre laterally, particularly in tight turns, such as those often
undertaken by the trial participants.8 Figure 8 below illustrates an example of this tracking delay
contributing to a large HPE. In this figure, the green triangles are the ADS-B position updates,
the pink circles are the ADS-B position updates identified with a HPE > 300m and the blue circles
are the pseudo radar points plotted along the interpolation between consecutive tracked radar
plots. The aircraft in this instance is undertaking a relatively tight left turn into its destination
8 Tracker derived turn direction information was not available for the GA trial aircraft so it was not possible to
assess the accuracy of turns or exclude turns from the analysis.

NATS
GA ADS-B ◊ v2.1 December 2015 Page 27 of 58
airfield and the tracker takes approximately four plots (actual track plots not displayed) to match
the ADS-B position updates on the turn.
Figure 8: Example of tracking delay identified as a HPE
Figure 8 also illustrates a ‘pulsing’ effect of spurts of ADS-B position updates in quick succession.
This effect should be investigated in an ADS-B compatible tracker for assessment e.g. ARTAS
V8B3.
Overall, the horizontal position error from the GA trial is slightly worse than the comparison fleet,
but still within the ESASSP requirements. However, this is overshadowed by several very large
single errors that are investigated further in section 4.15.1.
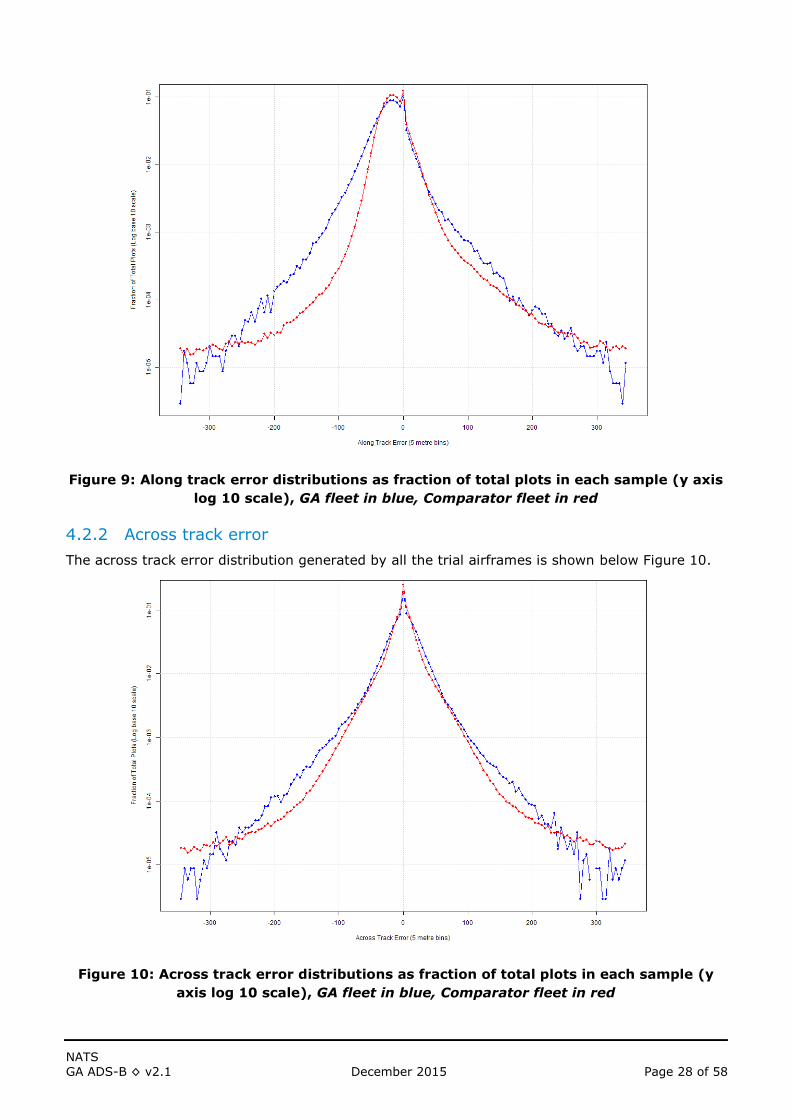
4.2.1 Along track error
The central peak of the along track error distributions of the GA trial fleet and comparison fleets
are of the same magnitude, indicating similar performance amongst the two fleets. The
distributions are asymmetric around zero and the difference between the two distributions is
greater on the negative side of the distribution. The reason for this disparity is unknown, but it is
reasoned that this is likely due to the electronics involved on the airframe delaying the measured
position.
The summary statistics of the along track error produced by the GA trial airframes indicated a
mean of -22.47m; however the largest negative value was -253,594m, the largest positive value
was 56,027m, which contributed to a standard deviation of 492m (removing the airframe that
caused the particularly large deviations reduced the standard deviation to 32m). The large
outliers are the same outliers identified in sections 4.2 and investigated further in section 4.15.1.
Although the comparison fleet along track error also had some outliers, the mean was found to be
-19.5m with the standard deviation 653m driven by the large outliers previously identified, the
minimum -215,585.95 being and the maximum 131,760.17. As with the GA fleet, further
investigation revealed that a particular airframe was causing the large deviations, removing this
airframe reduced the standard deviation to 175m. This investigation is detailed in section 4.15.2
A chart comparing the along track error of each fleet is provided in Figure 9 below.
NATS
GA ADS-B ◊ v2.1 December 2015 Page 28 of 58
Figure 9: Along track error distributions as fraction of total plots in each sample (y axis
log 10 scale), GA fleet in blue, Comparator fleet in red
4.2.2 Across track error
The across track error distribution generated by all the trial airframes is shown below Figure 10.
Figure 10: Across track error distributions as fraction of total plots in each sample (y
axis log 10 scale), GA fleet in blue, Comparator fleet in red

NATS
GA ADS-B ◊ v2.1 December 2015 Page 29 of 58
Overall a visual comparison of the core distributions between plus and minus 100m is near
identical although, as with the along track error, the flatter error distribution of the GA fleet is
also present in the across track error.
The mean of the trial airframes across track error was found to be -0.27m, with a standard
deviation of 346m, which was driven by the extreme outlier values of -127,527m and + 89,595m.
As investigated in section 4.15.1, removing one airframe from the analysis altered the maximum
across track error to 507m and the standard deviation to 33m.
The across track error of the comparison fleet was similar to of the trial participants, with a mean
value of -1.02m, and a standard deviation of 261m. The maximum outlier values was -51,893m.
4.3 Consecutive errors
In the trial data sample, there were 534 (0.156%) Horizontal position errors greater than 300m.
Of these, 228 (0.067%) instances were recorded where there were two or more consecutive
horizontal position errors of greater than 300m. This compares to 23,236 (0.275%) HPE’s
greater than 300m and 8,535 (0.101%) instances where there were two or more consecutive
HPE’s of greater than 300m in the comparison fleet, with the longest lasting for 316 position
reports.
The consecutive errors (and single HPE’s) as plotted in terms of fraction of total reports are
shown in Figure 11 below for both fleets.
Figure 11: Consecutive errors where HPE > 300m as the fraction of total plots (y axis
log 10 scale), GA fleet in blue, Comparator fleet in red

NATS
GA ADS-B ◊ v2.1 December 2015 Page 30 of 58
Figure 11 which is a log plot of the fraction of instances of consecutive errors against the number
of plots involved in each instance, indicates that the occurrence of <15 plot consecutive errors in
near identical in both fleets, however data is too limited to draw conclusions in the distribution
tails. The fact the distribution where available is similar for both fleets, indicates that the GA fleet
is not generating proportionally more consecutive errors than the certified fleet.
To assess compliance against ESASSP 3N_C-R5, albeit with errors > 300m rather than 550m, the
number of consecutive errors in the GA fleet with three or more updates was 130 (0.0004%) for
the trial and 4,294 (0.0005%) for the comparison fleet.
This indicates that even when using a stricter error threshold of 300m rather than 550m, the GA
participant airframes would still be compliant with this requirement, and both fleets are less than
one tenth of the requirement’s 0.03% criteria.
This result suggests that there is a very low chance that large errors in GA ADS-B horizontal
position could cause credible corruption under fault-free GPS conditions. However the magnitude
of the large horizontal position errors in both fleets suggests that a means of continual or
recurrent independent verification of the positions should be considered if the position reports
were to be used for separation provision, and strict mitigation or acceptability of impact studies
undertaken for simulated GPS fault conditions.
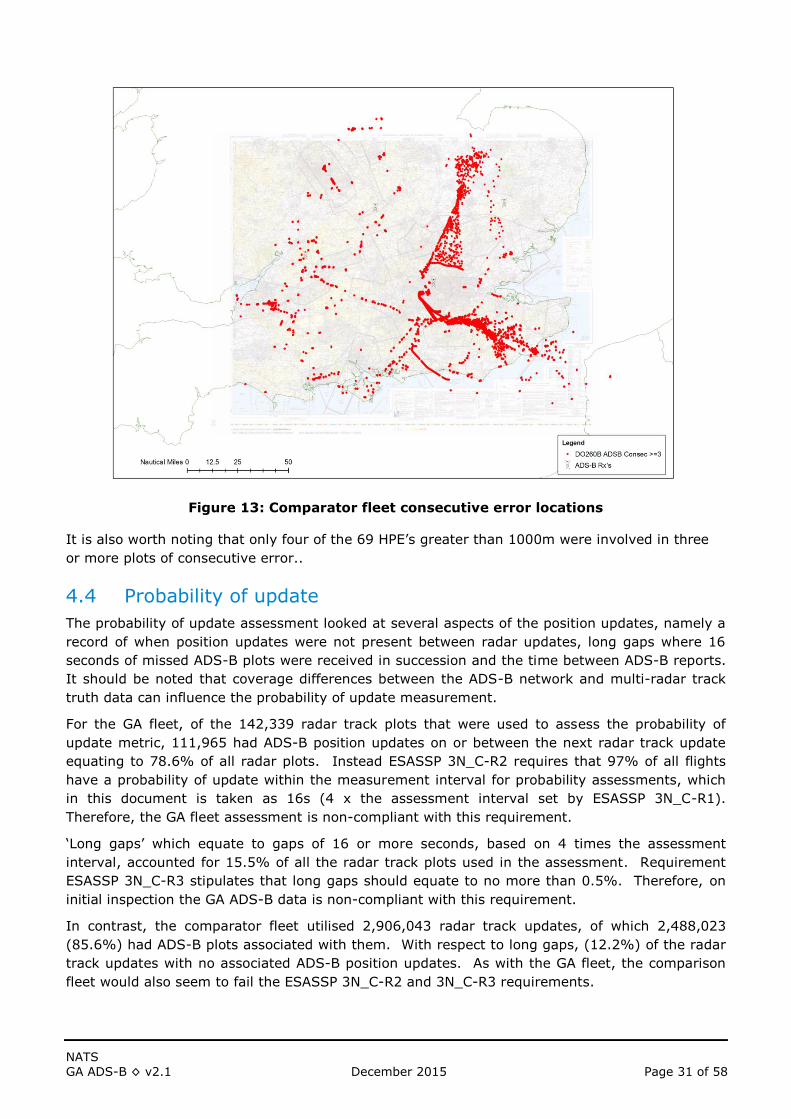
For reference the locations of consecutive errors recorded within the GA trial fleet and comparator
fleet are provided in Figure 12 and Figure 13 below:
Figure 12: GA trial consecutive error locations
NATS
GA ADS-B ◊ v2.1 December 2015 Page 31 of 58
Figure 13: Comparator fleet consecutive error locations
It is also worth noting that only four of the 69 HPE’s greater than 1000m were involved in three
or more plots of consecutive error..
4.4 Probability of update
The probability of update assessment looked at several aspects of the position updates, namely a
record of when position updates were not present between radar updates, long gaps where 16
seconds of missed ADS-B plots were received in succession and the time between ADS-B reports.
It should be noted that coverage differences between the ADS-B network and multi-radar track
truth data can influence the probability of update measurement.
For the GA fleet, of the 142,339 radar track plots that were used to assess the probability of
update metric, 111,965 had ADS-B position updates on or between the next radar track update
equating to 78.6% of all radar plots. Instead ESASSP 3N_C-R2 requires that 97% of all flights
have a probability of update within the measurement interval for probability assessments, which
in this document is taken as 16s (4 x the assessment interval set by ESASSP 3N_C-R1).
Therefore, the GA fleet assessment is non-compliant with this requirement.
‘Long gaps’ which equate to gaps of 16 or more seconds, based on 4 times the assessment
interval, accounted for 15.5% of all the radar track plots used in the assessment. Requirement
ESASSP 3N_C-R3 stipulates that long gaps should equate to no more than 0.5%. Therefore, on
initial inspection the GA ADS-B data is non-compliant with this requirement.
In contrast, the comparator fleet utilised 2,906,043 radar track updates, of which 2,488,023
(85.6%) had ADS-B plots associated with them. With respect to long gaps, (12.2%) of the radar
track updates with no associated ADS-B position updates. As with the GA fleet, the comparison
fleet would also seem to fail the ESASSP 3N_C-R2 and 3N_C-R3 requirements.

NATS
GA ADS-B ◊ v2.1 December 2015 Page 32 of 58
However, Figure 14 below shows the location of the radar plots associated with the ADS-B long
gaps in the GA trial. The chart is colour coded to Altitude, with red indicating 0ft and low level,
while green indicates 4000 - 5500ft. The spatial distribution of the plots indicates that for many
the lack of ADS-B could be due to lack of reception of the signals when the aircraft are at low
level. Investigation into the higher altitude long gaps, particularly near the ADS-B ground
stations indicates the reception of the reports ended abruptly.
It is not possible to stipulate what is causing the long gaps in the trial although low-level
coverage would appear to be a contributing factor in at least some of the instances (despite the
theoretical coverage) given the limited number of long gaps occurring in the centre of the
receiver network. Furthermore, a fault was subsequently identified with the Chedburgh receiver
which would limit low level coverage in the North East of the assessment area.
Figure 14: Radar plots of ADS-B 'long gaps' for the GA trial (colour coded by altitude,
overlaid on 500ft ARP theoretical ADS-B coverage)
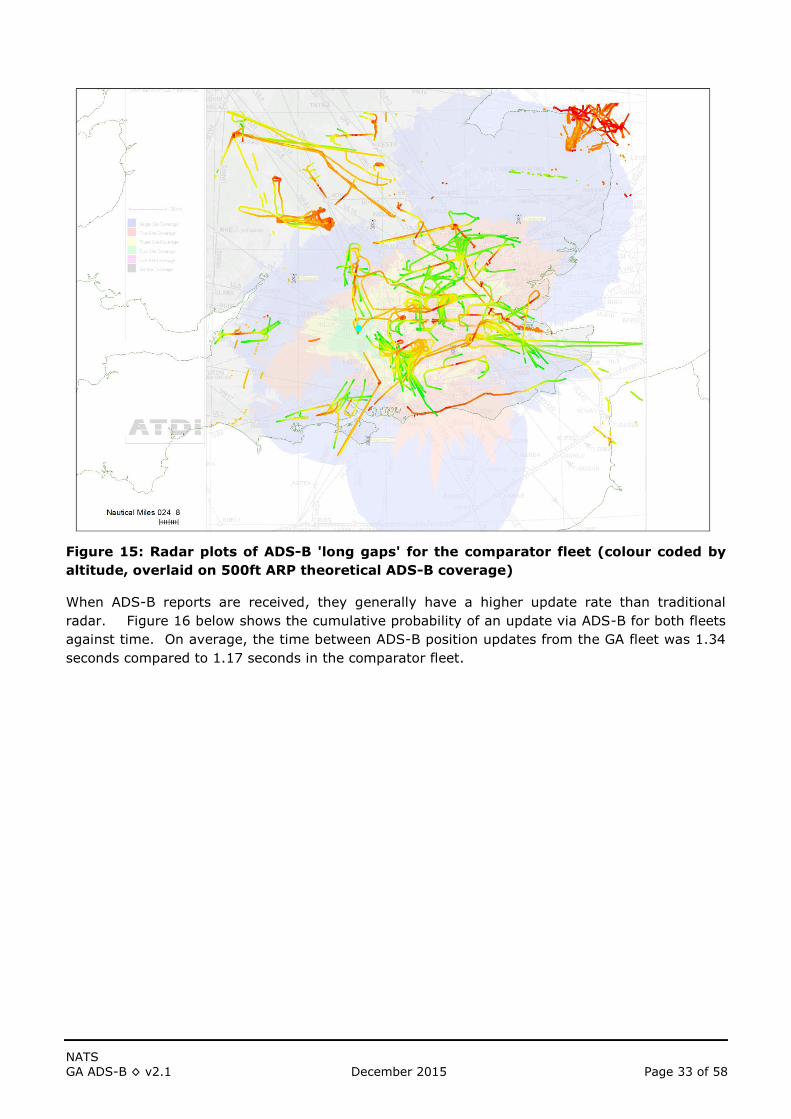
Plotting the long gaps from the comparator fleet in Figure 15 indicates two distinct locations
where the aircraft may have been below ADS-B coverage, but also that a number of tracks are
completely missing. The plot indicates that the majority of the tracks are headed into and away
from Farnborough, Northolt and Biggin Hill and Luton airports that are known hubs for business
aviation. A visual inspection of a sample of the aircraft ID’s of the aircraft involved in the long
gaps indicates that the majority are not for standard commercial flights, instead most likely
business aviation; which agrees with the destination and origin airports noted above, although
does not answer why this particular group of users would not provide ADS-B when expected to.
NATS
GA ADS-B ◊ v2.1 December 2015 Page 33 of 58
Figure 15: Radar plots of ADS-B 'long gaps' for the comparator fleet (colour coded by
altitude, overlaid on 500ft ARP theoretical ADS-B coverage)
When ADS-B reports are received, they generally have a higher update rate than traditional
radar. Figure 16 below shows the cumulative probability of an update via ADS-B for both fleets
against time. On average, the time between ADS-B position updates from the GA fleet was 1.34
seconds compared to 1.17 seconds in the comparator fleet.

NATS
GA ADS-B ◊ v2.1 December 2015 Page 34 of 58
Figure 16: Cumulative probability of time between position updates (GA is blue,
Comparator fleet is red)
4.5 Mode C & Altitude Reporting Capability
4.5.1 Mode C
The comparison of the reported Mode C (Flight level) was undertaken on the 341,125 (99.999%)
of messages where the Mode C value was recorded in the ADS-B data. The frequency distribution
of the Mode C error is shown in Figure 17 below.

NATS
GA ADS-B ◊ v2.1 December 2015 Page 35 of 58
Figure 17: Trial Mode C error distribution (y axis log 10 scale), GA fleet in blue,
Comparator fleet in red
The mean of the distribution was -12.04ft, while the standard deviation was 36.6ft. The largest
negative error recorded was -600ft, while the largest positive error was +750ft.
To assess compliance against ESASSP 3N_C-R11 (which required 99.9%); of the 341,125
messages where a Mode C value was provided by ADS-B; 341,107 (99.99%) were within 300ft of
the track value, meeting the requirement.
For reference, the comparison fleet also provided Mode C data via the ADS-B message for
99.999% of the 8,435,800 messages. The error distribution (shown against the trial fleet in
Figure 17 above) was greater than that of the GA trial airframes, with a mean of -10.06ft, a
standard deviation of 64.75ft, a largest negative error of -1075ft and largest positive error of
1750ft.
The figure shows that the distribution of the comparison fleet is flatter compared to the GA trial
fleet, which reflects the greater error in the Mode C value where 99.79% of the reports were
within 300ft. The kinematic characteristics of the two fleets could explain the asymmetric
difference observed, with higher climb and descent rates expected to be undertaken by the
comparator airframes compared to the GA airframes.
4.5.2 Altitude reporting capability (ARC)
All 341,128 ADS-B messages provided the ARC, of which 338,268 (99.16%) indicated an altitude
reporting capability of 25ft.
NATS
GA ADS-B ◊ v2.1 December 2015 Page 36 of 58
8,312,453 of the 8,435,800 (98.54%) the comparison airframes provided an altitude reporting
capability of 25ft, with the reaming 123,347 reporting ing 100ft capability.
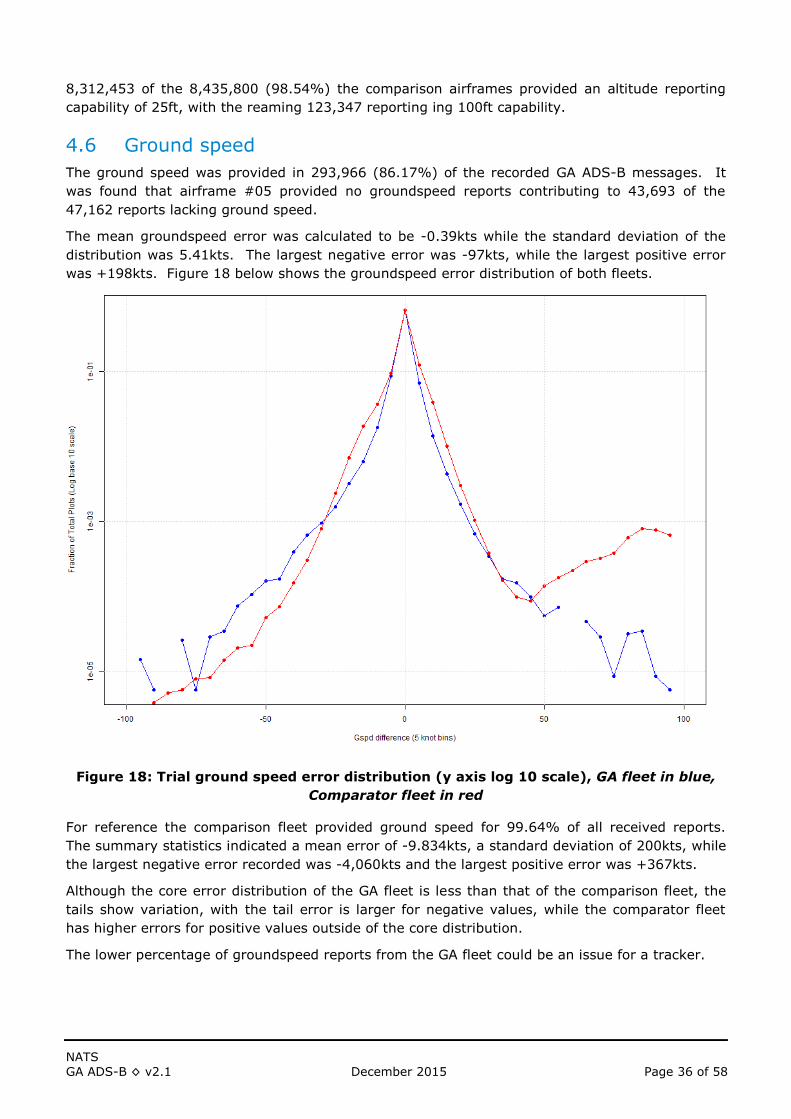
4.6 Ground speed
The ground speed was provided in 293,966 (86.17%) of the recorded GA ADS-B messages. It
was found that airframe #05 provided no groundspeed reports contributing to 43,693 of the
47,162 reports lacking ground speed.
The mean groundspeed error was calculated to be -0.39kts while the standard deviation of the
distribution was 5.41kts. The largest negative error was -97kts, while the largest positive error
was +198kts. Figure 18 below shows the groundspeed error distribution of both fleets.
Figure 18: Trial ground speed error distribution (y axis log 10 scale), GA fleet in blue,
Comparator fleet in red
For reference the comparison fleet provided ground speed for 99.64% of all received reports.
The summary statistics indicated a mean error of -9.834kts, a standard deviation of 200kts, while
the largest negative error recorded was -4,060kts and the largest positive error was +367kts.
Although the core error distribution of the GA fleet is less than that of the comparison fleet, the
tails show variation, with the tail error is larger for negative values, while the comparator fleet
has higher errors for positive values outside of the core distribution.
The lower percentage of groundspeed reports from the GA fleet could be an issue for a tracker.

NATS
GA ADS-B ◊ v2.1 December 2015 Page 37 of 58
4.7 Mode A
Although the Mode A code was provided in 341,101 (99.99%) ADS-B reports, the Mode A code
was not available in all of the corresponding radar track updates. As such only 237,818
(69.72%) ADS-B messages could be compared; of these 237,043 matched the Mode A code
provided by the tracker equating to 99.7% compliance.
For comparison the Mode A code could be assessed in 8,243,254 (97.72%) of all reports; of
these 8,238,488 (99.94%) of the Mode A codes matched that of the tracker.
For the trial ADS-B reports where the assessment against the track data could be made, the
99.7% code match which is within the requirement of 98% specified in ESASSP 3N_C-R14.
4.8 Aircraft identification
Aircraft identification was provided in 340,106 ADS-B messages where (99.7%) of the ACID’s
provided match that of the track data, the remaining 1,022 reports did not provide an aircraft ID
for correlation. It should be noted that ADS-B does not broadcast the aircraft ID every message.
The figure of 99.7% demonstrates that the GA airframes could provide data compliant with
ESASSP 3N_C-R14 which only required 98% to match.
4.9 MOPS version
The Minimum Operational Performance Specification ‘version 0’ indicator is assigned to aircraft
compliant with DO-260, ‘version 1’ with DO-260A and ‘version 2’ DO-260B / ED-102A (5).
The majority of the messages were received from trial aircraft reporting ‘version 2’
(DO-260B/ED-102A); with a total of 193,581 (56.74%) messages, followed by ‘version 1’ with
143,012 (41.92%), with a further 4,535 (1.33%) messages indicating ‘version 0’.
As all participant aircraft were approved on the basis they either comply to ‘version 1’ or
‘version 2’; it should be noted however that if the Type Code 31 message type field that reports
the MOPS capability has not been received for a several message updates the ADS-B ground
system will assume the MOPS capability is ‘version 0’ for backward compatibility and translate the
NIC and NACp values into NUCp; it is assumed that this is the cause behind the small proportion
of ‘version 0’ messages recorded in the trial.
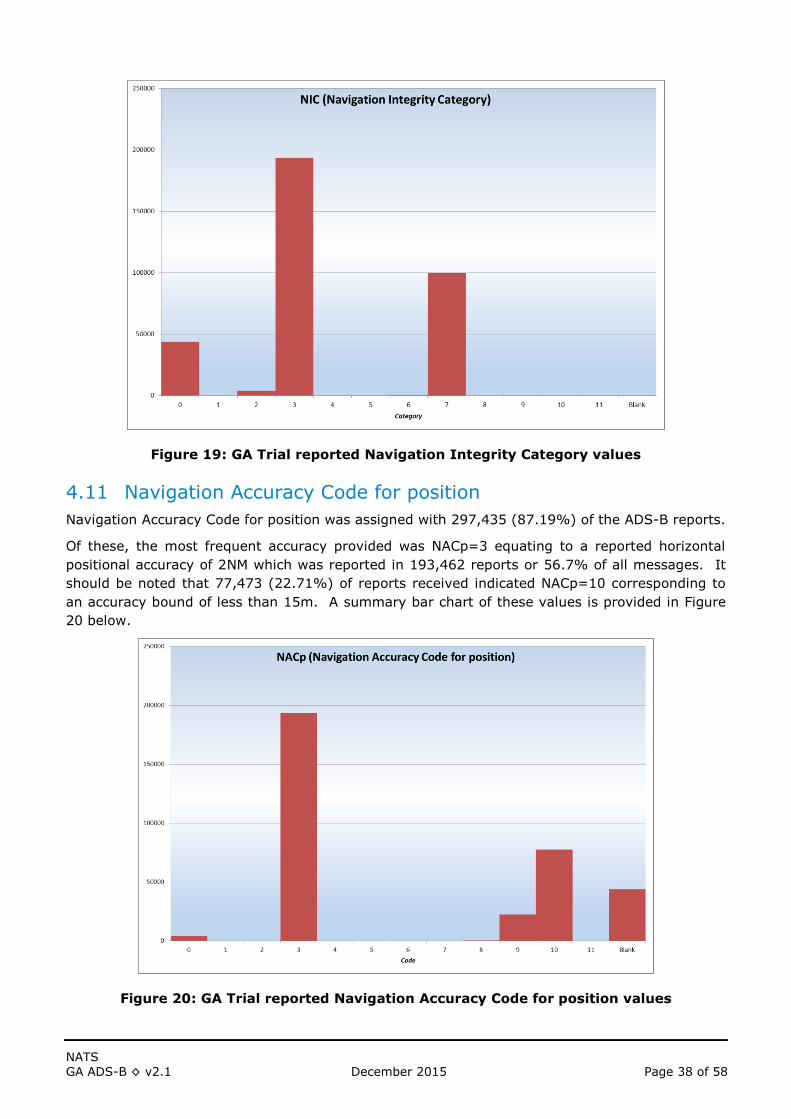
4.10 Navigational Integrity Category
The quality indicator Navigational Integrity Category is broadcast as part of the message subtype
header information of the ADS-B position messages; as such 100% of the 341,128 messages
provided this information. The majority of the messages assessed (56.7%), reported a NIC of ‘3’
(radius of containment of 4NM; see Table 2) while 29.2% reported a NIC of 7 (radius of
containment of 0.2NM).
The full break down of the reported NIC’s is given in Figure 19 below; however as the trial aircraft
were using non-certified GPS sources to provide the broadcast position information, any
corresponding SIL value accompanying any broadcast NIC value should have been set to ‘0’ to
indicate the radius of containment was not applicable (this was not the case for one airframe as
discussed in section 4.12).
NATS
GA ADS-B ◊ v2.1 December 2015 Page 38 of 58
Figure 19: GA Trial reported Navigation Integrity Category values
4.11 Navigation Accuracy Code for position
Navigation Accuracy Code for position was assigned with 297,435 (87.19%) of the ADS-B reports.
Of these, the most frequent accuracy provided was NACp=3 equating to a reported horizontal
positional accuracy of 2NM which was reported in 193,462 reports or 56.7% of all messages. It
should be noted that 77,473 (22.71%) of reports received indicated NACp=10 corresponding to
an accuracy bound of less than 15m. A summary bar chart of these values is provided in Figure
20 below.
Figure 20: GA Trial reported Navigation Accuracy Code for position values

NATS
GA ADS-B ◊ v2.1 December 2015 Page 39 of 58
The quality indicator NACp=10 indicates that the position broadcast by the airframe should be
within 15m of the aircrafts actual position. As this assessment uses radar track data as the
baseline ‘truth track’ it is not possible to definitively assess to the reported accuracy to 15m (a
DGPS fitted to the airframes would be required for this task), however a plot of the HPE of all
airframes reporting NACp=10 would be anticipated all be within the 300m tolerance; given the
expected accuracy of the radar track. Figure 21 below shows the cumulative plot of HPE’s for all
GA airframes reporting NACp=10 (red) and NACp=3 (green).
It can be seen that 99% of airframes reporting NACp=10 are within a HPE of 150m. However,
the largest reported HPE for the NACp=10 sample was 1,126m. The mean HPE for NACP=10
reports was 34.43m, with a standard deviation of 28.94m.
For the airframes reporting NACp=3, which indicates that the aircraft are reporting a position
within 2NM of their actual position (see Table 3), the mean HPE was 38.54m with a standard
deviation of 29.4m and a maximum HPE of 1,080.76m
The results and Figure 21 below illustrates that although the error bound NACp=10 is much less
than for NACp=3, the overall the magnitude of the HPE’s are very similar suggesting that the for
the majority of the time, NACp=3 airframes are extremely conservative at reporting the accuracy
capability of the GPS source under fault free conditions.
Figure 21: Cumulative plot of HPE for GA airframes reporting NACp=10 (red) and
NACp=3 (green)
4.12 Surveillance Integrity Level
The quality indicator ‘Surveillance Integrity Level’ was assigned with 297,435 of the GA ADS-B
messages (87.19%) where 294,011 (86.19% of total messages) reported SIL=0 and the
remaining 3,424 (1.00% of total messages) reported SIL=1.

NATS
GA ADS-B ◊ v2.1 December 2015 Page 40 of 58
Further investigation into the SIL=1 flights concluded that they were all produced by airframe
#09 which generated 3,489 plots in total. When the remaining 65 plots generated by airframe
#09 where for SIL=0, the NIC value changed to 2 from 3 and the NACp value changed from
3 to 0. This was due to the aircraft being temporarily recognised as MOPS ‘version 0’ by the
ground station ADS-B tracking and modifying the quality indicators of the ASTERIX message to
reflect NUCp rather than NIC, NACp and SIL.
An operational use of ADS-B should be cognisant of the effect that a sporadic reversion to the
assumed MOPS ‘version 0’ rather than an actual ‘version 1’ can have on the quality indicators
reported within ASTERIX CAT021.
4.13 Priority status
As expected all 341,128 messages assessed reported the ‘priority status’ as zero, indicating no
emergency condition during the trial.
4.14 Airborne surveillance applications compatibility
The airborne surveillance applications (ASA) system provides the avionics for the surveillance
processing and display of aircraft-to-aircraft applications (10). The two most basic ASA
applications are EvAcq (Enhanced visual Acquisition) and AIRB (Basic airborne situation
awareness) which are both intended to provide ADS-B enhanced traffic situation awareness to a
CDTI (Cockpit Display of Traffic Information). The TSAA (Traffic Situation Awareness with Alerts),
provides additional alerting functionality against the ADS-B traffic.
The compatibility of the non-certified GPS position data broadcast from the GA fleet in this
assessment takes two forms; firstly whether the typical accuracy measured meets the
requirements for EvAcq/AIRB and TSAA functionality and secondly whether the quality indicators
broadcast would provide interoperability with certified installations of EvAcq/AIRB and TSAA.
The 3D state vector quality requirements for EvAcq/AIRB and TSAA are taken from Table 2-4 of
ED-194A (10) reproduced in Table 4.
According to Table 4, to be eligible for processing and subsequent display, airborne traffic needs
to have an accuracy of <0.5NM denoted by the provision of NACp≥5 for aircraft broadcasting
Version 2 ADS-B data.
Section 4.11 illustrates that 56.7% of the ADS-B position messages reported an accuracy of
NACp=3 which equates to an accuracy that is within 2NM (see Table 3). However, section 4.11
also indicates that the reported NACp is highly conservative with Figure 21 indicating that 95% of
both NACp=3 and NACp=10 reports were measured within this assessment to have an HPE of
approximately 85m or less.
As the NACp metric is taken to be ‘95% Horizontal accuracy bound’ (for NACp=0 to 8, but also
including the vertical accuracy bound for NACp=9 to 11), the assessment would suggest that the
measured typical accuracy although not the reported accuracy (NACp) would be sufficient to
support the traffic situation awareness.
This aligns with the ‘LPAT High Level Safety Performance and Certification Assessment’ (9) which
concluded that for an airborne situational awareness application in uncontrolled airspace, a
directional position error of ± 12.5 degrees was sufficient to support See-and-Avoid. The mean
HPE of 43.93m measured, is well within the 103m of error that 12.5 degrees of directional error
equates to at a range of 0.25nm. It can also be noted that only two of the GA airframes
generated a HPE greater than 1232m, which is equivalent to a ±12.5 degree error at a range of
3NM.

NATS
GA ADS-B ◊ v2.1 December 2015 Page 41 of 58
In terms of interoperability, the remit of the trial required that either of the quality indicators of
NIC and SIL had to be set to zero, indicating unknown quality. As such, the broadcast positions
from the GA fleet in this trial would not be processed by the airborne surveillance applications.
Table 4: ED-194A TRAFFIC APPLICATION SPECIFIC REQUIREMENTS SUMMARY
NATS
GA ADS-B ◊ v2.1 December 2015 Page 42 of 58
4.15 Observations and investigations
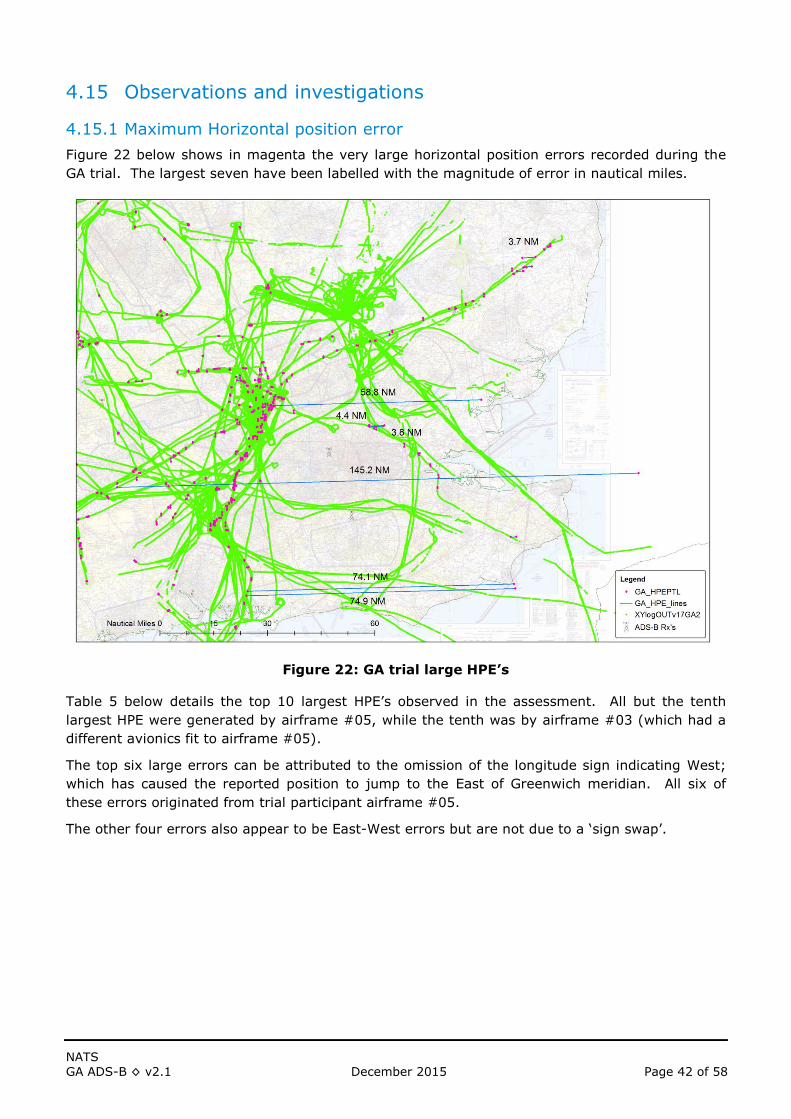
4.15.1 Maximum Horizontal position error
Figure 22 below shows in magenta the very large horizontal position errors recorded during the
GA trial. The largest seven have been labelled with the magnitude of error in nautical miles.
Figure 22: GA trial large HPE’s
Table 5 below details the top 10 largest HPE’s observed in the assessment. All but the tenth
largest HPE were generated by airframe #05, while the tenth was by airframe #03 (which had a
different avionics fit to airframe #05).
The top six large errors can be attributed to the omission of the longitude sign indicating West;
which has caused the reported position to jump to the East of Greenwich meridian. All six of
these errors originated from trial participant airframe #05.
The other four errors also appear to be East-West errors but are not due to a ‘sign swap’.

NATS
GA ADS-B ◊ v2.1 December 2015 Page 43 of 58
Date Time Partipant MOPS ADSB Long ADSB lat Rdr long Rdr lat RMS (m) NACP NIC SIL
20150816 '12:46:02 5 0 1.9379 51.4006 -1.9368 51.4010 268,957 -1 0 -1
20150621 '08:54:46 5 0 0.9890 50.8913 -0.9899 50.8910 138,792 -1 0 -1
20150621 '08:55:46 5 0 0.9798 50.9128 -0.9804 50.9122 137,408 -1 0 -1
20150603 '13:56:18 5 0 0.7913 51.7743 -0.7908 51.7743 108,960 -1 0 -1
20150722 '09:27:39 5 1 0.0604 51.6694 -0.0623 51.6700 8,297 -1 0 -1
20150722 '09:27:54 5 1 0.0514 51.6665 -0.0528 51.6667 7,042 -1 0 -1
20150511 '14:59:42 5 1 1.1449 52.4251 1.2434 52.4247 6,809 -1 0 -1
20150511 '14:57:27 5 1 1.2141 52.3829 1.1570 52.3837 3,866 -1 0 -1
20150511 '14:56:06 5 1 1.1493 52.3633 1.0973 52.3628 3,386 -1 0 -1
20150811 '15:04:14 3 2 -1.7496 51.8934 -1.7991 51.8921 3298 9 7 0
Table 5: Top 10 largest HPE's in GA dataset
NATS
GA ADS-B ◊ v2.1 December 2015 Page 44 of 58
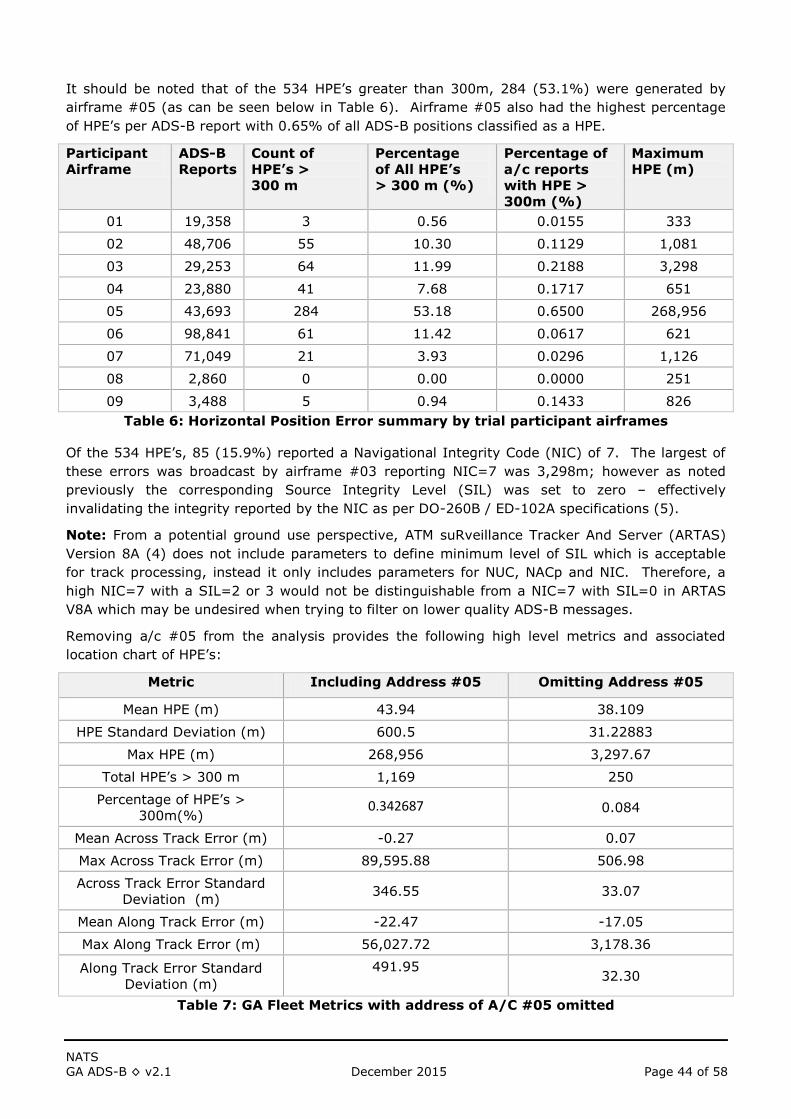
It should be noted that of the 534 HPE’s greater than 300m, 284 (53.1%) were generated by
airframe #05 (as can be seen below in Table 6). Airframe #05 also had the highest percentage
of HPE’s per ADS-B report with 0.65% of all ADS-B positions classified as a HPE.
Participant
Airframe
ADS-B
Reports
Count of
HPE’s >
300 m
Percentage
of All HPE’s
> 300 m (%)
Percentage of
a/c reports
with HPE >
300m (%)
Maximum
HPE (m)
01 19,358 3 0.56 0.0155 333
02 48,706 55 10.30 0.1129 1,081
03 29,253 64 11.99 0.2188 3,298
04 23,880 41 7.68 0.1717 651
05 43,693 284 53.18 0.6500 268,956
06 98,841 61 11.42 0.0617 621
07 71,049 21 3.93 0.0296 1,126
08 2,860 0 0.00 0.0000 251
09 3,488 5 0.94 0.1433 826
Table 6: Horizontal Position Error summary by trial participant airframes
Of the 534 HPE’s, 85 (15.9%) reported a Navigational Integrity Code (NIC) of 7. The largest of
these errors was broadcast by airframe #03 reporting NIC=7 was 3,298m; however as noted
previously the corresponding Source Integrity Level (SIL) was set to zero – effectively
invalidating the integrity reported by the NIC as per DO-260B / ED-102A specifications (5).
Note: From a potential ground use perspective, ATM suRveillance Tracker And Server (ARTAS)
Version 8A (4) does not include parameters to define minimum level of SIL which is acceptable
for track processing, instead it only includes parameters for NUC, NACp and NIC. Therefore, a
high NIC=7 with a SIL=2 or 3 would not be distinguishable from a NIC=7 with SIL=0 in ARTAS
V8A which may be undesired when trying to filter on lower quality ADS-B messages.
Removing a/c #05 from the analysis provides the following high level metrics and associated
location chart of HPE’s:
Metric Including Address #05 Omitting Address #05
Mean HPE (m) 43.94 38.109
HPE Standard Deviation (m) 600.5 31.22883
Max HPE (m) 268,956 3,297.67
Total HPE’s > 300 m 1,169 250
Percentage of HPE’s >
300m(%) 0.342687 0.084
Mean Across Track Error (m) -0.27 0.07
Max Across Track Error (m) 89,595.88 506.98
Across Track Error Standard
Deviation (m) 346.55 33.07
Mean Along Track Error (m) -22.47 -17.05
Max Along Track Error (m) 56,027.72 3,178.36
Along Track Error Standard
Deviation (m)
491.95
32.30
Table 7: GA Fleet Metrics with address of A/C #05 omitted

NATS
GA ADS-B ◊ v2.1 December 2015 Page 45 of 58
Figure 23 Location of GA Fleet HPE's with A/C #05 omitted
Figure 24 below is a scatter plot of the bearing of the ADS-B reported position in relation to the
tracked plot position against horizontal position errors greater than 300m. This plot highlights
that there is clustering of errors that are 0, 90, 180, 270 and 360 degrees bearing away from the
tracked position.
This suggests that there is an effect of ‘quantisation’ errors along the latitude and longitude
coordinates in addition to the seven very large sign bit swaps errors.

NATS
GA ADS-B ◊ v2.1 December 2015 Page 46 of 58
Figure 24: Scatter plot of GA fleet ADS-B offset bearing (y axis) against HPE > 300 m
(x axis log 10 scale)
When focusing specifically on airframe #05 which generated the seven very large sign bit swaps
and majority of large horizontal position errors; it can be seen in Figure 25 below that the
clustering previously observed in Figure 24 can be largely attributed to airframe #05.
Figure 25: Scatter plot of ADS-B offset bearing (y axis) vs HPE > 300 m (x axis log 10
scale) for Trial Airframe #05
NATS
GA ADS-B ◊ v2.1 December 2015 Page 47 of 58
It should be noted that the WGS84 latitude and longitude is encoded using the compact position
reporting (CPR) format in consecutive odd /even ADS-B reports to reduce the bandwidth required
to continually broadcast what are essentially small changes in position from the aircraft.
Consequently the ADS-B message does not transmit a longitude ‘sign bit’.
Further investigation would be necessary to ascertain whether it is the GPS source causing this
issue, a degradation of the signal of the NMEA via RS-232 from the GPS source to the
transponder, or the ADS-B message assembly function encoding of the CPR format that is causing
this issue.
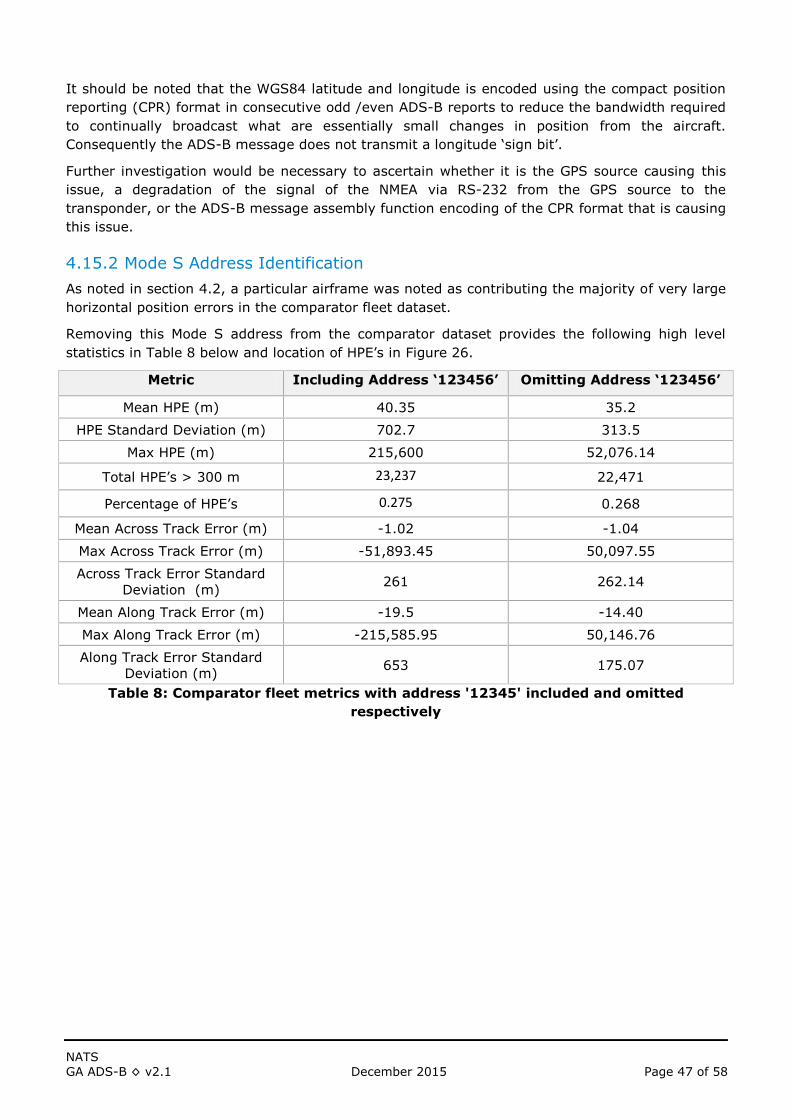
4.15.2 Mode S Address Identification
As noted in section 4.2, a particular airframe was noted as contributing the majority of very large
horizontal position errors in the comparator fleet dataset.
Removing this Mode S address from the comparator dataset provides the following high level
statistics in Table 8 below and location of HPE’s in Figure 26.
Metric Including Address ‘123456’ Omitting Address ‘123456’
Mean HPE (m) 40.35 35.2
HPE Standard Deviation (m) 702.7 313.5
Max HPE (m) 215,600 52,076.14
Total HPE’s > 300 m 23,237 22,471
Percentage of HPE’s 0.275 0.268
Mean Across Track Error (m) -1.02 -1.04
Max Across Track Error (m) -51,893.45 50,097.55
Across Track Error Standard
Deviation (m) 261 262.14
Mean Along Track Error (m) -19.5 -14.40
Max Along Track Error (m) -215,585.95 50,146.76
Along Track Error Standard
Deviation (m) 653 175.07
Table 8: Comparator fleet metrics with address '12345' included and omitted
respectively

NATS
GA ADS-B ◊ v2.1 December 2015 Page 48 of 58
Figure 26: Location of Comparator fleet HPEs > 300 m with address '123456' omitted
In addition to the very large HPE’s generated by Mode S address ‘123456’, another airframe ‘X’
contributed to the majority 18,204 (78.3%) of the 23,228 of HPE’s albeit with an average HPE of
442m.
Figure 27 below provides a close up inspection of this Mode S address’ HPE’s indicates that all of
the positions are randomly offset along the north and/or south axis, suggesting a quantisation
error.

NATS
GA ADS-B ◊ v2.1 December 2015 Page 49 of 58
Figure 27: Close up of 'quantisation' effect from Address 'X' (Radar track plots in green,
ADS-B position updates in purple and error in blue)
Figure 28 containing all airframes and Figure 29 with ‘X’ omitted highlight this quantisation effect
with plots visibility clustered around 0, 45, 90, 135, 180, 225, 270, 315 and 360 degrees in the
figure with ‘X’ included and notability reduced in the figure with it omitted, reinforcing the latitude
and / or longitude quantisation error.
The ‘whitelist’ used to identify the comparison fleet was provided by EUROCONTROL. The Mode S
address responsible for the very large deviations was ‘123456’. Given the sequence of numbers
in the address it is extremely likely that the airframe responsible for the very large errors was not
the airframe that had passed the quality criteria set by EUROCONTROL to be added to the
whitelist, but instead, the Mode S address broadcast was in error.
The broadcast of an incorrect address highlights a deficiency in the use of a whitelist to approve
the quality of ADS-B positions and further reinforces the need for continual or recurrent validation
of the broadcast positions if used for separation provision.

NATS
GA ADS-B ◊ v2.1 December 2015 Page 50 of 58
Figure 28: Scatter plot of Comparator fleet ADS-B offset bearing (y axis) vs HPE > 300
m (x axis log 10 scale)
Figure 29: Scatter plot of Comparator fleet ADS-B offset bearing (y axis)vs HPE > 300
m (x axis log 10 scale) with A/C 'X' omitted
NATS
GA ADS-B ◊ v2.1 December 2015 Page 51 of 58
4.15.3 GA responses and applications to the trial
Several GA pilots expressed their disappointment that a minor modification would be required to
participate in the trial. This most probably, was the main reason that there was not a larger
uptake particularly from owners of EASA aircraft types. The aircraft owners highlighted that the
process for submitting a minor modification through EASA typically takes six weeks. Anecdotally,
one aircraft engineer stated that he usually spent a total of two days just on administration when
applying for a minor modification.
Some owners of Garmin products queried whether the minor modification was necessary,
especially as a factory cable is used to connect the transponder to the GPS source. One owner
pointed out that a defective cable could be replaced under a maintenance schedule. Note that
the EASA CS-STAN SC002a ref (8)) provides for a standard modification but it cannot be made by
the aircraft owner. This regulatory mechanism became available during the course of the trial but
was not exercised within it.
Some members of the community were unaware of the difference between Mode S and Mode S
(ES) and a number of Garmin users were disappointed to learn that most of the Garmin
transponders do not have extended squitter capability.
Three users had old (but not obsolete) ADS-B versions (‘0’ & ‘1’). There were two applicants with
funke TRT800A transponders that had ‘version 0’ data i.e. no NIC and SIL hence they did not
qualify for our trial. Most CAT are still using ‘version 0’ and several have NUCp=0 position
quality. The third had a ‘version 1’ Trig transponder and Trig have promised to provide a free
update to version 2, this participant was included in the trial.
One applicant had initially set the wrong 24-bit address although this was rectified within a couple
of days and was allowed to participate in the trial.
Another applicant thought they had enabled ADS-B OUT but their ADS-B data could not be
observed, despite searching for their Mode S address in the NATS radar feeds to correlate a
secondary radar plot with any ADS-B reported position.
As mentioned in the observations above, one participant with a TM250 as a GPS source seemed
to have a high degree of error in their GPS position. The owner was contacted, however a
remedial action of modifying the GPS antenna made no discernible difference to the position
quality provided.
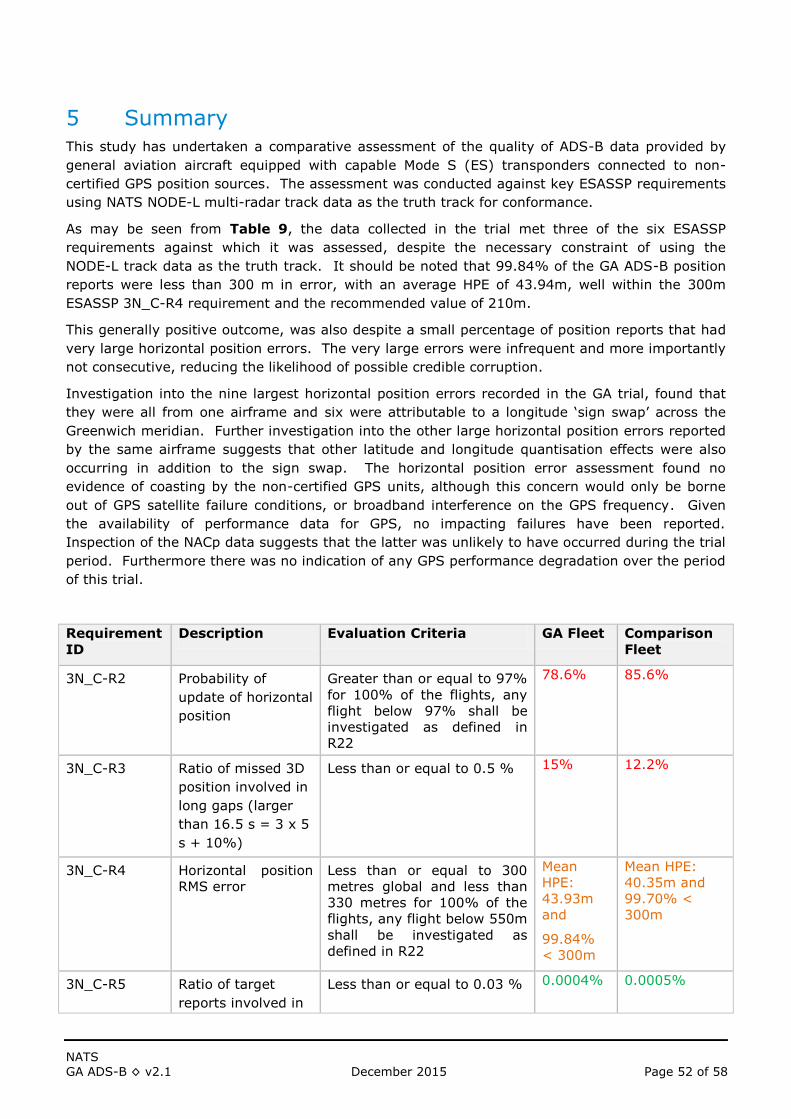
NATS
GA ADS-B ◊ v2.1 December 2015 Page 52 of 58
5 Summary
This study has undertaken a comparative assessment of the quality of ADS-B data provided by
general aviation aircraft equipped with capable Mode S (ES) transponders connected to non-
certified GPS position sources. The assessment was conducted against key ESASSP requirements
using NATS NODE-L multi-radar track data as the truth track for conformance.
As may be seen from Table 9, the data collected in the trial met three of the six ESASSP
requirements against which it was assessed, despite the necessary constraint of using the
NODE-L track data as the truth track. It should be noted that 99.84% of the GA ADS-B position
reports were less than 300 m in error, with an average HPE of 43.94m, well within the 300m
ESASSP 3N_C-R4 requirement and the recommended value of 210m.
This generally positive outcome, was also despite a small percentage of position reports that had
very large horizontal position errors. The very large errors were infrequent and more importantly
not consecutive, reducing the likelihood of possible credible corruption.
Investigation into the nine largest horizontal position errors recorded in the GA trial, found that
they were all from one airframe and six were attributable to a longitude ‘sign swap’ across the
Greenwich meridian. Further investigation into the other large horizontal position errors reported
by the same airframe suggests that other latitude and longitude quantisation effects were also
occurring in addition to the sign swap. The horizontal position error assessment found no
evidence of coasting by the non-certified GPS units, although this concern would only be borne
out of GPS satellite failure conditions, or broadband interference on the GPS frequency. Given
the availability of performance data for GPS, no impacting failures have been reported.
Inspection of the NACp data suggests that the latter was unlikely to have occurred during the trial
period. Furthermore there was no indication of any GPS performance degradation over the period
of this trial.
Requirement
ID
Description Evaluation Criteria GA Fleet Comparison
Fleet
3N_C-R2 Probability of
update of horizontal
position
Greater than or equal to 97%
for 100% of the flights, any
flight below 97% shall be
investigated as defined in
R22
78.6% 85.6%
3N_C-R3 Ratio of missed 3D
position involved in
long gaps (larger
than 16.5 s = 3 x 5
s + 10%)
Less than or equal to 0.5 % 15% 12.2%
3N_C-R4 Horizontal position
RMS error
Less than or equal to 300
metres global and less than
330 metres for 100% of the
flights, any flight below 550m
shall be investigated as
defined in R22
Mean
HPE:
43.93m
and
99.84%
< 300m
Mean HPE:
40.35m and
99.70% <
300m
3N_C-R5 Ratio of target
reports involved in
Less than or equal to 0.03 % 0.0004% 0.0005%

NATS
GA ADS-B ◊ v2.1 December 2015 Page 53 of 58
Requirement
ID
Description Evaluation Criteria GA Fleet Comparison
Fleet
sets of 3
consecutive
correlated
horizontal position
errors larger than
555 m - 0.3 NM
3N_C-R11 Pressure altitude
unsigned error (see
Note 7 in § 3.4.5)
Less than or equal to
200/300 ft in 99.9% of the
cases for stable flights and
less than or equal to 300 ft in
98.5% of the cases for
climbing/descending flights
99.99% 99.99%
3N_C-R14 Probability of
update of aircraft
identity with correct
value (see Note 8
in § 3.4.5)
Greater than or equal to 98
% global
99.7% 99.94%
Table 9: Summary of compliance with assessed ESASSP requirements
Assessment of the interoperability of ADS-B data and system quality factors indicates that there
is no expectation that the data may be consumed by MOPS compliant airborne safety nets. This
is because the trial required that the Source Integrity Level be set to zero. It is to be noted that
Trig Avionics TABS/TSAA device has an optional “de-rated” mode of operation. In this mode, the
equipment may accept data which is not compliant with the requirements stated in the TSAA
MOPS. Operation in this mode will render any certification technically invalid, but it may be more
relevant to, and useful in, the current UK Class G Electronic Conspicuity environment.
A further limitation of the GA trial is that it assumes GPS fault free performance. The current
reliability and over population of the GPS constellation, means that the performance exceeds the
USA’s ICAO Annex 10 commitments. This may not be true in the longer term as the GPS
constellation ages and satellites reach their end of life and fail or are decommissioned. Whilst the
faulted case falls outside the scope of this document, a brief consideration of this topic is given
below.
The position accuracy under a GPS faulted condition may pose a risk for the non-certified units.
Taking into consideration a credible visual range of acquisition of 2NM, and setting up emergent
ADS-B IN aids to visual acquisition, position errors of between a hundred of meters up to
7.4km/4NM may be considered to be hazardously misleading information. In this range, the
hazard arises from the direction of the focus of pilot’s visual scan away from the true position of a
conflicting aircraft, and outside the eyes area of greatest visual acuity. However, technical work
from Helios suggests this risk is minor and acceptable.
Technical means to mitigate this specific risk include the use of SBAS capable GNSS devices,
which should exclude a faulted satellite within six seconds of detection of the failure by the SBAS
ground segment. However, without permanent installation of a GNSS antenna, most likely under
CS-STAN, visibility of an SBAS satellite cannot be assured.
Overall, in the proposed air to air electronic conspicuity application that was within the scope of
the trial, this risk is currently felt to be acceptable. However the impact of these, or greater
errors if there were to be ground ATC presentation or use of ADS-B with no, or low integrity
requires further investigation.

NATS
GA ADS-B ◊ v2.1 December 2015 Page 54 of 58
6 Conclusions
Based on the results of this trial, it can be seen that the quality of non-certified GPS is sufficient
for use in enhancing visual acquisition / electronic conspicuity between participating general
aviation aircraft outside controlled airspace.
There was no identified impact on the current or planned UK ATC use of 1090MHz, or regulated
uses of surveillance on 1090MHz. However it would be prudent to undertake periodic monitoring
of installations to ensure transmission and data content remain of suitable quality. This on-going
monitoring role should be periodically reported to the certifying airworthiness authority for that
a/c type.
It was interesting to note how closely the non-certified data matched the performance of the
certified ‘white-list’ fleet.
All of these tests were performed in a GPS fault free environment. NATS safety analysis identified
the risk and consequence of a faulty GPS for the enhancement of visual acquisition as minor and
tolerable.
The use of this data in ground applications, whilst outside the scope of this study, should be
examined for potential impact under GPS/GNSS faulted conditions.
Therefore, General Aviation should be encouraged to enable ADS-B from capable transponders to
create an ADS-B based Electronic Conspicuity environment to support the introduction of
dedicated ADS-B IN Electronic Conspicuity devices, such as NATS LPAT.
7 Recommendations
Pilots equipping with GNSS for this application should be advised to ensure that any GPS
antenna has an unobstructed view of the sky.
Pilots to be advised to ensure that the ICAO address is set correctly in their transponder.
Suggestion that “non-certified” or life expired certificated, but still functionally serviceable
GPS antenna products could be installed under CS-STAN to support non-certified GNSS
sources.
Ask CAA to consider whether, and under what circumstances or installation context NIC,
SIL and SDA may be set to non-zero values.
Advise pilots that all new modifications shall be to ADS-B V2,as per RTCA-DO-260B
Ch2/EUROCAE-ED-102A
If low integrity ADS-B were to were, in the future, to be displayed to air traffic controllers,
further work on the potential impact of GNSS failure scenarios should be undertaken.
CS-STAN SC002a (8) can be used to connect a GPS source to a Mode-S ES transponder although
this route cannot be used if the modification is carried out by the owner. It is suggested the
transponder manufacturer be allowed to only recommend connection types that guarantee
SIL & SDA are set to zero instead (e.g. NMEA protocol), pending any CAA consideration of
requirements for non-zero values of ADS-B quality indicators.
CAA, NATS and Airspace users organisations to investigate options to increase take up of
low or no integrity ADS-B-OUT in the GA VFR community.
NATS
GA ADS-B ◊ v2.1 December 2015 Page 55 of 58
NATS to assess the performance of a sample of ADS-B position information derived from
non-certified GPS sources in the ARTAS tracker.
NATS transition out of the initial verification check in favour of LAA, BMAA and BGA.
The Associations should also build capability to the undertake post modification technical
verification and also periodic re-verification activities for Annex II types post trial to ensure
poor installations are detected and rectified.
It is recommended that continual or recurrent periodic independent re-verification of
ADS-B derived information is implemented, to ensure poor installations are spotted,
notified for rectification. The results of this should be examined, and where appropriate
actioned by the competent airworthiness approval organisation for the installation in
question.

NATS
GA ADS-B ◊ v2.1 December 2015 Page 56 of 58
Appendices
A1 GA Trial Airframe & Equipment Details (anonamised)
ID Aircraft type Transponder GPS Source
Trial
Verification
date
01 VANS RV-6 Trig TT21 Bendix Skyforce 3C 26/06/2015
02 Europa Trig TT21 AVMAP V 19/04/2015
03 Bristell NG5 Trig TT21-V2 Dynon Skyview 20/05/2015
04 Europa Trig TT21 PowerFlarm Core output 08/04/2015
05 Jodel DR100A Funkwerk
TRT800H
Funkwerk TM250 (ADSB Traffic
Monitor) 22/04/2015
06 Skyranger (3 axis
microlight) Trig TT21 Garmin Aera 500 08/06/2015
07 VANS RV-12 Dynon SV-
XPNDR-262 Dynon SkyView SV-GPS-250 22/04/2015
08 Falco F8L Trig TT31 TruTrak Artificial Horizon 11/07/2015
09 P&M Quik 912 flexwing Trig TT21 Garmin 96C 21/06/2015
Table 10: GA Trial Airframe & equipment Details
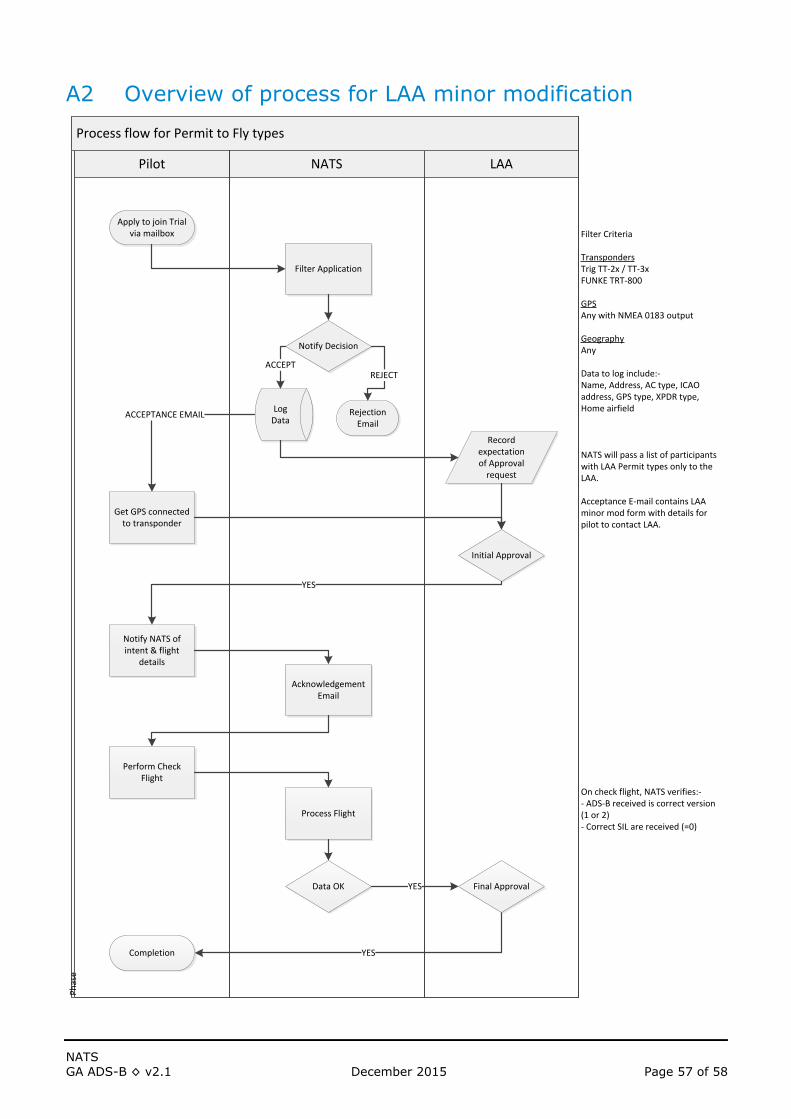
NATS
GA ADS-B ◊ v2.1 December 2015 Page 57 of 58
A2 Overview of process for LAA minor modification
Process flow for Permit to Fly types
NATSPilot LAA
Ph
ase
Apply to join Trialvia mailbox
Filter Application
Notify Decision
Get GPS connected to transponder
Notify NATS of intent & flight
details
Acknowledgement Email
Perform Check Flight
Process Flight
Data OK
Completion
Record expectation of Approval
request
ACCEPT
Log Data
ACCEPTANCE EMAIL
REJECT
Initial Approval
YES
YES
Rejection Email
Filter Criteria
TranspondersTrig TT-2x / TT-3xFUNKE TRT-800
GPSAny with NMEA 0183 output
GeographyAny
Data to log include:-Name, Address, AC type, ICAO address, GPS type, XPDR type, Home airfield
NATS will pass a list of participants with LAA Permit types only to the LAA.
Acceptance E-mail contains LAA minor mod form with details for pilot to contact LAA.
On check flight, NATS verifies:-- ADS-B received is correct version (1 or 2)- Correct SIL are received (=0)
Final ApprovalYES

NATS
GA ADS-B ◊ v2.1 December 2015 Page 58 of 58
End of Document