Embed Size (px)
Citation preview
Third Quarter 2017 Financial Report
1
FYBER N.V. Third Quarter 2017 Financial Report

Third Quarter 2017 Financial Report
2
Fyber N.V. (“Fyber” or “the Company”) is a global technology company, developing a next generation platform for the programmatic trading of ads, in a data-driven environment. Our mission is to fuel the creation of quality content by empowering digital publishers and app developers to unlock the true value of their advertising properties through advanced technologies, innovative ad formats and data-driven decision-making. Fyber’s technology platform provides an open-access platform for both digital advertisers and publishers, enabling cross-device advertising with a global reach of more than 1.2 billion unique monthly users.
Third Quarter 2017 Financial Report
3
TABLE OF CONTENT
KEY FIGURES
STATEMENT FROM THE CEO
REPORT FROM THE MANAGEMENT BOARD Business Model
Strategy and Objectives
Our Differentiators
Economic Review
Market Overview
Business Performance
Basis of Presentation and Highlights
Profitability
Cash Flow
Financial and Asset Position
Equity Information
Subsequent Events
Forecast Report
Risk Report
Responsibility Statement
EDITORIAL
INTERIM FINANCIAL STATEMENTS
NOTES TO THE INTERIM FINANCIAL STATEMENTS
4
5
6 6
7
8
9
9
11
11
13
14
14
15
15
16
16
17
17
18
24
Third Quarter 2017 Financial Report
4
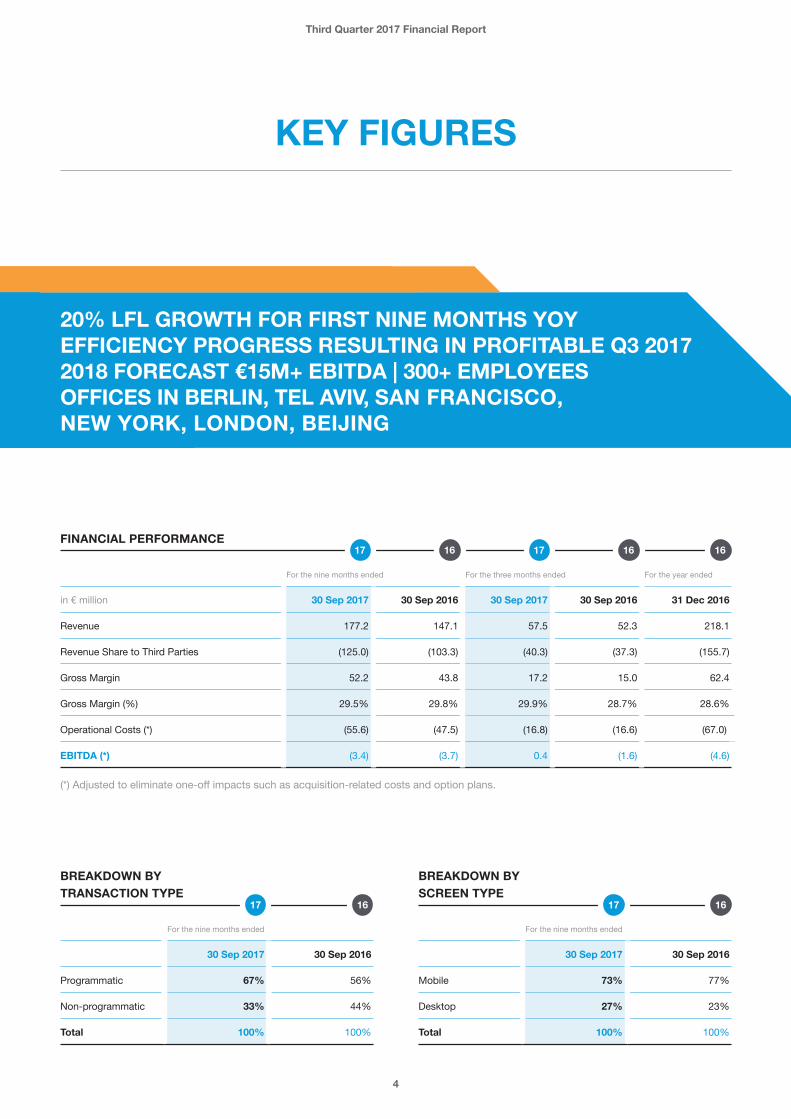
FINANCIAL PERFORMANCE
For the nine months ended For the three months ended For the year ended
in € million 30 Sep 2017 30 Sep 2016 30 Sep 2017 30 Sep 2016 31 Dec 2016
Revenue 177.2 147.1 57.5 52.3 218.1
Revenue Share to Third Parties (125.0) (103.3) (40.3) (37.3) (155.7)
Gross Margin 52.2 43.8 17.2 15.0 62.4
Gross Margin (%) 29.5% 29.8% 29.9% 28.7% 28.6%
Operational Costs (*) (55.6) (47.5) (16.8) (16.6) (67.0)
EBITDA (*) (3.4) (3.7) 0.4 (1.6) (4.6)
(*) Adjusted to eliminate one-off impacts such as acquisition-related costs and option plans.
16 16 1617 17
BREAKDOWN BY TRANSACTION TYPE
For the nine months ended
30 Sep 2017 30 Sep 2016
Programmatic 67% 56%
Non-programmatic 33% 44%
Total 100% 100%
BREAKDOWN BY SCREEN TYPE
For the nine months ended
30 Sep 2017 30 Sep 2016
Mobile 73% 77%
Desktop 27% 23%
Total 100% 100%
16 1617 17
KEY FIGURES
20% LFL GROWTH FOR FIRST NINE MONTHS YOY EFFICIENCY PROGRESS RESULTING IN PROFITABLE Q3 2017 2018 FORECAST €15M+ EBITDA | 300+ EMPLOYEES OFFICES IN BERLIN, TEL AVIV, SAN FRANCISCO, NEW YORK, LONDON, BEIJING

Third Quarter 2017 Financial Report
5
fied global corporate management team, realizing reve-nue synergies and improving operational efficiency across the group within the set timelines. This also in-cluded some difficult strategic decisions such as the workforce reduction of 12% in September. However, this step will ensure we remain an agile, focused and efficient organization that will deliver on its integration roadmap, including the roll-out of the joint technology platform in 2018. This platform will leverage the best technological assets of each of our different business units - Fyber, Fy-ber RTB and Inneractive - to bring a truly differentiated, holistic offering to the market.
During Q3, we also put additional emphasis on the quality of our marketplace, launching our ‘Keeping it Clean’ initiative. Part of this initiative included the business deci-sion to move away from aggregated supply, and increase our focus on direct publisher integrations, effective imme-diately. This is aimed at continuing to ensure our transparency and unique inventory, something digital buyers place high value on. While this initiative has revenue impact in the short-term, we are confident it will be offset by the strategic value of focusing on our extensive direct supply comprised of over 10,000 directly integrated applications and sites, while ensuring strong control and high quality of inventory - fueling the long-term growth of the Company.
This comes as part of a comprehensive set of initiatives aimed at increasing transparency and quality across Fy-ber’s platform, taken by Fyber’s new Corporate Manage-ment team, that came together in July 2017. A central part of bringing together the group companies is to fur-ther Fyber’s leadership both in terms of technology and the quality and scale of the Company’s publisher network.
Ziv ElulChief Executive Officer22 November 2017
Dear Reader,
2017 to date marked the continuous strong growth of digital advertising, in general, and video advertising, in particular. The latest report by the Internet Advertising Bureau (“IAB”) shows ad spend on digital video surpass-ing static display ads for the first time. Fyber achieved 20% growth in income year-over-year during the first nine months of the year and is strongly positioned to benefit from this shift towards video, as well as other market trends. In line with this trend, in Q3 Fyber launched its new product - the Video Ad Monetization Platform (“VAMP”). VAMP empowers publishers to maxi-mize their monetization through innovative video ad units with high levels of viewability and user engagement. The platform also offers tools to empower publishers to un-derstand their data, and create audience segments which often justify charging advertisers a higher price tag. We are convinced that VAMP’s benefits to our publishers will increase our share of business from video advertising and contribute significantly to the Company’s growth strategy.
In addition to this large product launch, during the past months, we have been deeply focused on successfully executing our integration plans: putting together a uni-
STATEMENT FROM THE CEO

Third Quarter 2017 Financial Report
6
REPORT FROM THE MANAGEMENT BOARD
VIDEO ACROSS
SCREENS
ADVANCED PROGRAMMATIC
PLATFORM
DATA-DRIVEN AUDIENCE
SEGMENTATION
PRODUCT FOCUS
By offering a unique cross-screen programmatic video solution for publishers, Fyber is well positioned to become a global, neutral publisher-side powerhouse
BUSINESS MODEL
Fyber N.V. is listed on the Frankfurt Stock Exchange (Ticker Symbol: FBEN), providing shareholders the opportunity to invest in a company entirely focused on one of the most inspiring and dynamic markets. Fyber provides digital publishers and app developers with complete inventory control across all programmatic channels. We are a global technology company with the vision of becoming the leading neutral publisher-facing advertising technology (“ad tech”) company. Fyber con-nects publishers with advertisers worldwide, enabling them to generate business-critical revenue streams from digital advertising. Our products fuel the creation of quality content by empowering publishers to unlock the true value of their properties through advanced tech- nologies, innovative ad formats and data-driven decision-making. We offer a full-stack monetization suite, including an ad exchange, ad serving, ad network mediation, along with several publisher tools to centrally manage all moneti- zation strategies. Our automated real-time bidding mechanisms ensure the delivery of relevant, high-paying ads, optimizing the yield for publishers with every ad impression. For transactions placed via the Fyber exchanges, the Company retains a share of the ad spend advertisers spend via the platform. Our technology is channel-neutral and provides an open-access platform for advertisers and publishers. The platforms enable cross-device advertising with a global reach of more than 1.2 billion unique monthly users with a strong focus on video ads.
� Video across screens: variety of video ad units, non-rewarded, rewarded, in-stream, out-stream; on mobile in-app, mobile web and desktop
� Data-driven audience segmentation: enabling pub-lishers to offer targeted user segments to their demand-side partners; optimizing the yield they generate from ad impressions by combining data from data management platforms and other third-party data providers, the publisher’s first-party data and Fyber’s own ad performance and engagement data
� Advanced programmatic platform: offering program-matic and real-time bidding enabled ad exchanges for mobile in-app, mobile web and desktop inventory; unified auction across RTB and non-RTB demand sources optimizes yield for publishers

Third Quarter 2017 Financial Report
7
STRATEGY AND OBJECTIVES
Our strategy is designed to create value through the core platforms of Fyber, Heyzap, Fyber RTB and Inneractive. All group companies are highly compatible and comple-mentary, together covering all publisher verticals, from major gaming publishers to leading news outlets, and all relevant ad formats, from innovative video ad units to traditional display formats. All companies share the pub-lisher focus, consolidating several layers of the complex value chain, simplifying and streamlining processes for publishers and thereby optimizing the yield they gener-ate from advertising. This shared approach and vision, and the compatible technology will allow for full integra-tion, generating value from merging the group’s compa-nies into one technology infrastructure.
As presented in the recent financial reports, Fyber’s growth strategy centers around the acquisitions of Fyber (supply-side platform focused on freemium apps and game developers), Fyber RTB (programmatic and re-al-time bidding ad exchange and ad server), Heyzap (supply-side platform focused on mediation for freemi-um apps and game developers) and Inneractive (pro-grammatic monetization platform focused on publisher verticals outside of gaming).
The companies support and improve monetization by overcoming the following market imbalances:
(a) Publishers vs. advertisers: Advertisers tend to have more data on the users they want to target than pub-lishers. By offering the publisher access to data and user segmentation tools we enable them to under-stand and analyze their user base, form targeted seg-ments and price the ad impressions accordingly.
(b) Publishers vs. the internet giants and social media platforms: Publishers are ultimately competing with the major internet companies for advertising spend. We strengthen their competitive position by enabling them to offer their ad inventory in an optimized way, leveling the playing field against the giants.
Fyber’s ‘Keeping it Clean’ Initiative As part of its ‘Keeping it Clean’ Initiative, the Company took the strategic decision to move away from aggre- gated supply and focus primarily on direct publisher integrations. Digital buyers are putting more value on direct traffic and are losing tolerance for aggregated non-direct inventory. Decreasing its dependence on aggregated supply will therefore fuel Fyber’s long-term growth.
This initiative is in line with the recent industry trends calling for a cleaning up of the ecosystem. Aggregators add another layer to the value chain of digital advertising, which can create inefficiencies, intransparency, increased chances of fraudulent activities and lower ROI for buyers. The rise in header bidding, the adoption of 3rd party anti-fraud tools and IAB-led initiatives such as Ads.txt are proof points of this industry-wide trend, which has been intensifying over the last months. As advertisers and their intermediaries further decrease the number of supply partners they work with, Fyber’s ‘Keeping it Clean’ initiative sets the foundation for Fyber to be one of the few selected top tier suppliers, ensuring our marketplace adheres to the highest standard of quality.
The move is consistent with Fyber’s product strategy. The Company will continue to build products that are ap-pealing to direct and premium publishers, such as the recently launched Video Ad Monetization Platform ‘VAMP’. The existing products will be rolled out to the entire group in an integrated technology and data infra-structure beginning in early 2018.
The integration of the group companies will make Fyber one of the largest, most innovative providers of indepen-dent publisher-focus monetization technology that ser-vices all publisher verticals. We will focus on organically growing the existing business lines, led by programmatic trading and video advertising, and on increasing efficien-cy in order to achieve substantial growth both in top-line revenue and EBITDA.

Third Quarter 2017 Financial Report
8
OUR DIFFERENTIATORS
We built our strategy and focused our investment around the fastest-growing areas in ad tech: video advertising, programmatic trading and data-driven audience seg-mentation. By enhancing our offering in these areas through organic and acquisition-driven growth we were able to secure a strong market position, based on the following key strengths:
� Broad global reach through direct publisher integrations: Fyber reaches more than 1.2 billion unique users each month through the apps and digital properties that are integrated with the Company’s platforms; Fyber has a direct SDK integration with over 10,000 apps around the world.
� Advanced programmatic capabilities: Fyber offers programmatic and real-time bidding enabled ad exchanges for mobile in-app, mobile web and desktop inventory; unified auction across RTB and non-RTB demand sources allows different demand types to compete simultaneously, thus optimizing yield for publishers.
� In-app first but cross-screen: Much of Fyber’s tech-nology offering has been designed specifically for the in-app environment, which is different from browser- based environments. Across the group companies we
successfully support all digital inventory types such as mobile web and desktop. This differentiates us from competitors that originate in desktop and are now migrating to mobile and more specifically, to in-app.
� Robust video offering: Video is a technically challeng- ing product and is currently the only digital ad format with more demand than supply; Fyber supports rewarded and non-rewarded video formats across screens, all designed to facilitate low latency, broad functionality and optimized user experience.
� Targeting, user segmentation & data analytics: Fyber’s segmentation products enable publishers to sell targeted user segments to their demand partners, thus optimizing the yield they generate from advertis-ing; Fyber’s differentiated audience product combines first-party data from the publisher, with third-party data from data management platforms and Fyber’s own exchange data to give publishers a detailed view of user segments on their digital properties.
We plan to continue investing in the aforementioned ar-eas, keeping a strong market position through techno-logical leadership.
We believe that the need for publisher-focused neutral technology creates a significant market opportunity for providers like Fyber.
COMPLEMENTARY TECHNOLOGY, DEMAND, AND PUBLISHER VERTICALS
� Leading mediation platform for gaming developers
� SDK implemented by thousands of publishers
� Incentivized ad units (Rewarded video, offer wall)
� Expanded direct, SDK-implemented publisher relationships
� Ability to monetize display and interstitial video units
� Cross-screen video technology (desktop, mobile web, in-app)
� Proprietary video player� Premium video demand� In-house Ad server
� In-app mobile exchange� New app verticals (news,
social, utilities)� New demand sources
(DSP, brand campaigns)� Advanced audience
segmentation capabilities

Third Quarter 2017 Financial Report
9
ECONOMIC REVIEW
MARKET OVERVIEW
The Company provides publisher-facing technology solutions, in the digital advertising market, with a focus on mobile, video and advanced programmatic trading of digital ads. The Company confirms the general market environment as presented in detail in the Annual Report 2016. The continuing growth trends in digital advertising allow for a positive outlook on the market and growth opportunity for the Company.
Digital and especially mobile ad spend is still clearly ahead of the total media ad spending (7% for 2017 year-over-year) at 20% and 30% respectively for 2017 year-over-year (‘YoY’).Global digital ad spend increase is estimated to stay ro-bust, with its share of total media ad spend expanding from 40% in 2017 to 50% by 2021.
Digital’s growth is primarily due to advertisers’ high inter-est in mobile ad formats. Growing competition for mo-bile ad space has led to climbing prices. This year, mobile ad spending worldwide will total $143 billion, up more than 30% from 2016. This will represent nearly one-quarter of total media ad spending.While US, China, Japan, the UK and Germany remain the top five ad markets in terms of volume, the Chinese mar-ket is one of the strongest contributors to the overall and the mobile growth, based on notable investments on mobile by Chinese advertisers. It is estimated that by 2018, China’s ad spend will outgrow that of Japan, the UK and Germany combined.1
Spotlight on Programmatic AdvertisingMarket research house eMarketer recently confirmed their outlook on programmatic advertising, i.e. the share of advertising spend placed by automated means as opposed to the manual process of using insertion orders in a person-to-person setup.They estimate that by 2019, four in five digital display ad dollars will be spent through programmatic channels in the US, equaling $46 billion.Programmatic advertising offers many advantages to buyers, including the ability to target clearly defined user groups, also in real time, efficiently implementing advertising strategies and benefitting from the vast amounts of data (user profile, user behavior, shopping patterns etc.) available.
Within programmatic advertising, mobile, video and the rise of private and direct marketplaces drive the growth further. For the US market these trends mean that (1) by 2019 the majority of all programmatic display ad spend is expected to be programmatic direct / private market-place transactions, (2) 80% of all programmatic adver-tising will be generated on mobile environment and (3) more than 75% of the US digital video ad dollars will be spent in a programmatic way.2
Especially programmatic video combines the features advertisers are looking for in their ad strategies, includ-ing close targeting, user engagement, efficiency and ad control, and is therefore estimated to keep up its supe-rior growth rates.
Fyber’s Video Ad Monetization Platform is geared to profit from this market development, enabling publish-ers to adhere to the advertisers’ needs and optimizing the yield they generate from digital advertising.
1 eMarketer Oct 20172 eMarketer Oct 2017

3
6
9
11
13
10
Third Quarter 2017 Financial Report
Programmatic Display Change % % of Total Display
Programmatic Video Change % % of Total Display Source: eMarketer Oct 2017
20162015 2017 2018 2019
51%
376%
65%
46%
73%
60%
2016 2017 2018 2019
US PROGRAMMATIC DIGITAL DISPLAY AD SPENDING ($BN)
US PROGRAMMATIC DIGITAL VIDEO AD SPENDING ($BN)
2015
18 25 33 39 46
28%
42%
78%
69%
20%
25%
82%
74%
17%
18%
84%
77%
39%
114%

Third Quarter 2017 Financial Report
11
BASIS OF PRESENTATION AND HIGHLIGHTS
Below we report based on pro-forma financials which include the acquisitions of Heyzap and Inneractive as if they had already closed on 1 January 2016 - thus providing a like for like comparison and demonstrating our organic growth. The reporting structure follows the different buying chan-nels and ad formats our technology platforms support. The first component PROGRAMMATIC vs. NON- PROGRAMMATIC relates to the use of automated pro-cesses to purchase digital advertising, as opposed to the traditional way of using manual insertion orders (IO). The second component VIDEO vs. DISPLAY relates to the type of ad format used by the publishers, and lastly MOBILE vs. DESKTOP relates to the screen type.
We achieved positive adjusted EBITDA* in Q3 2017, due to the completion of the acquisitions, the identified and partly already implemented synergies and our organic growth. Going forward, the Company’s new Manage-ment Board, appointed this past July, will focus on fur-ther increasing both growth and efficiency in order to expand top-line revenue and EBITDA profit according to the stated guidance (please refer to section ‘Forecast Report’ below for details).
FOCUS ON PROGRAMMATIC TRADING
BREAKDOWN BY TRANSACTION TYPE
For the nine months ended
in % 30 Sep 2017 30 Sep 2016
Programmatic 67% 56%
Non-Programmatic 33% 44%
Total 100% 100%
The developments of the past quarters have confirmed our assumption that the market is moving towards pro-grammatic trading. Advertisers are moving away from buying ‘digital real estate’ to buying targeted audiences, preferably in real-time. Therefore, we have been focused on products that will allow growth in this segment. As of September 2017, two-thirds of our revenue was generated from programmatic platforms, compared to 56% in the same period last year. Our income from programmatic rose by 45% in comparison to the corresponding period of the previous year. Income from direct deals, i.e. ad impressions transacted in a non-programmatic way, was slightly reduced due to our focus on programmatic trading. Going forward, advanced programmatic services, including RTB, will remain a focus for the group.
REVENUE BY TRANSACTION TYPE
For the nine months ended
in € million 30 Sep 2017 30 Sep 2016 Change
Programmatic 119.1 82.0 45.2%
Non-Programmatic 58.1 65.1 (10.8%)
Total 177.2 147.1 20.5%
*Note: We define adjusted EBITDA as our consolidated earnings before financial income (expense), income taxes, depreciation and amortization, adjusted to eliminate one-off impacts such as acquisition-related costs and deferred price consideration and option plans. Adjusted EBITDA is not a measure calculated in accordance with IFRS. We have included adjusted EBITDA in this form because it is a key metric used by our Management Board and Supervisory Board to evaluate operating performance, generate future operating plans and make strategic decisions re-garding the allocation of capital. In particular, we believe that the adjusted EBITDA can act as a useful metric for period-over-pe-riod comparisons of our core business. Accordingly, we believe that this metric provides useful information to investors and others in understanding and evaluating our operational results in the same manner our management does.
BUSINESS PERFORMANCE
16
1616
17
17

Third Quarter 2017 Financial Report
12
PREMIUM VIDEO INVENTORY AS KEY GROWTH DRIVER
BREAKDOWN BY AD FORMAT TYPE
For the nine months ended
in % 30 Sep 2017 30 Sep 2016
Video 43% 43%
Display 57% 57%
Total 100% 100%
Fyber’s video offering ensures high quality video demand and optimized yield for the publishers for each ad impression. We mitigate demand fragmentation by connecting publishers to more than 180 leading Demand- Side Platforms (“DSP”) across screens and channels, serving innovative non-rewarded and rewarded video ad units. Many of the world’s top demand partners and brands connect to and buy our vast global video inventory.
In the first nine months of 2017, around 43% of our revenue was generated from video advertising, remain-ing stable compared to the same period last year. Our income from video ad formats rose by 20% in comparison to the corresponding period of the previous year. Revenue from display formats increased by 20% due to the massive growth of Inneractive’s business in China. For the remainder of 2017, we anticipate continued growth in both formats equally.
REVENUE BY AD FORMAT
For the nine months ended
in € million 30 Sep 2017 30 Sep 2016 Change
Video 75.6 62.7 20.6%
Display 101.6 84.4 20.4%
Total 177.2 147.1 20.5%
CAPITALIZING ON OUR MOBILE EXPERTISE
BREAKDOWN BY SCREEN TYPE
For the nine months ended
in % 30 Sep 2017 30 Sep 2016
Mobile 73% 77%
Desktop 27% 23%
Total 100% 100%
Mobile is dominating the digital space, both in terms of time spent on devices and the placed advertising spend. The growth of high-speed mobile networks, more power-ful smartphones and first-time sales in emerging markets have seen smartphones become many people’s most important, or only, way to access the internet. As the users spend more time on mobile, and within mobile mostly within apps as opposed to mobile web, advertis-ers are following suit and are shifting ad budgets from more traditional media to mobile and specifically in-app environments. As of September 2017, around 73% of our revenue was generated from mobile traffic, in line with our overall strategy.
REVENUE BY SCREEN TYPE
For the nine months ended
in € million 30 Sep 2017 30 Sep 2016 Change
Mobile 130.1 113.4 14.7%
Desktop 47.1 33.7 39.8%
Total 177.2 147.1 20.5%
1617 1617
161617
161617

Third Quarter 2017 Financial Report
13
PROFITABILITY
For the nine months ended For the three months ended For the year ended
in € million 30 Sep 2017 30 Sep 2016 30 Sep 2017 30 Sep 2016 31 Dec 2016
Revenue 177.2 147.1 57.5 52.3 218.1
Revenue Share to Third Parties (125.0) (103.3) (40.3) (37.3) (155.7)
Gross Margin 52.2 43.8 17.2 15.0 62.4
Gross Margin (%) 29.5% 29.8% 29.9% 28.7% 28.6%
Personnel Cost (32.9) (29.7) (10.9) (10.6) (41.0)
IT Cost (13.9) (7.4) (4.7) (3.0) (11.6)
Other Operating Expenses, net (12.7) (17.8) (3.7) (7.2) (13.7)
EBITDA (7.3) (11.1) (2.1) (5.8) (3.9)
Stock Option Plan 1.7 2.4 0.3 0.9 2.4
Other Adjustments 2.2 5.0 2.2 3.3 (3.1)
EBITDA (Adj) (3.4) (3.7) 0.4 (1.6) (4.6)
EBITDA Margin (%) (1.9%) (2.5%) 0.8% (3.0%) (2.1%)
161616 1717
Gross revenue for the first nine months increased by 20% to €177.2 million, driven by a 45% growth of in-come from programmatic trading. Revenue for Q3 2017 grew by 10% YoY. The lower growth in Q3 is due to our strategic decision, as part of the ‘Keeping it Clean’ Initia-tive, to move away from aggregated supply, including shutting down specific supply partners, and focus pri-marily on direct publisher integrations.
Gross margin (€) for Q1-Q3 2017 increased by 19% to €52.2 million compared to €43.8 million for the same pe-riod last year. The average Gross Margin (%) in the third quarter was 30% compared to 29% in the second quarter due to the decision to move away from aggregated sup-ply. This decision positively impacts our margins and off-sets the lower margins in relation to the ramp-up cost of entering the Chinese market. Going forward, in line with the strategic plan of increasing the share of programmatic revenues and the cleanup of aggregated supply, we estimate that gross margin will stabilize at around 30%.
As part of the integration of the four Fyber-owned companies, we are working on realizing the identified synergies, resulting in a positive effect on our operating expenses. Personnel expenses (not including the Employee Stock Option Plan) were stable in Q3 2017
compared to Q1 2017. The reduction in the workforce will have a positive net effect from 2018 onwards.
IT cost for Q1-Q3 2017 accumulated to €13.9 million, compared to €7.4 million for the same period last year, making up half of other operating expenses. Other oper-ating expenses in Q3 2017 were at €3.7 million signifi-cantly lower than the €7.2 million of the same period last year mainly due to transactions costs in connection the acquisition of Inneractive in Q3 2016.
Adjusted EBITDA for Q3 2017 was €0.4 million, repre-senting 0.8% of gross revenue. For Q1-Q3 2017 adjust-ed EBITDA was -€3.4 million. We estimate that the cost reductions communicated in September 2017, which in-cluded a workforce reduction of 12% of the employees, will have a positive effect from 2018 onwards, resulting in an above 5% EBITDA margin with a positive EBITDA of over €15 million for the full year 2018.
Third Quarter 2017 Financial Report
14
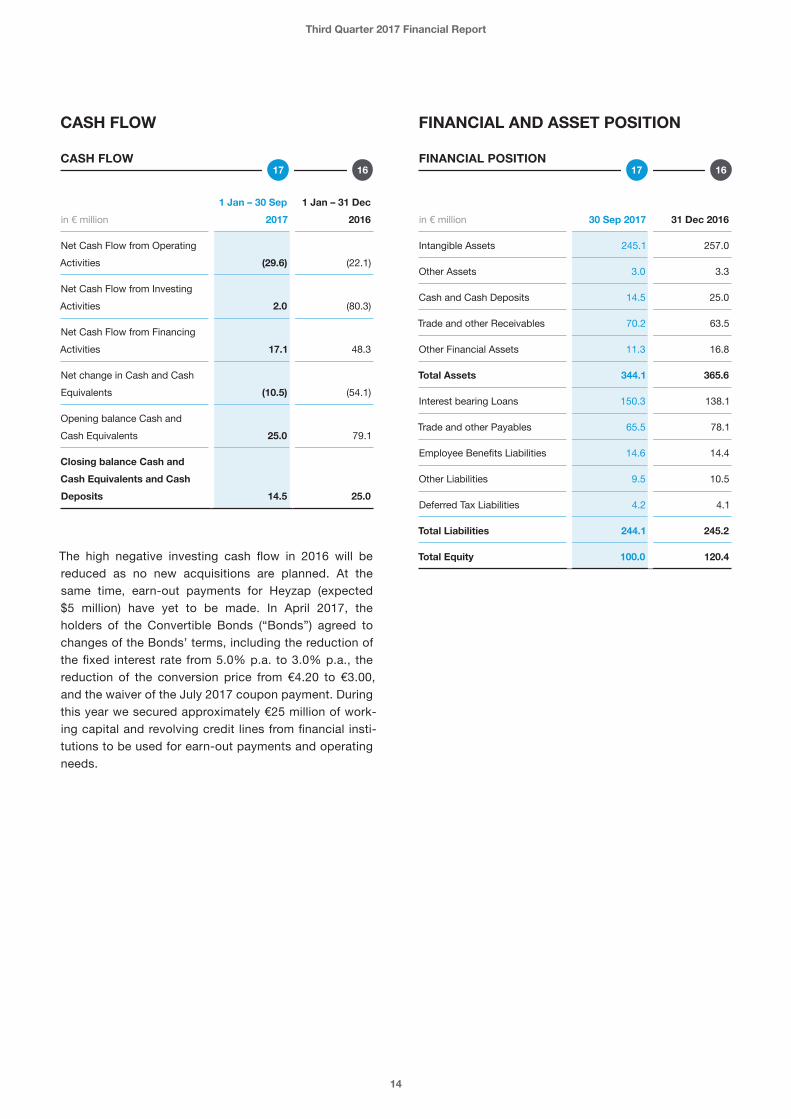
CASH FLOW
CASH FLOW
in € million
1 Jan – 30 Sep
20171 Jan – 31 Dec
2016
Net Cash Flow from Operating Activities (29.6) (22.1)
Net Cash Flow from Investing Activities 2.0 (80.3)
Net Cash Flow from Financing Activities 17.1 48.3
Net change in Cash and Cash Equivalents (10.5) (54.1)
Opening balance Cash and Cash Equivalents 25.0 79.1
Closing balance Cash and Cash Equivalents and Cash Deposits 14.5 25.0
The high negative investing cash flow in 2016 will be reduced as no new acquisitions are planned. At the same time, earn-out payments for Heyzap (expected $5 million) have yet to be made. In April 2017, the holders of the Convertible Bonds (“Bonds”) agreed to changes of the Bonds’ terms, including the reduction of the fixed interest rate from 5.0% p.a. to 3.0% p.a., the reduction of the conversion price from €4.20 to €3.00, and the waiver of the July 2017 coupon payment. During this year we secured approximately €25 million of work-ing capital and revolving credit lines from financial insti-tutions to be used for earn-out payments and operating needs.
FINANCIAL AND ASSET POSITION
FINANCIAL POSITION
in € million 30 Sep 2017
31 Dec 2016
Intangible Assets 245.1 257.0
Other Assets 3.0 3.3
Cash and Cash Deposits 14.5 25.0
Trade and other Receivables 70.2 63.5
Other Financial Assets 11.3 16.8
Total Assets 344.1 365.6
Interest bearing Loans 150.3 138.1
Trade and other Payables 65.5 78.1
Employee Benefits Liabilities 14.6 14.4
Other Liabilities 9.5 10.5
Deferred Tax Liabilities 4.2 4.1
Total Liabilities 244.1 245.2
Total Equity 100.0 120.4
1616 1717

Third Quarter 2017 Financial Report
15
The Company's shares are traded on the Prime Standard of the Frankfurt Stock Exchange under the symbol ‘FBEN’ and the ISIN code NL0012377394.
KEY SHARE DATA
Issuer Fyber N.V.
Ticker Symbol FBEN
ISIN NL0012377394
Market Frankfurt Stock Exchange, Prime Standard
Currency Euro
Number of shares 114,533,333
52 weeks high / -low 2.65 / 0.57
Based on the mandatory notifications to the Netherlands Authority for Financial Markets (AFM), upon reaching or exceeding certain thresholds of holdings by the shareholder, the Company is able to provide the below information.
Shareholders Registered above 3% of Voting Rights % Voting Rights
Former Fyber Shareholders (P+P Pöllath und Partners) 20.3%
Abu Dhabi Securities 18.0%
Altera Absolute Global Master Fund 5.5%
FIL Limited (FIL Investments International, FIL Pension Management) 3.4%
EQUITY INFORMATION
Guidance UpdatePlease refer to the Forecast Report below.
Supervisory Board Member AppointmentOn 5 October 2017 Karim Sehnaoui has been appointed to join Fyber’s Supervisory Board as a temporary mem-ber pursuant to Article 25.1 of the Company’s Articles of Association. It is expected to have the appointment con-firmed and made permanent by the next Annual General Meeting of Shareholders in May 2018.
SUBSEQUENT EVENTS

Third Quarter 2017 Financial Report
16
We are confident in Fyber’s continued growth in both the short and long term. This growth, along with our ongoing investment in sustaining a leaner, more efficient opera-tion, has been leading the Company towards positive adjusted EBITDA in the last two quarters, which is ex-pected to increase as a percentage of revenue over time.
In October, the Company announced a change in revenue guidance for 2017 and 2018. The change came as a result of Fyber’s ‘Keeping it Clean’ Initiative, which includes moving away from aggregated supply by closing down specific partners and focusing primarily on direct publisher integrations. For further details please refer to the ‘Strategy and Objectives’ section above.As a result of this initiative, and taking into account the additional risks as described in the Risk Report below, we are estimating our revenue for year 2017 to be around €240 million. The revenue forecast for 2018 will be de-pendent on the adoption of our recently launched prod-ucts and will therefore be updated in the beginning of the year.
The Company furthermore forecasts an estimated gross margin of at least 30% for H2 2017 (updated from the previously stated 29%) and a gross margin of around 30% for the full year 2018 (updated from the previously stated 28%).
Despite the change in revenue outlook, we expect to maintain profitability both in H2 2017 and in 2018. This is a result of our efficiency efforts, as well as the further realization of synergies within the group. The adjusted EBITDA forecast for H2 2017 is projected to be between €2 million and €4 million. There is no anticipated change to the 2018 EBITDA projections of at least €15 million.
FORECAST REPORT
Risk management is an integral part of Fyber’s daily business operations. It is promoted by top-level man-agement and designed to ensure that the most relevant strategic, operational, financial and compliance risks are identified, monitored and managed appropriately.Our approach to risk management, the main risks per category, and actions we take to manage, control and mitigate the risks are described in the Risk Management section of the Annual Report for the year ended 31 December 2016.
The Management Board confirms the Company’s risk profile presented there and adds the risk of changes in Google Play app store policies affecting the use of charging screen ads. Fyber has customers using these ad format as part of their monetization strategy. There is a risk that the changes in policy might affect the Company's short-term revenue development in the beginning of 2018.
RISK REPORT

Third Quarter 2017 Financial Report
17
With reference to the statement within the meaning of article 5:25d (2c) of the Financial Supervision Act, the Management Board hereby declares that, to the best of their knowledge:
� the interim financial statements prepared in accor-dance with IAS 34, “Interim Financial Reporting”, give a true and fair view of the assets, liabilities, financial position, profit or loss of the Company and the undertakings included in the consolidation taken as a whole; and
� the interim Management Board report gives a fair review of the information required pursuant to section 5:25d(8)/(9) of the Financial Supervision Act.
Berlin, 22 November 2017
The Management BoardZiv Elul | Chief Executive OfficerDani Sztern | Deputy Chief Executive OfficerYaron Zaltsman | Chief Financial OfficerCrid Yu | Chief Operating Officer
RESPONSIBILITY STATEMENT
FINANCIAL CALENDAR
Annual Report 2017 28 March 2018
Annual General Meeting 2018 15 May 2018
Q1 2018 Interim Statement 16 May 2018
H1 2018 Interim Statement 5 September 2018
Q3 2018 Interim Statement 21 November 2018
ABOUT FYBER N.V.
Fyber is a global technology company, developing a next generation platform for the programmatic trading of ads, in a data-driven environment. Its mission is to fuel the creation of quality content by empowering digital publishers and app developers to unlock the true value of their advertising properties through advanced technologies, innovative ad formats and data-driven decision-making. Fyber’s technology platforms enable cross-device advertising with a global reach of more than 1.2 billion unique monthly users, and has a strong focus on video advertising. Fyber was founded in 2010 as RNTS Media and has offices in Berlin, Tel Aviv, New York, San Francisco, London and Beijing. The Company employs more than 300 people globally and is listed on the Prime Standard of Frankfurt Stock Exchange under the symbol ‘FBEN’.
In 2016 the Company won a number of awards including: Deloitte Technology Fast 500™ 2016 EMEA company; was placed in Gruenderszene’s Top 50 growth ranking 2016, and won the Golden Bridge Gold Award 2016.
EDITORIAL
NOTES REGARDING THE UNAUDITED INTERIM REPORT
All the information in this quarterly financial report is unau-dited. This means the information has been subject neither to any audit nor to any review by an independent auditor.
Third Quarter 2017 Financial Report
18
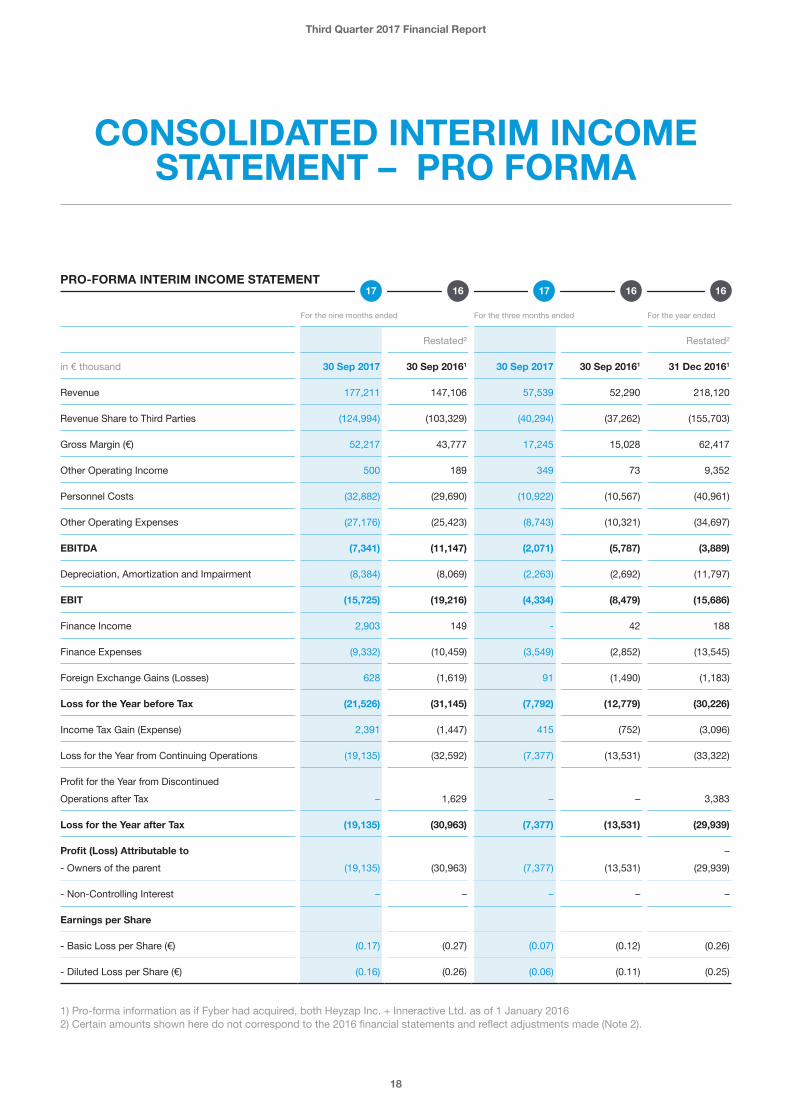
CONSOLIDATED INTERIM INCOME STATEMENT – PRO FORMA
PRO-FORMA INTERIM INCOME STATEMENT
For the nine months ended For the three months ended For the year ended
Restated² Restated²
in € thousand 30 Sep 2017 30 Sep 20161 30 Sep 2017 30 Sep 20161 31 Dec 20161
Revenue 177,211 147,106 57,539 52,290 218,120
Revenue Share to Third Parties (124,994) (103,329) (40,294) (37,262) (155,703)
Gross Margin (€) 52,217 43,777 17,245 15,028 62,417
Other Operating Income 500 189 349 73 9,352
Personnel Costs (32,882) (29,690) (10,922) (10,567) (40,961)
Other Operating Expenses (27,176) (25,423) (8,743) (10,321) (34,697)
EBITDA (7,341) (11,147) (2,071) (5,787) (3,889)
Depreciation, Amortization and Impairment (8,384) (8,069) (2,263) (2,692) (11,797)
EBIT (15,725) (19,216) (4,334) (8,479) (15,686)
Finance Income 2,903 149 - 42 188
Finance Expenses (9,332) (10,459) (3,549) (2,852) (13,545)
Foreign Exchange Gains (Losses) 628 (1,619) 91 (1,490) (1,183)
Loss for the Year before Tax (21,526) (31,145) (7,792) (12,779) (30,226)
Income Tax Gain (Expense) 2,391 (1,447) 415 (752) (3,096)
Loss for the Year from Continuing Operations (19,135) (32,592) (7,377) (13,531) (33,322)
Profit for the Year from Discontinued Operations after Tax – 1,629 – – 3,383
Loss for the Year after Tax (19,135) (30,963) (7,377) (13,531) (29,939)
Profit (Loss) Attributable to –- Owners of the parent (19,135) (30,963) (7,377) (13,531) (29,939)
- Non-Controlling Interest – – – – –
Earnings per Share
- Basic Loss per Share (€) (0.17) (0.27) (0.07) (0.12) (0.26)
- Diluted Loss per Share (€) (0.16) (0.26) (0.06) (0.11) (0.25)
1) Pro-forma information as if Fyber had acquired, both Heyzap Inc. + Inneractive Ltd. as of 1 January 20162) Certain amounts shown here do not correspond to the 2016 financial statements and reflect adjustments made (Note 2).
161616 1717

Third Quarter 2017 Financial Report
19
CONSOLIDATED INTERIM INCOME STATEMENT
INTERIM INCOME STATEMENT
For the nine months ended For the three months ended For the year ended
Restated1 Restated1
in € thousand 30 Sep 2017 30 Sep 2016 30 Sep 2017 30 Sep 2016 31 Dec 20161
Revenue 177,211 105,645 57,539 45,891 176,786
Revenue Share to Third Parties (124,994) (76,092) (40,294) (32,954) (128,551)
Gross Margin (EUR) 52,217 29,553 17,245 12,937 48,235
Other Operating Income 500 189 349 73 9,351
Personnel Costs (32,882) (24,034) (10,922) (9,568) (35,350)
Other Operating Expenses (27,176) (20,194) (8,743) (9,046) (29,627)
EBITDA (7,341) (14,486) (2,071) (5,604) (7,391)
Depreciation, Amortization and Impairment
(8,384) (5,551) (2,263) (2,315) (9,286)
EBIT (15,725) (20,037) (4,334) (7,919) (16,677)
Finance Income 2,903 149 - 42 187
Finance Expenses (9,332) (6,325) (3,549) (2,746) (9,417)
Foreign Exchange Gains (Losses) 628 (1,755) 91 (1,658) (1,183)
Loss for the Year before Tax (21,526) (27,968) (7,792) (12,281) (27,090)
Income Tax Gain (Expense) 2,391 (493) 415 (161) (2,148)
Loss for the Year from Continuing Operations (19,135) (28,461) (7,377) (12,442) (29,238)
Profi for the Year from Discontinued Operations after Tax
- 1,629 - – 3,383
Loss for the Year after Tax (19,135) (26,832) (7,377) (12,442) (25,855)
Earnings per ShareFrom Discontinued Operations
- Basic Loss per Share (€) – 0.01 – – (0.03)
- Diluted Loss per Share (€) – 0.01 – – (0.03)
From Total Operations
- Basic Loss per Share (€) (0.17) (0.24) (0.07) (0.11) (0.23)
- Diluted Loss per Share (€) (0.16) (0.23) (0.06) (0.11) (0.22)
1) Certain amounts shown here do not correspond to the 2016 financial statements and reflect adjustments made (Note 2).
161616 1717

Third Quarter 2017 Financial Report
20
CONSOLIDATED INTERIM STATEMENT OF OTHER
COMPREHENSIVE INCOME
INTERIM STATEMENT OF OTHER COMPREHENSIVE INCOME
For the nine months ended For the three months ended For the year ended
in € thousand 30 Sep 2017 30 Sep 2016¹ 30 Sep 2017 30 Sep 2016¹ 31 Dec 2016¹
Loss for the Year after Tax (19,135) (26,832) (7,377) (12,442) (25,855)
To be reclassified to Profit and Loss in Subsequent Periods
- Exchange differences on currency translation
(8,063) (1,318) (348) (1,473) 2,347
- Income Tax Effect – – – – –
Other Comprehensive Income for the Year, net of Tax
(8,063) (1,318) (348) (1,473) 2,347
Total Comprehensive Income for the Year
(27,198) (28,150) (7,725) (13,915) (23,508)
Total Comprehensive Income attributable to:
- Owners of the Parent (27,198) (28,150) (7,725) (13,915) (23,508)
- Non-Controlling Interest – – – – –
1) Pro-forma information as if Fyber had acquired, both Heyzap Inc. + Inneractive Ltd. as of 1 January 2016
161616 1717
Third Quarter 2017 Financial Report
21
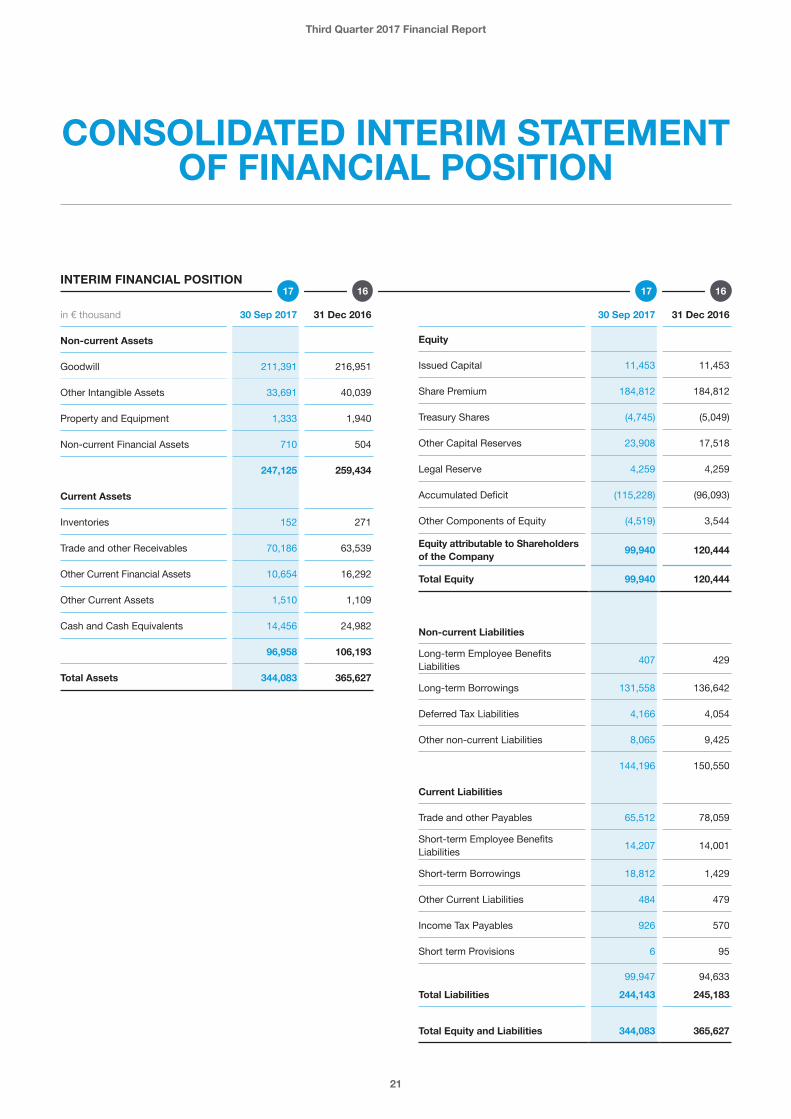
INTERIM FINANCIAL POSITION
CONSOLIDATED INTERIM STATEMENT OF FINANCIAL POSITION
in € thousand 30 Sep 2017 31 Dec 2016
Non-current Assets
Goodwill 211,391 216,951
Other Intangible Assets 33,691 40,039
Property and Equipment 1,333 1,940
Non-current Financial Assets 710 504
247,125 259,434
Current Assets
Inventories 152 271
Trade and other Receivables 70,186 63,539
Other Current Financial Assets 10,654 16,292
Other Current Assets 1,510 1,109
Cash and Cash Equivalents 14,456 24,982
96,958 106,193
Total Assets 344,083 365,627
16 1617 17
Non-current Liabilities
Long-term Employee Benefits Liabilities 407 429
Long-term Borrowings 131,558 136,642
Deferred Tax Liabilities 4,166 4,054
Other non-current Liabilities 8,065 9,425
144,196 150,550
Current Liabilities
Trade and other Payables 65,512 78,059
Short-term Employee Benefits Liabilities 14,207 14,001
Short-term Borrowings 18,812 1,429
Other Current Liabilities 484 479
Income Tax Payables 926 570
Short term Provisions 6 95
99,947 94,633
Total Liabilities 244,143 245,183
Total Equity and Liabilities 344,083 365,627
30 Sep 2017 31 Dec 2016
Equity
Issued Capital 11,453 11,453
Share Premium 184,812 184,812
Treasury Shares (4,745) (5,049)
Other Capital Reserves 23,908 17,518
Legal Reserve 4,259 4,259
Accumulated Deficit (115,228) (96,093)
Other Components of Equity (4,519) 3,544
Equity attributable to Shareholders of the Company 99,940 120,444
Total Equity 99,940 120,444

Third Quarter 2017 Financial Report
22
INTERIM CASH FLOW
CONSOLIDATED INTERIM STATEMENT OF CASH FLOWS
For the nine months ended
in € thousand 30 Sep 2017 30 Sep 2016
Loss for the year before Tax (21,526) (27,968)
Depreciation, Amortization and Impairment 8,384 5,551
Financial Income and Expenses 6,429 6,176
Cash Flow from Discontinued Operations - (3,525)
Other Non-cash Effects 2,752 1,752
Reimbursement of Virtual Share Program by former Fyber Shareholders - 4,624
Changes in Provisions, Employee Benefit Obligations 94 (6,224)
Changes in Working Capital (18,113) (987)
Cash generated from Operations (21,980) (20,601)
Interest Received 10 -
Interest Paid (7,331) (6,400)
Income Tax Paid (349) (1,394)
Net Cash Flow from Operating Activities (29,650) (28,395)
Purchases of Property and Equipment (180) (566)
Purchases, Capitalization of Intangible Assets (3,208) (3,449)
Acquisition of a Subsidiary, Net of Cash Acquired - (71,338)
Change in Investments and Financial Assets, Net 5,431 (15,297)
Net Cash Flow from Investing Activities 2,043 (90,650)
Proceeds from Long-term Borrowings - 51,111
Transaction Costs on the Issue of Convertible Bonds - (1,198)
Proceeds from Short-term Borrowings 17,383 1,032
Net Cash Flow from Financing Activities 17,383 50,945
Net Changes in Cash (10,224) (68,100)
Cash at Beginning of Period 24,982 79,123
Net Foreign Exchange Difference (302) (64)
Net Changes in Cash (10,224) (68,100)
Cash and Cash Equivalents at End of Period 14,456 10,959
1617

Third Quarter 2017 Financial Report
23
CONDENSED CONSOLIDATED INTERIM STATEMENT
OF CHANGE IN EQUITY
EQUITY ATTRIBUTABLE TO OWNERS OF THE PARENT
in € thousandOrdinary Shares
Share premium
Treasury Shares
Other capital reserves
Legal reserve
Accumu- lated deficit
Other compo-nents of equity
Total equity
01 Jan 2017 11,453 184,812 (5,049) 17,518 4,259 (96,093) 3,544 120,444
Loss for the Year after Tax from Continuing Operations - - - - - (19,135) - (19,135)
Other Comprehensive income for the Period, Net of Tax - - - - - - (8,063) (8,063)
Total Comprehensive income for the Year - - - - - (19,135) (8,063) (27,198)
Share-based Payments - - - 1,031 - - - 1,031
Acquisition of Treasury Shares - - 304 - - - - 304
Equity Component of the Convertible Bonds, Net of Tax - - - 5,069 - - - 5,069
Transactions with Owners - - 304 6,100 - - - 6,404
30 Sep 2017 11,453 184,812 (4,745) (23,618) 4,259 (115,228) (4,519) 99,940
EQUITY ATTRIBUTABLE TO OWNERS OF THE PARENT
in € thousandOrdinary Shares
Share premium
Treasury Shares
Other capital reserves
Legal reserve
Accumu- lated deficit
Other compo-nents of equity
Total equity
01 Jan 2016 11,453 184,812 - 13,366 3,965 (69,944) 1,197 144,849
Profit (Loss) for the Year after Tax from Continuing Operations - - - - 294 (29,532) - (29,238)
Profit (Loss) for the Year after Tax from Discontinued Operations - - - - - 3,383 - 3,383
Other Comprehensive income for the Period, Net of Tax - - - - - - 2,347 2,347
Total Comprehensive income for the Year - - - - 294 (25,149) 2,347 (23,508)
Share-based Payments - - - 1,715 - - - 1,715
Acquisition of Treasury Shares - - (5,049) - - - - (5,049)
Equity Component of the Convertible Bond, Net of Tax - - - 2,437 - - - 2,437
Transactions with Owners - - (5,049) 4,152 - - - (897)
31 Dec 2016 11,453 184,812 (5,049) 17,518 4,259 (96,093) 3,544 120,444
Third Quarter 2017 Financial Report
24
NOTES TO THE CONSOLIDATED FINANCIAL STATEMENTS
ther to any audit nor to any review by an independent auditor.
The accounting policies applied are consistent with the policies applied in the consolidated financial statements for the year ended 31 December 2016 except for the change in accounting policies describe in B.
B. Change in accounting policiesIn order to increase comparability of the financial reporting the Group adopted the practice commonly applied within the industry to present foreign currency gains and losses resulting from transactions denominated in foreign curren-cies within the finance rather than in the operating result. Further, those gains and losses, which primarily result from currency fluctuation between the Euro and the US Dollar, is presented as a net result. This change increases transparency about the net impact of currency fluctuations to profit and loss of the Group as well as to the actual operating performance of the Group.
Until the end of the financial year 2016, foreign currency gains have been presented in other operating income and foreign currency losses in other operating expenses. Prior year figures have been adjusted respectively.
For Q1-Q3 2017 foreign currency gains of €6,083 thou-sands (Q1-Q3 2016: €3,542 thousands) and foreign cur-rency losses of €5,455 thousands (Q1-Q3 2016: €5,297 thousands) were reclassified to foreign exchange gains (losses).
C. Business combinations and goodwillBusiness combinations are accounted for using the ac-quisition method. The cost of an acquisition is measured as the aggregate of the consideration transferred, mea-sured at fair value at acquisition date and the amount of any non-controlling interest in the acquiree. For each business combination, the Group elects wheth-er it measures the non-controlling interest in the acquiree either at fair value or at the proportionate share of the acquiree’s identifiable net assets. Acquisition costs in-curred are expensed and included in other operating ex-penses. When the Group acquires a business, it assesses the financial assets and liabilities assumed for
NOTE 1 - FYBER N.V.
Fyber N.V. (formerly RNTS Media N.V.) is a global provider for advertising technology.
Fyber is incorporated in Amsterdam, The Netherlands, and is registered with the Dutch Chamber of Commerce under the number 54747805. The Company’s head-office is at Johannisstraße 20, 10117 Berlin, Germany. The Company's shares are traded on the Prime Standard of the Frankfurt Stock Exchange under the ISIN code NL0012377394.
Fyber, headquartered in Germany, developed a mobile advertising supply-side platform helps app developers and publishers monetize their traffic more effectively. It also offers software-based solutions (like real-time bid-ding and programmatic trading, ad analytics & reporting, yield optimization, ad stack management, audience seg-mentation tools) to increase performance. In Year 2016, Heyzap Inc., US-based provider of SSP and mediation services has been acquired. In the same year, Inneractive Ltd. headquartered in Tel Aviv, Israel has been acquired. Inneractive is an independent global mobile real-time bid-ding ad exchange and supply side platform focused on powering native and video ads. Fyber has offices in Berlin, Tel Aviv, San Francisco, New York, London and Beijing.
NOTE 2 - ACCOUNTING POLICIES
A. Basis of preparationThe interim condensed consolidated financial statements for the nine month period ended 30 September 2017 have been prepared in accordance with IAS 34 Interim Financial Reporting as adopted by the European Union.
The interim condensed consolidated financial statements do not include all the information and disclosures re-quired by International Financial Reporting Standards (IFRS) in the annual financial statements, and should be read in conjunction with the Group’s consolidated finan-cial statements for the year ended 31 December 2016. All the information in this interim financial report is unau-dited. This means the information has been subject nei-

Third Quarter 2017 Financial Report
25
E. Impairment of intangible assets and property and equipment
The Group assesses at each reporting date whether there is an indication that an asset may be impaired. If any indication exists, or when annual impairment testing for an asset is required, the Group estimates the asset’s recoverable amount. An asset’s recoverable amount is the higher of an asset’s or cash-generating unit’s (CGU) fair value less costs of disposal and its value in use and is determined for an individual asset, unless the asset does not generate cash inflows that are largely indepen-dent of those from other assets or groups of assets. When the carrying amount of an asset or CGU exceeds its recoverable amount, the asset is considered impaired and is written down to its recoverable amount. In as-sessing the value in use, the estimated future cash flows are discounted to their present value using a pre-tax dis-count rate that reflects current market assessments of the time value of money and the risks specific to the as-set. In determining fair value less costs of disposal, re-cent market transactions are taken into account, if available. If no such transactions can be identified, an appropriate valuation model is used.
Goodwill and intangible assets with an indefinite useful life are not amortized, but will be tested for impairment annually and when circumstances indicate that they may be impaired. A previously recognized impairment loss for assets excluding goodwill will be reversed when the re-coverable amount exceeds the carrying amount of the asset again. The reversal is limited to the amount which would have resulted if previous impairment losses had not been recognized. A recognized impairment loss in goodwill will not be reversed. The group tests annually if goodwill has suffered any impairment in accordance with the accounting policies.
F. Accounting estimates and assumptionsThe preparation of the consolidated financial statements requires management to make estimates and assump-tions that affect the presentation of assets and liabilities, the disclosure of contingent assets and liabilities at the date of the financial statements as well as the reported amounts and presentation of income and expenses during the period. Management based its assumptions and estimates on past experience and on other factors including the prevailing economic environment available when the consolidated financial statements were pre-pared. Existing circumstances and assumptions about future developments, however, may change due to mar-ket changes or circumstances arising beyond the control of the Group. Actual amounts may differ from these esti-mates under different assumptions and conditions. The estimates and assumptions that have a significant risk of
appropriate classification and designation in accordance with the contractual terms, economic circumstances and pertinent conditions as at the acquisition date. This in-cludes the separation of embedded derivatives in host contracts by the acquiree.
Goodwill is initially measured at cost, being the excess of the aggregate of the consideration transferred and the amount recognized for non-controlling interest over the fair value of the net identifiable assets acquired and liabilities assumed. If this consideration is lower than the fair value of the net assets of the subsidiary acquired, the difference is recognized in the income statement.
After initial recognition, goodwill is measured at cost less any accumulated impairment losses. For the purpose of impairment testing, goodwill acquired in a business combination is, from the acquisition date, allocated to each of the Group’s cash-generating units that are expected to benefit from the combination, irrespective of whether other assets or liabilities of the acquiree are assigned to those units. Where goodwill has been allocated to a cash-generating unit and part of the operation within that unit is disposed of, the goodwill associated with the disposed operation is included in the carrying amount of the operation when determining the gain or loss on disposal. Goodwill disposed in these circumstances is measured based on the relative values of the disposed operation and the portion of the cash-generating unit retained.
D. Recognition of income and expensesRevenue is recognized to the extent that it is probable that the economic benefit will flow to the Group and the revenue can be reliably measured, regardless of when payment is being made. Revenue is measured at the fair value of the consideration received or receivable, taking into account contractually defined terms of payment and excluding taxes or duties.
The service revenue from delivering advertising services is recognized when the service is rendered. This usually occurs when the ad impression was generated which is the ad is fetched from its source and served on the user’s device. Depending on the requirements of the specific campaign, further requirements might need to be fulfilled such as the device user has clicked on the ad, down-loaded specific content, provided personal data etc.
Operating expenses are recognized either when the cor-responding goods are received or services are rendered.

Third Quarter 2017 Financial Report
26
NOTE 4 - SELECTED NOTES TO THE CONSOLIDATED STATEMENT OF COMPREHENSIVE INCOME
A. RevenueThe revenues shown in the income statement relate sole-ly to the advertising services realized through Fyber Plat-form incl. Heyzap, Fyber RTB and Inneractive. Revenues represent the money collected from advertisers while gross margin (€) represents these revenues net of pay-outs to publishers.
B. Other operating income Other operating income for Q1-Q3 2017 of € 500 thou-sands (Q1-Q3 2016: € 189 thousands) results primarily from the sublease of otherwise unused office space as well as from the reversal of accruals from prior periods.
C. Other operating expenses The following table provides an overview of the material items of other operating expenses:
in € thousands1 Jan - 30 Sep
20171 Jan - 30 Sep
2016
IT 13,852 5,074
Marketing 1,988 1,184
Professional services and contractors 2,100 2,326
Rent & utilities 1,867 1,254
Legal & consulting 1,320 2,343
Tax & accounting 1,342 1,189
Travel & entertainment 1,322 887
Bad debt 921 782
Service fees 691 578
Supervisory board remuneration 530 279
Training & recruiting 570 983
Internal events 427 197
Publisher integration bonus 145 209
Publisher integration bonus - 2,048
Other expenses 101 861
27,176 20,194
causing a material adjustment to the carrying amounts of assets and liabilities within the next financial year are discussed below. Information regarding the carrying amounts determined with the use of estimates can be found in the comments on the specific line items.
NOTE 3 - RESTRUCTURING OF CONVERTIBLE BOND AND NET DEBT
On 18 April 2017 the holders of the Convertible Bonds agreed to changes of the Bond’s terms proposed by the Group’ management. Most notably these were:
� Reduction of the fixed interest rate from 5.0% p.a. to 3.0% p.a.
� Reduction of the conversion price from €4.20 to €3.00� Waiver of the July 2017 coupon payment
The restructuring of the Convertible Bonds has been accounted for as an extinguishment of the existing liabil-ity and the recognition of a new liability. The difference between the carrying value of the existing liability and the fair value of the new liability, taking into account all incremental transaction costs is recognized in profit and loss. As a compound financial instrument the Convertible Bonds were upon initial recognition split into a liability and an equity component respectively. The liability component was determined by assuming a market inter-est rate of 7.8% p.a. Transaction costs for the restructur-ing of the bonds of about € 423 thousands were allocated to the liability and the equity component on a pro rata basis.
The equity component is recognized in other capital re-serves.
As of 30 September 2017 net debt is as follows:
in € thousands 30 Sep 2017 31 Dec 2016
Long-term borrowings 131,558 136,642
Short-term borrowings 18,812 1,429
Accrued interest payable on convertible bond 1,233 3,223
Cash and cash equivalents (14,456) (24,982)
Net debt / (cash) 137,147 116,312
Long-term borrowings solely consist of the convertible bond liability while short-term borrowings are withdrawn amounts on the working capital facilities.
1617
1617

Third Quarter 2017 Financial Report
27
D. Operating segmentsThe Group manages its operations along the following four operating segments:
SEGMENT TYPES OF PRODUCTS AND SERVICES
Fyber Platform Comprised of the 2014 Fyber acquisi-tion and the 2016 Heyzap acquisition; providing supply side platform and me-diation services for mobile publishers predominantly in the gaming industry.
Fyber RTB Representing the 2015 Falk Realtime acquisition that has grown substantially since then; providing programmatic real time bidding services in the desktop space with a specific focus on video.
Inneractive Representing the 2016 Inneractive ac-quisition which provides supply side platform and programmatic services to mobile publishers outside of the gam-ing industry.
Others Other services not included in the oth- er segments incl. corporate services.
The financial performance of each segment for H1 2017 and H1 2016 are as follows:
1 JAN - 30 SEP 2017
Revenue EBITDANet profit / loss
EUR k EUR k EUR k
Fyber Platform 54,940 (9,605) (15,995)
Fyber RTB 50,051 4,717 3,669
Inneractive 71,124 4,420 586
Others 1,096 (6,873) (7,395)
Subtotal from continu-ing operations 177,211 (7,341) (19,135)
Discontinued operations - - -
177,211 (7,341) (19,135)
1 JAN - 30 SEP 2016
RevenueAdjusted EBITDA
Net profit / loss
EUR k EUR k EUR k
Fyber Platform 58,309 (11,446) (17,267)
Fyber RTB 31,166 1,978 1,556
Inneractive 14,239 1,246 (899)
Others 1,931 (6,264) (11,851)
Subtotal from continuing operations 105,645 (14,486) (28,461)
Discontinued operations - - 1,629
105,645 (14,486) (26,832)
Reconciliation from the amounts in the income state-ment to the total amounts of all reportable segments was not prepared since the information of the reportable segments completely match with the amounts shown in the financial statements.

Third Quarter 2017 Financial Report
E. Geographic informationBreakdown of revenue according to customers’ location:
1 JAN - 30 SEP 2017
in € thousandsFyber Platform
Fyber RTB
Inner- active Other
Total revenue
United States 28,188 19,340 45,743 537 93,808
Europe, Middle East and Africa 16,287 30,700 22,609 507 70,103
Asia-Pacific 8,878 11 2,772 6 11,667
Rest of the world 1,587 - - 46 1,633
54,940 50,051 71,124 1,096 177,211
1 JAN - 30 SEP 2016
in € thousandsFyber Core
Fyber RTB
Inner- active Other
Total revenue
United States 29,076 15,970 9,695 1,528 56,269
Europe, Middle East and Africa 17,940 15,166 3,986 377 37,469
Asia-Pacific 9,433 13 558 5 10,009
Rest of the world 1,860 17 - 21 1,898
58,309 31,166 14,239 1,931 105,645

Third Quarter 2017 Financial Report
29
FYBER N.V. Third Quarter 2017 Financial Report