Embed Size (px)
Citation preview
7/29/2019 FY 2069-70 Ten month14.xls
http://slidepdf.com/reader/full/fy-2069-70-ten-month14xls 1/5
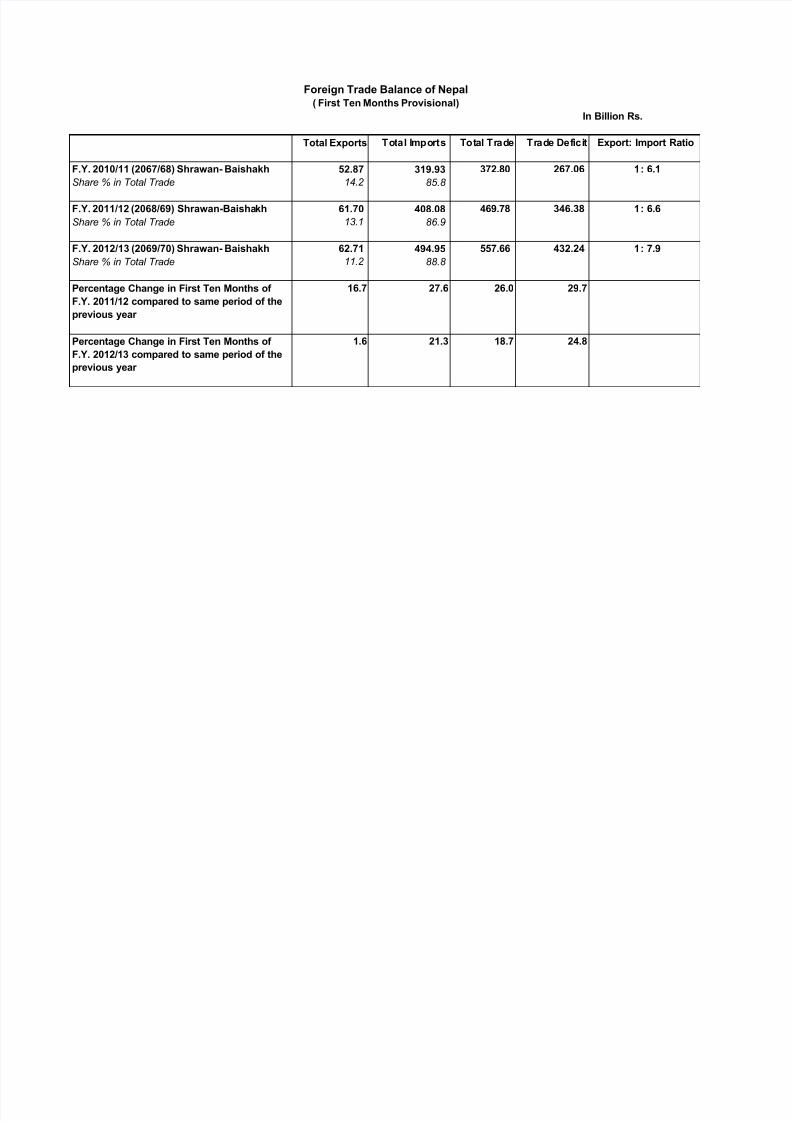
In Billion Rs.
Total Exports Total Imports Total Trade Trade Deficit
F.Y. 2010/11 (2067/68) Shrawan- Baishakh 52.87 319.93 372.80 267.06 1: 6.1
Share % in Total Trade 14.2 85.8
F.Y. 2011/12 (2068/69) Shrawan-Baishakh 61.70 408.08 469.78 346.38 1: 6.6
Share % in Total Trade 13.1 86.9
F.Y. 2012/13 (2069/70) Shrawan- Baishakh 62.71 494.95 557.66 432.24 1: 7.9
Share % in Total Trade 11.2 88.8
Percentage Change in First Ten Months of
F.Y. 2011/12 compared to same period of the
previous year
16.7 27.6 26.0 29.7
Percentage Change in First Ten Months of
F.Y. 2012/13 compared to same period of the
previous year
1.6 21.3 18.7 24.8
Foreign Trade Balance of Nepal
( First Ten Months Provisional)
Export: Import Ratio
7/29/2019 FY 2069-70 Ten month14.xls
http://slidepdf.com/reader/full/fy-2069-70-ten-month14xls 2/5
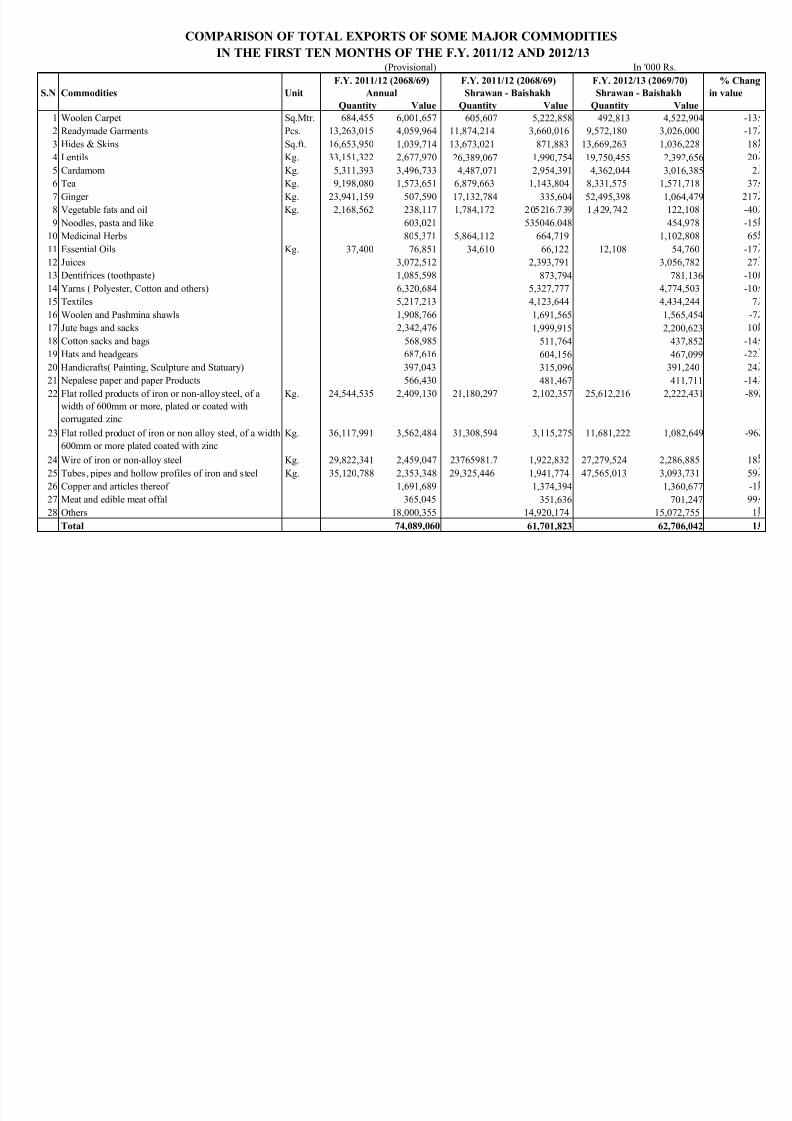
(Provisional) In '000 Rs.
% Chang
S.N Commodities Unit in value
Quantity Value Quantity Value Quantity Value
1 Woolen Carpet Sq.Mtr. 684,455 6,001,657 605,607 5,222,858 492,813 4,522,904 -13.
2 Readymade Garments Pcs. 13,263,015 4,059,964 11,874,214 3,660,016 9,572,180 3,026,000 -17.3 Hides & Skins Sq.ft. 16,653,950 1,039,714 13,673,021 871,883 13,669,263 1,036,228 18.
4 Lentils Kg. 33,151,322 2,677,970 26,389,067 1,990,754 19,750,455 2,392,656 20.
5 Cardamom Kg. 5,311,393 3,496,733 4,487,071 2,954,391 4,362,044 3,016,385 2.
6 Tea Kg. 9,198,080 1,573,651 6,879,663 1,143,804 8,331,575 1,571,718 37.
7 Ginger Kg. 23,941,159 507,590 17,132,784 335,604 52,495,398 1,064,479 217.
8 Vegetable fats and oil Kg. 2,168,562 238,117 1,784,172 205216.739 1,429,742 122,108 -40.
9 Noodles, pasta and like 603,021 535046.048 454,978 -15.
10 Medicinal Herbs 805,371 5,864,112 664,719 1,102,808 65.
11 Essential Oils Kg. 37,400 76,851 34,610 66,122 12,108 54,760 -17.
12 Juices 3,072,512 2,393,791 3,056,782 27.13 Dentifrices (toothpaste) 1,085,598 873,794 781,136 -10.
14 Yarns ( Polyester, Cotton and others) 6,320,684 5,327,777 4,774,503 -10.
15 Textiles 5,217,213 4,123,644 4,434,244 7.
16 Woolen and Pashmina shawls 1,908,766 1,691,565 1,565,454 -7.
17 Jute bags and sacks 2,342,476 1,999,915 2,200,623 10.
18 Cotton sacks and bags 568,985 511,764 437,852 -14.
19 Hats and headgears 687,616 604,156 467,099 -22.
20 Handicrafts( Painting, Sculpture and Statuary) 397,043 315,096 391,240 24.
21 Nepalese paper and paper Products 566,430 481,467 411,711 -14.
22 Flat rolled products of iron or non-alloy steel, of awidth of 600mm or more, plated or coated with
corrugated zinc
Kg. 24,544,535 2,409,130 21,180,297 2,102,357 25,612,216 2,222,431 -89.
23 Flat rolled product of iron or non alloy steel, of a width
600mm or more plated coated with zinc
Kg. 36,117,991 3,562,484 31,308,594 3,115,275 11,681,222 1,082,649 -96.
24 Wire of iron or non-alloy steel Kg. 29,822,341 2,459,047 23765981.7 1,922,832 27,279,524 2,286,885 18.
25 Tubes, pipes and hollow profiles of iron and steel Kg. 35,120,788 2,353,348 29,325,446 1,941,774 47,565,013 3,093,731 59.
26 Copper and articles thereof 1,691,689 1,374,394 1,360,677 -1.
27 Meat and edible meat offal 365,045 351,636 701,247 99.
28 Others 18,000,355 14,920,174 15,072,755 1.
Total 74,089,060 61,701,823 62,706,042 1.
COMPARISON OF TOTAL EXPORTS OF SOME MAJOR COMMODITIES
Annual Shrawan - Baishakh Shrawan - Baishakh
IN THE FIRST TEN MONTHS OF THE F.Y. 2011/12 AND 2012/13
F.Y. 2011/12 (2068/69) F.Y. 2011/12 (2068/69) F.Y. 2012/13 (2069/70)

7/29/2019 FY 2069-70 Ten month14.xls
http://slidepdf.com/reader/full/fy-2069-70-ten-month14xls 3/5
In '000 Rs.
S.N Commodities F.Y. 2011/12 F.Y. 2011/12 F.Y. 2012/13 % Change
2068/69 2068/69 2069/70 in value
Annual Shrawan - Baishakh Shrawan - Baishakh
1 Gold 25,773,887 21,500,978 21,234,868 -1.2
2 Iron & Steel and products thereof 49,644,704 41,322,419 49,656,781 20.2
3 Copper and articles thereof 3,935,748 3,331,292 3,397,012 2.0
4 Aluminium and articles thereof 3,626,370 2,912,363 4,382,455 50.5
5 Zinc and articles thereof 2,668,535 2,183,363 2,132,591 -2.3
6 Machinery and parts 26,340,288 21,437,218 27,127,756 26.5
7 Electronic and Electrical Equipments 21,307,024 17,866,317 19,971,329 11.8
8 Transport Vehicles and parts thereof 23,916,218 19,950,601 27,416,094 37.4
9 Telecommunication Equipment and parts 10,188,830 8,406,616 9,953,140 18.4
10 Aircraft and parts thereof 1,632,262 1,173,532 1,825,551 55.6
11 Rubber and articles thereof 3,643,026 2,849,906 3,954,716 38.8
12 Cotton ( Yarn and Fabrics) 3,547,604 2,996,233 3,693,127 23.3
13 Man-made staple fibres ( Synthetic, Polyester etc) 8,010,800 6,619,569 7,066,809 6.8
14 Articles of apparel and clothing accessories 7,852,395 6,880,037 7,583,789 10.2
15 Wool, fine or coarse animal hair 2,524,017 2,033,322 2,160,786 6.3
16 Cereals 13,413,363 9,388,478 16,163,361 72.2
17 Low erucic acid rape or colza seeds 2,696,172 2,059,586 2,250,343 9.3
18 Crude palm Oil 3,698,380 3,210,985 3,173,603 -1.2
19 Crude soyabean oil 10,131,122 7,583,455 11,083,759 46.2
20 Pharmaceutical products 13,718,169 11,271,277 12,626,543 12.0
21 Chemicals 6,159,903 5,021,579 5,702,266 13.6
22 Cement 3,471,213 2,898,612 3,348,929 15.5
23 Cement Clinkers 6,904,343 5,390,491 4,889,013 -9.3
24 Fertilizers 9,503,137 8,832,494 11,924,555 35.0
25 Polythene Granules 10,897,876 9,354,568 10,387,496 11.0
26 Industrial monocarboxylic fatty acid 1,857,906 1,550,132 2,029,738 30.9
27 Petroleum Products 97,039,163 79,246,279 90,795,182 14.6
28 Others 124,058,619 106,597,966 129,016,684 21.0
Total 498,161,074 408,080,215 494,948,275 21.3
Source:- Trade & Export Promotion Centre
COMPARISON OF TOTAL IMPORTS OF SOME MAJOR COMMODITIES
IN THE FIRST TEN MONTHS OF THE F.Y. 2011/12 AND 2012/13
7/29/2019 FY 2069-70 Ten month14.xls
http://slidepdf.com/reader/full/fy-2069-70-ten-month14xls 4/5
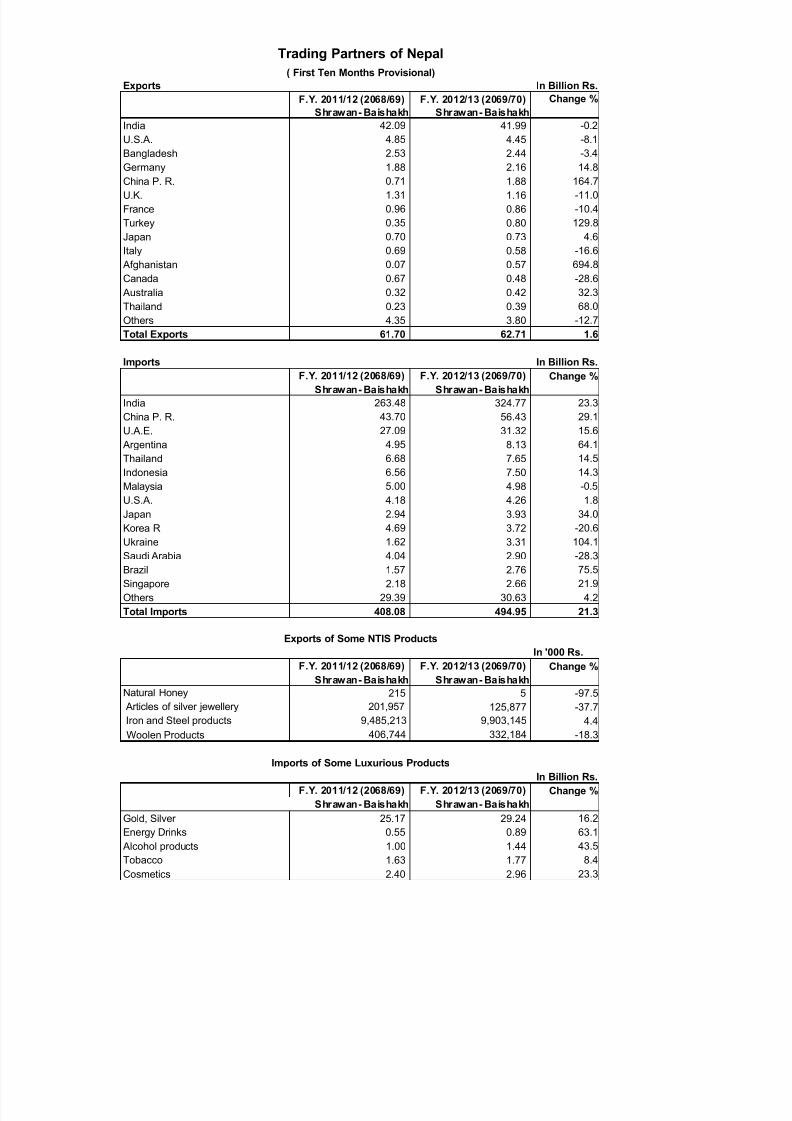
Exports In Billion Rs.
F.Y. 2011/12 (2068/69) F.Y. 2012/13 (2069/70) Change %
Shrawan- Baishakh Shrawan- Baishakh
India 42.09 41.99 -0.2
U.S.A. 4.85 4.45 -8.1
Bangladesh 2.53 2.44 -3.4
Germany 1.88 2.16 14.8
China P. R. 0.71 1.88 164.7
U.K. 1.31 1.16 -11.0
France 0.96 0.86 -10.4
Turkey 0.35 0.80 129.8
Japan 0.70 0.73 4.6
Italy 0.69 0.58 -16.6
Afghanistan 0.07 0.57 694.8Canada 0.67 0.48 -28.6
Australia 0.32 0.42 32.3
Thailand 0.23 0.39 68.0
Others 4.35 3.80 -12.7
Total Exports 61.70 62.71 1.6
Imports In Billion Rs.
F.Y. 2011/12 (2068/69) F.Y. 2012/13 (2069/70) Change %
Shrawan- Baishakh Shrawan- Baishakh
India 263.48 324.77 23.3
China P. R. 43.70 56.43 29.1
U.A.E. 27.09 31.32 15.6
Argentina 4.95 8.13 64.1
Thailand 6.68 7.65 14.5
Indonesia 6.56 7.50 14.3
Malaysia 5.00 4.98 -0.5
U.S.A. 4.18 4.26 1.8
Japan 2.94 3.93 34.0
Korea R 4.69 3.72 -20.6Ukraine 1.62 3.31 104.1
Saudi Arabia 4.04 2.90 -28.3
Brazil 1.57 2.76 75.5
Singapore 2 18 2 66 21 9
Trading Partners of Nepal
( First Ten Months Provisional)
7/29/2019 FY 2069-70 Ten month14.xls
http://slidepdf.com/reader/full/fy-2069-70-ten-month14xls 5/5
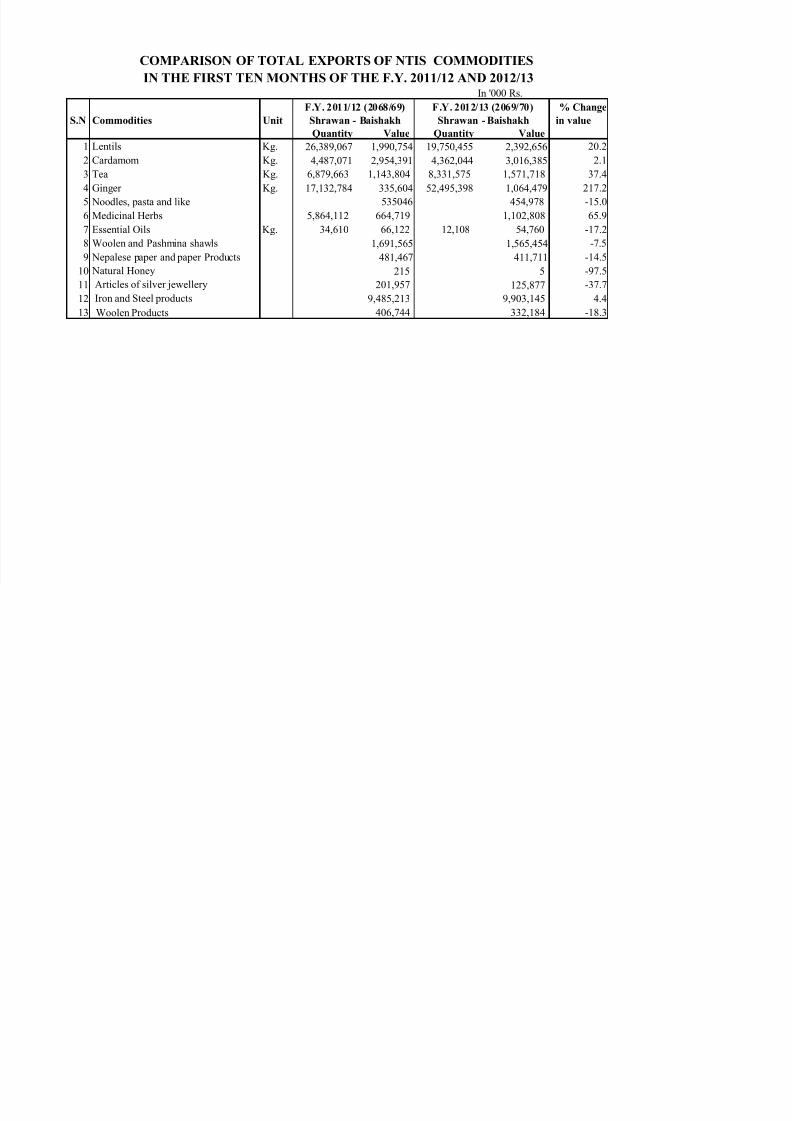
In '000 Rs.
% Change
S.N Commodities Unit in value
Quantity Value Quantity Value1 Lentils Kg. 26,389,067 1,990,754 19,750,455 2,392,656 20.2
2 Cardamom Kg. 4,487,071 2,954,391 4,362,044 3,016,385 2.1
3 Tea Kg. 6,879,663 1,143,804 8,331,575 1,571,718 37.4
4 Ginger Kg. 17,132,784 335,604 52,495,398 1,064,479 217.2
5 Noodles, pasta and like 535046 454,978 -15.0
6 Medicinal Herbs 5,864,112 664,719 1,102,808 65.9
7 Essential Oils Kg. 34,610 66,122 12,108 54,760 -17.2
8 Woolen and Pashmina shawls 1,691,565 1,565,454 -7.5
9 Nepalese paper and paper Products 481,467 411,711 -14.5
10 Natural Honey 215 5 -97.5
11 Articles of silver jewellery 201,957 125,877 -37.7
12 Iron and Steel products 9,485,213 9,903,145 4.4
13 Woolen Products 406,744 332,184 -18.3
COMPARISON OF TOTAL EXPORTS OF NTIS COMMODITIES
IN THE FIRST TEN MONTHS OF THE F.Y. 2011/12 AND 2012/13
F.Y. 2011/12 (2068/69) F.Y. 2012/13 (2069/70)
Shrawan - Baishakh Shrawan - Baishakh


![SP-2069 Specification_for_Pressure_Vessels[1].doc.pdf](https://img.dokumen.tips/doc/110x75/55cf92a8550346f57b986dbe/sp-2069-specificationforpressurevessels1docpdf.jpg)