Embed Size (px)
Citation preview
Department of Computer Science Intelligent Systems Laboratory
FUZZY DATA MINING ANDGENETIC ALGORITHMS APPLIED
TO INTRUSION DETECTIONSusan M. Bridges
Rayford B. Vaughn [email protected]
23rd National Information Systems SecurityConference
October 16-19, 2000

Department of Computer Science Intelligent Systems Laboratory
OUTLINEl AI and Intrusion Detection
l Intrusion Detection System Designl Fuzzy Logic and Data Mining
– Fuzzy Association Rules– Fuzzy Frequency Episodes
l Intrusion Detection via Fuzzy Data Miningl GA’s for System Optimization
l Summary and Future Work

Department of Computer Science Intelligent Systems Laboratory
AI TECHNIQUES AND INTRUSIONDETECTION
l Long history of AI techniques applied to intrusiondetection. For example:– Rule-Based Expert Systems( Lunt and Jagannathan 1988)– State Transition Analysis (Ilgun and Kemmerer 1995)– Genetic Algorithms (Me 1998)– Inductive Sequential Patterns (Teng, Chen and Lu 1990)– Artificial Neural Networks (Debar, Becker, and Siboni 1992)
l Data mining applied to intrusion detection is an activearea of research. Examples include:– Lee, Stolfo, and Mok (1998)– Barbara, Jajodia, Wu, and Speegle (2000)

Department of Computer Science Intelligent Systems Laboratory
UNIQUE FEATURES OF OURWORK
l Combines fuzzy logic with data miningl Overcomes sharp boundary problems of many
systemsl Reduces false positive errorsl Can be used for both anomaly detection and misuse
detectionl Includes real-time componentsl Uses genetic algorithms for system optimization

Department of Computer Science Intelligent Systems Laboratory
FUZZY LOGIC AND SECURITYl Many security-related features are quantitative
– e.g., temporal statistical measurements(Porras and Valdes 1998; Lee and Stolfo 1998)
» SN: number of SYN flags in TCP header during last 2s» FN: number of FIN flags in TCP header during last 2s» RN: number of RST flags in TCP header during last 2s» PN: number of distinct destination ports during last 2s
0.0 1.0 2.0 3.0 4.0 5.0 6.0 Timestamp
first 2 seconds
second 2 seconds
third 2 seconds
…………………………...

Department of Computer Science Intelligent Systems Laboratory
FUZZY LOGIC ALLOWSOVERLAPPING CATEGORIES
Low Medium High Low Medium High
1
0
0.2
0.4
0.6
0.8
0 5 10 15 20 25 30Destination Ports
b. Fuzzy sets
1
0
0.2
0.4
0.6
0.8
0 5 10 15 20 25 30Destination Ports
a. Non-fuzzy sets

Department of Computer Science Intelligent Systems Laboratory
FUZZY LOGIC OVERCOMES SHARPBOUNDARY PROBLEMS
0 x1 x2 x3 x4 …...
Medium A B
LOW MEDIUM HIGH
0 x1 x2 x3 x4 …...
A B
If Medium is the normal pattern, then without fuzzy sets, A & B areboth “outside” of the normal pattern. Fuzzy logic allows “degrees ofnormality.”

Department of Computer Science Intelligent Systems Laboratory
INTELLIGENT INTRUSIONDETECTION MODEL
l Integration of fuzzy logic with data mining– Fuzzy association rules– Fuzzy frequency episodes
l Preliminary architecture– Includes both misuse detection and anamoly
detection– Integrates machine-level and network-level
information
l Optimization using genetic algorithms

Department of Computer Science Intelligent Systems Laboratory
…...
Core Component
IntrusionDetectionModule n+1
Machine Learning Component( by mining fuzzy association rulesand fuzzy frequency episodes )
Server
Clients
BackgroundUnit
Experts
…...Network Trafficor Audit Data (1)
Network Trafficor Audit Data (2)
Network Trafficor Audit Data (m)
IntrusionDetectionModule n’
Decision-Making Module
IntrusionDetectionModule n
Communication Module
IntrusionDetectionModule 1
.
.
.
Administrator
…...
Anomaly Detection
MisuseDetection
IntrusionDetectionSentry s
Host orNetworkDevice
IntrusionDetectionSentry 1
Host orNetworkDevice
IntrusionDetectionSentry 2
Host orNetworkDevice

Department of Computer Science Intelligent Systems Laboratory
MINING FUZZY ASSOCIATIONRULES
l Association rules represent commonly found patternsin data.
l Association Rule Format: R1: X→Y, c, sX and Y are disjoint sets of itemss (support) tells how often X and Y co-occur in the
datac (confidence) tells how often Y is associated with X.
l Our system is unique: X and Y are fuzzy variablesthat take fuzzy sets as values

Department of Computer Science Intelligent Systems Laboratory
FUZZY ASSOCIATION RULESSample Fuzzy Association Rule:
{ SN=LOW, FN=LOW } → { RN=LOW }, c = 0.924, s = 0.49
Interpretation:SN, FN, and RN are fuzzy variables.The pattern { SN=LOW, FN=LOW, RN=LOW } has
occurred in 49% of the training cases;When the pattern { SN=LOW, FN=LOW } occurs, there will
be 92.4% probability that { RN=LOW } will occur at thesame time.
Department of Computer Science Intelligent Systems Laboratory
SAMPLE FUZZY FREQUENCYEPISODE RULES
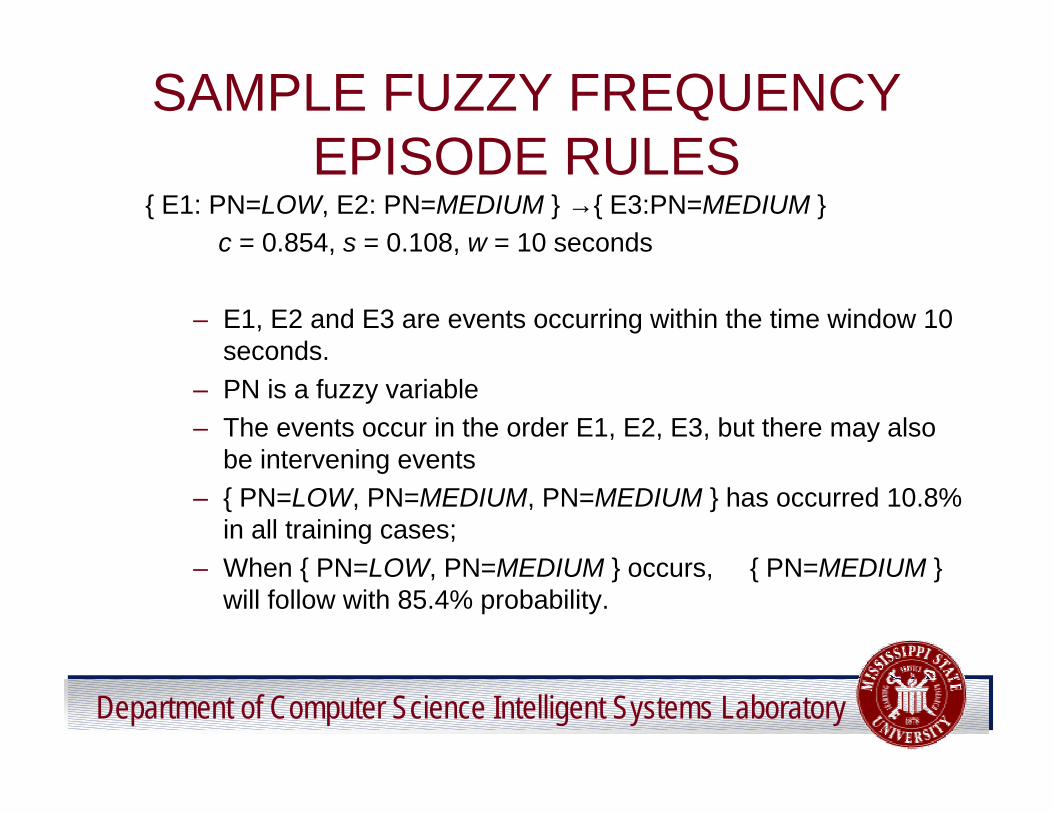
{ E1: PN=LOW, E2: PN=MEDIUM } →{ E3:PN=MEDIUM } c = 0.854, s = 0.108, w = 10 seconds
– E1, E2 and E3 are events occurring within the time window 10seconds.
– PN is a fuzzy variable– The events occur in the order E1, E2, E3, but there may also
be intervening events– { PN=LOW, PN=MEDIUM, PN=MEDIUM } has occurred 10.8%
in all training cases;– When { PN=LOW, PN=MEDIUM } occurs, { PN=MEDIUM }
will follow with 85.4% probability.
Department of Computer Science Intelligent Systems Laboratory
FUZZY DATA MINING FORINTRUSION DETECTION
l Modification of non-fuzzy methods developed byLee, Stolfo, and Mok (1998)
l Anomaly Detection Approach– Mine a set of fuzzy association rules from data with no
anomalies.– When given new data, mine fuzzy association rules
from this data.– Compare the similarity of the sets of rules mined from
new data and “normal” data.

Department of Computer Science Intelligent Systems Laboratory
0
0.2
0.4
0.6
0.8
1
Sim
ilari
ty
Test Data Sets
Similarity 0.773 0.795 0.775 0.564 0.513 0.288 0.1 0.116 0.0804
T1 T2 T3 T4 T5 T6 T7 T8 T9
Similarities between Training Data Set and Different Test Data Sets by Mining Fuzzy Association Rules on SN, FN, and RN.Training data collected in the afternoon. T1-T3—afternoon T4-T6—evening T7-T9—late nightData source: MSU CS network
Department of Computer Science Intelligent Systems Laboratory
0
0.2
0.4
0.6
0.8
1
Sim
ilarit
y
Test Data Sets
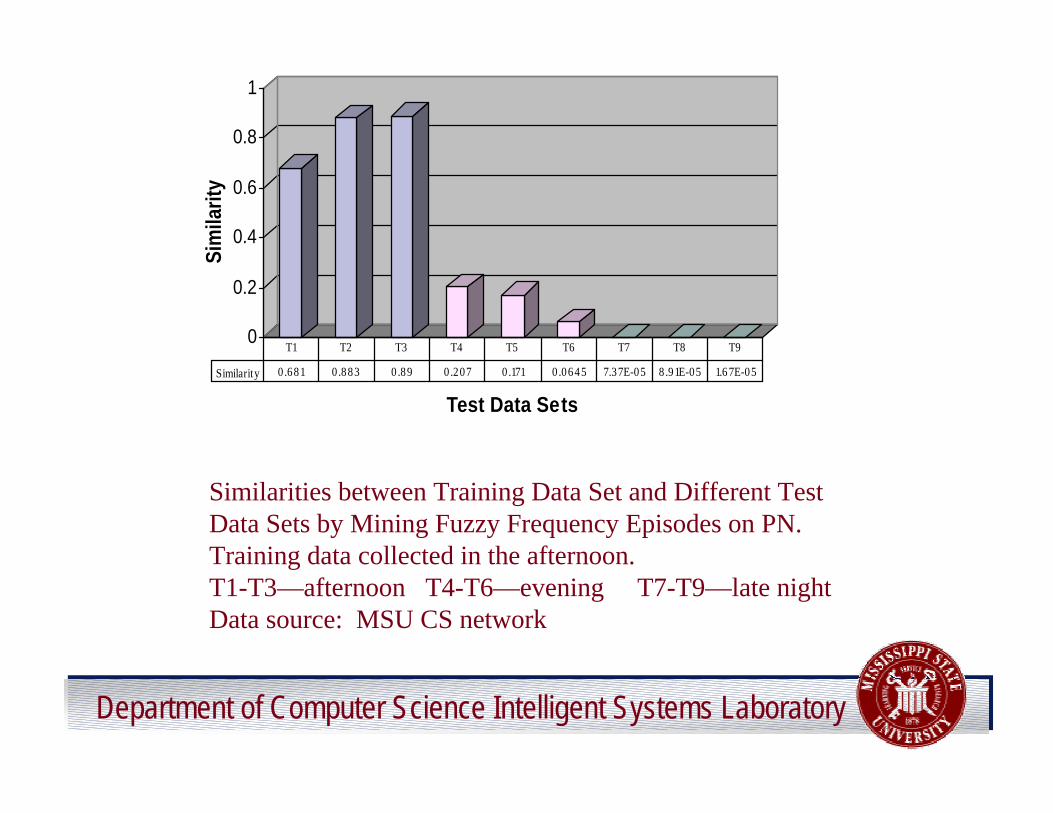
Similarity 0 .681 0 .883 0 .89 0 .207 0 .171 0 .0645 7.37E-05 8 .91E-05 1.6 7E-05
T1 T2 T3 T4 T5 T6 T7 T8 T9
Similarities between Training Data Set and Different Test Data Sets by Mining Fuzzy Frequency Episodes on PN.Training data collected in the afternoon. T1-T3—afternoon T4-T6—evening T7-T9—late nightData source: MSU CS network

Department of Computer Science Intelligent Systems Laboratory
0
0.2
0.4
0.6
0.8
1
Sim
ilari
ty
Test Data Sets
Similarity 0.744 0.309 0.315
Baseline Network1 Network3
Similarities between Training Data Set and Different Test Data Sets by Mining Fuzzy Association Rules on SN, FN, and RN
0
0.2
0.4
0.6
0.8
1
Sim
ilari
ty
Testing Data Sets
Similarity 0.885 0 0.000155
Baseline Network1 Network3
Similarities between Training Data Set and Different Test Data Sets by Mining Fuzzy Frequency Episodes on PN
Training data: no intrusions
Test data: baseline (no intrusions)
network1 (includes simulated IP Spoofing intrusions)network3 (includes simulated port scanning intrusions)

Department of Computer Science Intelligent Systems Laboratory
REAL-TIME INTRUSIONDETECTION
Given a fuzzy episode rule R: { e1, …, ek-1 } → { ek }, c, s, w,
if {e1, …, ek-1} has occurred in the current event sequence,
then { ek } can be predicted to occur next with confidence of c.
If the next event does not match any prediction from the rule set,it will be alarmed as an anomaly.
Define anomaly percentage = number of anomalies / number of events

Department of Computer Science Intelligent Systems Laboratory
0%
10%
20%
30%
40%
An
om
aly
Per
cen
tag
e (%
)
Test Data Sets
Anomaly Percentage 8.99% 9.55% 7.30% 25.60% 33.71% 32.39%
T1' T2' T3' T4' T5' T6'
Experiments and Results
Anomaly Percentages of Different Test Data Sets in Real-time Intrusion Detection by Mining Fuzzy Frequency Episodes on PNTraining Data: No intrusionsTest Data: T1’-T3’—no intrusions T4’-T6’—simulated mscan

Department of Computer Science Intelligent Systems Laboratory
Comparing the false positive error rates offuzzy episode rules with non-fuzzy versionsfor real-time intrusion detection
0%
5%
10%
15%
20%
Fal
se P
osi
tive
E
rro
r R
ate
(%)
Test Data Sets
Fuzzy 8.99% 9.55% 7.30% 4.44% 6.67% 8.89%
Non-Fuzzy 17.98% 12.92% 15.25% 11.11% 17.78% 11.11%
T1' T2' T3' T4' T5' T6'
FUZZY VS. NON-FUZZY

Department of Computer Science Intelligent Systems Laboratory
USING GENETIC ALGORITHMSFOR OPTIMIZATION
l Problem with NIDS– System uses a fixed set of features for all kinds of situations– Fuzzy membership functions must be predefined.
l Hypothesis– Different features may be useful for different classes of
intrusion attacks and for different situations.– The performance of the system can be improved by using a
GA to evolve an optimal set of features and fuzzymembership functions.

Department of Computer Science Intelligent Systems Laboratory
GENETIC ALGORITHMSAPPROACH
l Optimization goals– Maximize the similarity of rules mined from
“normal” data with baseline rule set– Minimize the similarity of rules mined from
“abnormal” data with baseline rule set
l Parameters to change– Features available from audit data– Fuzzy membership function parameters

Department of Computer Science Intelligent Systems Laboratory
0a' d c' a cb
ZS
PI
X
Y
+−
=
−=
−−
−
−−
=
),,(
),,(),,(
)',',(1)',',(
1
21
2
0
),,(2
2
dbbZ
bdbSbdPI
caScaZ
ac
c
ac
a
caS
µµ
µ
µµ
µ
µ
µ
a≤µ
2
caa
+≤<µ
cca
≤<+
µ2
µ<c
µµ
<<
b
b
FUZZY SETS ARE DEFINED BYPARAMETERIZED
MEMBERSHIP FUNCTIONS

Department of Computer Science Intelligent Systems Laboratory
EXAMPLE RUNMembership functions before and after the GA
optimization
FN Original Membership Functions
0
0.2
0.4
0.6
0.8
1
1 6 11 16 21 26 31 36 41 46
Number
Mem
bers
hip
low medium high
FN Learned Membership Functions
0
0.2
0.4
0.6
0.8
1
1 6 11
16
21
26
31
36
41
46
Number
Me
mb
ers
hip
low medium high
Department of Computer Science Intelligent Systems Laboratory
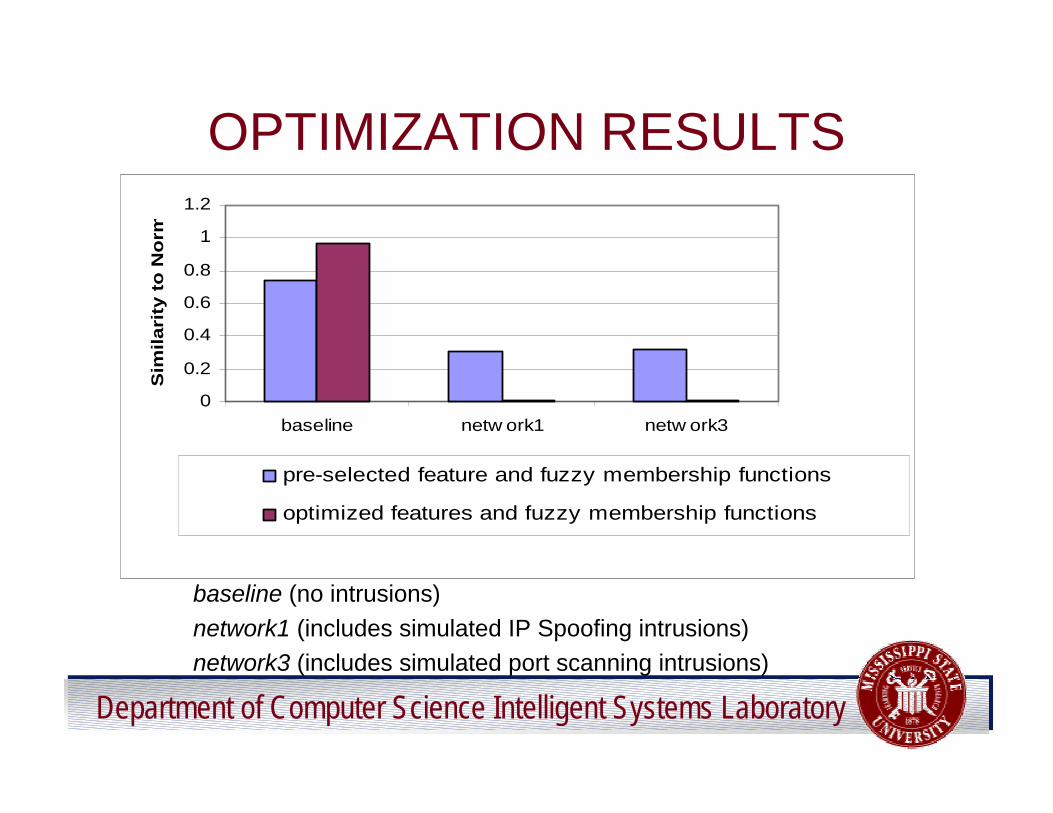
OPTIMIZATION RESULTS
0
0.2
0.4
0.6
0.8
1
1.2
baseline netw ork1 netw ork3
Sim
ilari
ty t
o N
orm
al
pre-selected feature and fuzzy membership functions
optimized features and fuzzy membership functions
baseline (no intrusions)
network1 (includes simulated IP Spoofing intrusions)network3 (includes simulated port scanning intrusions)

Department of Computer Science Intelligent Systems Laboratory
FEATURES SELECTED FOR IPSPOOFING AND PORTSCANNING ATTACKS
Feature Selected Luo’s Features
IP Spoofing Source IP, FIN, Data Size, Port
number
SYN, FIN, RN
Port Scanning Source IP, Destination IP,
Source Port, and Data size.
SYN, FIN, RN

Department of Computer Science Intelligent Systems Laboratory
CONCLUSIONSl Developed an architecture for integrating machine
learning methods with other intrusion detectionmethods.
l Extended data mining techniques by integrating fuzzylogic
l Demonstrated that these methods are superior totheir non-fuzzy counterparts.
l Developed a method for real-time intrusion detectionusing fuzzy frequency episodes.
l Used GA’s to improve the performance of the systemby selecting best set of features and by tuning thefuzzy membership function parameters

Department of Computer Science Intelligent Systems Laboratory
Current and Future Workl Further work with fuzzy frequency episodes and
real-time intrusion detectionl Using fuzzy logic for data fusion by the decision
module
l Generating misuse modules from associationrules
l Using incremental data mining to deal with “drift”in “normality”
l Investigating intrusion detection in high speedclusters of workstations