Embed Size (px)
Citation preview
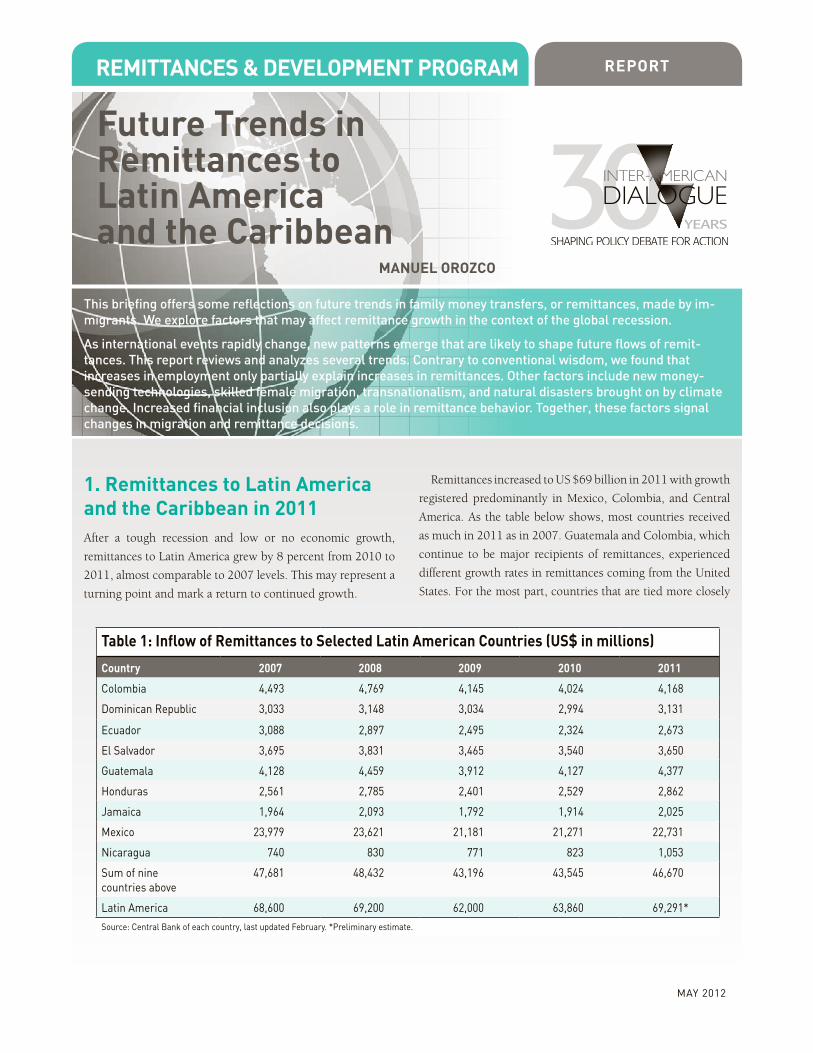
Remittances & Development pRogRam RepoRt
May 2012
Future trends in Remittances to latin america and the caribbean
manuel oRozco
This briefing offers some reflections on future trends in family money transfers, or remittances, made by im-migrants. We explore factors that may affect remittance growth in the context of the global recession.
As international events rapidly change, new patterns emerge that are likely to shape future flows of remit-tances. This report reviews and analyzes several trends. Contrary to conventional wisdom, we found that increases in employment only partially explain increases in remittances. Other factors include new money-sending technologies, skilled female migration, transnationalism, and natural disasters brought on by climate change. Increased financial inclusion also plays a role in remittance behavior. Together, these factors signal changes in migration and remittance decisions.
table 1: inflow of Remittances to selected latin american countries (us$ in millions)
country 2007 2008 2009 2010 2011
Colombia 4,493 4,769 4,145 4,024 4,168
Dominican Republic 3,033 3,148 3,034 2,994 3,131
Ecuador 3,088 2,897 2,495 2,324 2,673
El Salvador 3,695 3,831 3,465 3,540 3,650
Guatemala 4,128 4,459 3,912 4,127 4,377
Honduras 2,561 2,785 2,401 2,529 2,862
Jamaica 1,964 2,093 1,792 1,914 2,025
Mexico 23,979 23,621 21,181 21,271 22,731
Nicaragua 740 830 771 823 1,053
Sum of nine countries above
47,681 48,432 43,196 43,545 46,670
Latin America 68,600 69,200 62,000 63,860 69,291*
Source: Central Bank of each country, last updated February. *Preliminary estimate.
1. Remittances to latin america and the caribbean in 2011After a tough recession and low or no economic growth,
remittances to Latin America grew by 8 percent from 2010 to
2011, almost comparable to 2007 levels. This may represent a
turning point and mark a return to continued growth.
Remittances increased to US $69 billion in 2011 with growth
registered predominantly in Mexico, Colombia, and Central
America. As the table below shows, most countries received
as much in 2011 as in 2007. Guatemala and Colombia, which
continue to be major recipients of remittances, experienced
different growth rates in remittances coming from the United
States. For the most part, countries that are tied more closely

Inter-AmerIcAn DIAlogue REPORT
2 Future trends in remittances to Latin america and the caribbean
Foreword
The Inter-American Dialogue is pleased to publish this report prepared by Manuel Orozco, director of the
Dialogue’s remittances and development program. The Dialogue’s aim in publishing working papers is to
stimulate a broad and well-informed public debate on complex issues facing analysts, decision makers, and
citizens concerned about Latin America’s policy agenda.
In this working paper, Orozco, a leading expert on migration and development issues, offers a systematic
overview of the trends shaping the flow of remittances in the Americas. Relying on available data, including
surveys he conducted over the past decade, Orozco analyzes changes in the number and amount of remit-
tances sent by Latin American migrants. His findings show that natural disasters, female skilled workers,
and increased migrant financial access are among some of the leading factors explaining growth of remit-
tances. His assessment integrates comments and recommendations from members of the academic, busi-
ness, and policy communities in the United States and Latin America and the Caribbean that shed light on
these developments.
The report is part of a series of studies carried out by the Remittances and Development Program (http://
www.thedialogue.org/page.cfm?pageID=80), which seeks to encourage remittances as a tool for develop-
ment in the Western Hemisphere and around the world. The Dialogue focuses largely on polices governing
the flow of remittances, private sector financial and remittance services, and financial access for migrants
and remittance recipient families.
The program’s scope extends to examining the costs associated with remitting, the banking industry and
new modes of remitting through innovative technologies, the economic participation of diasporas, home-
town associations (HTAs) in countries of origin, and other transnational activities that involve migrants.
Through research, policy analysis, technical assistance, product development, and project implementation,
the Dialogue has enhanced knowledge and forged partnerships among public and private institutions in over
100 countries in Latin America and the Caribbean, Africa, Europe and Asia.
We are pleased to recognize the generous assistance provided by Wells Fargo Bank for the production of
this report.
Michael Shifter
President

Inter-AmerIcAn DIAlogue REPORT
Future trenDs In remIttAnces to lAtIn AmerIcA AnD the cArIbbeAn 3
to the US economy experienced higher growth than those
whose populations also migrate to Europe.
In terms of remittances flows from the United States, there
are different opposing forces at work: a 2 percent decline
in unemployment among foreign born workers may have
increased remittance flows, and increases in deportations
during the same period may have reduced remittance flows.
Although unemployment in the United States remains
high, US economic recovery (and associated declines in
unemployment rates) may have played a role in increasing
flows to Latin America from 2010 to 2011. For example,
declines in unemployment rates seem to have contrib-
uted to the increases in remittances to Mexico—Mexican
migrants constitute over one-third of the US foreign labor
table 2: percentage growth of Remittances (selected latin american countries)
country 2008 2009 2010 2011
Colombia 6 -15 -3 3
Dominican Republic 4 -4 -1 4
Ecuador -7 -16 -7 13
El Salvador 4 -11 2 3
Guatemala 7 -14 5 6
Honduras 8 -16 5 12
Jamaica 6 -17 6 5
Mexico -2 -12 0 6
Nicaragua 11 -8 6 22Source: Central Bank of each country, last updated February 2012.
-20%
-10%
0%
10%
20%
30%
40%
– 0%
– 2%
– 4%
– 6%
– 8%
– 10%
– 12%
– 14%
– 16%
Figure 1: Unemployment and Remittance Growth
Rem
ittan
ces
Fore
ign
Bor
n U
nem
ploy
men
t Rat
e
Remittances' growth to Mexico
Unemployment foreign born
Q3-2008 Q4-2008 Q1-2009 Q2-2009 Q3-2009 Q4-2009 Q1-2010 Q2-2010 Q3-2010 Q4-2010 Q1-2011 Q2-2011 Q3-2011 Q4-2011
Source: BLS_retr12jan2012 Foreign born monthly 2007-2011. Data for Foreign-Born unemployment was found at http://www.bls.gov/webapps/legacy/ cpsatab7.htm; Remittances: Central Bank of Mexico.

Inter-AmerIcAn DIAlogue REPORT
4 Future trends in remittances to Latin america and the caribbean
force. However, deportations of Mexicans in particular were
almost as large as the inflow of Mexican immigrants to the
United States—which stands at 350,000 in 2011. Because
the number of migrants in the United States did not grow, it
is unlikely that growth in remittances was due to an increase
in the number of migrants. Deportations might have taken
job seekers out of the market, lowering unemployment
at the same time lowering the number of people sending
money home. Thus, a decline in unemployment contrib-
utes to remittance growth, but it may not alone explain the
increase in flows. Specifically an 8 percent increase in remit-
tances can’t be explained by a 2 percent decline in unem-
ployment between 2010 and 2011.
Research shows that remittance trends between 2000
and 2010 were influenced by both the inflow of new immi-
grants remitting home and the profile of remitters. Typically,
increases in the number of persons sending parallel the
increases in migration. As more migrants arrive in a host
country, the number of person-to-person transfers grows
annually. If economic upturns generate greater labor demands
in a host country, the number of remitters will also increase.
Moreover, increases in volume are also a function of the type
of senders (gender and age or years remitting, for example),
and the level of senders’ financial access (owning an account,
for example). The challenge is to understand which factors
affect the increases in transfers more than others.
Through existing research and fieldwork over the period
between 2005 and 2011, we explore these issues as a means
to understand prevailing and shifting patterns in remitting,
some of which are associated with international migration
trends. Below we examine some factors that may explain
the drivers of remittance growth to Latin America and the
Caribbean in the last decade.
2. increases in volume— Financial access, Women, transnationalism Several factors contribute to an increase in the volume
of remittances: access to new financial tools, an increase
in the number of skilled female migrants who send more
than other groups, and external dynamics such as changes
in the cost of living in the home country. Here we review
some of these issues.
transactional and Financial inclusion Increased use of technology and access to financial tools
(both in their host and home countries) among immigrants
may positively affect growth in remittance amounts. Studies
show that remitters who use technology-based finan-
cial instruments, such as online transfers via online bank
accounts, send slightly larger amounts than those who use
cash-to-cash methods, even after controlling for income
and education.1 For some time immigrants have consis-
tently expressed interest in changing how they transfer
money home. Their behavior is increasingly matching these
expressed preferences, as more people use the Internet and
instruments other than cash-to-cash to remit.2 The share of
remitters using technology-based instruments has grown
steadily year by year. In turn, more companies are now
1 Orozco, Manuel, with Elisabeth Burgess, and Netta Ascoli, “Is there a match among migrants, remittances and technology?” Inter-American Dialogue, September 2010; Orozco, Manuel and Katy Jacob, “Card-Based Remittances: A Closer Look at Supply and Demand” Chicago, CFSI, 2007.2 These changes are partly a function of financial access for migrants. As the number of immigrants with bank accounts increases, the options and preferences to use account transfers also grows.
table 3: sending amount by method sent, us$
amount sent each time total amount annually
Banks 258 3,592
Money transfer operators 169 2,344
Internet 269 2,685
Travelers 162 1,704
Source: Orozco, Manuel, with Elisabeth Burgess, and Netta Ascoli. Sep 2010. “Is there a match among migrants, remittances and technology?” Inter-American Dialogue. Note: The averages reported here are survey based and are not to be compared with other data on average remitted, such as data reported by companies.

Inter-AmerIcAn DIAlogue REPORT
Future trenDs In remIttAnces to lAtIn AmerIcA AnD the cArIbbeAn 5
offering account transfer methods that serve as alternatives
to cash-to-cash remittances.
In the United States, Xoom Corporation is a leader in
global online money transfers. Xoom facilitates over half-a-
million monthly transfers, with half of these transfers being
account withdrawals authorized by the immigrant to the
remittance company to pay at home. In Colombia, over
25 percent of remittances are received via online transfers
into bank accounts. Wells Fargo is estimated to be outper-
forming other banks, as far as the volume of remittances. It
has experienced a 40 percent annual growth in remittance
transfers in 2010, amounting to a total of US$1.4 billion
in transfers in 2010 and a monthly flow of over 400,000
transfers. In 2011, it grew to US$1.8 billion in transfers.
Over half of Wells Fargo’s transfers are from bank accounts
to cash. Increasing use of bank account to cash transfers,
such as those done by Wells Fargo, has made recipients
more familiar with banking institutions.
Moreover, in developing countries individuals’ finan-
cial access is growing. While growth in savings and bank
account ownership has not increased dramatically, remitters
have increased access to financial institutions via non-bank
agents, the Internet, and mobile telephone banking. The
age of ‘branchless’ financial operations is reaching a point of
increasing returns in the short term. In Latin America, for
example, banking access has grown to 51 percent, with Brazil
and Southern Cone countries having higher rates and Mexico
and Central America with lower percent access. Only 43 per-
cent of municipalities in Mexico, for example, have a bank
branch. Non-banking corresponding agents are entering the
financial sector to meet the need.
Mobile banking via cell phone is also entering Latin
America. Electronic transfers increased 121 percent in
2010, and during 2004 and 2009 check transfers dropped
table 4: Remittances and the internet
Host country number of companiesaverage fee to send us$200 via internet
average fee to send us$200 via agent
France 13 10.39 8.61
Netherlands 7 11.00 9.5
United Kingdom 15 8.95 9.53
United States 7 9.78 8.29
Source: Data compiled by the author. June 2011.
11 percent.3 M-banking is growing in Brazil, Davivienda in
Colombia, Nipper in Mexico, and Tigo Money in Guatemala
and Honduras. Mexican banks are also penetrating the mar-
ket with new mobile banking features to expand competi-
tion in both national and international segments. Card based
payments are also increasing, partly as a result of marketing
strategies or government social programs on cash transfers,
such as those in the Dominican Republic, Tarjetas Solidaridad;
Argentina (with 23 percent of the population benefiting from
a card-based social program); and Chile’s Chile Solidario. Some
9.5 million Mexicans have enrolled in the Oportunidades pro-
gram that uses cards for its cash transfer service.4
Women migrantsThe number of women immigrants is growing substantially,
fueled in part by a demand for high-skilled female labor
across the world. The percent of female migrants with a
tertiary education is greater than that of males. Women are
increasingly migrating to high-income countries, and they
are working in various industries. These range from domestic
work, textiles and garments, entertainment, and agriculture,
as well as management and professional positions in other
business sectors. Indeed, for the first time women now repre-
sent 50 percent of the total migrant population.
3 Europraxis expects that the increase in utilization of mobile phones in Brazil will facilitate the adoption of mobile payment services. Available online: http://www.segs.com.br/index.php?option=com_content&view=article&id=60561:-europraxis-aponta-a-ascensao-da-telefonia-movel-e-da-utilizacao-de-dados-no-brasil-como-tendencias-positivas-para-a-adocao-do-mobile-payment-&catid=48:cat-info-ti&Itemid=329 4 SEDESOL (Mexico’s Social Policy Department) highlights the importance of banking to otherwise unserved low-income families. January 25, 2012. Available online: Veracruzanos.info, http://www.veracruzanos.info/2012/01/destaca-sedesol-bancarizacion-de-familias-de-escasos-recursos/

Inter-AmerIcAn DIAlogue REPORT
6 Future trends in remittances to Latin america and the caribbean
This emerging trend is changing the gender dynamics
of remittances and transnational ties. For example, among
migrants, women traditionally tended to remit less money
back to their home countries than men. As the table below
shows, however, migrants in several host countries dem-
onstrate differences in remitting by gender and education:
since 2008, female migrants with a tertiary education have
remitted either as much as, or more, than men.
Source: see note on sources.
transnationalismTransnational ties have also turned into important driv-
ers of migration. Stronger transnational ties and increased
labor mobility facilitate a range of linkages between home
and host countries, which are created through migrants’
economic, cultural, social, and other activities. In this way,
migrants have become more substantively and directly
involved in different economic and social activities in their
countries of origin. This is due in part to the dynamics of
globalization and to new opportunities resulting from polit-
ical and economic openings in their home societies.
One of the most important outcomes of globalization and
migration has been the formation of transnational families
and communities, defined as groups or families whose rela-
tions and connections encompass both home and host soci-
eties. Use of technology makes it easier to stay in touch and
maintain linkages among families, thus reducing the cost of
migrating and facilitating labor mobility.
People are expanding their economic ties to operate
across home and host country economies, furthering the
interdependence on migrant labor. Immigrants’ economic
linkage with their home country extends to at least four
practices that involve spending or investment: 1) family
remittances; 2) demand for consumer goods, telecommu-
nication, or travel services; 3) capital investment; and 4)
charitable donations to philanthropic organizations work-
ing in migrants’ home communities. Immigrants worldwide
are sending $400 billion to their relatives (25 percent of
which comes from the United States). Data shows that those
table 5: migrant characteristics, by gender, 2009
Female male
us$ average per Remittance
% w/ tertiary
education*
Years in Host country
us$ average per Remittance
% w/ tertiary
education*
Years in Host country
Spain 258 36 6 274 31 7
Italy 373 42 11 256 38 10
France 436 26 12 299 30 18
United States 290 27 11 280 22 12
Source: “Skilled Diasporas: An Imagined or Real Community? Understanding its Policy Implications.” Manuel Orozco and Mariellen Jewers. Skilled Diasporas and the Transnational Flow of Knowledge and Resources. An International Workshop, Organized by the Migration Studies Project, PSU, April 30th and May 1st 2010. * This percent includes people who completed university or have years of university education.
0
100
200
300
400
500
600
2007 2008 2009 2010 2011
332
461
290
261
290
508
206
281
192
280
Figure 2: Amount Remitted among Migrants with Tertiary Education
Female
Male

Inter-AmerIcAn DIAlogue REPORT
Future trenDs In remIttAnces to lAtIn AmerIcA AnD the cArIbbeAn 7
who are more engaged with their homeland tend to send
more money. Additionally, migrants donate $400 million to
philanthropic work, and invest more than $100 billion in
their home countries.
global commodity prices and Foreign exchange shiftsPrevailing costs of living are also an important factor that
influences amounts sent. Increases in cost of living that
stem from rising commodity prices (a significant driver of
cost-of-living increases in Latin America) induce migrants
to send more money. Data shows that there is a strong rela-
tionship between remittances and price increases in the
home country. If commodity prices increase above prices in
agricultural exports, the cost of living will then increase in
the home country. This has been the case for most of Latin
America and the Caribbean.5
5 In Latin America surges in commodity prices for oil and agricultural products result in inflationary pressures of domestic consumer prices indexes (CPI). However, Central Banks’ attempts to curb inflationary pressures by increasing interest rates instigate volatile capital inflows into many countries, which causes excessive appreciation of local currency, surges in domestic credit, with rising prices.
Another factor that may affect remittances is global cur-
rency markets. With the decline of the US dollar prior to
and during the global recession, the average amount sent
shifted as home countries’ currency appreciated.6 For exam-
ple, the Mexican economy experienced peso fluctuations as
a result of the value of the US dollar dropping vis-a-vis other
major currencies, including the Euro and Sterling Pound.
This may have influenced the amount migrants remitted to
Mexico. When the peso dropped, immigrants sent slightly
less (see Figure 4). In contrast, when the peso appreciated,
immigrants tended to send more. Local currency appre-
ciation (or US dollar depreciation) also tends to increase
local prices and lead to inflationary periods in Mexico and
Central America. This situation increases the local cost of
living and may prompt migrants to remit more.7
6 “Remittances to Latin America and the Caribbean in 2010: Stabilization after the crisis,” Inter-American Development Bank, 2011. http://idbdocs.iadb.org/wsdocs/getdocument.aspx?docnum=35788832 discusses the relationship between local currency appreciation and the impact on remittances. 7 While conventional theory argues that depreciation causes inflation, in countries where there is large revenue from natural resources, accompanied by a weakening foreign currency, the local currency appreciates more rapidly. In turn, though, the appreciation of the currency makes imports cheaper, exports become more expensive, and local property values higher (as people increase the demand for real estate buying in dollars). In poor and export- dependent countries, increases in real estate value and hard-to-sell exports may increase inflation.
Source: Orozco, Manuel. Tasting Identity: Trends in Migrant Demand for Home Country Goods, microNOTE #56, USAID, 2008
0
1,000
2,000
3,000
4,000
5,000
6,000
Figure 3: Transnational Engagement and Remittances and Years Living in USA
Am
ount
sen
t ann
ually
Year
s
0 1 2 3 4 5 6
Number of transnational links
Amount sent annually
Years
– 8
– 9
– 10
– 11
– 12
– 13
– 14
– 15
– 16
– 17

Inter-AmerIcAn DIAlogue REPORT
8 Future trends in remittances to Latin america and the caribbean
Figure 4: Exchange Rate and Amount RemittedM
exic
o ex
chan
ge r
ate
10.00
10.50
11.00
11.50
12.00
12.50
13.00
13.50
14.00
14.50
15.00
300 320 340 360 380 400 420 440
Average US$ remittance by migrant
Mex
ico
exch
ange
rat
e
Figure 5: Exchange Rate and Average Remitted
US$
am
ount
rem
itted
Exch
ange
rat
e
Amount remitted
Exchange rate
1/1/
2008
3/1/
2008
5/1/
2008
7/1/
2008
9/1/
2008
11/1
/200
8
1/1/
2009
3/1/
2009
5/1/
2009
7/1/
2009
9/1/
2009
11/1
/200
9
1/1/
2010
3/1/
2010
5/1/
2010
7/1/
2010
9/1/
2010
11/1
/201
0
1/1/
2011
3/1/
2011
5/1/
2011
7/1/
2011
9/1/
2011
280
296
312
328
344
360
376
392
408
424
440
–10.0
–10.5
–11.0
–11.5
–12.0
–12.5
–13.0
–13.5
–14.0
–14.5
–15.0
Source: Central Bank of Mexico
Source: Central Bank of Mexico

Inter-AmerIcAn DIAlogue REPORT
Future trenDs In remIttAnces to lAtIn AmerIcA AnD the cArIbbeAn 9
3. increase in number of senders—economics, natural Disasters, migration policy Survey research in 2005 showed that the annual growth of
money transfers was associated with several factors: new
immigrants sending money during their first year (15 per-
cent), transfers sent to additional family members (38 percent),
special emergencies (25 percent), and non-family remittance
transfers (20 percent). The most noticeable increases have
been from new arrivals and those who send to additional
family members.
Source: Orozco, Manuel. Transnational Engagement, 2005
economic RecessionThe global economic recession continues to strongly influ-
ence the amounts sent by remitters. During the recession,
a substantial percentage of migrants stopped remitting and
those who continued remitting usually sent less money. By
2010 a slight recovery was observed in terms of the per-
cent of migrants that were sending more, as well as in the
frequency of sending, which increased from nine times a
year in 2008 to 11 in 2010. The frequency remained lower,
though, than the 2007 average of 13 times a year. In 2011,
the frequency of remitting increased to 12 times per year,
and active remitters reported sending more or the same
amount as in 2010.
Figure 6: Type and Number of Migrant Sending Remittances, Median Number of Immigrants, 2004-2010
Num
ber
Per
cent
0
50,000
100,000
150,000
200,000
250,000
300,000
350,000
400,000
450,000
500,000
Migrant remitter with one year
in the U.S.
Individuals sending non-remittance
transfers
Immigrants remitting for emergency needs
Immigrants sending to another relative
187,703
250,271
312,839
475,516
15%
20%
30%
38%
0
5
10
15
20
25
30
35
40
45
50
table 6: Whether migrants in the u.s. are sending more, less or same amount (percentage)
2008 april, 2009 august, 2009 June, 2010
Sending same 83.9 66.0 48.9 53.3
Sending less 7.9 30.0 44.9 33.8
Sending more 8.2 4.0 6.2 12.8
Difference: “more” & “less” 0.3 26.0 38.7 40.5
Source: Orozco, Manuel. Understanding the continuing effect of the economic crisis on remittances to Latin America and the Caribbean. Inter-American Dialogue. August 2nd, 2009. Orozco, 2008 supplemental survey (see “Note on Sources” page 18). Orozco, Manuel. “Is there a match ...?” (see footnote 1).

Inter-AmerIcAn DIAlogue REPORT
10 Future trends in remittances to Latin america and the caribbean
natural Disasters Migration from Mexico, Central America, and the Caribbean
is increasingly shaped by natural disasters, such as floods,
earthquakes, and hurricanes. On average, Mexico and
Central America experience at least one major disaster
table 7: average Remittance amount Remitted by migrants in the u.s. (us$)
country 2007 2008 2009 2010 2011
Bolivia 218 183 161 176
Colombia 241 264 261 236 222
Costa Rica 302 268 204 190 260
Dominican Republic 215 215 204 206 277
Ecuador 348 337 300 277 224
El Salvador 351 350 314 292 321
Guatemala 407 383 336 327 390
Guyana 232 161 133 140
Haiti 131 120 105 100
Honduras 211 243 251 258 295
Jamaica 215 147 116 140
Mexico 368 371 343 322 400
Nicaragua 131 125 111 158 125
Paraguay 279 306 278 298 191
Peru 167 168 160 170 215
Venezuela 151 167 156 155 146
latin america and caribbean 256 238 215 215 255 Source: Company data provided to the author by various money transfer operators.
table 8: natural Disasters, select latin american and caribbean countries, (number of Deaths)
country 1999 2000 2001 2002 2003 2004 2005 2006 2007 2008 2009 2010
Colombia 38 0 0 0 0 88 0 0 6 0 160
Dominican Republic 0 0 0 0 674 0 0 91 22 1 0
Ecuador 2 91 0 0 0 0 4 0 19 0 1
El Salvador 0 1 1200 8 0 0 147 0 0 29 124 21
Guatemala 179 12 14 30 22 0 1508 0 0 0 0 0
Honduras 0 6 0 6 0 0 0 41 0 0 35
amaica 0 0 2 11 0 18 6 0 0 0 0 13
Mexico 0 1 7 4 19 25 88 0 22 0 5 60
Nicaragua 12 4 0 0 21 11 0 98 0 0 54
Peru 5 63 0 18 0 0 0 15 0 0 20
grand total 179 71 1387 53 65 738 1848 4 267 76 130 364
Source: GLobal IDEntifier Number (GLIDE) database. Accessed August–September 2011. http://www.glidenumber.net/glide/public/search/search.jsp?nStart=*September 2011.
every year. Natural disasters pose a real threat to economic
and human security throughout the region due to their
frequency and intensity. For this reason, hurricanes, earth-
quakes, and floods in the region trigger internal and inter-
national migration.

Inter-AmerIcAn DIAlogue REPORT
Future trenDs In remIttAnces to lAtIn AmerIcA AnD the cArIbbeAn 11
Deportations Declines in remittances are associated with deporta-
tions, as migrants are sent back to their home countries.
Deportations—totaling 396,000 in 2011—have hit record
levels under the Obama administration.8 The increase is
mostly a result of states taking more aggressive roles in
deporting people under already established federal laws.
Of the 24 states with agreements under the 1996 enforce-
ment law 287(g), most were established between 2007
and 2010.9
8 “Deportations of illegal immigrants hit record high,” Los Angeles Times, October 6, 2010, Web. June 22, 2011, <http://latimesblogs.latimes.com/lanow/2010/10/record-number-of-deportations-of-illegal-immigrants-in-fiscal-2010-officials-announce.html>.9 “Delegation of Immigration Authority Section 287(g) Immigration and Nationality Act,” US Immigration and Customs Enforcement, Web, June 22, 2011, <http://www.ice.gov/news/library/factsheets/287g.htm>, Factsheet.
table 9: natural Disaster, by type (number of Disasters, 2000–2010)
country earthquake Flood Hurricane volcano Drought landslideDengue
outbreaksum of
Disasters
percent of total Disasters number
Mexico 14.3 21.4 46.4 3.6 0 0 14.2 28
El Salvador 15 25 40 5 10 0 5 20
Guatemala 15.8 21.1 21.1 10.5 15.8 10.5 5.3 19
Honduras 15.8 21.1 31.6 0 10.5 0 21.1 19
Nicaragua 15.4 23.1 30.8 0 7.7 7.7 15.4 13
Source: GLobal IDEntifier Number (GLIDE) database. Accessed August–September 2011. http://www.glidenumber.net/glide/public/search/search.jsp?nStart=
The Administration’s “Secure Communities” pro-
gram—which is seen as an amended version of the
287(g) legislation—aimed to detect and deport undocu-
mented criminals. But many local authorities have mis-
used the program as a way to deport any undocumented
person. Although deportations are at the discretion of
the federal Immigration and Customs Enforcement
(ICE) rather than local officials, Secure Communities
is still susceptible to being used to detect and deport
immigrants regardless of seriousness in criminality.10
States have begun to vie with the federal govern-
ment for authority over immigration policy in the last
several years. State legislatures have adopted over 200
10 Spencer Hsu, “ICE officials set quotas to deport more illegal immigrants,” The Washington Post, March 27, 2010, Web. June 22, 2011, <http://www.washingtonpost.com/wp-dyn/content/article/2010/03/26/AR2010032604891.html>.
table 10: Deportations of mexican and central american immigrants
Year 1995 2000 2001 2002 2003 2004 2005 2006 2007 2008 2009 2010
Mexico 34,662 151,267 150,762 122,058 155,812 175,865 169,031 186,726 208,996 246,851 280,219 282,003
Belize 71 170 185 178 179 202 219 211 233 218 244 253
Costa Rica 43 328 392 376 514 599 676 795 655 687 699 522
El Salvador 1,932 4,736 3,928 4,066 5,561 7,269 8,305 11,050 20,045 20,031 20,849 19,809
Guatemala 1,763 4,543 4,716 5,396 7,726 9,729 14,522 20,527 25,898 27,594 29,661 29,378
Honduras 1,931 4,768 4,548 4,946 8,182 8,752 15,572 27,060 29,737 28,851 27,293 24,611
Nicaragua 376 513 526 468 820 947 1,292 2,446 2,307 2,250 2,176 1,847
Panama 90 154 157 163 162 188 187 209 185 192 200 183
Central America
6,206 15,212 14,452 15,593 23,144 27,686 40,773 62,298 79,060 79,823 81,122 76,603
Source: Yearbook of Immigration Statistics 2009 and 2010, Department of Homeland Security; Aliens Removed by Criminal Status and Region and Country of Nationality: Fiscal Years 2000 to 2009. Aliens Removed by Criminal Status and Region and Country of Nationality: Fiscal Years 2001 to 2010. Online: http://www.dhs.gov/files/statistics/publications/YrBk09En.shtm

Inter-AmerIcAn DIAlogue REPORT
12 Future trends in remittances to Latin america and the caribbean
immigration laws nationwide since 2008,11 ranging from
integrating immigrants to cancelling automatic citizen-
ship for children of undocumented parents.12 The appeals
process for Arizona’s law SB 107013 is likely to lead to a
Supreme Court decision on the scope of states’ rights to
enact immigration law.14 In the meantime, Arizona chal-
lenged and won the right to require businesses to use
E-verify, despite employer participation in E-verify being
optional under federal law.15 On the other end of the spec-
trum, Massachusetts, Illinois, and New York have protested
against participating in Secure Communities, even though
the federal law makes participation mandatory.16 The dif-
ferences among states reflect the larger division among the
American populace on how to handle immigration.
The byproduct of these policies has been felt in Latin
America and the Caribbean, particularly in Mexico and
Central America. For one, the number of immigrants com-
ing into the United States from the region is now close to the
number of people deported. Second, the resources invested
in Central America to address migration have been diverted
to deal with people being deported, rather than on leverag-
ing the economic impact of remittances in these countries.
Using remittance transfers data, survey data, and field
research, we estimated the median number of immigrants
11 “Immigration and Emigration,” The New York Times, June 7, 2011, Web, June 22, 2011, <http://topics.nytimes.com/top/reference/timestopics/subjects/i/immigration-and-emigration/index.html>. 12 Ibid.13 The Support Our Law Enforcement and Safe Neighborhoods Act (SB1070) was signed into Arizona state law in April 2010. The bill charges law enforcement with the responsibility to identify, prosecute, and deport undocumented people in the state. The bill requires state officials to gather information to determine the legal status of suspected individuals, forbids undocumented people from seeking employment in Arizona, and requires employers operating in Arizona to use E-verify when hiring employees. 14 Dylan Smith, “Appeals court rules against SB1070: Ninth circuit denies Brewer’s appeal, won’t lift stay,” Tuscon Sentinel.com, April 11, 2011, Web, June 22, 2011, <http://www.tucsonsentinel.com/local/report/041111_sb1070_appeals/appeals-court-rules-against-sb-1070/>.15 Chamber of Commerce of the United States of America et al. v. Whiting et al. Supreme Court of the United States, Oct. 2010, Supreme Court of the United States, 26 May 2011, Web, 22 June 2011, <http://www.supremecourt.gov/opinions/10pdf/09-115.pdf16 “Too Little, Too Late,” The New York Times, June 19, 2011, Web. June 22, 2011, <http://www.nytimes.com/2011/06/20/opinion/20mon3.html?_r=2&ref=immigrationandemigration>.
that have entered annually from 2004 and 2010.17 Roughly
65 percent of all migrants remit. Of the total migrants that
arrive in any given year, 15 percent send money that same
year.18 Deportations during the past six years are higher
than all migrants (authorized or unauthorized) entering
the United States during the same period. Moreover, as
the table below shows, for Central America, the number
of immigrants is much lower than the number of deported
migrants. Finally, the declines in remittance flows are asso-
ciated (to some extent) with deportations; as the number of
deportations increase relative to migrant inflow, there are
fewer people to send money due to attrition (see Figure 7).
As deportations grow, home countries have been direct-
ing resources toward providing basic services to the needs of
their returning populations. In Guatemala, Honduras, and
El Salvador, for example, governments and civil society have
participated in serving those returned under various frame-
works. In Honduras, the government created the Centros de
Atención a Migrantes Retornados, which are administered by
four organizations and staffed by a mix of government and
NGOs. The government of El Salvador established the pro-
gram Bienvenido a Casa to cope with the volume of returned
migrants and also passed the Ley Especial para la Protección
y Desarrollo de la Persona Migrante Salvadoreña y su Familia
this year. In 2007, Guatemala established the Consejo
Nacional de Atención al Migrante de Guatemala, which works
with the Centro de Atención al Migrante. The need to cope
with the influx of returned migrants further limits govern-
ments’ capacity to leverage remittances for economic devel-
opment—which had only limited success even before 2008.
A final factor that might contribute to the increase in vol-
umes of remittances, despite the increase in deportations, is
the number of temporary work visas granted, particularly to
Mexican migrants. Many of the large increases in total admis-
sions in 2010 compared to earlier years is due to the more
accurate account of land entries, rather than a real surge
17 Annual flows vary from year to year with changes explained by a range of factors, which include personal needs, immigration flows, investment interests, number of dependents to remit to. Central Bank data shows the number of annual transactions resulting from an average annual amount remitted and a total annual volume. Survey research shows that immigrants send to 1.38 people. 18 Survey data from 2007, 2008, 2009, and 2010 surveys on Latino immigrants shows that migrants remitting within the first year of arriving to the United States represent 15 percent or less of all immigrants sending money. Immigrants who remit are 65 percent of all migrants. Among Mexicans the percent is lower.

Inter-AmerIcAn DIAlogue REPORT
Future trenDs In remIttAnces to lAtIn AmerIcA AnD the cArIbbeAn 13
Figure 7: Deportations and Remittance Transactions of Mexicans
Tran
sact
ions
Num
ber
of D
epor
tatio
ns
Transactions
Deportations
2001 2002 2003 2004 2005 2006 2007 2008 2009 2010 20112,000,000
2,500,000
3,000,000
3,500,000
4,000,000
4,500,000
5,000,000
5,500,000
6,000,000
6,500,000
7,000,000
– 10,000
– 60,000
– 110,000
– 160,000
– 210,000
– 260,000
– 310,000
table 11: migrants Deported and coming into the u.s.
median annual inflow, 2004–2010
Home country Deported immigrants Ratio (D/m)
Mexico 282,003 300,326 0.94
Guatemala 29,378 17,723 1.66
Honduras 24,611 10,670 2.31
El Salvador 19,809 15,897 1.25
Dominican Republic 3,309 11,513 0.29
Ecuador 2,321 2,753 0.84
Colombia 2,267 11,988 0.19
Nicaragua 1,847 6,654 0.28
Jamaica 1,475 13,630 0.11
Peru 1047 3,963 0.26
Costa Rica 522 4,742 0.11
Venezuela 369 3,238 0.11
Guyana 219 4,970 0.04
Bolivia 207 7,878 0.03
Paraguay 39 3,017 0.01
Source: Surveys conducted by the author 2005, 2007–2010 (see note in appendix).
Source: Transactions: Central Bank of Mexico; deportations, Table 10.

Inter-AmerIcAn DIAlogue REPORT
14 Future trends in remittances to Latin america and the caribbean
in overall migration19. Nevertheless, improvements in visa
processing have increased both the number of applications
approved and temporary migration entries in recent years.
Although strict comparisons cannot be made due to discrep-
ancies in data collections from earlier years, the increases do
point to a larger cohort of migrants entering the United States
for temporary work. This temporary employment would
contribute to larger volumes of remittances.
4. Determinants of Remittance sending and growth The range of factors that can explain growth in remittances
is mixed and multiple, but looking at some of these issues
can help explain possible future trends in flows. In order
to capture some of these dynamics, two statistical regres-
sions were performed. First, using survey data from 2010
a model was selected to examine whether average amounts
remitted depended on whether remitters were skilled
and female, used Internet or bank transfers, were legal or
undocumented, or were engaged transnationally. A second
model uses macroeconomic data to test how larger environ-
mental and economic factors influence the overall volume
of remittances sent.
average Remitted and migrant characteristicsAs noted earlier, some characteristics associated with
sending, such as female skilled migrants, transnational
engagement, and use [or preferred use] of non-cash send-
ing methods have changed during the 2000s. On average,
skilled female migrants in the United States send about 6.7
percent more dollars home each time they remit than their
male counterparts. Those remitters who prefer account
transfers send 30 percent more but they represent only a
small percentage of all senders. Moreover, those living in
their host country for longer are more engaged and send
19 U.S. Department of Homeland Security. Yearbook of Immigration Statistics: 2010. http://www.dhs.gov/xlibrary/assets/statistics/yearbook/2010/table28d.xls
15 percent more than those less engaged with the home
country. Because of the high deportation rates, we intro-
duced a variable on legal status as a proxy for the decline
in the undocumented population and the amount sent.
Undocumented migrants tend to remit less than their legal-
ized counterparts; increases in deportation reduce the rela-
tive size of the undocumented, thus increasing the average
remitted by all migrants.
The table below shows that skilled female migrants, those
who send via the Internet or via a bank account, and those
with more transnational ties remit more than others. It also
shows that those without legal documentation for immigra-
tion remit almost 10 percent less.
The results20 in Table 13 indicate that the average amount
remitted shows a poor correlation with the variables
explored. The statistical significance of these variables is
significant for all of them except legal status. The model
weakly confirms the hypothesis that the transfer method,
transnationalism, and skilled female migrants increase the
average remitted over other variables.21
20 To determine whether any of these characteristics were significant predictors of sending more (or less) remittances on average, we used an Ordinary Least Squares regression with the following specification: Average remitted each time = Preferred Transfer Method + Female Skilled Migrant + Transnational Engagement + Legal Status + . We defined these concepts using the following variables: Preferred Transfer Method: dummy variable for those using banks or internet transfers; Female Skilled Migrant: dummy variable for skilled female migrants; Transnational Engagement: This is how many years a migrant has been remitting home; Legal Status: dummy variable for those not possessing legal documentation to be in the United States. The data used in the model from a survey of 1000 migrants in the United States conducted in 2010. The survey focused on migrant transnational engagement and remitters’ characteristics. Two hundred observations were dropped in data cleaning for interview completeness.21 We keep the model despite the weak r2 in order to present the demographic variables, such as gender and transnationalism, which combine to be a subset of the larger set of factors influencing remittance volumes. The author does not expect the model to capture a large part of the variation in rem ittances for this reason. However, within the variation that the model does capture, it is useful to note which variables are statistically significant and discuss their roles. The model is not to be considered evidentiary, but rather as an additional perspective on the theoretical issues discussed.

Inter-AmerIcAn DIAlogue REPORT
Future trenDs In remIttAnces to lAtIn AmerIcA AnD the cArIbbeAn 15
table 12: Remittance sender characteristics
percent sent above counterparts percent share of all migrants
Skilled Female Migrant 6.76 5
Migrant Transfers by Internet or Banks 37.6 21
Preference to Continue Using Account or Internet Based Transfers
31.6 6
Irregular Legal Status in Country -9.57 35
Transnationally Engaged 15 10
Source: Orozco, Manuel, with Elisabeth Burgess, and Netta Ascoli. Sep 2010. “Is there a match among migrants, remittances and technology?” Inter-American Dialogue. Survey of migrants in 2010.
Determinants of aggregate Flows22
The second model23 explores aggregate flows between 2006
and 2011 and uses quarterly data to capture variations within
year cycles. In particular, and following the dynamics explored
in sections 2 and 3, the model analyzes whether aggregate
quarterly remittance volumes are influenced by natural disas-
22 Analysis done in collaboration with Mariellen Jewers.23 The Ordinary Least Squares model specification was: Total Remittances Volume (logged) – hat = US-Euro Exchange Rate + US-Local Currency Exchange Rate + Foreign Born Unemployment + Natural Disasters + Average Remitted Each Time + . The independent variables were defined as follows: US-Euro Exchange Rate: logged, average quarterly exchange rate; US-Local Currency Exchange Rate: logged, average quarterly exchange rate; Foreign Born Unemployment: Average quarterly US foreign born unemployment rate; Natural Disasters: logged, ordinal variable, omitting quarters with 0 disasters; Average Remitted Each Time: logged, Average remittance sent per person per month, quarterly average. 10 countries were included in the model. Due to data cleaning for completeness of information (especially information on natural disasters) the entire sample was reduced to 90 observations.
table 13: Regression Results on average Remitted
model
unstandardized coefficients
standardized coefficients
t-valueB std. error Beta
(Constant)* 142.917 10.761 13.281
Preferred Transfer Method* 97.406 13.269 .239 7.341
Transnational Engagement* 2.943 .952 .105 3.092
Legal Status -11.978 12.376 -.033 -.968
Female Skilled Migrant* 68.284 26.182 .085 2.608
Adj-R-squared = .07, N = 1000. *Means that the variable was significant at the .05 level. See note on sources for sources used.
ters in home countries, unemployment of migrants in host
countries, and exchange rates of the dollar to local currency
and of the dollar to the Euro. We also include the average
amount remitted per migrant to control for the demographic
changes in migrants (i.e. gender, transnational engagement,
etc.) examined in the first regression model.
The quarterly total remittance volumes were lagged
by one quarter in order to capture remitters’ reactions to
changes in the independent variables (such as unemploy-
ment and the occurrence of a natural disaster). As the
constant is significant, there are important influences on
remittance volumes that we were unable to capture in this
model. Nevertheless, the model has been able to capture at
least 50 percent of the variation in remittance volumes, and
can provide useful insights, though not absolute answers, to
how remittances respond to various external factors.
The significance of average remittance size per transfer
encompasses the importance of the demographic variables

Inter-AmerIcAn DIAlogue REPORT
16 Future trends in remittances to Latin america and the caribbean
examined earlier. A 1 percent increase in average amounts
remitted in any given quarter is associated with an average
increase of 1.8 percent in overall remittance volumes in the
subsequent quarter, keeping all else constant. This indicates
that the demographic variables (such as gender, education,
transnational engagement, and legal status) that increase
remittance size contribute, in the end, to overall increases
in remittance volumes.
Natural disasters and the strength of local currencies relative
to the dollar are both significantly associated with increases
in remittance volumes in the following quarter. Holding all
else constant, a 1 percent increase in natural disasters in one
quarter is associated with a .34 percent increase on average
in remittances the following quarter. The results of the model
in regards to natural disasters coincide with theory and anec-
dotal evidence that remitters respond with extra support in
the event of a disaster in their home country.
On average, remittance volumes will decline by .04 per-
cent the quarter following a 1 percent depreciation of local
currency relative to the dollar, holding all other variables
constant. Depreciation of local currency relative to the dol-
lar would mean that recipients would not need to receive
as many dollars to pay for normal expenses. In this sce-
nario, it would make sense that remittance volumes would
decline the following quarter, as more remitters sent less
in response to the shift in exchange rate. Conversely, if the
local currency appreciates, immigrants are pressured to
send more money.
table 14: Regression Results on total Remittance volumes
unstandardized coefficientsstandardized coefficients
t-valueB std. error Beta
(Constant)* 10.54254 .9252656 11.39
US-Euro Exchange Rate .8127674 .9085838 .0614047 0.89
US-Local Currency Exchange Rate* -.0468354 .0199066 -.1614332 -2.35
Host Country, Foreign Born Unemployment Rate
7.29e-06 .0245812 .0000202 0.00
Natural Disaster* .3459538 .1457781 .1625252 2.37
Average Remitted Each Time* 1.801478 .1607818 .7695617 11.20
Adj-R-squared = .56218, N = 90. *Means that the variable was significant at the .05 level. Dependent and all independent variables are logged using the natural log. See note on sources for sources used.
The results of the statistical model reflect the original
premise in the paper that other factors, such as deporta-
tions, might override the role that a decline in unemploy-
ment may play in remittance volumes. After all, three
quarters of those who lost their jobs had stopped sending
in 2009, but by 2010 half of those that were unemployed
were already remitting.
5. Reflections and implications of Remittance trendsThese results help confirm that money transfer increases
are a function of several factors, rather than a single one.
More important, the increase in 2011 is signaling the role
of emerging trends that are shaping the nature of migration,
remittances, and economics. Economics is only one factor
driving changes in the number and volume of remittances.
Increases in the demand for female skilled migrants will
change migration as well as the volume of remittances sent.
Similarly as people become more aware of the impact of cli-
mate change and natural disasters in their communities of
origin, they will likely send more money. Foreign currency
changes also affect remitting. Currency devaluations in the
home country influence whether people decide to send
additional amounts. Transnational engagement and account
transfer preferences, which continue to rise, will also impact
remitting, as will financial inclusion. From a policy stand-
point as well as business perspective, these changes offer

Inter-AmerIcAn DIAlogue REPORT
Future trenDs In remIttAnces to lAtIn AmerIcA AnD the cArIbbeAn 17
opportunities to design policies that can be leveraged from
these trends. Some of these are gender based policy oppor-
tunities, others are economic and business related.
The relative increasing number of migrant women deserves
special consideration. Migrant women tend to take on more
obligations than their male counterparts partly because they
look after their parents, siblings, or children. But men also
have children who are looked after by a female relative.
Twenty percent of migrants have children back home and
13 percent in both countries. Only 23 percent do not have
children. As migration is increasingly female and skilled, it is
important to consider strategies that offer financial advising
in a transnational context as well as various forms of psy-
chological counseling for their children and migrant parents.
These strategies should aim to improve women’s financial
independence and ability to support families. With greater
increases in remittances, receiving households have increased
opportunities to save, thus offering advice and products to
improve their financial lot is an important consideration.
Two important dynamics associated with remitting are
preferred method for sending money and financial access
of both sending and receiving families. As immigrants
table 15: immigrants and children (percent)
children living with immigrant in the u.s.
children living in Home country
children living in Both countries Does not Have children
Female Immigrants 54.1 15.1 10.6 20.2
Male Immigrants 36.9 23.6 14.8 24.7
Source: Orozco, Manuel, with Elisabeth Burgess, and Netta Ascoli. Sep 2010. “Is there a match among migrants, remittances and technology?” Inter-American Dialogue. Survey of migrants in 2010.
gain access to financial institutions, their choice to send
via account transfers increase. Moreover, as people receive
more, their savings increase, but their level of financial
access levels off. Accelerating financial access and inclusion
to migrants and recipients will increase their opportuni-
ties to create wealth and achieve financial independence.
These objectives can be reached through different means,
for example, expanding access through financial education,
introducing greater awareness of a range of saving products
and instruments in the market, marketing new products,
and introducing technologies that can enhance financial
access, such as debit cards.
Remittances also present business opportunities for finan-
cial and other commercial institutions. Money transfer com-
panies and banks, among others, can offer Internet-based
transfers and ACH withdrawals as alternative products to
cash-to-cash transfers. Mobile technology applications for
low-income consumers might also be explored. Financial
institutions on the receiving side can also benefit from such
approaches. More payers of remittances realize that trans-
fers into bank accounts may offer more revenue to them as
they can tap into additional services to recipients.

Inter-AmerIcAn DIAlogue REPORT
18 Future trends in remittances to Latin america and the caribbean
a note on sourcesThe report relied on multiple sources, including macro-
economic and other data at national levels, such as national
remittance inflow reported by Central Bank offices, natu-
ral disaster data reported by independent international
organizations, and real remittance transfer data from money
transfer operators.
topic publication(s)
Natural Disasters GLobal IDEntifier Number database. Accessed Jun to Sep 2011. http://glidenumber.net/glide/public/search/search.jsp. News stories were determined using uniform search process, including keywords and page visited, through Google from Jun to Sep 2011.
Commodity Prices The World Bank. Global Economic Monitor (GEM). Accessed August 2011. Prices were based in 2000 constant dollars.
US–Euro Exchange Rate United States Federal Reserve Board. Exchange Rates and International Data. Data Download Program. Accessed August 2011. http://www.federalreserve.gov/datadownload/
Foreign Born Employment Rates Pew Hispanic Center tabulations of Current Population Survey data and United States Bu-reau of Labor Statistics. Labor Force Statistics from the Current Population Survey. Unemployment Rate - Foreign born. Accessed August 2011.
Local Currency Exchange Rates Accessed online August 2011. Central Banks for Colombia, Dominican Republic, Ecuador, El Salvador, Guatemala, Honduras, Jamaica, Mexico, Nicaragua, and Peru.
survey year publication
2005 Orozco, Manuel. Transnational Engagement, Remittances and their Relationship to Development in Latin America and the Caribbean, Washington, DC: Georgetown University, 2005.
2006 Orozco, Manuel and Katy Jacob, “Card-Based Remittances: A Closer Look at Supply and Demand” Chicago, CFSI, 2007.
2007 Orozco, Manuel, with Nancy Castillo. “Latino migrants: a profile on remittances, finances and health,” Inter-American Dialogue, Washington, DC 2008, 2009.
2008 Orozco, Manuel. “Tasting Identity: Trends in Migrant Demand for Home Country Goods,” microNOTE #56, US-AID, 2008.
2009 Orozco, Manuel. Understanding the continuing effect of the economic crisis on remittances to Latin America and the Caribbean. Inter-American Dialogue. August 2, 2009.
2010 Orozco, Manuel, with Elisabeth Burgess, and Netta Ascoli. “Is there a match among migrants, remittances and technology?” Inter-American Dialogue, September 2010.
In addition, the report used survey data collected by the
author and released in various publications. These surveys
are included in analyses of the following publications:

inter-american Dialogue Board of Directors
Michelle Bachelet, Co-Chair, Chile
Carla A. Hills, Co-Chair, United States
Enrique Iglesias, Co-Vice Chair, Uruguay
Thomas F. McLarty III, Co-Vice Chair, United States
David de Ferranti, Treasurer, United States
Peter D. Bell, Chair Emeritus, United States
Fernando Henrique Cardoso, Chair Emeritus, Brazil
Ricardo Lagos, Chair Emeritus, Chile
Alicia Bárcena, Mexico
Francis Fukuyama, United States
L. Enrique García, Bolivia
Donna J. Hrinak, United States
Marcos Jank, Brazil
Jim Kolbe, United States
Thomas J. Mackell, Jr., United States
M. Peter McPherson, United States
Billie Miller, Barbados
Brian O’Neill, United States
Pierre Pettigrew, Canada
Jorge Quiroga, Bolivia
Marta Lucía Ramírez, Colombia
Eduardo Stein, Guatemala
Martín Torrijos, Panama
Elena Viyella de Paliza, Dominican Republic
Ernesto Zedillo, Mexico
Michael Shifter
President
The Inter-American Dialogue is the leading US center for policy analysis, exchange, and com-
munication on issues in Western Hemisphere affairs. The Dialogue brings together public
and private leaders from across the Americas to address hemispheric problems and oppor-
tunities. Together they seek to build cooperation among Western Hemisphere nations and
advance a regional agenda of democratic governance, social equity, and economic growth.
The Dialogue’s select membership of 100 distinguished citizens from throughout the
Americas includes political, business, academic, media, and other nongovernmental leaders.
Fourteen Dialogue members served as presidents of their countries and more than two dozen
have served at the cabinet level.
Dialogue activities are directed to generating new policy ideas and practical proposals for
action, and getting these ideas and proposals to government and private decision makers.
The Dialogue also offers diverse Latin American and Caribbean voices access to US policy dis-
cussions. Based in Washington, the Dialogue conducts its work throughout the hemisphere.
A majority of our Board of Directors are from Latin American and Caribbean nations, as are
more than half of the Dialogue’s members and participants in our other leadership networks
and task forces.
Since 1982—through successive Republican and Democratic administrations and many
changes of leadership elsewhere in the hemisphere—the Dialogue has helped shape the
agenda of issues and choices in inter-American relations.
1211 Connecticut Avenue, NW, Suite 510Washington, DC 20036
PHONE: 202-822-9002 n FAX: 202-822-9553EMAIL: [email protected] n WEB SITE: www.thedialogue.org