Embed Size (px)
Citation preview

i Wherever you see this symbol, it is important to access the on-line course as there is interactive material that cannot be fully shown in this reference manual.
Mass Spectrometry
Fundamental LC-MS
Solvents, Buffers and Additives

Aims and Objectives
Aims and Objectives
Aims Examine common additives currently used in conventional LC/MS
Explain the role of solvents, buffers and eluent pH in signal optimisation
Explain the use of volatile ion pair reagents for successful electrospray Objectives At the end of this Section you should be able to:
Identify which additives are suitable for ESI and APCI
Review and discuss the most important parameters that need to be considered when selecting additives for LC/MS
List source considerations that need to be taken into account for sample and eluent types in LC-(API)MS
Explain technical solutions that increase the compatibility of non-voltile components with API interfaces

© Crawford Scientific www.chromacademy.com
2
Content Introduction 3 LC-API Compatibility 4 ESI Solution Chemistry 4 ESI Eluent Solvent 6 Solvent Viscosity in ESI 7 Organic Modifiers in ESI 8 Eluent Solvent –Positive ESI 9 Eluent pH –Positive ESI 10 Eluent pH –Negative ESI 11 ESI Positive/Negative Ion Mode 13 ESI Reagents for pH Control 15 Sources for non-Volatile Systems 17 Z-Spray and non-Volatile Systems 19 ESI Test compound infusion 20 ESI Buffer Choice and Concentration 22 ESI Buffer Systems 24 ESI Ion Pair Reagents –Overview 25 ESI Ion Pair Reagents – Considerations 27 Cationisation vs. Anionisation in ESI 28 Pre and Post Column Addition in ESI 30 Post Column Addition in ESI 31 ESI Adduct Formation 33 ESI Considerations 35 APCI Solvent Choice –Overview 35 APCI Solvent Choice –Mechanisms 37 Buffers for APCI –Overview 38 Buffers for APCI –Concentration 39 Ion pairing reagents in APCI 41 APCI Considerations 42 References 42

© Crawford Scientific www.chromacademy.com
3
Introduction Solvents, buffers and additives commonly used in conventional LC, in which detection relies on analytes being in solution, may not be compatible with LC-MS analysis. Mass spectrometric detection relies on desolvation to produce gas phase analyte ions with complete removal of other eluent components. An efficient process will result in optimised analyte response and increased sensitivity. ESI favours ions in solution. In contrast, reversed-phase liquid chromatographic conditions generally attempt to suppress ionisation (by increasing the analyte hydrophobicity), and hence gain retention on the hydrophobic stationary phase.[1] Normal-phase eluents are less polar, do not support ions in solution and are not compatible with ESI-MS. APCI is compatible with non-polar mobile phases. Non-polar analytes are usually more volatile and therefore good candidates for APCI that relies on the ability to quickly volatilise eluent systems. APCI is most compatible with neutral analytes that are able to accept or donate protons in the gas phase.
LC/MS system
© Crawford Scientific www.chromacademy.com
4
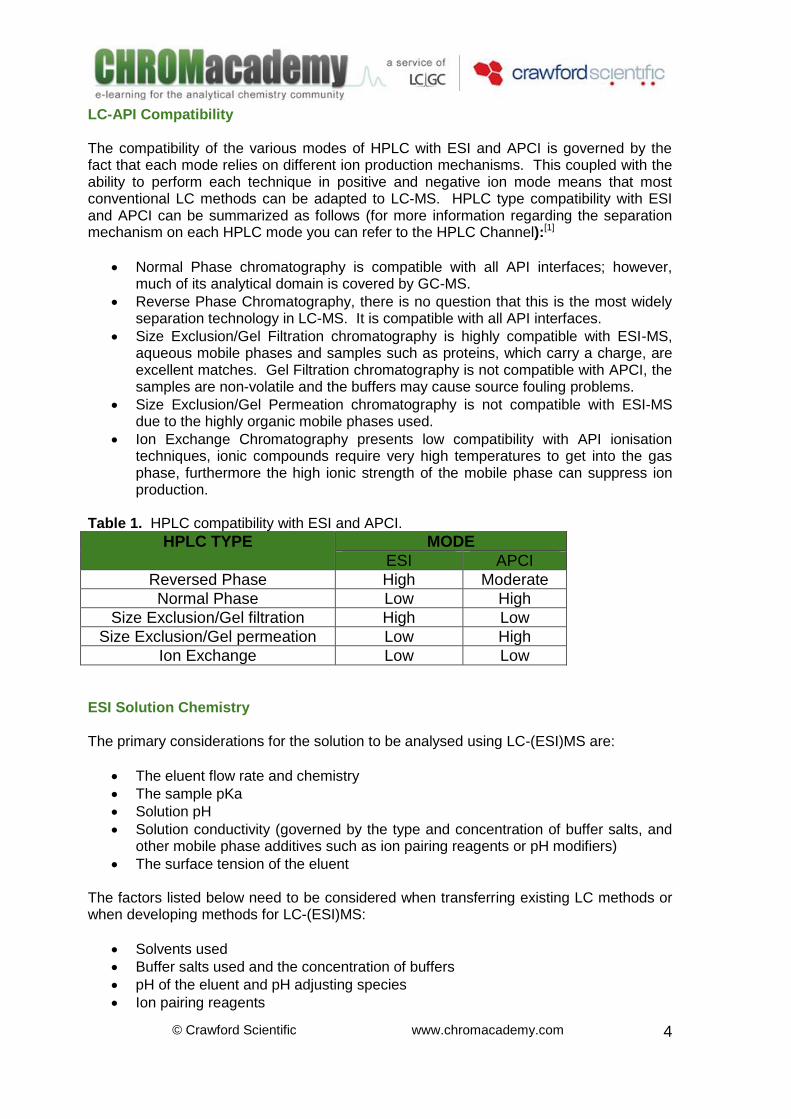
LC-API Compatibility The compatibility of the various modes of HPLC with ESI and APCI is governed by the fact that each mode relies on different ion production mechanisms. This coupled with the ability to perform each technique in positive and negative ion mode means that most conventional LC methods can be adapted to LC-MS. HPLC type compatibility with ESI and APCI can be summarized as follows (for more information regarding the separation mechanism on each HPLC mode you can refer to the HPLC Channel):[1]
Normal Phase chromatography is compatible with all API interfaces; however, much of its analytical domain is covered by GC-MS.
Reverse Phase Chromatography, there is no question that this is the most widely separation technology in LC-MS. It is compatible with all API interfaces.
Size Exclusion/Gel Filtration chromatography is highly compatible with ESI-MS, aqueous mobile phases and samples such as proteins, which carry a charge, are excellent matches. Gel Filtration chromatography is not compatible with APCI, the samples are non-volatile and the buffers may cause source fouling problems.
Size Exclusion/Gel Permeation chromatography is not compatible with ESI-MS due to the highly organic mobile phases used.
Ion Exchange Chromatography presents low compatibility with API ionisation techniques, ionic compounds require very high temperatures to get into the gas phase, furthermore the high ionic strength of the mobile phase can suppress ion production.
Table 1. HPLC compatibility with ESI and APCI.
HPLC TYPE MODE
ESI APCI
Reversed Phase High Moderate
Normal Phase Low High
Size Exclusion/Gel filtration High Low
Size Exclusion/Gel permeation Low High
Ion Exchange Low Low ESI Solution Chemistry The primary considerations for the solution to be analysed using LC-(ESI)MS are:
The eluent flow rate and chemistry
The sample pKa
Solution pH
Solution conductivity (governed by the type and concentration of buffer salts, and other mobile phase additives such as ion pairing reagents or pH modifiers)
The surface tension of the eluent The factors listed below need to be considered when transferring existing LC methods or when developing methods for LC-(ESI)MS:
Solvents used
Buffer salts used and the concentration of buffers
pH of the eluent and pH adjusting species
Ion pairing reagents
© Crawford Scientific www.chromacademy.com
5
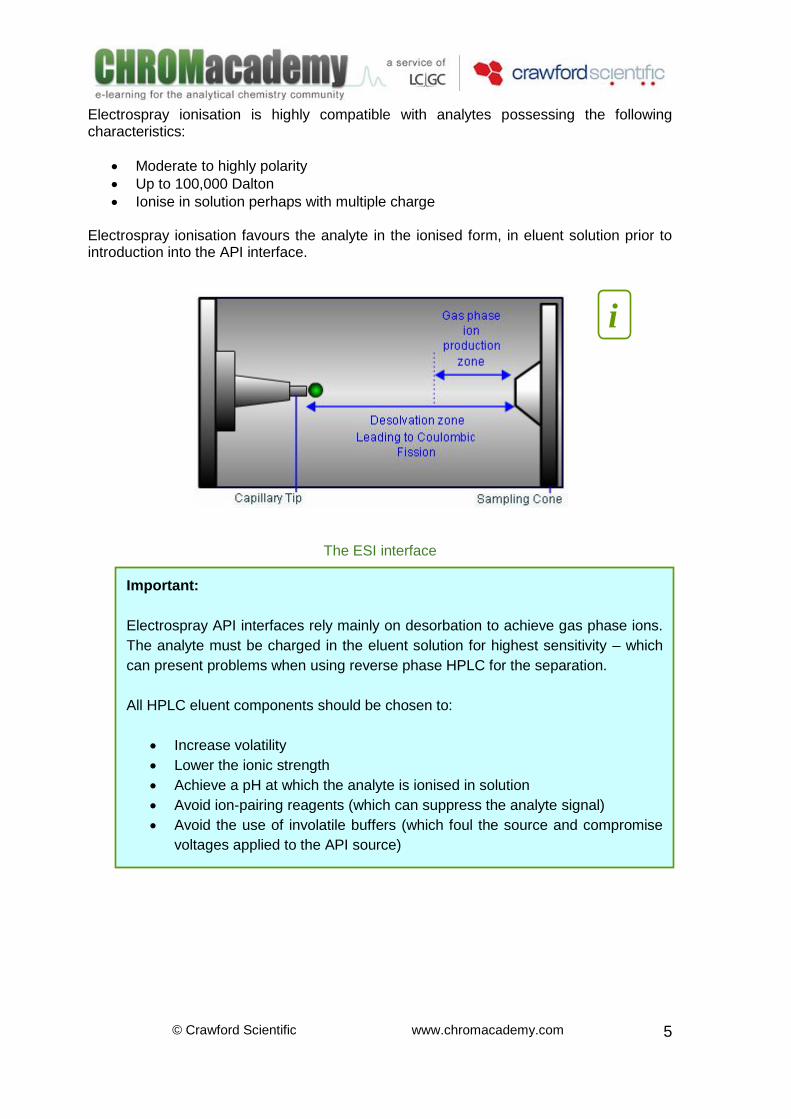
Electrospray ionisation is highly compatible with analytes possessing the following characteristics:
Moderate to highly polarity
Up to 100,000 Dalton
Ionise in solution perhaps with multiple charge Electrospray ionisation favours the analyte in the ionised form, in eluent solution prior to introduction into the API interface.
The ESI interface
i
Important:
Electrospray API interfaces rely mainly on desorbation to achieve gas phase ions.
The analyte must be charged in the eluent solution for highest sensitivity – which
can present problems when using reverse phase HPLC for the separation.
All HPLC eluent components should be chosen to:
Increase volatility
Lower the ionic strength
Achieve a pH at which the analyte is ionised in solution
Avoid ion-pairing reagents (which can suppress the analyte signal)
Avoid the use of involatile buffers (which foul the source and compromise
voltages applied to the API source)

© Crawford Scientific www.chromacademy.com
6
ESI Eluent Solvent Many typical HPLC solvents are compatible with atmospheric pressure ionisation techniques. A good electrospray solvent will easily support ions in solution, this generally requires that the solvent has some dipole moment (polarity). Non-polar solvents (such as toluene) do not easily support ions in solution, cannot be used for ESI.[2,3,4] Although water is an excellent solvent for ions, its lower solvation energy (with polar analytes), and high surface tension, make desolvation and ion desorption more difficult, often requiring higher drying gas temperatures, higher nebulising gas flow rates and/or higher nebulising voltages. Non-polar solvents like benzene, hexane, cyclohexane and carbon tetrachloride are unsuitable for electrospray without addition of secondary electrolyte species. However, this problem can be overcome by a 10% addition of polar solvent (usually methanol or iso-propanol), or a buffer electrolyte. Reducing the effects of surface tension, viscosity and heat of vaporisation will promote high sensitivity in ESI. A study of acids, bases, amphoteric and polar neutral drug compounds (see below), showed that in ESI(+), methanol generally gave stronger signals than acetonitrile.[5] Responses were typically 10-20% higher, however some compounds showed 50-fold increases in sensitivity when ammonium formate was used as the buffer electrolyte, possibly due to changes in the degree of analyte ionisation combined with the higher ability of the solution to support ions in solution. Interestingly, these increases in sensitivity when using methanol rather than acetonitrile were not seen in negative ion mode.
i
Important: Important: As all values are greater than 1, this suggests that in all cases the instrument response using methanol as the eluent organic modifier was greater than the comparable experiment using acetonitrile as the organic modifier
© Crawford Scientific www.chromacademy.com
7
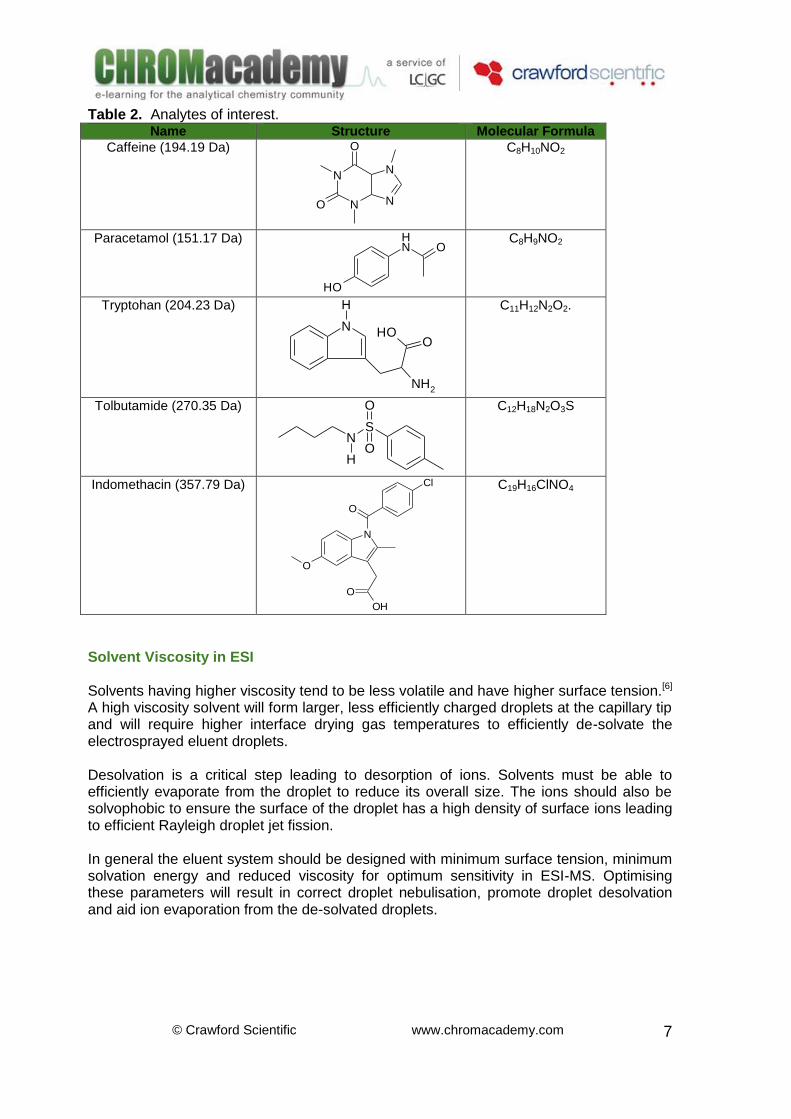
Table 2. Analytes of interest. Name Structure Molecular Formula
Caffeine (194.19 Da)
N
N N
N
O
O
C8H10NO2
Paracetamol (151.17 Da) NH
OH
O
C8H9NO2
Tryptohan (204.23 Da)
N
H
NH2
OHO
C11H12N2O2.
Tolbutamide (270.35 Da)
NS
O
HO
C12H18N2O3S
Indomethacin (357.79 Da)
O
N
O
Cl
OH
O
C19H16ClNO4
Solvent Viscosity in ESI Solvents having higher viscosity tend to be less volatile and have higher surface tension.[6] A high viscosity solvent will form larger, less efficiently charged droplets at the capillary tip and will require higher interface drying gas temperatures to efficiently de-solvate the electrosprayed eluent droplets. Desolvation is a critical step leading to desorption of ions. Solvents must be able to efficiently evaporate from the droplet to reduce its overall size. The ions should also be solvophobic to ensure the surface of the droplet has a high density of surface ions leading to efficient Rayleigh droplet jet fission. In general the eluent system should be designed with minimum surface tension, minimum solvation energy and reduced viscosity for optimum sensitivity in ESI-MS. Optimising these parameters will result in correct droplet nebulisation, promote droplet desolvation and aid ion evaporation from the de-solvated droplets.
© Crawford Scientific www.chromacademy.com
8
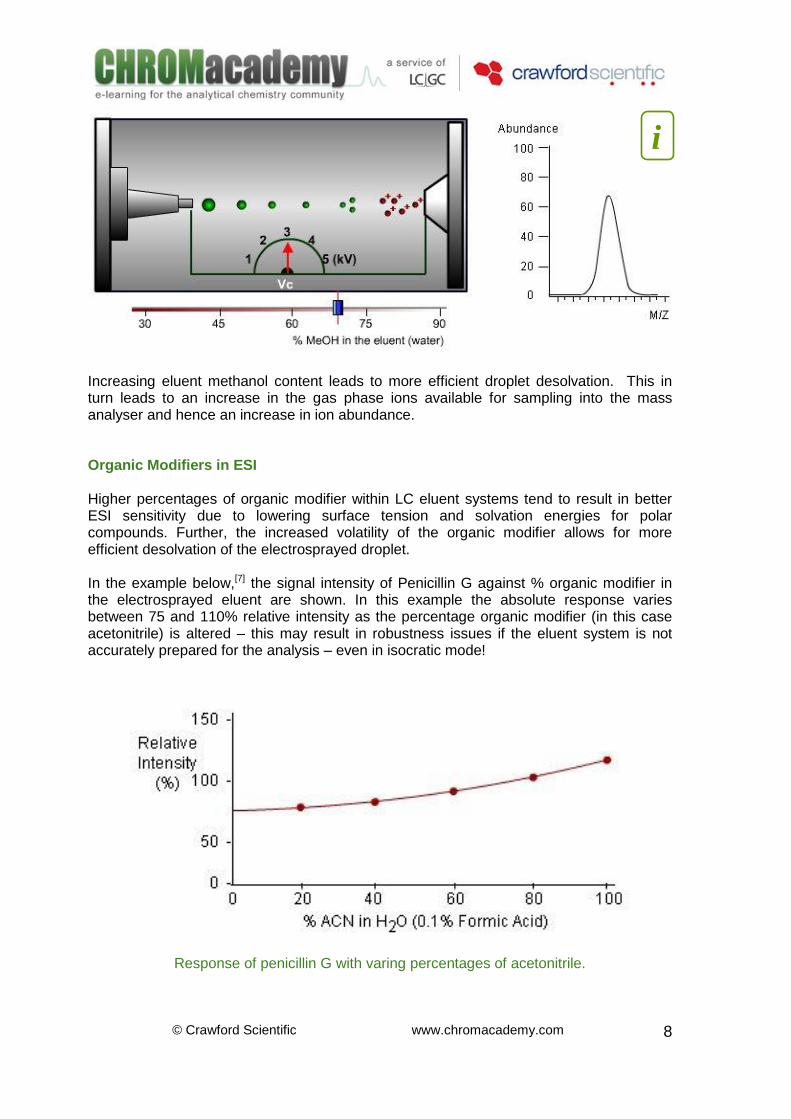
Increasing eluent methanol content leads to more efficient droplet desolvation. This in turn leads to an increase in the gas phase ions available for sampling into the mass analyser and hence an increase in ion abundance. Organic Modifiers in ESI Higher percentages of organic modifier within LC eluent systems tend to result in better ESI sensitivity due to lowering surface tension and solvation energies for polar compounds. Further, the increased volatility of the organic modifier allows for more efficient desolvation of the electrosprayed droplet. In the example below,[7] the signal intensity of Penicillin G against % organic modifier in the electrosprayed eluent are shown. In this example the absolute response varies between 75 and 110% relative intensity as the percentage organic modifier (in this case acetonitrile) is altered – this may result in robustness issues if the eluent system is not accurately prepared for the analysis – even in isocratic mode!
Response of penicillin G with varing percentages of acetonitrile.
i
© Crawford Scientific www.chromacademy.com
9
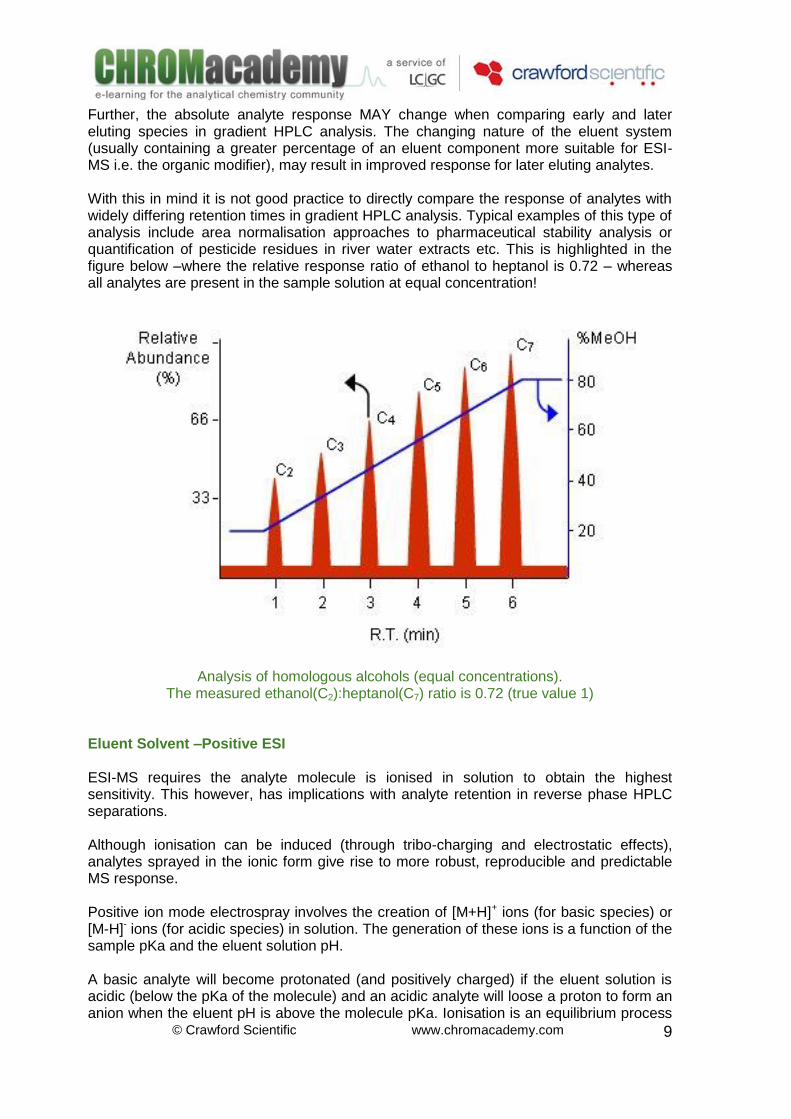
Further, the absolute analyte response MAY change when comparing early and later eluting species in gradient HPLC analysis. The changing nature of the eluent system (usually containing a greater percentage of an eluent component more suitable for ESI-MS i.e. the organic modifier), may result in improved response for later eluting analytes. With this in mind it is not good practice to directly compare the response of analytes with widely differing retention times in gradient HPLC analysis. Typical examples of this type of analysis include area normalisation approaches to pharmaceutical stability analysis or quantification of pesticide residues in river water extracts etc. This is highlighted in the figure below –where the relative response ratio of ethanol to heptanol is 0.72 – whereas all analytes are present in the sample solution at equal concentration!
Analysis of homologous alcohols (equal concentrations). The measured ethanol(C2):heptanol(C7) ratio is 0.72 (true value 1)
Eluent Solvent –Positive ESI ESI-MS requires the analyte molecule is ionised in solution to obtain the highest sensitivity. This however, has implications with analyte retention in reverse phase HPLC separations. Although ionisation can be induced (through tribo-charging and electrostatic effects), analytes sprayed in the ionic form give rise to more robust, reproducible and predictable MS response. Positive ion mode electrospray involves the creation of [M+H]+ ions (for basic species) or [M-H]- ions (for acidic species) in solution. The generation of these ions is a function of the sample pKa and the eluent solution pH. A basic analyte will become protonated (and positively charged) if the eluent solution is acidic (below the pKa of the molecule) and an acidic analyte will loose a proton to form an anion when the eluent pH is above the molecule pKa. Ionisation is an equilibrium process

© Crawford Scientific www.chromacademy.com
10
and sample sensitivity depends on the degree of ionisation of the analyte. Knowing the pKa of the analyte functional groups will allow the user to predict the required eluent solution pH for maximum sensitivity ESI-MS.
Production of charged droplets Eluent pH –Positive ESI The effect of changing eluent pH in positive ESI-MS is illustrated below with phenytoin (an anticonvulsant drug, 252.3 Dalton).[8] If the pH of the eluent solution is adjusted to match the pKa of the basic functional group, 50% of the analyte molecules will be ionised at any one instant. Using an eluent pH equal to the pKa is not ideal as retention times can be variable and affected by small changes in the eluent pH. By raising the eluent pH by 2 units the basic functional group will be 99.5% non-ionised and although it’s retention time will increase, the signal intensity will decrease. Conversely, by lowering the eluent pH 2 units below the pKa, the basic group will be 99.5% ionised and will show good ESI-MS positive mode sensitivity, although it’s retention time will be considerably shortened. Compounds that have functional groups that protonate readily such as basic nitrogens show good sensitivity. Those that are polar but contain no basic nitrogen atoms show moderate sensitivity. Hydrocarbons have poor positive mode ESI-MS sensitivity due to the lack of ionisable or polarisable functional groups.
i

© Crawford Scientific www.chromacademy.com
11
Eluent pH effect in the analysis of a basic sample
Eluent pH –Negative ESI Solution chemistry for negative ion analysis involves the creation of [M-H]- ions in solution and the generation of these ions in solution is again a function of the sample pKa and the eluent solution pH. It is important to establish the pKa of the various acidic functional groups within the analyte molecule to allow prediction of the eluent pH that will give rise to the highest ESI-MS sensitivity. The sample will loose a proton in solution when the eluent pH is increased and become negatively charged. The pH effect in negative ESI-MS is illustrated opposite with indomethacin (anti-innflamatory & pain killer, 345.5 Dalton).[9] By raising the eluent pH, two pH units above the pKa, the acidic group will be 99.5% ionised and will show good ESI-MS negative
Note how in the equilibrium OHNHROHNR 323
When pH increases (OH- addition) decreases dissociation
When pH decreases (H3O+ addition) increases dissociation
i

© Crawford Scientific www.chromacademy.com
12
mode sensitivity, however it’s rerention time in reverse phase HPLC will be significantly reduced. By reducing the eluent pH below the analyte pKa, the retention time of the analyte will increase but the signal intensity will be significantly reduced. For negative ionisation, analytes with functional groups that deprotonate readily, such as carboxylic or sulfonic acids, show the best sensitivity. Analytes that are polar but contain no acidic groups show less sensitivity.
Effect of pH on retention time
Note how in the equilibrium OHAcOHHAc 32
When pH increases (OH- addition) dissociation increases
When pH decreases (H3O+ addition) dissociation decreases
i
© Crawford Scientific www.chromacademy.com
13
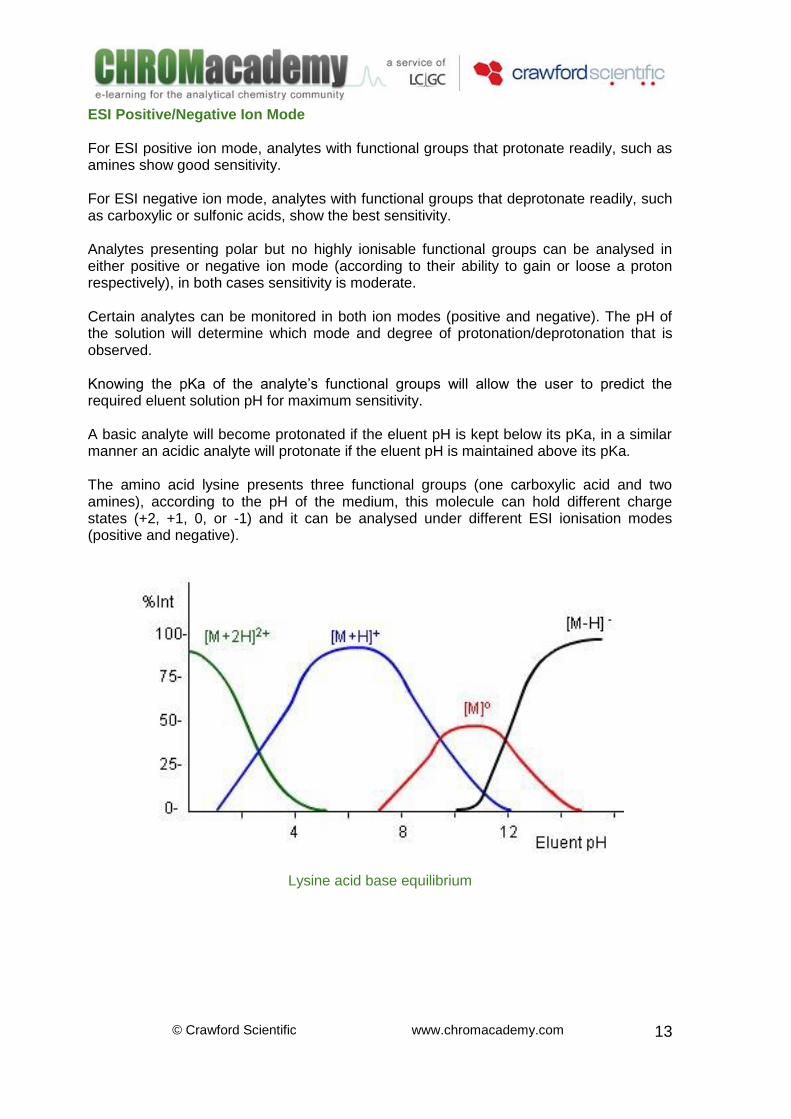
ESI Positive/Negative Ion Mode For ESI positive ion mode, analytes with functional groups that protonate readily, such as amines show good sensitivity. For ESI negative ion mode, analytes with functional groups that deprotonate readily, such as carboxylic or sulfonic acids, show the best sensitivity. Analytes presenting polar but no highly ionisable functional groups can be analysed in either positive or negative ion mode (according to their ability to gain or loose a proton respectively), in both cases sensitivity is moderate. Certain analytes can be monitored in both ion modes (positive and negative). The pH of the solution will determine which mode and degree of protonation/deprotonation that is observed. Knowing the pKa of the analyte’s functional groups will allow the user to predict the required eluent solution pH for maximum sensitivity. A basic analyte will become protonated if the eluent pH is kept below its pKa, in a similar manner an acidic analyte will protonate if the eluent pH is maintained above its pKa. The amino acid lysine presents three functional groups (one carboxylic acid and two amines), according to the pH of the medium, this molecule can hold different charge states (+2, +1, 0, or -1) and it can be analysed under different ESI ionisation modes (positive and negative).
Lysine acid base equilibrium

© Crawford Scientific www.chromacademy.com
14
Lysine acid base equilibrium (continuation)
i
© Crawford Scientific www.chromacademy.com
15
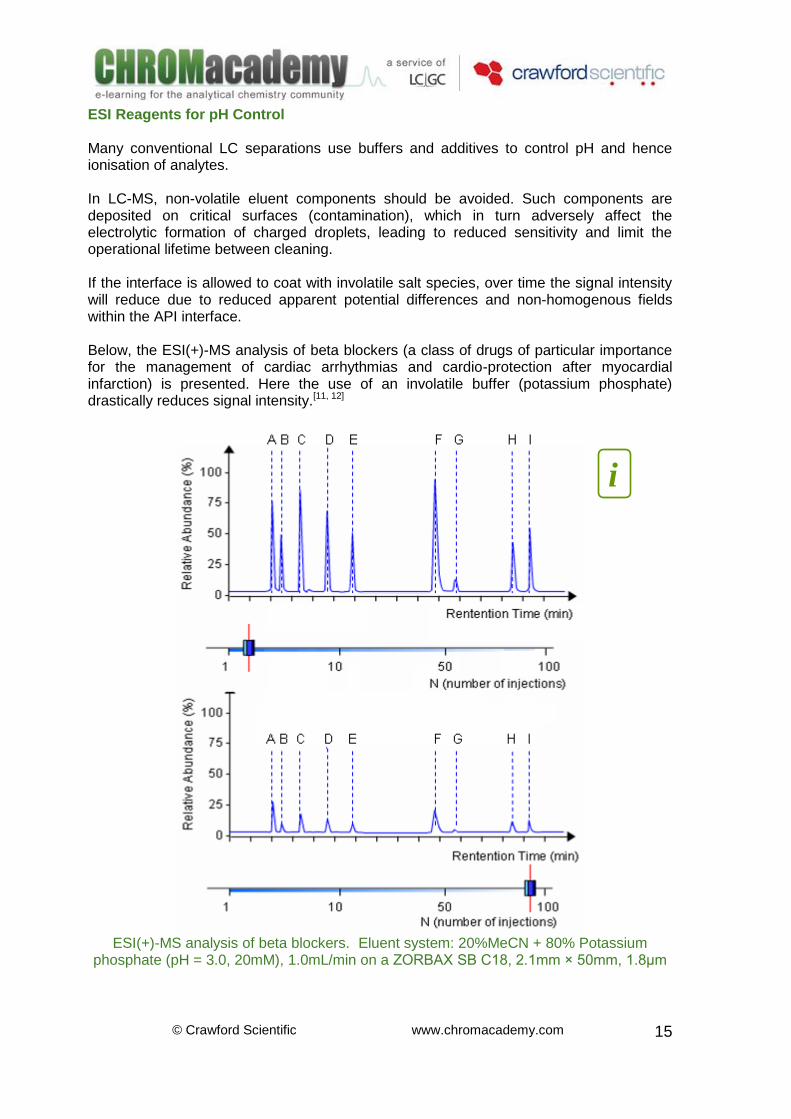
ESI Reagents for pH Control Many conventional LC separations use buffers and additives to control pH and hence ionisation of analytes. In LC-MS, non-volatile eluent components should be avoided. Such components are deposited on critical surfaces (contamination), which in turn adversely affect the electrolytic formation of charged droplets, leading to reduced sensitivity and limit the operational lifetime between cleaning. If the interface is allowed to coat with involatile salt species, over time the signal intensity will reduce due to reduced apparent potential differences and non-homogenous fields within the API interface. Below, the ESI(+)-MS analysis of beta blockers (a class of drugs of particular importance for the management of cardiac arrhythmias and cardio-protection after myocardial infarction) is presented. Here the use of an involatile buffer (potassium phosphate) drastically reduces signal intensity.[11, 12]
ESI(+)-MS analysis of beta blockers. Eluent system: 20%MeCN + 80% Potassium
phosphate (pH = 3.0, 20mM), 1.0mL/min on a ZORBAX SB C18, 2.1mm × 50mm, 1.8μm
i
© Crawford Scientific www.chromacademy.com
16
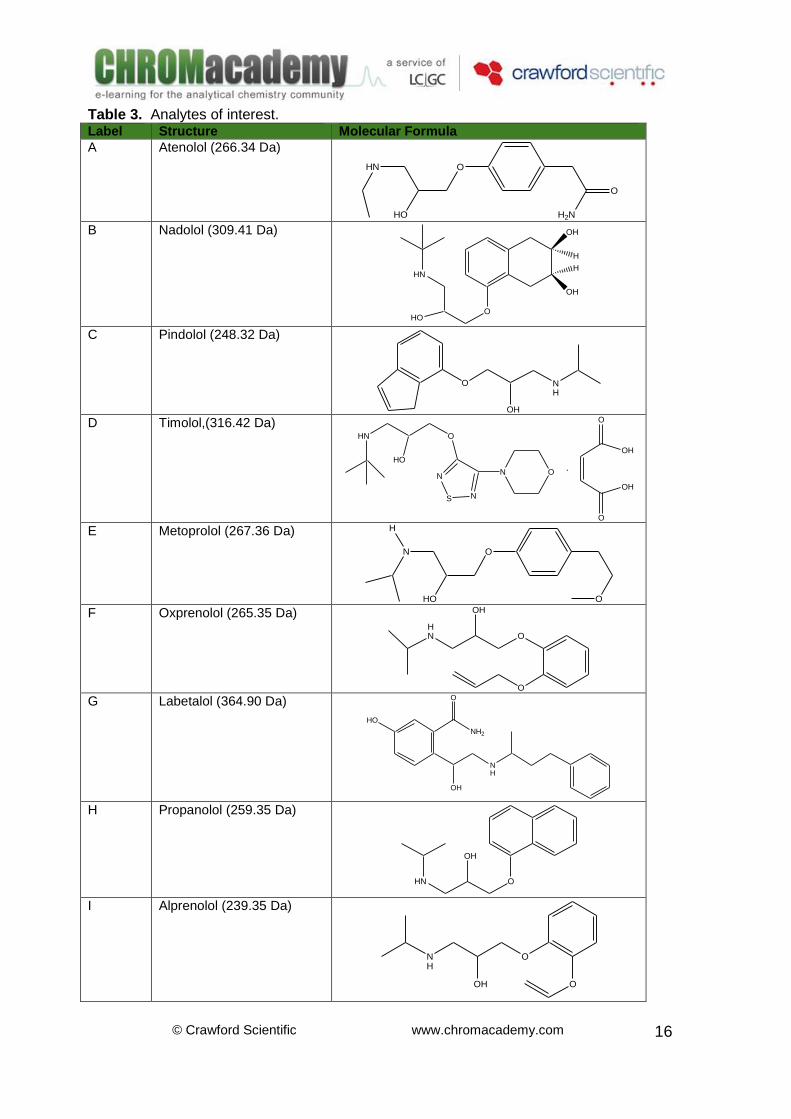
Table 3. Analytes of interest. Label Structure Molecular Formula
A Atenolol (266.34 Da)
O
H2N
O
HO
HN
B Nadolol (309.41 Da) OH
OH
H
H
OHO
HN
C Pindolol (248.32 Da)
O NH
OH D Timolol,(316.42 Da)
N ON
S N
O
HO
HN
O
OH
O
OH
.
E Metoprolol (267.36 Da)
O
ON
HO
H
F Oxprenolol (265.35 Da)
O
O
HN
OH
G Labetalol (364.90 Da)
NH
OH
HO
O
NH2
H Propanolol (259.35 Da)
O
OH
HN
I Alprenolol (239.35 Da)
O
OOH
NH

© Crawford Scientific www.chromacademy.com
17
Sources for non-Volatile Systems Contamination and blocking of the electrospray capillary or any ion transfer tubes will also cause disruption to the chagrining of the component, but these components can also generally be restored by cleaning. Instrument manufacturers have produced interfaces that can increase the compatibility of non-voltile components with API interfaces. These include:
1. Turbo-ionspray from Applied Biosystems / MDS-Sciex (Foster City, CA, USA)
2. Orthogonally sprayed sources such as the Z-Spray source from Micromass (Manchester, UK)
i
© Crawford Scientific www.chromacademy.com
18
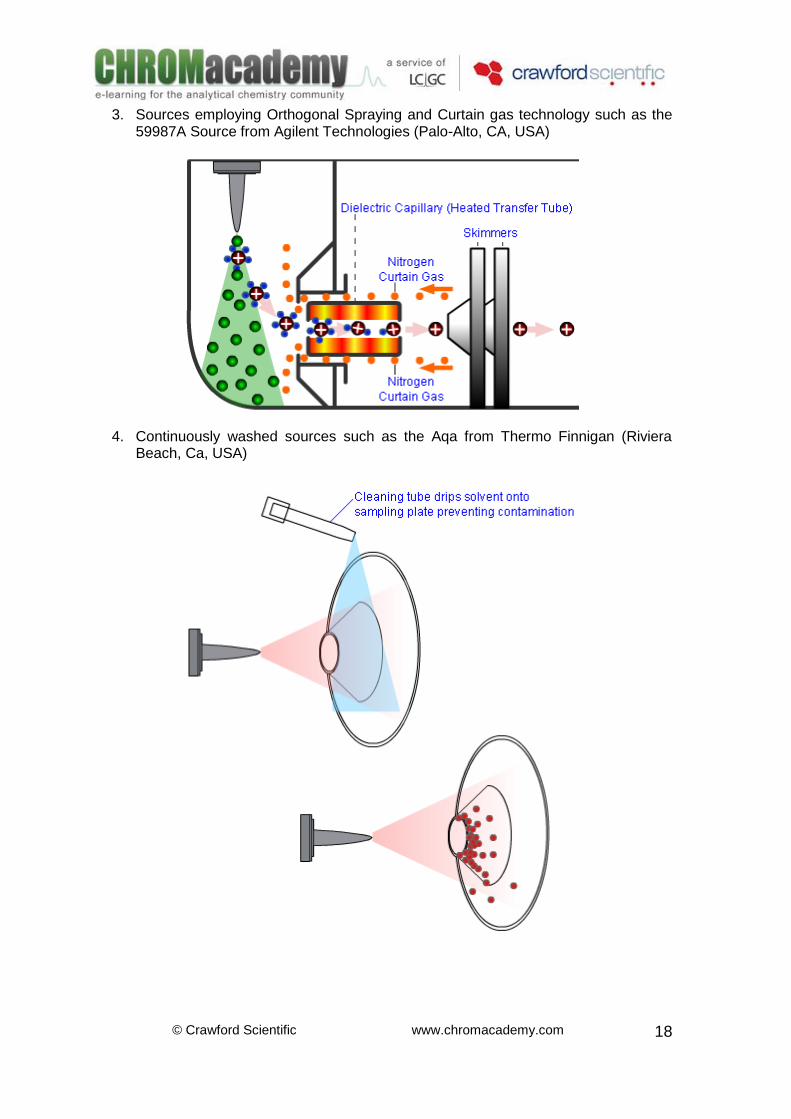
3. Sources employing Orthogonal Spraying and Curtain gas technology such as the 59987A Source from Agilent Technologies (Palo-Alto, CA, USA)
4. Continuously washed sources such as the Aqa from Thermo Finnigan (Riviera Beach, Ca, USA)

© Crawford Scientific www.chromacademy.com
19
Z-Spray and non-Volatile Systems Using an orthogonally sprayed source (Z-spray, Waters, Manchester, UK), the non-volatile buffer salts are deposited onto a baffle plate and are not directly deposited on the critical electrode surfaces or within the sampling plate orifice. This allows for greater instrument operating periods between source cleaning. Table 4. Components of the Hanks Balanced salt solution.
Hanks balanced salt solution Concentration
Calcium Chloride 1.0 mM
Potassium Chloride 5.0 mM
Sodium Chloride 138.0 mM
Magnesium Sulphate 1.0 mM
Sodium Bicarbonate 4.0 mM
Phosphates 1.0 mM
Glucose 5.0 mM
Total 10.0 g/L
Probenecid is a uricosuric drug (substances that increase the excretion of uric acid), it is primarily used in treating gout or hyperuricemia. Probenecid presents limited solubility in HPLC reverse phase solvents; however, it can be solubilised in acetonitrile with the Hanks balanced salt solution.[13]
ESI(+)-MS determination of probenecid on a Xterra C18, 2.1mm×20mm, 2.5μm

© Crawford Scientific www.chromacademy.com
20
The experiment was designed to test the ruggedness of the Z-Spray orthogonal source and it was found that after 30 injection cycles, the relative response remains almost constant whilst under the same conditions the relative response using an on-axis electro-spray decreases by 70-80%.
ESI(+)-MS determination of probenecid on a Xterra C18, 2.1mm×20mm, 2.5μm

© Crawford Scientific www.chromacademy.com
21
ESI Test compound infusion In order to study the effects of varying buffers and additives on the ESI-MS process and to optimise the interface parameters, infusion devices may be employed to study the instrument signal over extended periods of time.
Infusion is the continuous delivery of sample solution into the API interface via a syringe pump or from a manual injection valve. Infused data generally provide high sensitivity due to the ability to collect data with slow MS scanning speeds over extended periods of time. Infusion requires pure samples or mixtures (usually not more than five components). Often, problems of altered relative response (ion suppression) are observed when infusing solutions containing more than one standard material. The sample size has to be large due to the volumes consumed during the constant infusion process unless nano-electrospray sources are available. With manual injection, the baseline signal rises as the sample enters the mass spectrometer, followed by a steady state as the material is slowly introduced from the loop. The signal then falls exponentially as the sample is exhausted and the injection valve is emptied. Depending upon the type of injection valve used and the loop size, several minutes of data should be obtainable.
Infusion pump
i

© Crawford Scientific www.chromacademy.com
22
ESI Buffer Choice and Concentration In ESI-MS the buffer salts present within the eluent solution and in the sample matrix may interfere with crucial API processes. When choosing an appropriate volatile buffer the nature of the buffer species should be considered. In both positive and negative ion mode an increase in the buffer concentration lead to a decrease in the analyte signal.[5] However, this effect is compound dependant, with some analytes showing only a small loss in response. This effect is presented opposite, note that compounds such as indomethacin and caffeine, showed a 100-fold decrease in response from 1 to 100 mM ammonium acetate buffer concentration, but some others like lidocaine remains almost constant. At higher buffer ion concentrations the competition for surface sites on the electrosprayed droplet favours the higher concentration species and analyte species become depleted. In negative ion mode formic acid and ammonium formate performed equally well, but trifluoroacetic acid (TFA) suppressed all of the sample signals, making it unsuitable for ESI/MS (the results are not shown). In positive ion mode, the analyte response decreased across the series (10 mM eluent solutions) in the order: Formic acid (100%) > ammonium formate (60-85%) > TFA (30-50%).[5]
ESI analysis of some pharmacologically active species
© Crawford Scientific www.chromacademy.com
23
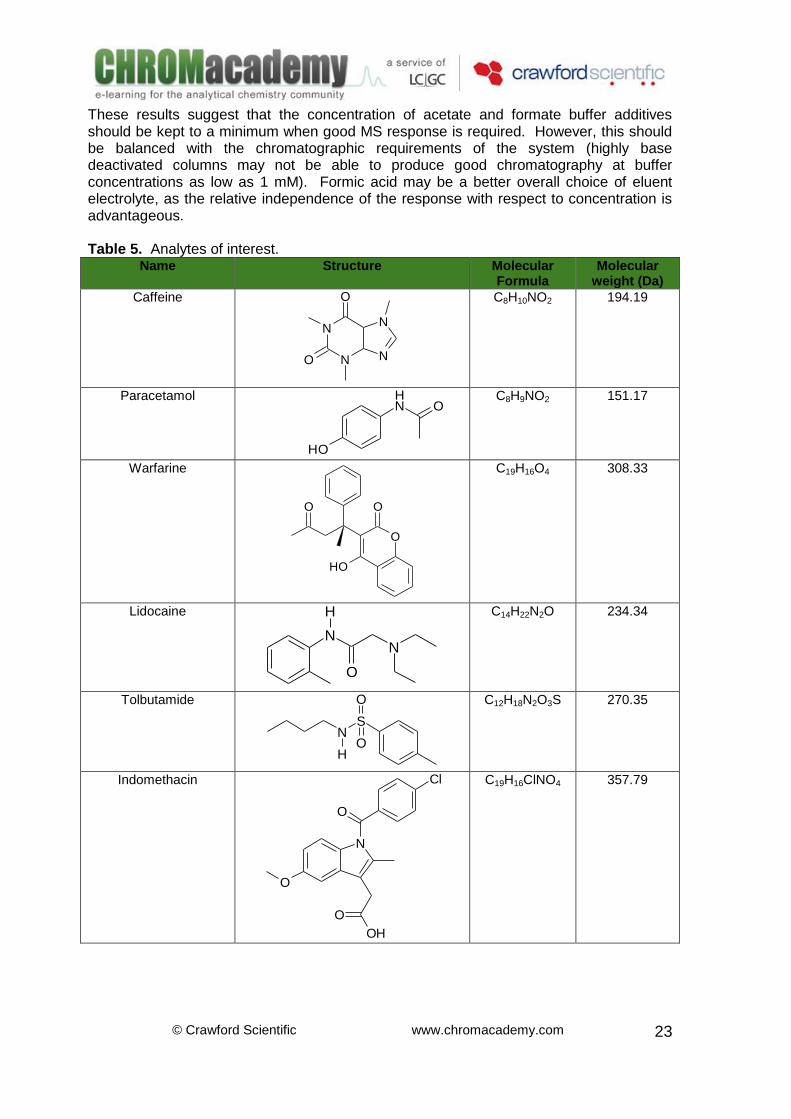
These results suggest that the concentration of acetate and formate buffer additives should be kept to a minimum when good MS response is required. However, this should be balanced with the chromatographic requirements of the system (highly base deactivated columns may not be able to produce good chromatography at buffer concentrations as low as 1 mM). Formic acid may be a better overall choice of eluent electrolyte, as the relative independence of the response with respect to concentration is advantageous. Table 5. Analytes of interest.
Name Structure Molecular Formula
Molecular weight (Da)
Caffeine
N
N N
N
O
O
C8H10NO2 194.19
Paracetamol NH
OH
O
C8H9NO2 151.17
Warfarine
O
O
OH
O
C19H16O4 308.33
Lidocaine
C14H22N2O 234.34
Tolbutamide
NS
O
HO
C12H18N2O3S 270.35
Indomethacin
O
N
O
Cl
OH
O
C19H16ClNO4 357.79
N
O
N
H

© Crawford Scientific www.chromacademy.com
24
ESI Buffer Systems When choosing an appropriate buffer system, the results from the previous experiment need to be considered in a practical context.[5]
Eluent buffer species will compete for surface sites on the electrosprayed droplets. Droplet surface residence of the analyte is crucial to the ion evaporation process, and as such the ability of the buffer species to reside at the droplet surface should be minimized. This can be achieved by using buffer species that have low solution mobility. Ideally these buffer systems should be hydrophilic and present low molecular weight and high charge state. This will ensure that the buffer ions present have a large ‘sphere of hydration’, which hampers their ability to move through solution to the droplet surface. By ensuring that these criteria are met it is likely that the analyte species will be able to more efficiently migrate to the droplet surface and therefore analyte sensitivity will be optimised.
Signal (ion) suppression is experienced when some additives are present in the eluent system. TFA (trifluoroacetic) is widely used in reverse-phase liquid chromatography as an ion pair reagent with basic compounds. The resulting ion pair appears neutral to the stationary phase and the chromatographic peak elutes with satisfactory retention.
Migration to the droplet surface
Sphere of hydration comparison (left buffer ion, right analyte ion) The mechanism of ion suppression with TFA involves the [CF3COO]- anion pairing with the [M+H]+ cation in solution. Even if the ion-paired analyte molecule is ejected into the gas phase, it will be uncharged and therefore will not give rise to a signal in the mass spectrometer –effectively ‘quenching’ or ‘suppressing’ the analyte signal.
i

© Crawford Scientific www.chromacademy.com
25
Ion pair formation
ESI Ion Pair Reagents –Overview Ion-pair reagents may be necessary for the separation of ionic sample components. The charged sample ion forms a complex with the oppositely charged ion-pair reagent resulting in greater retention and separation. The challenge for the analyst is to find an ion-pair system that does not interfere with the ion formation process but still yields acceptable chromatographic behaviour. Unfortunately, the most common ion-pair reagents are non-volatile and include alkyl sulfonates and tetra-alkyl ammonium salts. API LC-MS requires that the analyte is ionic in solution (ESI) or that the analyte accepts or donates a proton in the gas phase, (APCI). Ion-pairing reagents can interfere with the ionisation process due to charge neutralisation in ESI-MS and by agglomerating analyte and altering proton affinities in APCI-MS. The ESI signal for some biochemical active compounds is presented below. The signal for norepinefrine improve by the presence of the volatile ion-pairing reagents (VA and PFHA). Ionisation of erythromycin also improves when PFHA is present. HSA causes significant suppression for all analytes because the non-volatile ion-pair hinders the escape of the analyte from the droplets during electros pray ionisation.

© Crawford Scientific www.chromacademy.com
26
Ion pair reagent effect in ESI (refer to tables 6 and 7) Table 6. Analytes of interest. Compound Name/Property Structure Molecular
Formula Molecular
weight (Da)
A Erythromycin (EYR): Low volatility
O
OO
O
O
O
OH
OH
O
O
OH
OHN
OH
C37H67NO13 733.94
B Mitowazone (MGBG): Moderate
volatility
NH2
NH
NH
N
N
NH2
NH
NH
C5H12N8 184
C Norepinephrine (NOR): High volatility
OH
OH
OH
NH2
C8H11NO3 169
D Tyramine (TYR): High volatility
NH2
OH
C8H9NO 137.18
AmOAc Ammonium acetate CH3COONH2 C2H5O2N 75
PFHA Perfluoro heptanoic acid
CF3(CF2)5COOH C7F13O2H 364
HSA Heptane sulphonic acid
CH3(CH2)6SO3H C7H16O3S 180
VA Valeric acid CH3(CH2)3COOH C5H10O2 102
i

© Crawford Scientific www.chromacademy.com
27
Table 7. Ion pairing reagents. Label Compound Structure Molecular
Formula Molecular
weight (Da)
AmOAc Ammonium acetate CH3COONH2 C2H5O2N 75
PFHA Perfluoro heptanoic acid CF3(CF2)5COOH C7F13O2H 364
HSA Heptane sulphonic acid CH3(CH2)6SO3H C7H16O3S 180
VA Valeric acid CH3(CH2)3COOH C5H10O2 102
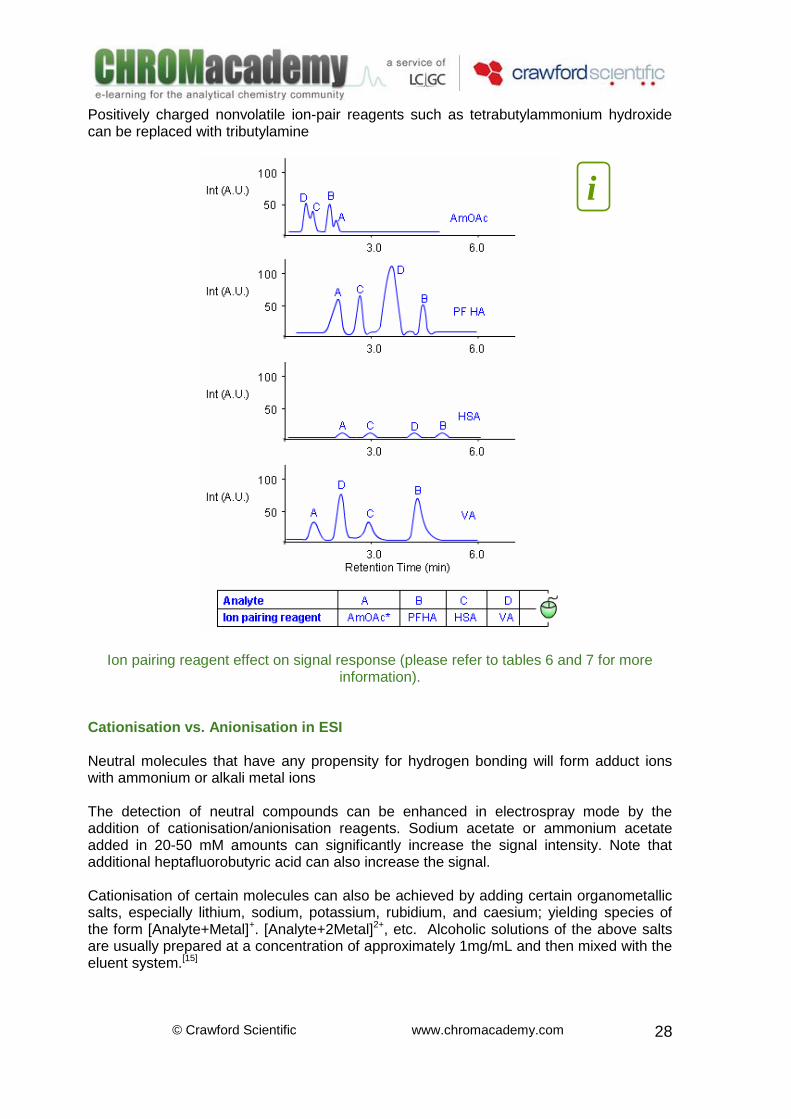
Weak and strong volatile ion-pair reagents such as valeric acid (VA) and perfluoroheptanoic acid (PFHA) can replace nonvolatile strong ion-pair reagents such as sodium heptane sulfonic acid (HSA). A study of four pharmaceutically active compounds highlights the impact of the ion-pair reagent on MS response and separation as a percent of a control (ammonium acetate).[9] The ESI signal for norepinephrine improves by the presence of the volatile ion-pair reagents (VA and PFHA). Ionisation of erythromycin also improves when PFHA is present. HSA causes significant suppression for all analytes because the nonvolatile ion-pair hinders the escape of analyte from the droplets during electrospray ionisation. Positively charged nonvolatile ion-pair reagents such as tetrabutylammonium hydroxide can be replaced with tributylamine
Ion pair reagent effect in ESI (refer to tables 6 and 7)
ESI Ion Pair Reagents –Considerations Weak and strong volatile ion-pair reagents such as valeric acid (VA) and perfluoroheptanoic acid (PFHA) can replace nonvolatile strong ion-pair reagents such as sodium heptane sulfonic acid (HSA). A study of four pharmaceutically active compounds highlights the impact of the ion-pair reagent on MS response and separation as a percent of a control (ammonium acetate).[14] The ESI signal for norepinephrine improves in the presence of the volatile ion-pair reagents (VA and PFHA). Ionisation of erythromycin also improves when PFHA is present. HSA causes significant suppression for all analytes because the nonvolatile ion-pair hinders the escape of analyte from the droplets during electrospray ionisation.
i
© Crawford Scientific www.chromacademy.com
28
Positively charged nonvolatile ion-pair reagents such as tetrabutylammonium hydroxide can be replaced with tributylamine
Ion pairing reagent effect on signal response (please refer to tables 6 and 7 for more information).
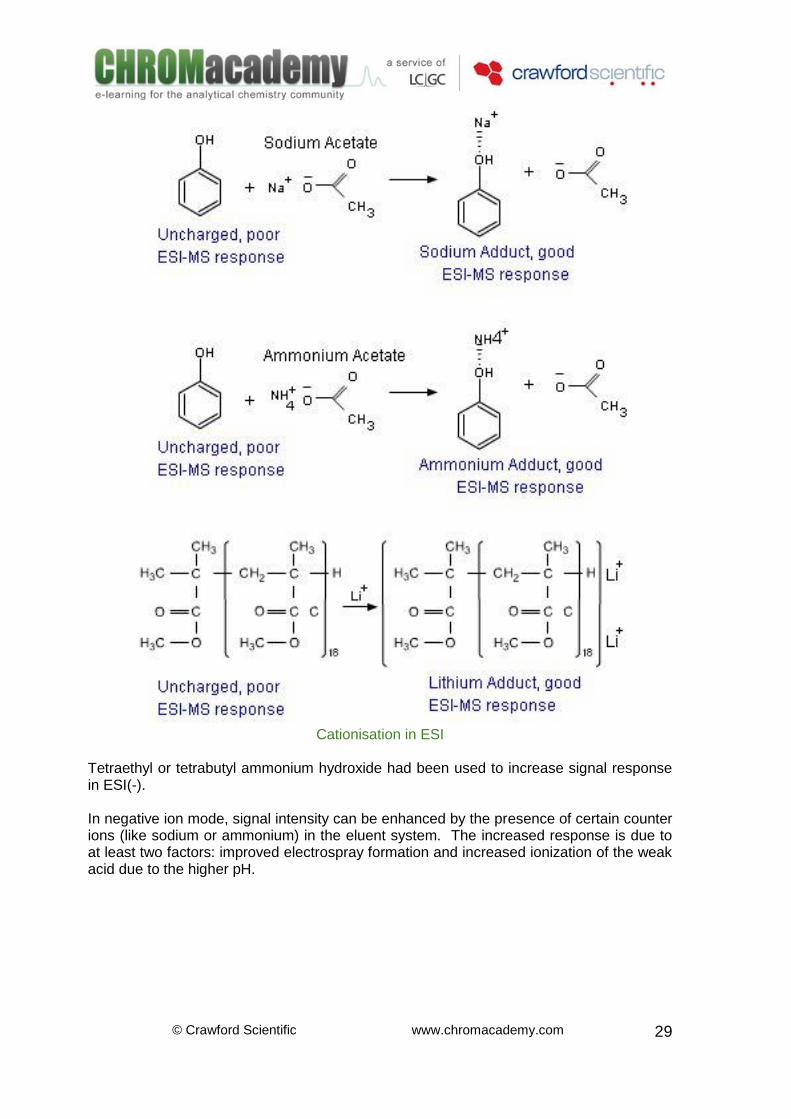
Cationisation vs. Anionisation in ESI Neutral molecules that have any propensity for hydrogen bonding will form adduct ions with ammonium or alkali metal ions The detection of neutral compounds can be enhanced in electrospray mode by the addition of cationisation/anionisation reagents. Sodium acetate or ammonium acetate added in 20-50 mM amounts can significantly increase the signal intensity. Note that additional heptafluorobutyric acid can also increase the signal. Cationisation of certain molecules can also be achieved by adding certain organometallic salts, especially lithium, sodium, potassium, rubidium, and caesium; yielding species of the form [Analyte+Metal]+. [Analyte+2Metal]2+, etc. Alcoholic solutions of the above salts are usually prepared at a concentration of approximately 1mg/mL and then mixed with the eluent system.[15]
i
© Crawford Scientific www.chromacademy.com
29
Cationisation in ESI
Tetraethyl or tetrabutyl ammonium hydroxide had been used to increase signal response in ESI(-). In negative ion mode, signal intensity can be enhanced by the presence of certain counter ions (like sodium or ammonium) in the eluent system. The increased response is due to at least two factors: improved electrospray formation and increased ionization of the weak acid due to the higher pH.

© Crawford Scientific www.chromacademy.com
30
Anaionisation in ESI The ESI response of propionate is increased three-fold when the counterion is sodium,
relative to the response when the counterion is mostly H+. If the counterion is
4NH the
signal response is increased six-fold. Pre and Post Column Addition in ESI The increase in response of an analyte in ESI-MS can occur for a variety of reasons. Typically, this is due to an increase in the concentration of the analyte in the chromatographic peak, such as injecting increasing amounts of analyte; however, response can also be increased by enhancing the generation of gas phase analyte ions. This can be accomplished by manipulating various ion source parameters or through changes in mobile phase composition and flow rate. The chemical composition of the mobile phase plays an important role both in the chromatographic separation and in the ESI ionisation process. The use of an auxiliary liquid could help not only in the generation of ions (under ESI conditions) but it can also help to optimise the HPLC separation. Two main strategies have been developed:

© Crawford Scientific www.chromacademy.com
31
Pre-column addition is mainly used to improve the quality of the HPLC separation. Here, the auxiliary liquid is mixed with the eluent system before it enters the HPLC column.
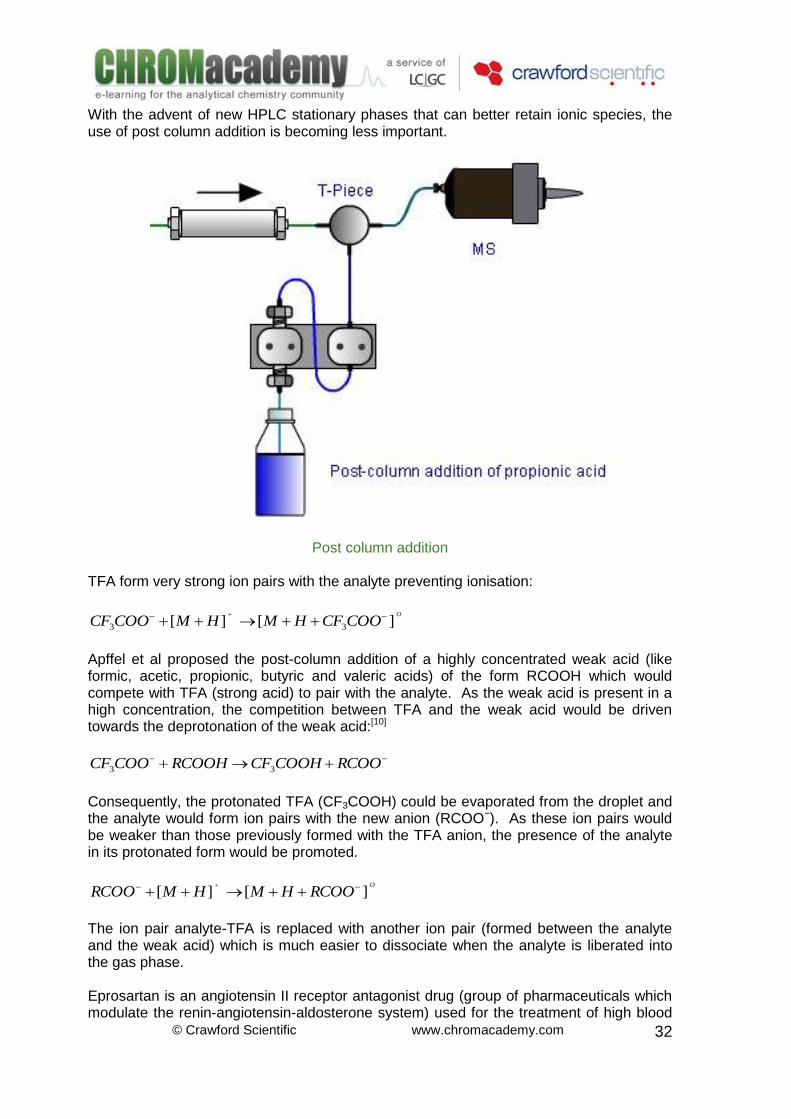
Post-column addition is mainly used to improve the ionisation process. Here, the auxiliary liquid is mixed with the eluent system after it leaves the HPLC column.
Pre and post column addition allows the analyst to independently optimise separation and ionisation processes.
Pre and post column addition
Post Column Addition in ESI Post-column addition allows the analyst to optimise the electrospray ionisation conditions (pH, ionic strength, etc) without compromising the quality of the HPLC separation.[10, 16]
Buffers can be used to adjust and keep the correct pH for the ionisation process to takes place.
Certain organic solvents (like methanol) can be used to reduce ionic strength, which in turn facilitate the ion evaporation process.
The addition of anionisation/cationisation reagents will increase signal response.
Some widely used volatile reagents (such as trifluoroacetic acid TFA) form very strong ion pairs with the analyte (preventing ionisation). The addition of certain species (like weak volatile acids) can minimise these problem.
Typically, the reagent stream flow rate is 10-50% of the column separation flow rate. There are some disadvantages inherent to post-column addition: it requires an extra pump and can broaden chromatographic peaks due to the dead volumes introduced; analyte concentration is also lowered, which may reduce the sensitivity of the analysis.
© Crawford Scientific www.chromacademy.com
32
With the advent of new HPLC stationary phases that can better retain ionic species, the use of post column addition is becoming less important.
Post column addition TFA form very strong ion pairs with the analyte preventing ionisation:
O
COOCFHMHMCOOCF ][][ 33
Apffel et al proposed the post-column addition of a highly concentrated weak acid (like formic, acetic, propionic, butyric and valeric acids) of the form RCOOH which would compete with TFA (strong acid) to pair with the analyte. As the weak acid is present in a high concentration, the competition between TFA and the weak acid would be driven towards the deprotonation of the weak acid:[10]
RCOOCOOHCFRCOOHCOOCF 33
Consequently, the protonated TFA (CF3COOH) could be evaporated from the droplet and the analyte would form ion pairs with the new anion (RCOO−). As these ion pairs would be weaker than those previously formed with the TFA anion, the presence of the analyte in its protonated form would be promoted.
O
RCOOHMHMRCOO ][][
The ion pair analyte-TFA is replaced with another ion pair (formed between the analyte and the weak acid) which is much easier to dissociate when the analyte is liberated into the gas phase. Eprosartan is an angiotensin II receptor antagonist drug (group of pharmaceuticals which modulate the renin-angiotensin-aldosterone system) used for the treatment of high blood

© Crawford Scientific www.chromacademy.com
33
pressure. The diagram below shows the ESI analysis of an eprosartan extract from a whole blood sample – the mobile phase contains TFA.
ESI(+)-MS determination of eprosartan, eluent system: 200μL/min 40%(0.2%TFA in
water) + 60%(0.2%TFA in acetonitrile), 200 μL/min. Column: Vydac, 250 × 2.1mm, 5μm The increase in signal intensity with the addition of increasing amounts of organic acid is noteable. The TFA is replaced as the ion pair with the analyte molecule by the weak organic acid – this ion pair dissociates effectively as the ion pair is librated into the gas phase, giving rise to an analyte ion as opposed to the ion-pair. ESI Adduct Formation When a molecule is analysed by API techniques, typically, the predominant specie in the mass spectrum is the protonated molecular ion (pseudomolecular ion):
[M+H]+ acidic conditions (positive ion mode)
[M-H]- basic conditions (negative ion mode) Other pseudomolecular ions may be produced and even predominate, depending upon the mobile phase additives, and impurities.[17, 18, 19, 20] The analytical process includes recognition of target masses (i.e. for analysis of combinatorial library samples), it is possible to reject compounds whose mass does not match the target due to adduct formation. Computer algorithms are often programmed to search the spectrum obtained for the target mass of interest and also for the common adducts to avoid this situation.
© Crawford Scientific www.chromacademy.com
34
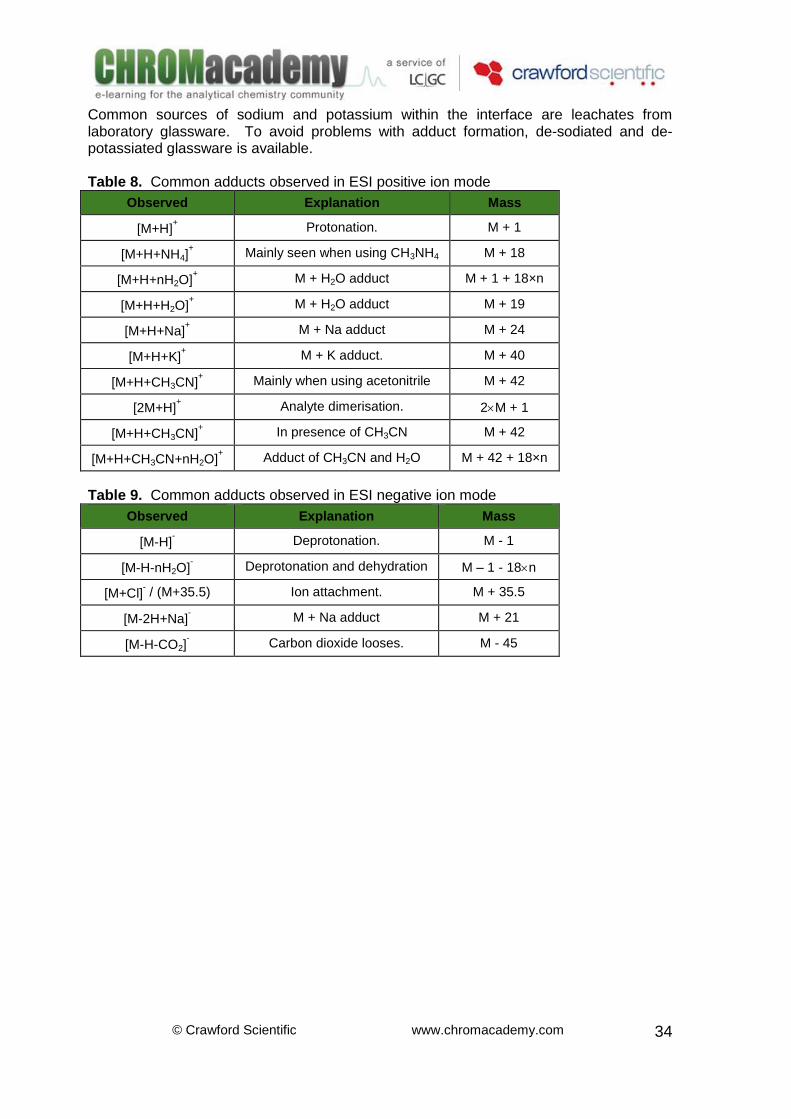
Common sources of sodium and potassium within the interface are leachates from laboratory glassware. To avoid problems with adduct formation, de-sodiated and de-potassiated glassware is available. Table 8. Common adducts observed in ESI positive ion mode
Observed Explanation Mass
[M+H]+ Protonation. M + 1
[M+H+NH4]+ Mainly seen when using CH3NH4 M + 18
[M+H+nH2O]+ M + H2O adduct M + 1 + 18×n
[M+H+H2O]+ M + H2O adduct M + 19
[M+H+Na]+ M + Na adduct M + 24
[M+H+K]+ M + K adduct. M + 40
[M+H+CH3CN]+ Mainly when using acetonitrile M + 42
[2M+H]+ Analyte dimerisation. 2M + 1
[M+H+CH3CN]+ In presence of CH3CN M + 42
[M+H+CH3CN+nH2O]+ Adduct of CH3CN and H2O M + 42 + 18×n
Table 9. Common adducts observed in ESI negative ion mode
Observed Explanation Mass
[M-H]- Deprotonation. M - 1
[M-H-nH2O]- Deprotonation and dehydration M – 1 - 18n
[M+Cl]- / (M+35.5) Ion attachment. M + 35.5
[M-2H+Na]- M + Na adduct M + 21
[M-H-CO2]- Carbon dioxide looses. M - 45
© Crawford Scientific www.chromacademy.com
35
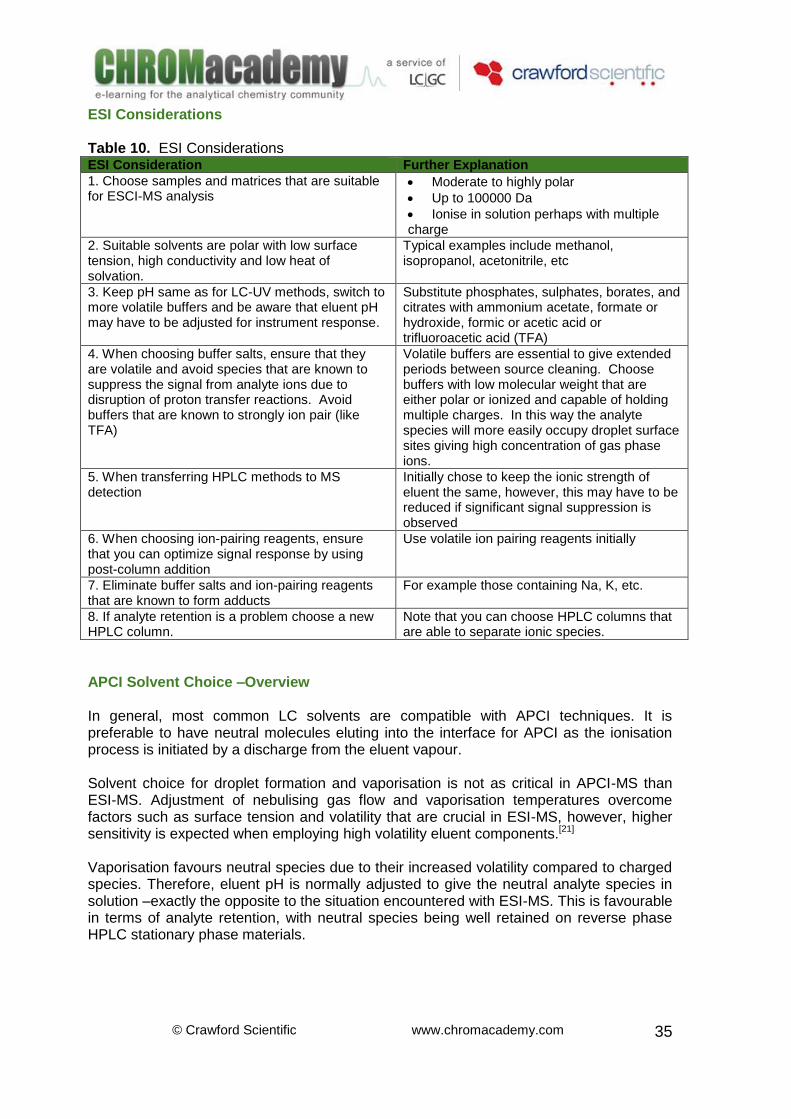
ESI Considerations Table 10. ESI Considerations ESI Consideration Further Explanation
1. Choose samples and matrices that are suitable for ESCI-MS analysis
Moderate to highly polar
Up to 100000 Da
Ionise in solution perhaps with multiple charge
2. Suitable solvents are polar with low surface tension, high conductivity and low heat of solvation.
Typical examples include methanol, isopropanol, acetonitrile, etc
3. Keep pH same as for LC-UV methods, switch to more volatile buffers and be aware that eluent pH may have to be adjusted for instrument response.
Substitute phosphates, sulphates, borates, and citrates with ammonium acetate, formate or hydroxide, formic or acetic acid or trifluoroacetic acid (TFA)
4. When choosing buffer salts, ensure that they are volatile and avoid species that are known to suppress the signal from analyte ions due to disruption of proton transfer reactions. Avoid buffers that are known to strongly ion pair (like TFA)
Volatile buffers are essential to give extended periods between source cleaning. Choose buffers with low molecular weight that are either polar or ionized and capable of holding multiple charges. In this way the analyte species will more easily occupy droplet surface sites giving high concentration of gas phase ions.
5. When transferring HPLC methods to MS detection
Initially chose to keep the ionic strength of eluent the same, however, this may have to be reduced if significant signal suppression is observed
6. When choosing ion-pairing reagents, ensure that you can optimize signal response by using post-column addition
Use volatile ion pairing reagents initially
7. Eliminate buffer salts and ion-pairing reagents that are known to form adducts
For example those containing Na, K, etc.
8. If analyte retention is a problem choose a new HPLC column.
Note that you can choose HPLC columns that are able to separate ionic species.
APCI Solvent Choice –Overview In general, most common LC solvents are compatible with APCI techniques. It is preferable to have neutral molecules eluting into the interface for APCI as the ionisation process is initiated by a discharge from the eluent vapour. Solvent choice for droplet formation and vaporisation is not as critical in APCI-MS than ESI-MS. Adjustment of nebulising gas flow and vaporisation temperatures overcome factors such as surface tension and volatility that are crucial in ESI-MS, however, higher sensitivity is expected when employing high volatility eluent components.[21] Vaporisation favours neutral species due to their increased volatility compared to charged species. Therefore, eluent pH is normally adjusted to give the neutral analyte species in solution –exactly the opposite to the situation encountered with ESI-MS. This is favourable in terms of analyte retention, with neutral species being well retained on reverse phase HPLC stationary phase materials.

© Crawford Scientific www.chromacademy.com
36
The order of events for ion formation in APCI is as follows:
Eluent containing the neutral analyte is nebulised to form droplets
Droplets are vaporised
Electrons from a corona electrode ionise the gas-phase eluent
Analyte molecules are ionised in a series of charge transfer reactions with the eluent ions
APCI(+)-MS determination of phenitioin. Mobile phase 700μL/min of 60% acetonitrile + 40%(5mM ammonium buffer). Column Inertsil ODS-3 (50 × 3mm, 5μm)
i
© Crawford Scientific www.chromacademy.com
37
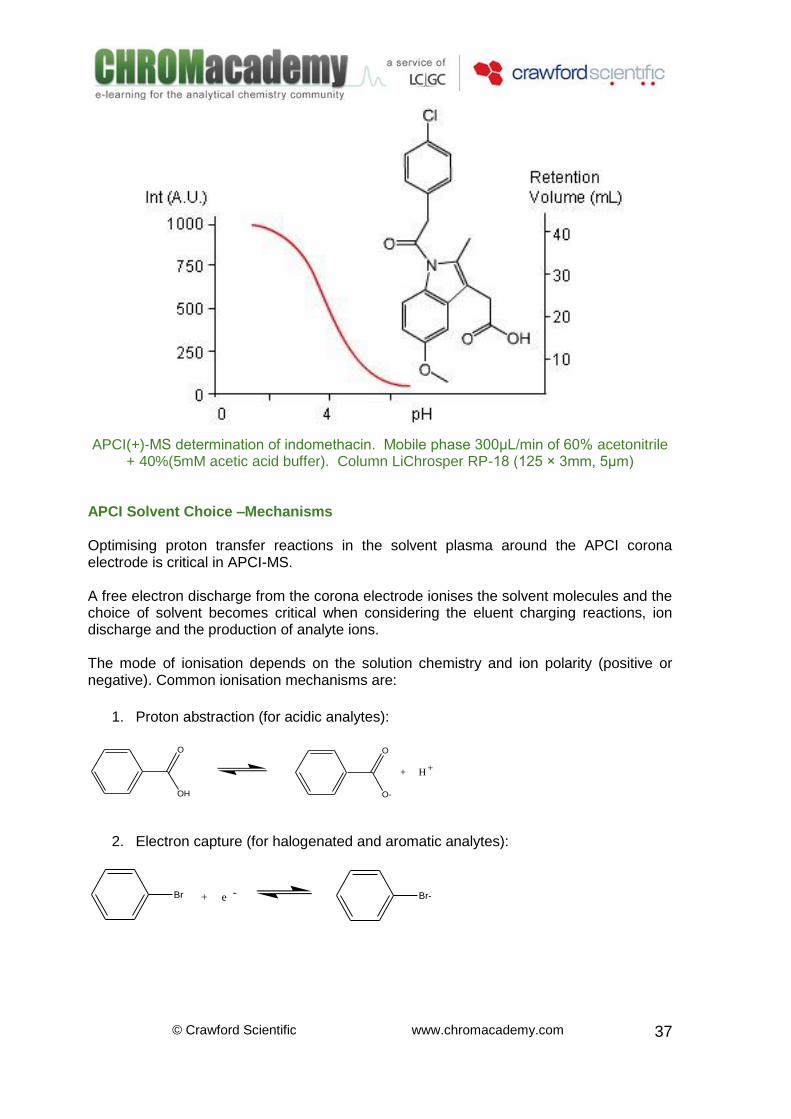
APCI(+)-MS determination of indomethacin. Mobile phase 300μL/min of 60% acetonitrile
+ 40%(5mM acetic acid buffer). Column LiChrosper RP-18 (125 × 3mm, 5μm) APCI Solvent Choice –Mechanisms Optimising proton transfer reactions in the solvent plasma around the APCI corona electrode is critical in APCI-MS. A free electron discharge from the corona electrode ionises the solvent molecules and the choice of solvent becomes critical when considering the eluent charging reactions, ion discharge and the production of analyte ions. The mode of ionisation depends on the solution chemistry and ion polarity (positive or negative). Common ionisation mechanisms are:
1. Proton abstraction (for acidic analytes):
OH
O
O-
O
+ H+
2. Electron capture (for halogenated and aromatic analytes):
Br Br-+ e -
© Crawford Scientific www.chromacademy.com
38
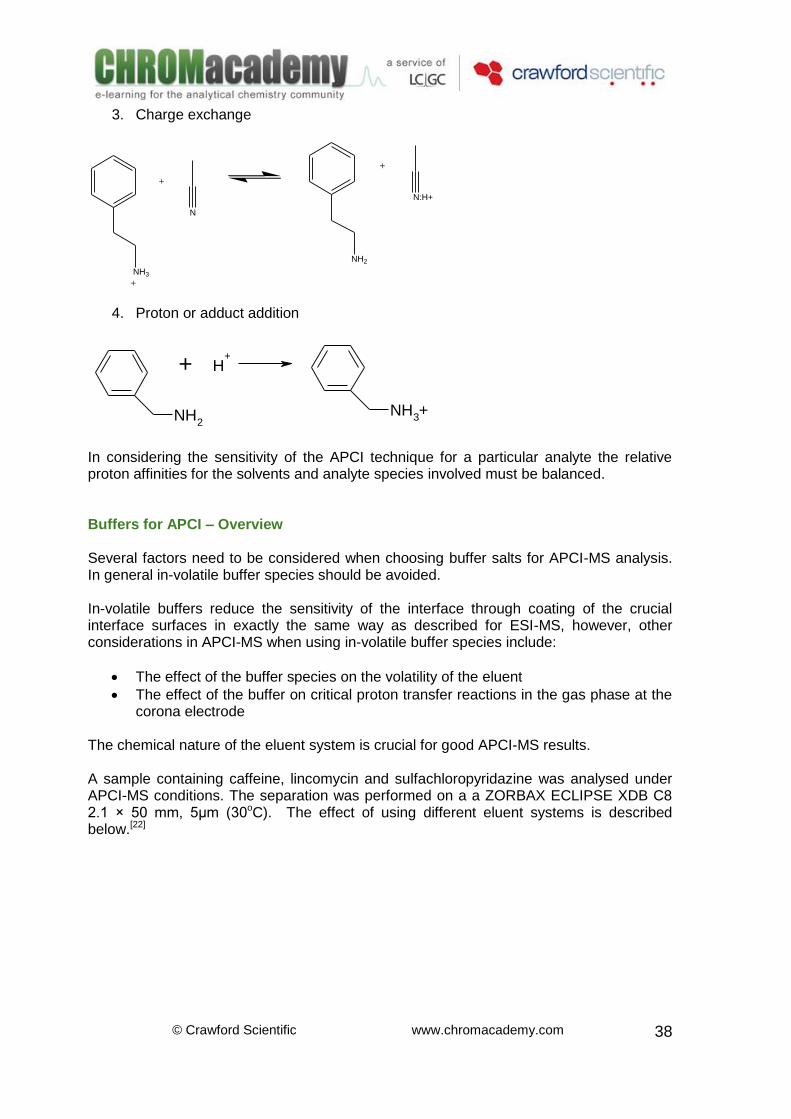
3. Charge exchange
NH3
+
+
NH2
N
+
N:H+
4. Proton or adduct addition
NH2
H+
NH3+
+
In considering the sensitivity of the APCI technique for a particular analyte the relative proton affinities for the solvents and analyte species involved must be balanced. Buffers for APCI – Overview Several factors need to be considered when choosing buffer salts for APCI-MS analysis. In general in-volatile buffer species should be avoided. In-volatile buffers reduce the sensitivity of the interface through coating of the crucial interface surfaces in exactly the same way as described for ESI-MS, however, other considerations in APCI-MS when using in-volatile buffer species include:
The effect of the buffer species on the volatility of the eluent
The effect of the buffer on critical proton transfer reactions in the gas phase at the corona electrode
The chemical nature of the eluent system is crucial for good APCI-MS results. A sample containing caffeine, lincomycin and sulfachloropyridazine was analysed under APCI-MS conditions. The separation was performed on a a ZORBAX ECLIPSE XDB C8 2.1 × 50 mm, 5μm (30oC). The effect of using different eluent systems is described below.[22]

© Crawford Scientific www.chromacademy.com
39
When sodium phosphate (50 mM) is added to the eluent system, higher molecular weight species are suppressed as the volatility of the droplet is much reduced and these species become entrained into the solid residues formed prom the phosphate species as the volatile eluent evaporates in the nebuliser tube. Buffers for APCI –Concentration Whenever possible, concentrations of buffer salts in the HPLC eluent should be kept to a minimum to avoid signal suppression via disruption of the proton transfer processes, reduced droplet or analyte volatility. The results presented below, show the effect of buffer concentration (ammonium acetate 0 – 350 mM), on signals from caffeine and reserpine.[22] At lower concentrations the ammonium acetate acts to promote the proton transfer process for reserpine, however at increasing concentrations the volatile ammonium acetate makes it increasingly more difficult to volatilise reserpine from the eluent droplet. Caffeine is a weaker base than ammonia; therefore as the concentration of buffer in the eluent is increased in the gas phase it competes strongly for the proton ions in the gas plasma around the corona electrode and suppresses the caffeine signal.
i

© Crawford Scientific www.chromacademy.com
40
Table 11. Analytes of interest.
Compound Structure High/low buffer concentration
Caffeine C8H10NO2
(194.19 Da)
N
N N
N
O
O
Low Buffer Concentration
43][ NHMNHHM
High Buffer Concentration
OHnHMMOHOH 223 )1(][
Reserpine C33H40N2O9. (608.69 Da)
O N
N
H
OO
O
O
O
O O
Low Buffer Concentration ][][][ 23 HMOAcNHMOAcNH o
High Buffer Concentration
43][ NHMNHHM
Experimental conditions Mobile phase - ammonium acetate (0-350 mM) methanol Flow rate - 0.6 mL/min. Inj. Vol. - 1 mL of reserpine (84 ng) or caffeine (125 ng) SIM Ions - 195.2 and 609.3
Drying gas - 350oC, 5L/min.
Nebuliser gas -60 psi Capillary - 4000V
Vaporiser - 400oC
i

© Crawford Scientific www.chromacademy.com
41
Ion pairing reagents in APCI When using ion-pairing reagents with LC-APCI-MS the possibility of volatility and proton transfer disruption also needs to be considered. Although it may be considered beneficial to add ion-pairing reagent to the eluent to ensure that the analyte is in a neutral form, the choice of ion-paring reagent can have profound effects on the sensitivity of the analysis, which is highly analyte specific. The results shown opposite indicate the differences obtained when using, weak and strong ion pairing reagents as well as volatile and non-volatile reagents.[9] Norepinephrine, which is the most volatile analyte, shows the most marked improvement in sensitivity. VA and PFHA assist in the ionization process by acting as strong gas phase acids and hence increase the ionization efficiency and signal obtained in positive mode APCI-MS. Erythromycin is the least volatile of the analytes and its signal is strongly suppressed by HSA, which traps the analyte in the dried droplets as it agglomerates on droplet desolvation. The ability to strongly ion pair is often detrimental to the APCI-MS signal as is seen in the case of MGBG and PFHA. The pair formed is so strongly associated that it is not disrupted and shows very low proton affinity. PFHA: CF3(CF2)5COOH –Strong ion pair/volatile HSA: CH3(CH2)5SO3H –Strong ion pair/non-volatile VA: CH3(CH2)3COOH –Weak ion pair/volatile
Ion pairing reagent effect on APCI signal response (please refer to tables 6 and 7 for more
information).
i
© Crawford Scientific www.chromacademy.com
42
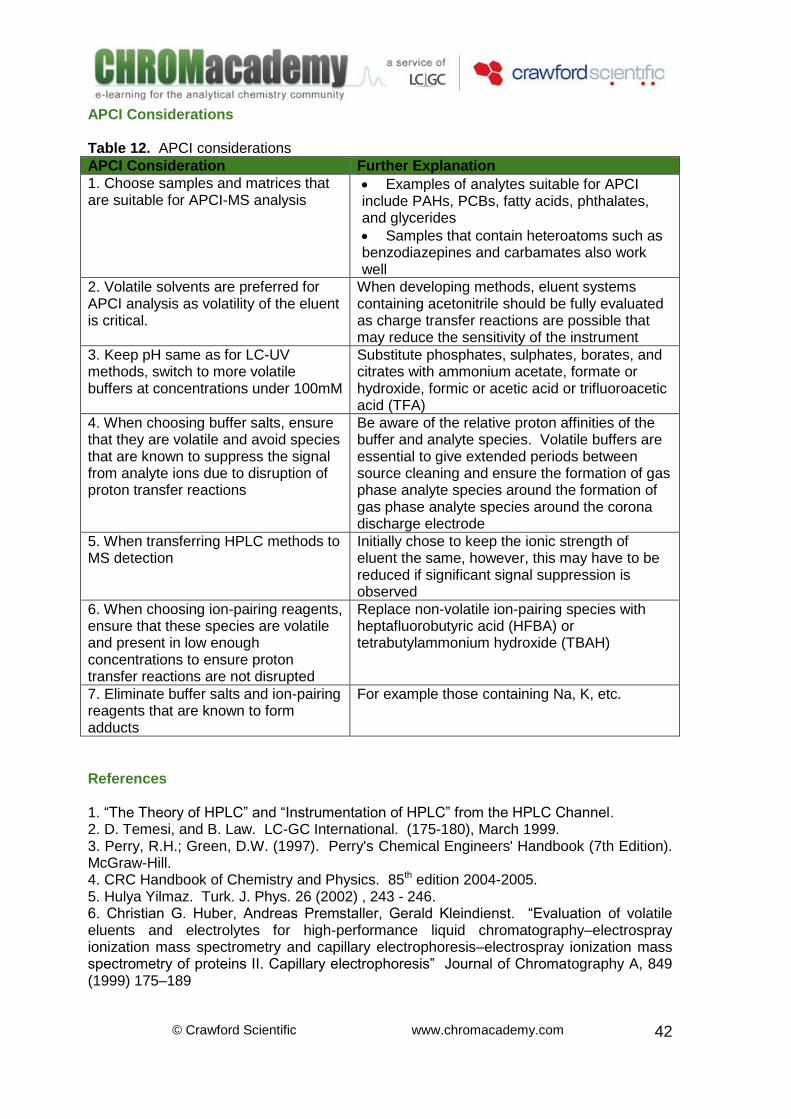
APCI Considerations Table 12. APCI considerations
APCI Consideration Further Explanation
1. Choose samples and matrices that are suitable for APCI-MS analysis
Examples of analytes suitable for APCI include PAHs, PCBs, fatty acids, phthalates, and glycerides
Samples that contain heteroatoms such as benzodiazepines and carbamates also work well
2. Volatile solvents are preferred for APCI analysis as volatility of the eluent is critical.
When developing methods, eluent systems containing acetonitrile should be fully evaluated as charge transfer reactions are possible that may reduce the sensitivity of the instrument
3. Keep pH same as for LC-UV methods, switch to more volatile buffers at concentrations under 100mM
Substitute phosphates, sulphates, borates, and citrates with ammonium acetate, formate or hydroxide, formic or acetic acid or trifluoroacetic acid (TFA)
4. When choosing buffer salts, ensure that they are volatile and avoid species that are known to suppress the signal from analyte ions due to disruption of proton transfer reactions
Be aware of the relative proton affinities of the buffer and analyte species. Volatile buffers are essential to give extended periods between source cleaning and ensure the formation of gas phase analyte species around the formation of gas phase analyte species around the corona discharge electrode
5. When transferring HPLC methods to MS detection
Initially chose to keep the ionic strength of eluent the same, however, this may have to be reduced if significant signal suppression is observed
6. When choosing ion-pairing reagents, ensure that these species are volatile and present in low enough concentrations to ensure proton transfer reactions are not disrupted
Replace non-volatile ion-pairing species with heptafluorobutyric acid (HFBA) or tetrabutylammonium hydroxide (TBAH)
7. Eliminate buffer salts and ion-pairing reagents that are known to form adducts
For example those containing Na, K, etc.
References 1. “The Theory of HPLC” and “Instrumentation of HPLC” from the HPLC Channel. 2. D. Temesi, and B. Law. LC-GC International. (175-180), March 1999. 3. Perry, R.H.; Green, D.W. (1997). Perry's Chemical Engineers' Handbook (7th Edition). McGraw-Hill. 4. CRC Handbook of Chemistry and Physics. 85th edition 2004-2005. 5. Hulya Yilmaz. Turk. J. Phys. 26 (2002) , 243 - 246. 6. Christian G. Huber, Andreas Premstaller, Gerald Kleindienst. “Evaluation of volatile eluents and electrolytes for high-performance liquid chromatography–electrospray ionization mass spectrometry and capillary electrophoresis–electrospray ionization mass spectrometry of proteins II. Capillary electrophoresis” Journal of Chromatography A, 849 (1999) 175–189
© Crawford Scientific www.chromacademy.com
43
7. R. D. Voyksner in “Electrospray Ionisation Mass spectrometry” R. B. Cole. John Wiley and Sons Int. (1997) 337. 8. Sofiya Bardin, James C. Ottinger, Alan P. Breau, Thomas J. O’Shea. “Determination of free levels of phenytoin in human plasma by liquid chromatography:tandem mass spectrometry” Journal of Pharmaceutical and Biomedical Analysis. 23 (2000) 573–579 9. Dirk Löffler, Thomas A. Ternes. “Determination of acidic pharmaceuticals, antibiotics and ivermectin in river sediment using liquid chromatography–tandem mass spectrometry” Journal of Chromatography A, 1021 (2003) 133–144 10. Alex Apffel, Steven Fischer, Gerson Goldberg, Paul C. Goodley, Frank E. Kuhlmann. “Enhanced sensitivity for peptide mapping with electrospray liquid chromatography-mass spectrometry in the presence of signal suppression due to trifluoroacetic acid-containing mobile phases” Journal of Chromatography A, 712 (1995) 177-190 11. Restek application note # 59118A. 2002 12. Michael Frank. “Agilent 1200 Series Rapid Resolution LC system and the Agilent 6210 TOF MS – Highest data content with highest throughput” Agilent technologies application note 5989-4505EN. April 2006 13. D. S. Richards, H. M. Verrier, and H. Major. “Evaluation of a Z-spray API Ion Source for High Throughput Analysis of Drugs Directly from Cell Culture Media at High Strength.” Micromas UK. Application note 233 (1998). 14. Agilent Technologies 1100 LCMSD Solution Chemistry Handbook Agilent Technologies. Palo Alto, CA, USA, 1998. 15. Anthony T. Jacksona, Susan E. Slade, James H. Scrivens. “Characterisation of poly(alkyl methacrylate)s by means of electrospray ionisation–tandem mass spectrometry (ESI–MS/MS)” International Journal of Mass Spectrometry 238 (2004) 265–277 16. Frank E. Kuhlmann, Alex Apffel, Steven M. Fisher, Gerson Goldberg, and Paul C. Goodley. “Signal Enhancement for Gradient Reverse-Phase High-Performance Liquid Chromatography –Electrospray Ionization Mass Spectrometry Analysis with Trifluoroacetic and Other Strong Acid Modifiers by Postcolumn Addition of Propionic Acid and Isopropanol” J. Am. Soc. Mass Spectrom 1995, 6, 1221-1225 17. J. T. Watson. “Introduction to Mass Spectrometry.” Chapter 9, Lippincott-Raven, PA, USA, 1997. 18. Susana Grimalt, Óscar J. Pozo, Jose M. Marín, Juan V. Sancho, and Félix Hernández. “Evaluation of Different Quantitative Approaches for the Determination of Noneasily Ionizable Molecules by Different Atmospheric Pressure Interfaces Used in Liquid Chromatography Tandem Mass Spectrometry: Abamectin as Case of Study.” J. Am. Soc Mass Spectrom. 2005, 16, 1619–1630. 19. Nicolas Fabre, Isabelle Rustan, Edmond de Hoffmann, Joëlle Quetin-Leclercq. “Determination of Flavone, Flavonol, and Flavanone Aglycones by Negative Ion Liquid Chromatography Electrospray Ion Trap Mass Spectrometry” J Am Soc Mass Spectrom. 12, (2001), 707–715. 20. Helena Keski-Hynnilä, Leena Luukkanen, Jyrki Taskinen, and Risto Kostiainen. “Mass Spectrometric and Tandem Mass Spectrometric Behavior of Nitrocatechol Glucuronides: A Comparison of Atmospheric Pressure Chemical Ionization and Electrospray Ionization” J Am Soc Mass Spectrom. 10, (1999), 537–545. 21. Mohammed E. Abdel-Hamid , Ladislav Novotny, Hoda Hamza. “Determination of diclofenac sodium, flufenamic acid, indomethacin and ketoprofen by LC-APCI-MS” Journal of Pharmaceutical and Biomedical Analysis. 24 (2001) 587–594. 22. Agilent Technologies 1100 LCMSD Solution Chemistry. Handbook, Agilent Technologies, Palo Alto, Ca, USA 1998.