Embed Size (px)
Citation preview
- -
NASA TECHNICAL NOTE NASA JN -0,8179
ww W P Y : RETURN TO
LkEl?Al?Y~ m % - ) r .w,
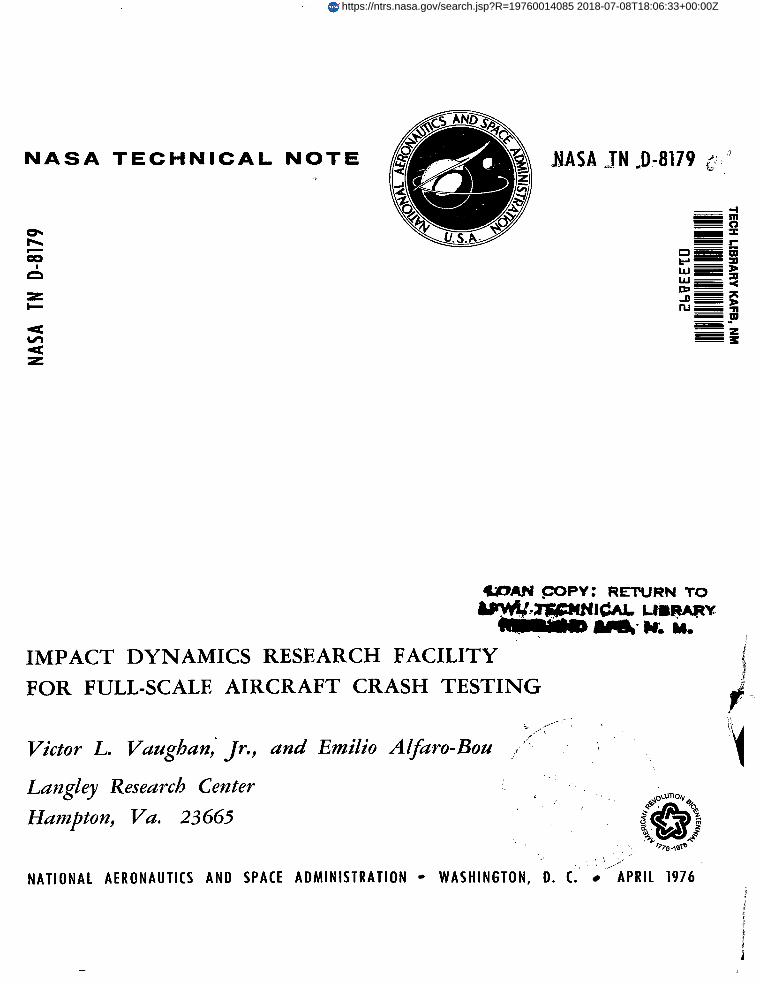
IMPACT DYNAMICS RESEARCH FACILITY FOR FULL-SCALE AIRCRAFT CRASH TESTING r"
/
- *.I.
+ .d.* . Victor L. Vazq$an,' Jr., and Emilio Alfaro-Bou < ' ' Lapzgley Research Center Hampton, Vu. 23665
N A T I O N A L AERONAUTICS A N D SPACE A D M I N I S T R A T I O N W A S H I N G T O N , D. C. APRIL 1976
I
https://ntrs.nasa.gov/search.jsp?R=19760014085 2018-07-08T18:06:33+00:00Z

- --
- -
- -
--
TECH LIBRARY KAFB, NM
I1lll1111111lllllilIIIII11111Ill111111Ill 0333892
- .- . . . . 1. Report No. 2. Government Accession NO.
NASA TN D-8179 . . I. . 4. Title and Subtitle
IMPACT DYNAMICS RESEARCH FACILITY FOR FULL-SCALE AIRCRAFT CRASH TESTING
7. Authorls)
Victor L. Vaughan, Jr., and Emilio Alfaro-Bou
9. Performing Organization Name and Address
NASA Langley Research Center Hampton, Va. 23665
. .
2. Sponsoring Agency Name and Address
National Aeronautics and Space Administration Washington, D.C. 20546
. . . . . , . .. .. . . . .
5. Supplementary Notes
-
. . . ~
3. Recipient's Catalog No.
5. Report Date
April 1976 ... ~~.
6. Performiny Organization Code
~ ~8. Performing Organization Report No.
L- 10514 .-. ~ 10. Work Unit No.
505-02-13-01 . . .~
11. Contract or Grant No.
-13. Type of Report and Period Covered
Technical Note . . ~14. Sponsoring Agency Code
- .. . . _ ._ - . . . . .... . . . .. ..~
6. Abstract
An impact dynamics r e sea rch facility (IDRF) has been developed to crash test full-scale general aviation aircraf t under free-flight tes t conditions. The aircraf t a r e crashed into the impact surface as f ree bodies; a pendulum swing method is used to obtain desired flight paths and velocities. Flight paths up to -600 and aircraf t velocities along the flight paths up to about 27.0 m/s can be obtained with a combination of swing-cable lengths and release heights made available by a large gantry.
Seven twin engine, 2721-kg aircraf t have been successfully crash tested at the facility, and all systems functioned properly. Acquisition of data from signals generated by accelerometers on board the aircraf t and from external and onboard camera coverage has been successful in spite of the amount of damage which occurred during each crash.
Test parameters a t the IDRF a r e controllable with flight-path angles accurate within 8 percent, a i rcraf t velocity accurate within 6 percent, pitch angles accurate to 4.25O) and roll and yaw angles acceptable under wind velocities up to 4.5 m/s.
~~ - , 7 Key-Words (Suggested by Author(s1) 18. Distribution Statement
Crashworthy Unclassified - Unlimited Crash simulation testing General aviation aircraf t
Subject Category 03 ~.
19. Security Classif. (of this report1 I 20. Security Classif. (of this page) 21. No. of Pages 22. Price'
Unclassified Unclassified 56 $4.25 ~~ ~-

CONTENTS
SUMMARY . . . . . . . . . . . . . . . . . . . . . . . . . . . . . . . . . . . . . . . . . 1
INTRODUCTION . . . . . . . . . . . . . . . . . . . . . . . . . . . . . . . . . . . . . . 1
SYMBOLS . . . . . . . . . . . . . . . . . . . . . . . . . . . . . . . . . . . . . . . . . 2
FULL-SCALE AIRCRAFT CRASH-TEST TECHNIQUE . . . . . . . . . . . . . . . . . . 2
FACILITY AND ASSOCIATED SYSTEMS . . . . . . . . . . . . . . . . . . . . . . . . . 3 Gantry Structure . . . . . . . . . . . . . . . . . . . . . . . . . . . . . . . . . . . . 3 Major Features . . . . . . . . . . . . . . . . . . . . . . . . . . . . . . . . . . . . . 3 Aircraft Suspension System . . . . . . . . . . . . . . . . . . . . . . . . . . . . . . . 4 Aircraft Release and Separation Systems . . . . . . . . . . . . . . . . . . . . . . . 5 Control Room . . . . . . . . . . . . . . . . . . . . . . . . . . . . . . . . . . . . . . 6
DATA-ACQUISITION SYSTEMS . . . . . . . . . . . . . . . . . . . . . . . . . . . . . . 6
Instrumentation and Recording System . . . . . . . . . . . . . . . . . . . . . . . . . 7 Photographic Coverage . . . . . . . . . . . . . . . . . . . . . . . . . . . . . . . . . 7
AIRCRAFT CRASH-TEST SPECIMEN . . . . . . . . . . . . . . . . . . . . . . . . . . 8
TEST OPERATIONS . . . . . . . . . . . . . . . . . . . . . . . . . . . . . . . . . . . . 9 Aircraft-Facility Integration . . . . . . . . . . . . . . . . . . . . . . . . . . . . . . 9 Aircraft Crash-Test Operations . . . . . . . . . . . . . . . . . . . . . . . . . . . . 10
FACILITY AND SYSTEM PERFORMANCE . . . . . . . . . . . . . . . . . . . . . . . . 11
Typical Aircraft Crash Test . . . . . . . . . . . . . . . . . . . . . . . . . . . . . . 11 Typical Crash-Test Data . . . . . . . . . . . . . . . . . . . . . . . . . . . . . . . . 12 Facility Performance Results . . . . . . . . . . . . . . . . . . . . . . . . . . . . . 12
CONCLUDING REMARKS . . . . . . . . . . . . . . . . . . . . . . . . . . . . . . . . . 14
TABLE . . . . . . . . . . . . . . . . . . . . . . . . . . . . . . . . . . . . . . . . . . . 15
FIGURES . . . . . . . . . . . . . . . . . . . . . . . . . . . . . . . . . . . . . . . . . 16
APPENDIX A - DEFINITIONS AND EQUATIONS FOR AIRCRAFT CRASH-TEST GEOMETRY AND PERFORMANCE ANALYSIS O F THE IMPACT DYNAMICS RESEARCH FACILITY . . . . . . . . . . . . . . . . . . . . . . . . . . . . . . . . . 39
APPENDIX B - TEST OPERATIONS - PHASE ONE . . . . . . . . . . . . . . . . . . 53
iii
IMPACT DYNAMICS RESEARCH FACILITY FOR
FULL-SCALE AIRCRAFT CRASH TESTING
Victor L. Vaughan, Jr., and Emilio Alfaro-Bou Langley Research Center
SUMMARY
An impact dynamics research facility (IDRF) has been developed to crash test full-scale general aviation aircraf t under free-flight tes t conditions. The aircraf t are crashed into the impact surface as free bodies; a pendulum swing method is used to obtain desired flight paths and velocities. Flight paths up to -60° and aircraf t velocities along the flight paths up to about 27.0 m/s can be obtained with a combination of swing-cable lengths and release heights made available by a large gantry.
Seven twin engine, 2721-kg aircraf t have been successfully crash tested at the facility, and all systems functioned properly. Acquisition of data from signals generated by accelerometers on board the a i rc raf t and from external and onboard camera coverage has been successful in spite of the amount of damage which occurred during each crash.
Test parameters at the IDRF a r e controllable with flight-path angles accurate within 8 percent, a i rcraf t velocity accurate within 6 percent, pitch angles accurate to 4.25O, and roll and yaw angles acceptable under wind velocities up to 4.5 m/s.
INTRODUCTION
The Langley Research Center has recently converted the lunar landing research facility into an impact dynamics research facility (IDRF) for investigating structural crash effects on general aviation type aircraft . A unique feature of this facility is the ability to crash test full-scale a i rcraf t under free-flight conditions and, at the same time, to control the impact attitude and velocity of the aircraft . Full-scale a i rcraf t crash simulation tes t s have been conducted to obtain definitive data on the structural response of aircraft and on the loads transmitted to the occupants during a crash impact. These data can be used for correlation with resul ts of analytical predictive methods. Full-scale a i rcraf t crash tes ts can also be used to evaluate crashworthy design concepts both for the aircraf t structure and for seat and restraint systems.
This report describes the IDRF, i t s operation, and the measure of performance of the facility and associated systems.

SYMBOLS
free-flight t ime, seconds
umbilical separation time (elapsed time between swing-cable separation and umbilical separation), seconds
velocity of a i rcraf t along flight path at impact, nieters/second
horizontal velocity of a i rcraf t at impact, nieters/second
vertical velocity (sink speed) of a i rcraf t at impact, meters/second
coordinate axes
angle of attack of a i rcraf t at impact, degrees
flight-path angle of a i rcraf t at impact, degrees
pitch angle of a i rcraf t at impact, degrees
pitch angle e r r o r of a i rcraf t due to catenary effects, degrees
roll angle of a i rcraf t at impact, degrees
yaw angle of a i rcraf t at impact, degrees
FULL-SCALE AIRCRAFT CRASH-TEST TECHNIQUE
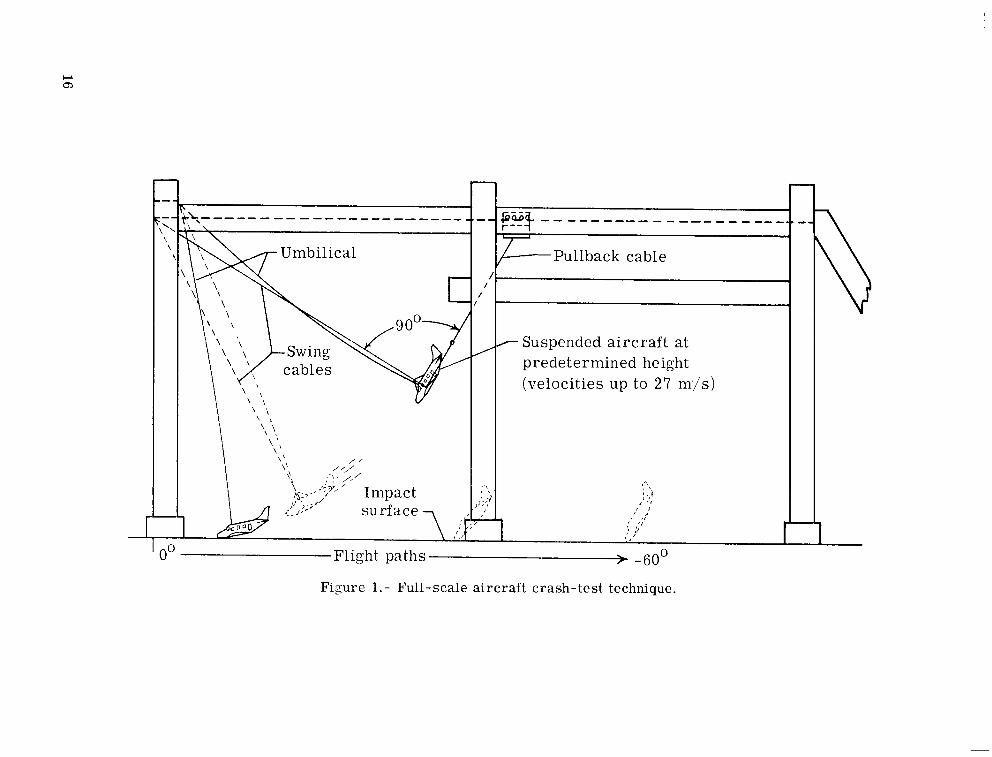
The test technique used to crash full-scale a i rcraf t is shown schematically in figure 1. The aircraf t , suspended by two swing cables, is drawn back above the impact su r face to a predetermined height by a pullback cable. The test sequence is initiated when the aircraf t is released from the pullback cable. The aircraf t swings pendulum style into the impact surface. The swing cables a r e pyrotechnically separated from the aircraf t a short distance above the impact surface, freeing the aircraf t from restraint during the crash impact. The umbilical (fig. I) remains attached during the impact for data acquisition and is pyrotechnically separated at a predetermined time after swing-cable separation.
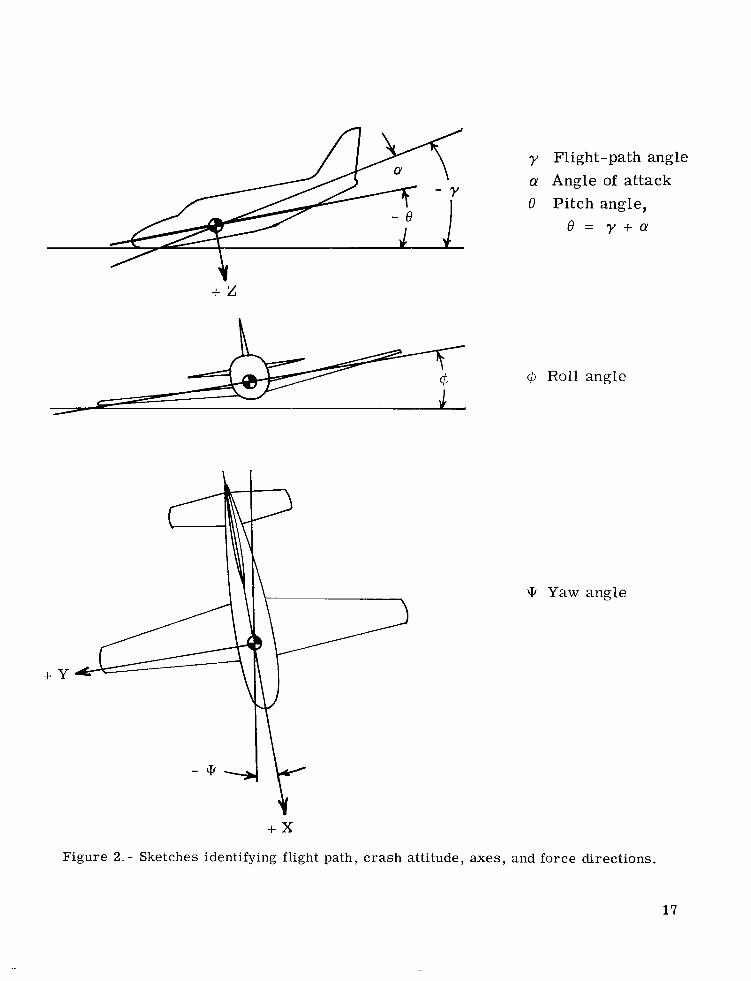
In figure 2 , the flight-path and attitude angles of the aircraf t at impact a r e identified together with the axes and force directions. The flight-path angle, which can be adjusted
2
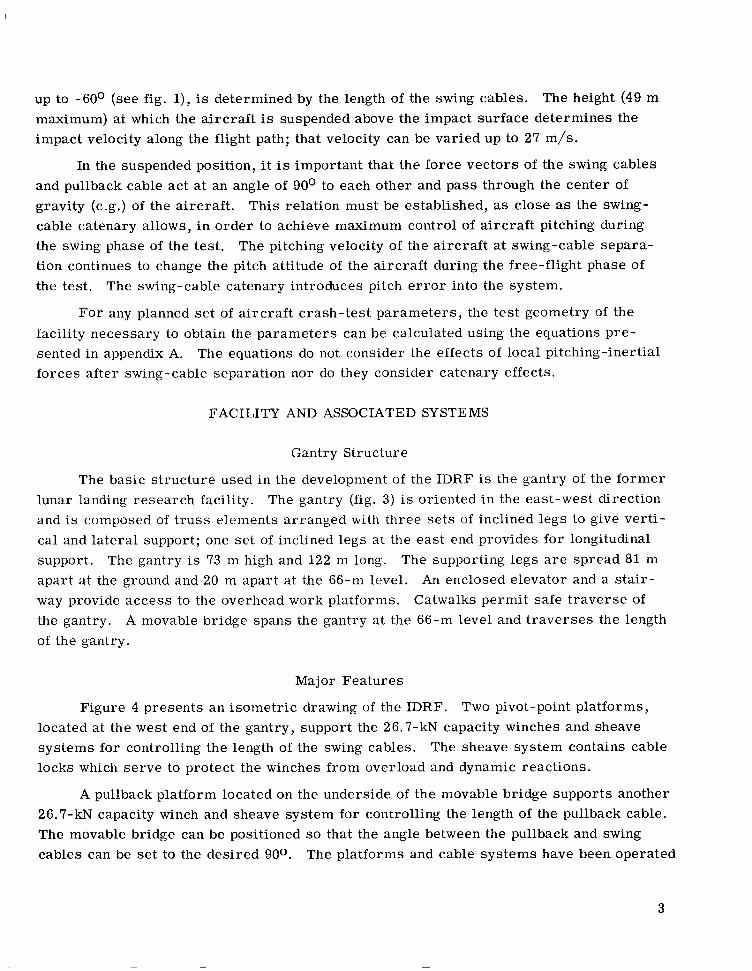
up to -60° (see fig. l),is determined by the length of the swing cables. The height (49 m maximum) at which the aircraf t is suspended above the impact surface determines the impact velocity along the flight path; that velocity can be varied up to 27 m/s.
In the suspended position, i t is important that the force vectors of the swing cables and pullback cable act at an angle of 90° to each other and pass through the center of gravity (c.g.) of the aircraft . This relation must be established, as close as the swing-cable catenary allows, in order to achieve maximum control of a i rcraf t pitching during the swing phase of the test. The pitching velocity of the aircraf t a t swing-cable separation continues to change the pitch attitude of the aircraf t during the free-flight phase of the test. The swing-cable catenary introduces pitch e r r o r into the system.
For any planned se t of a i rcraf t crash-test parameters , the test geometry of the facility necessary to obtain the parameters can be calculated using the equations presented in appendix A. The equations do not consider the effects of local pitching-inertial forces after swing-cable separation nor do they consider catenary effects.
FACILITY AND ASSOCIATED SYSTEMS
Gantry Structure
The basic structure used in the development of the IDRF is the gantry of the former lunar landing research facility. The gantry (fig. 3) is oriented in the east-west direction and is composed of t russ elements arranged with three se t s of inclined legs to give vertical and lateral support; one se t of inclined legs at the east end provides for longitudinal support. The supporting legs a r e spread 81 mThe gantry is 73 m high and 122 m long. apart at the ground and 20 m apart at the 66-m level. An enclosed elevator and a s ta i r way provide access to the overhead work platforms. Catwalks permit safe t raverse of the gantry. A movable bridge spans the gantry at the 66-m level and t raverses the length of the gantry.
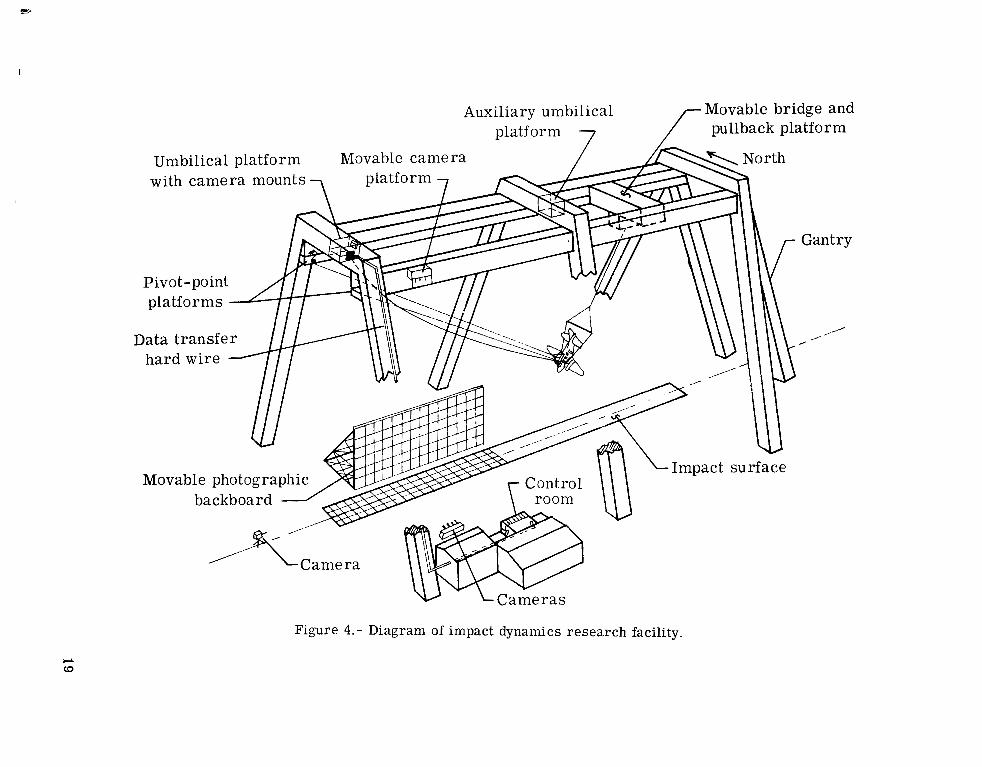
Major Features
Figure 4 presents an isometric drawing of the IDRF. Two pivot-point platforms, located at the west end of the gantry, support the 26.7-kN capacity winches and sheave systems for controlling the length of the swing cables. The sheave system contains cable locks which serve to protect the winches from overload and dynamic reactions.
A pullback platform located on the underside of the movable bridge supports another 26.7-k.N capacity winch and sheave system for controlling the length of the pullback cable. The movable bridge can be positioned so that the angle between the pullback and swing cables can be se t to the desired 900. The platforms and cable systems have been operated
3

with aircraft of a nominal gross m a s s of 2721 kg and a dynamic swing load of 2g. However, with modified cable arrangements (block and tackle type) for reducing the forces on the winches, the systems can be used to c rash test a i rcraf t up to 14 000 kg gross mass .
The gantry structure contains two umbilical platforms (fig. 4), one on the west bent and one on the center bent of the gantry. Each platform contains an umbilical storage box, an umbilical winch for controlling the length of the umbilical cable, camera mounts, and an instrumentation junction box. The junction box is hard wired to another junction box in the control room.
The impact surface is a 121-m-long, 9.0-m-wide, s t r ip of reinforced concrete with 0.2-m thickness. A 1.0-m-square grid is painted on the concrete surface for use as a photographic background for cameras mounted a t the top of the gantry. Adjacent to the impact surface is a 30-m-long by 12-m-high photographic backboard with a 1.0-m-square grid for ground camera reference. The backboard is mounted on ra i l s to accommodate a crash tes t a t any position along the impact surface.
Aircraft Suspension System
The swing cables and pullback cable connect to the aircraf t swing and pullback harnesses which make up the aircraf t suspension system as illustrated in figure 5. The har nesses a r e designed specifically for the aircraf t configuration being tested.
The swing harness consists of two swing-cable extensions and two se t s of pitch cables. The swing-cable extensions attach to hard points mounted to the main spar of the aircraf t wing. The pitch cables a r e attached to the swing-cable rings located a t the upper end of the swing-cable extensions and to hard points in the fuselage fore and aft of the aircraf t center of gravity.
The pullback harness consists of two cables which connect to the pullback cable and to the hard points mounted to the main spar of the aircraf t wing. A spreader bar separa t e s the two harness cables aft of the fuselage. Thus, the ai rcraf t stabil izers can pass between the cables, and the bar c lears the fin as the pullback cable r i s e s above the empennage during the lift of the aircraft .
The swing-cable extensions and pullback harness cables attach to the same hard points. These hard points a r e located so that a line drawn between them passes directly through the center of gravity of the aircraft . Therefore, the force vectors of both the swing and pullback cables pass through the center of gravity of the aircraf t and the aircraft is free to pitch around i t s own center of gravity. The two se ts of pitch cables res t ra in the aircraf t in the planned angle of attack during the preparation and swing phases of the tes t sequence. When the aircraf t is in the pullback release position, the forward pitch cable must also support a load imposed by a moment around the aircraf t center of
4

gravity as a result of the umbilical attachment. A 0.76-cm steel support cable is sandwiched into the umbilical wires to car ry loads and to protect the data wires from damage caused by unintentional induced tensile loads. This cable passes through the top of the fuselage and the end attaches to the main spar of the wing near the aircraf t center of gravity. The data wires are connected to receptacles mounted on top of the fuselage 1.1 m above the center of gravity of the aircraft . The mass of the umbilical acting at this connection creates a pitching moment around the aircraf t center of gravity. This umbilical cable load and accompanying moment var ies with drag on the umbilical and is not compensated for during the swing phase of the crash test.
The aircraf t attitude is adjusted by changing the length of the cables in the suspension system. Adjustments up to about 30° can be made in angle of attack and roll angle. Only small adjustments can be made in yaw angle because of the small clearance between the pullback harness and empennage of the aircraft . Additional yaw can be added by removing the stabil izers and simulating them with concentrated masses.
Aircraft Release and Separation Systems
The pullback release system and the swing and umbilical separation systems are shown in figure 6. The sequence of pyrotechnic events during the test a r e : (1) the aircraft is pyrotechnically released from the pullback harness and the aircraf t begins to swing; (2) the swing harness pyrotechnically separates from the aircraf t at a predetermined height above the impact surface; and (3) the umbilical cable pyrotechnically separa t e s from the aircraf t during skid after impact.
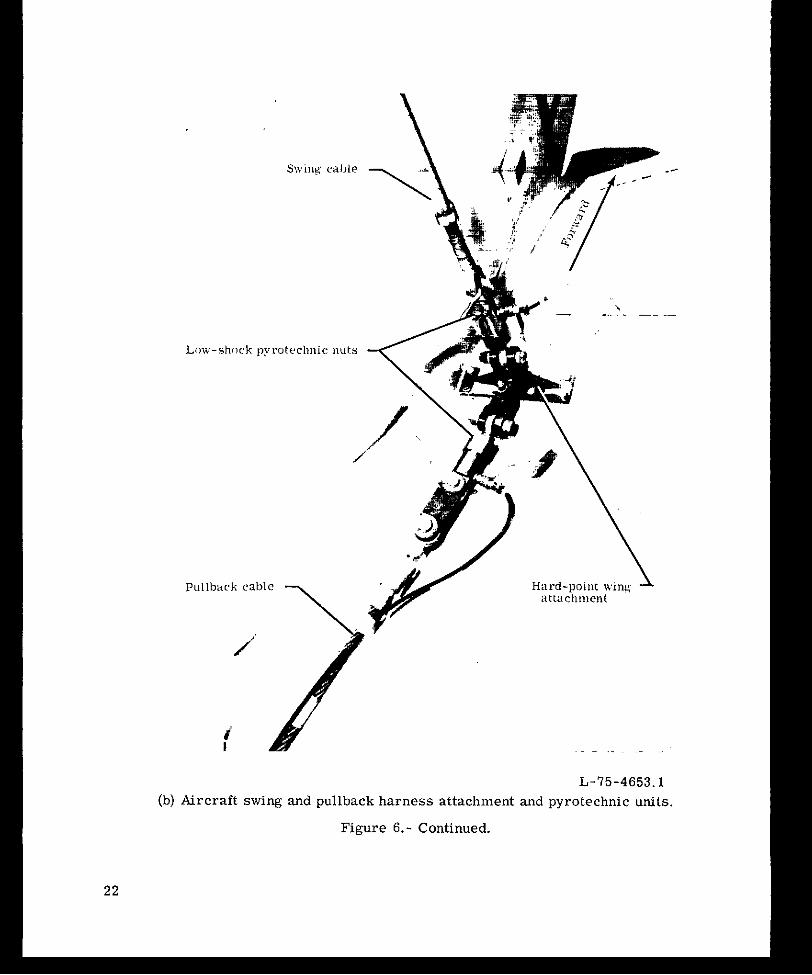
The ends of the pullback harness cables attach to the hard points on the wings of the aircraf t with low-shock pyrotechnic nuts. (See fig. 6(b).) The attachments are selfalining to eliminate side loads on the nuts. Power to fire the pyrotechnic nuts is transmitted from a power supply in the control room; the power runs through a key-lock switch to the top of the gantry and down a flexible power cable suspended from the gantry, t e r minating a t the pyrotechnic nuts.
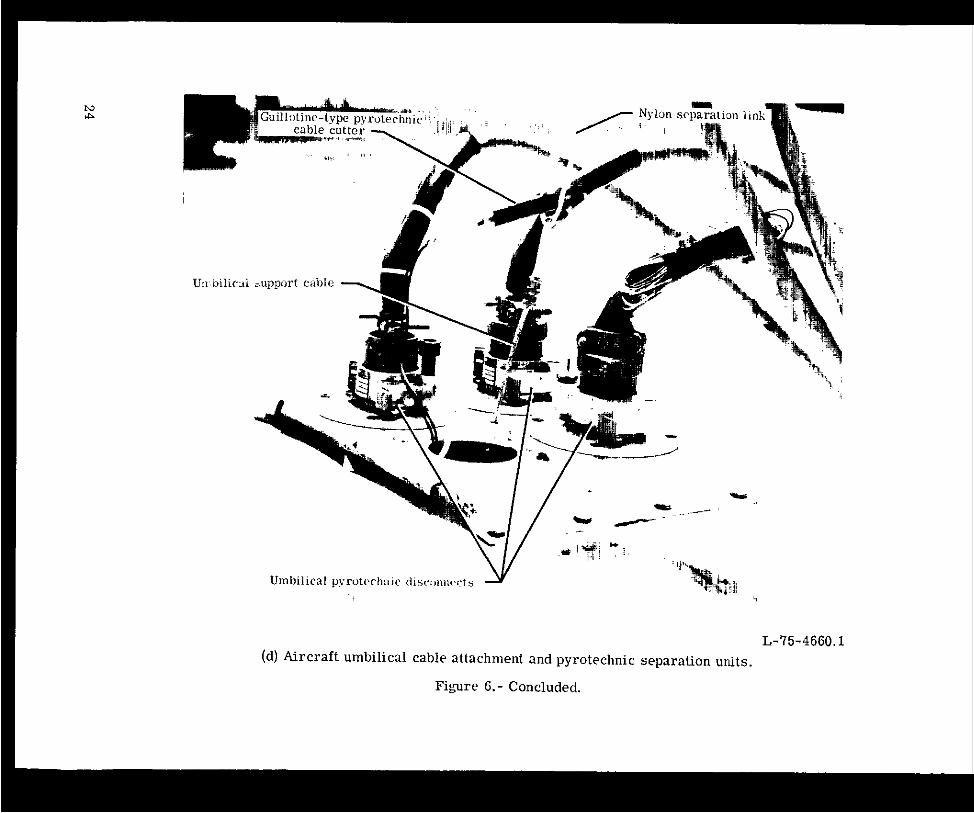
The swing and umbilical separation systems a r e independent of the pullback release system. The ends of the swing-cable extensions attach to hard points on the wing of the aircraf t with low-shock pyrotechnic nuts, in a manner s imilar to those used for attaching the pullback harness cables. (See fig. 6(b).) The pitch cables contain guillotine-type pyrotechnic cable cutters a t the surface of the fuselage. (See fig. 6(c).) The umbilical wires terminate in several 55-pin connectors mounted a t the top of the fuselage in pyrotechnic-mechanical disconnect assemblies (fig. 6(d)). The s teel support cable that ca r r i e s the tensile loads imposed on the umbilical contains a nylon separation link and guillotine-type pyrotechnic cable cutter.
5
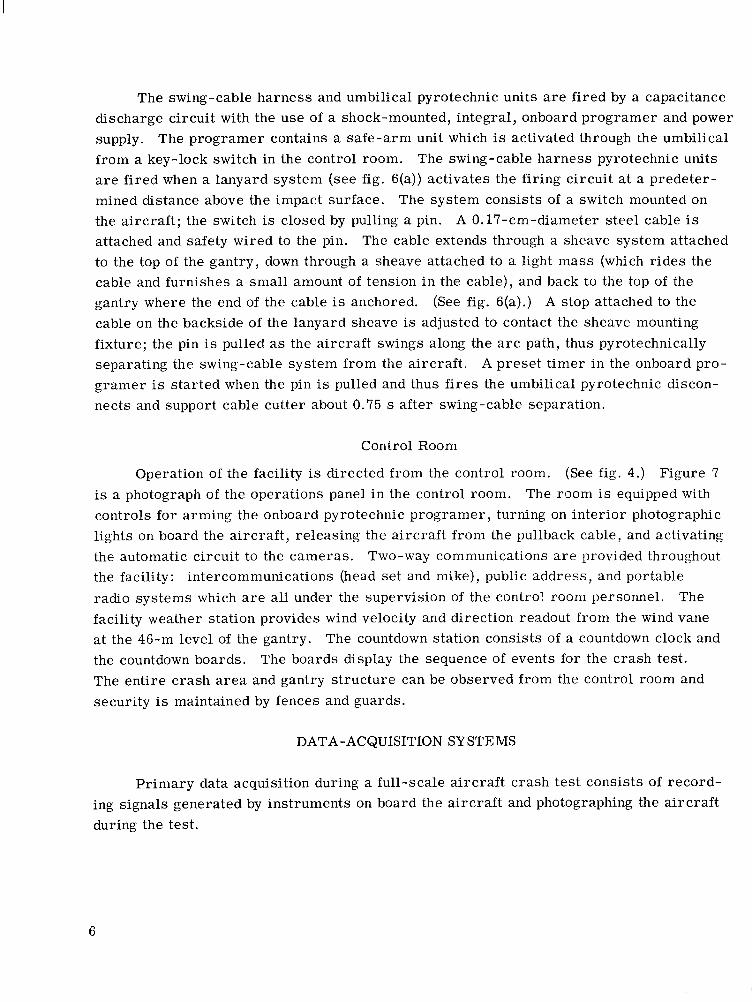
The swing-cable harness and umbilical pyrotechnic units a r e fired by a capacitance discharge circuit with the use of a shock-mounted, integral, onboard programer and power
supply. The programer contains a safe-arm unit which is activated through the umbilical f rom a key-lock switch in the control room. The swing-cable harness pyrotechnic units a r e f i red when a lanyard system (see fig. 6(a)) activates the firing circuit at a predetermined distance above the impact surface. The system consists of a switch mounted on the aircraf t ; the switch is closed by pulling a pin. A 0.17-cm-diameter s teel cable is attached and safety wired to the pin. The cable extends through a sheave system attached to the top of the gantry, down through a sheave attached to a light mass (which r ides the cable and furnishes a small amount of tension in the cable), and back to the top of the gantry where the end of the cable is anchored. (See fig. 6(a).) A stop attached to the cable on the backside of the lanyard sheave is adjusted to contact the sheave mounting fixture; the pin is pulled as the aircraf t swings along the a r c path, thus pyrotechnically separating the swing-cable system from the aircraf t . A preset t imer in the onboard programer is started when the pin is pulled and thus fires the umbilical pyrotechnic disconnects and support cable cutter about 0.75 s after swing-cable separation.
Control Room
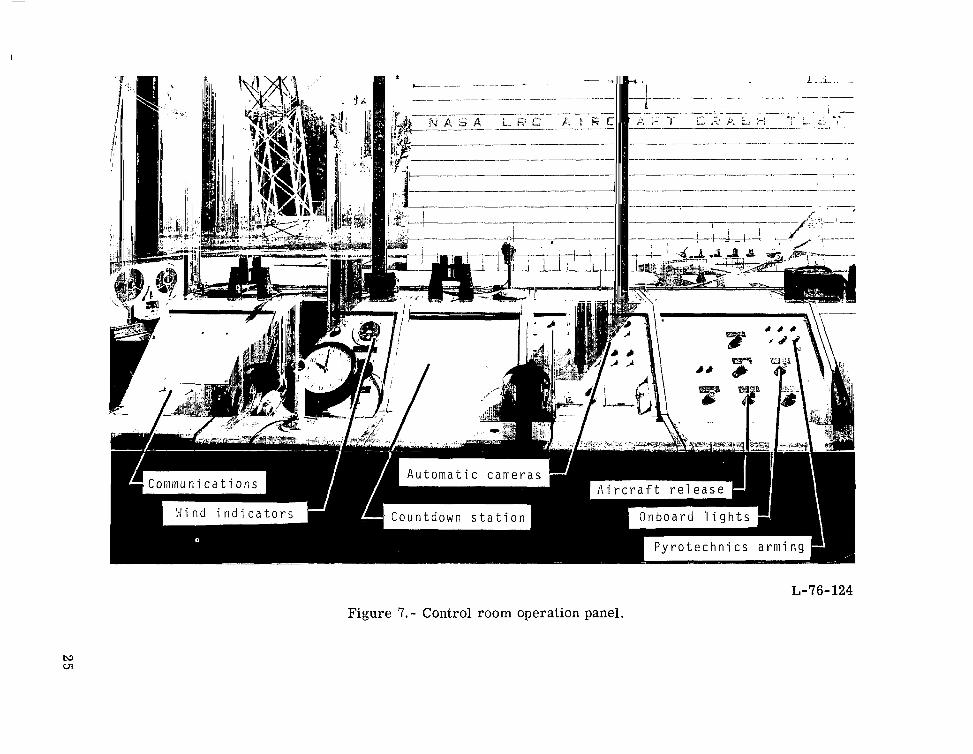
Operation of the facility is directed from the control room. (See fig. 4.) Figure 7 is a photograph of the operations panel in the control room. The room is equipped with controls for arming the onboard pyrotechnic programer , turning on interior photographic lights on board the aircraf t , releasing the aircraf t from the pullback cable, and activating the automatic circuit to the cameras . Two-way communications a r e provided throughout the facility: intercommunications (head set and mike), public ad.dress, and portable radio systems which a r e all under the supervision of the control room personnel. The facility weather station provides wind velocity and direction readout from the wind vane a t the 46-m level of the gantry. The countdown station consists of a countdown clock and the countdown boards. The boards display the sequence of events for the crash test. The entire crash a r e a and gantry structure can be observed from the control room and security is maintained by fences and guards.
DATA-ACQUISITION SYSTEMS
Pr imary data acquisition during a full-scale a i rcraf t crash tes t consists of recording signals generated by instruments on board the aircraf t and photographing the a i rc raf t during the test.
6

Instrumentation and Recording System
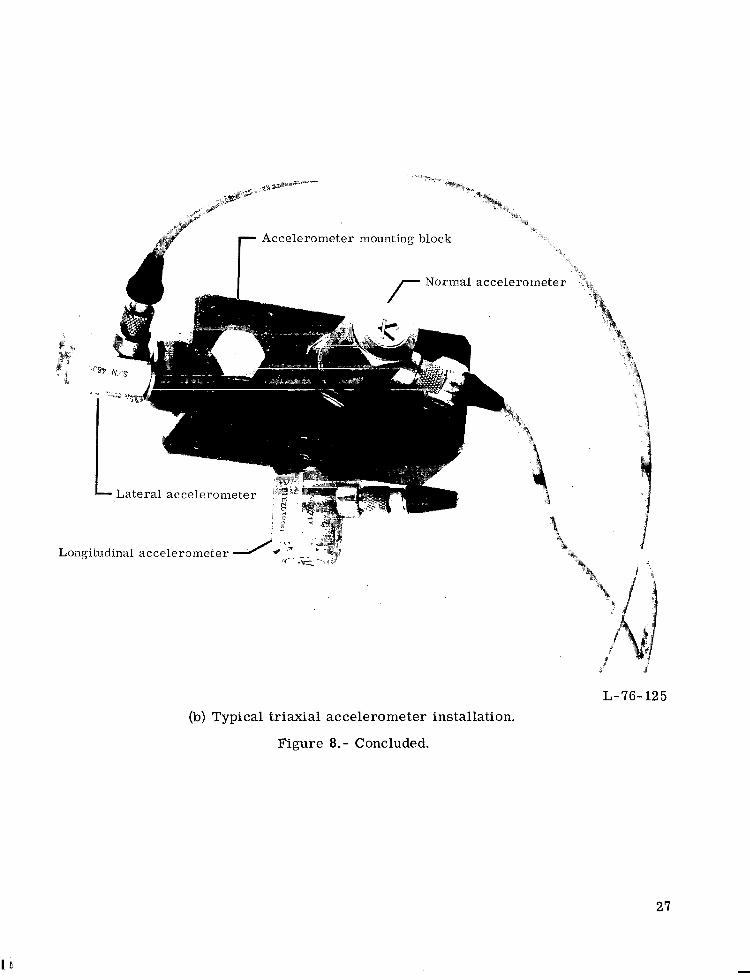
The onboard instrumentation may consist of accelerometers (both piezoelectric and strain-gage type), s t ra in gages, load cells, and extensometers. The pr imary data-signal generating instruments are the accelerometers. Figure 8(a) presents a typical accelerometer layout for an aircraft . The circles in the plan view of the aircraf t and the vertical diamonds in the elevation view of the aircraf t measure accelerations normal to the aircraft horizontal plane. The diamonds oriented parallel to the aircraf t longitudinal axis measure accelerations in the longitudinal direction and the filled diamonds measure accelerations in the la teral direction. Figure 8(b) presents a typical triaxial accelerometer installation.
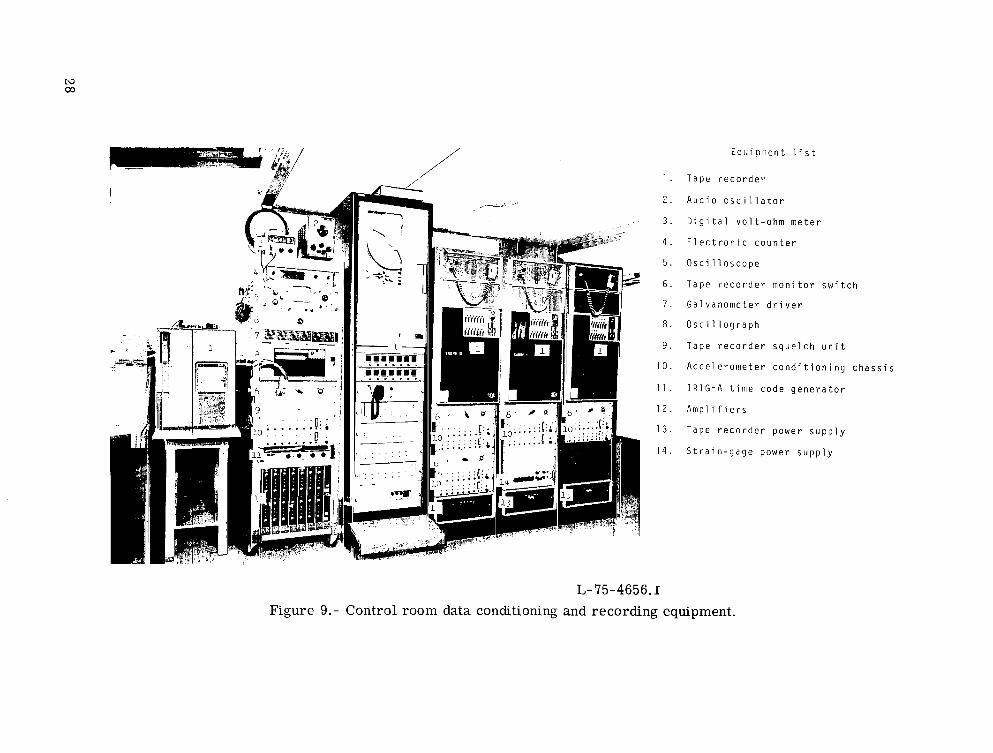
Data signals from the a i rc raf t instrumentation are transmitted by the umbilical cable to the 100-channel junction box on the appropriate umbilical platform a t the top of the gantry. (See figs. 1 and 4.) Hard wire connects the junction box to a s imilar junction box in the control room, and thus gives the facility a data transmission capability of 100 channels. The data-acquisition equipment in the control room is identified in figure 9. The equipment consists of five F M tape recorders , each capable of recording 14 channels of data, and associated data-conditioning equipment. One channel on each recorder is used to record the time code from an IRIG-A time code generator. The data on each recorder can be identified and correlated with respect to time increment. One channel is used to record the signal from a Doppler radar unit used to measure the horizontal velocity of the aircraf t a t surface contact (impact).
Photographic Coverage
Photographic coverage of the exterior of the aircraf t during a crash tes t is provided by cameras on the ground and at the top of the gantiy. (See fig. 4.) Each of the two umbilical platforms located on the gantry contains mounts for two cameras which view the center of the crash a rea from overhead. A movable camera platform capable of handling three cameras is located on the south side of the gantry structure and can be positioned along the gantry so that the cameras can film the c rash a rea from overhead at a slightly skewed angle to the impact surface. One of the cameras located on the movable platform is used to measure the yaw angle of the aircraf t a t impact and can be used to determine the approximate horizontal velocity of the aircraft . There is camera coverage from the ground on each side and in front of the c rash area. There are provisions for four fixed cameras and four scanning cameras on a portable platform at ground level; this platform can be positioned to permit filming of the crash area at right angles to the impact surface center line. The scanning cameras scan the entire tes t from pullback cable re lease until the a i rcraf t comes to a full stop. One of the fixed cameras is used to determine the pitch angle of the aircraf t a t impact, the flight-path angle, and the
7
velocity along the flight path. There are provisions for two additional cameras at ground level along the impact surface center line at a distance of about 61 m from the west end of the gantry structure. These cameras look directly into the front of the aircraf t and are used to determine the roll angle of the aircraft. There is a single camera located behind the photographic backboard with i t s lens protruding through a hole i n the board. This camera fi lms the crash area at right angles to the impact surface center line.
With the exception of the scanning cameras , all cameras a r e activated from the control room by an energizing circuit which is controlled from the pullback cable re lease circuit. The scanning cameras a r e the only ones which are operated manually and a r e manned during a test. All cameras receive either IRIG-A t ime code or standard 60-cycle timing which is used to correlate the film data with the recorded data. Three 70-mm motion-picture cameras and two TV cameras a r e available. All other cameras use 16-mm film. Film speeds of 8 to 8000 pictures per second (pps) are available, but the most common speeds used are 20, 24, 400, and 2000 pps.
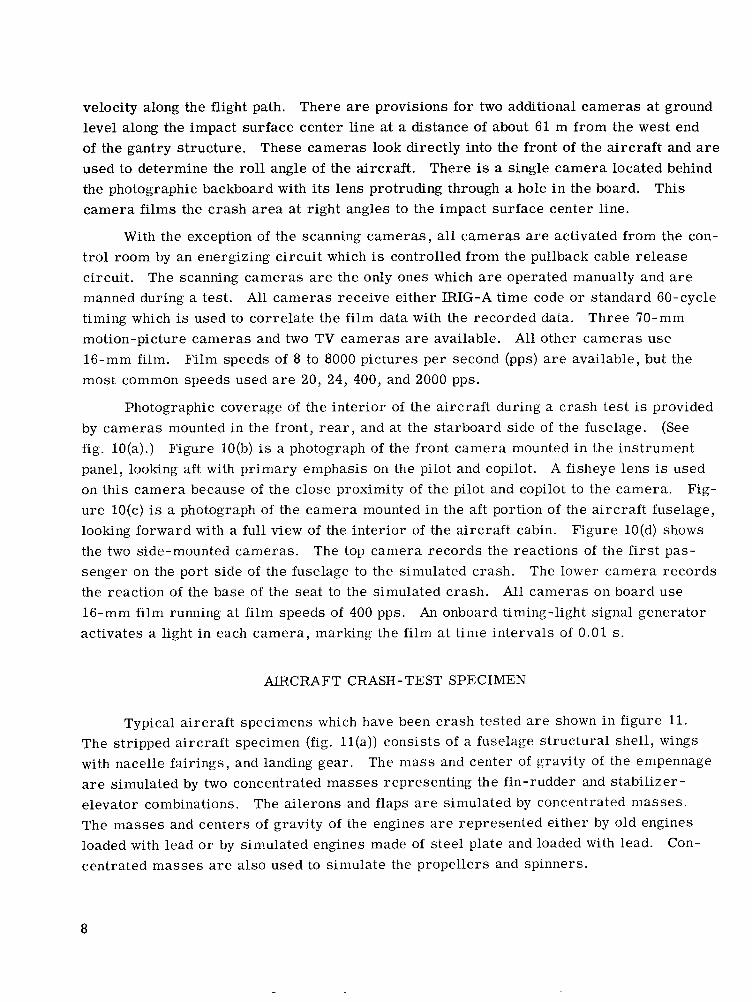
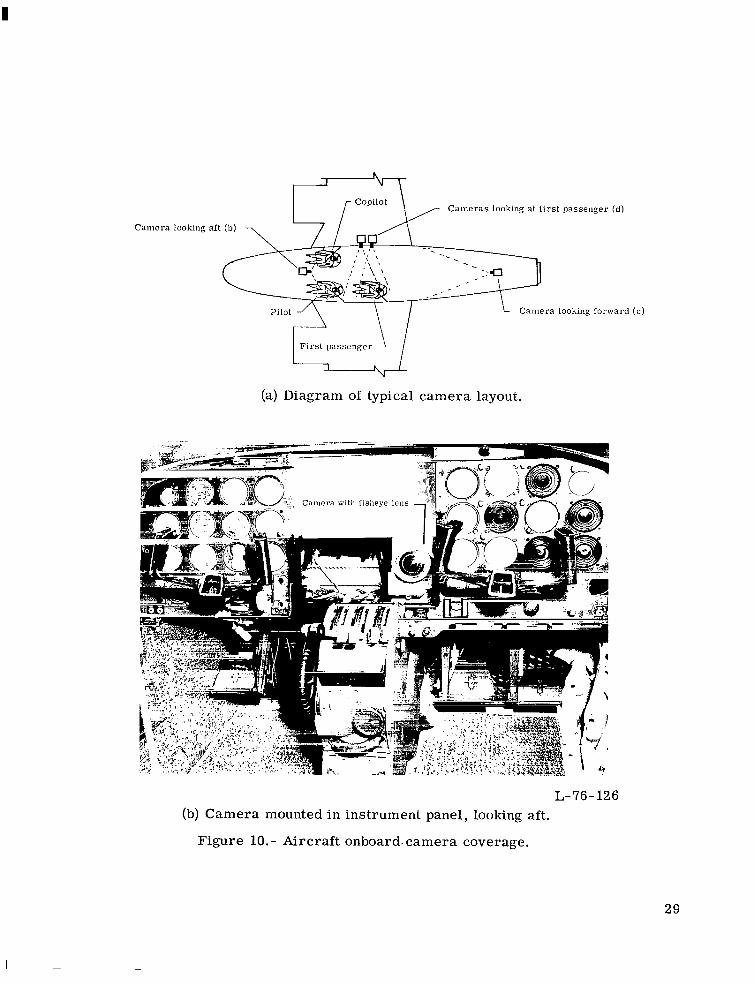
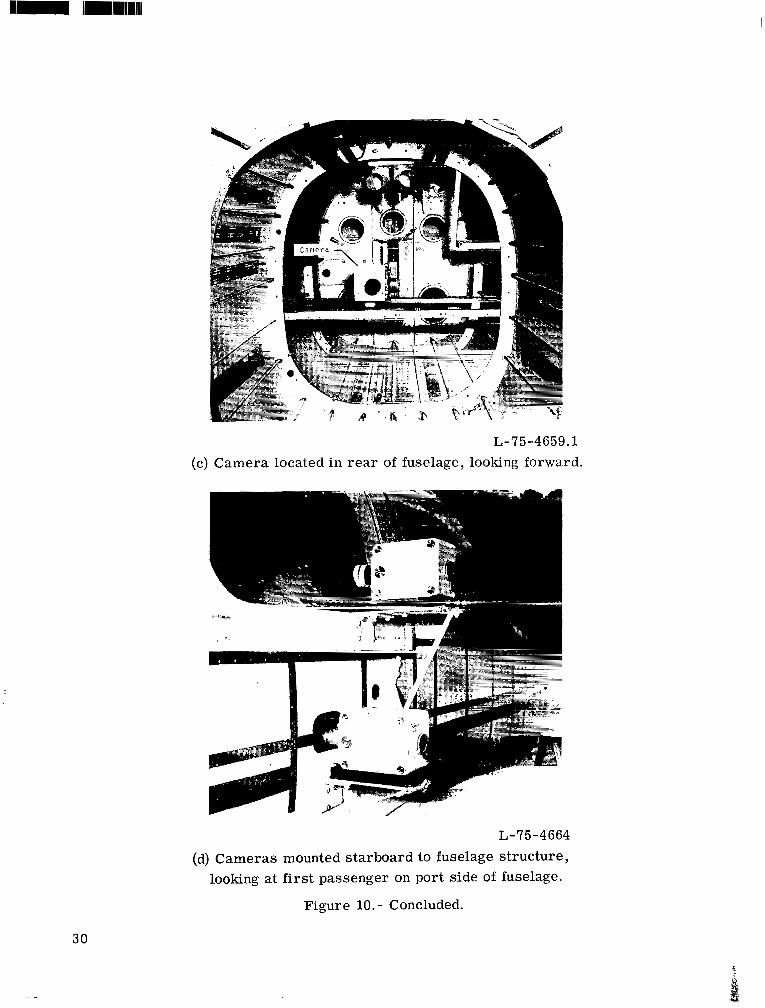
Photographic coverage of the interior of the aircraf t during a crash tes t is provided by cameras mounted in the front, r e a r , and at the starboard side of the fuselage. (See fig. lO(a).) Figure 10(b) is a photograph of the front camera mounted in the instrument panel, looking aft with primary emphasis on the pilot and copilot. A fisheye lens is used on this camera because of the close proximity of the pilot and copilot to the camera. Figure 1O(c) is a photograph of the camera mounted in the aft portion of the aircraf t fuselage, looking forward with a full view of the interior of the aircraf t cabin. Figure 10(d) shows the two side-mounted cameras . The top camera records the reactions of the f i r s t passenger on the port side of the fuselage to the simulated crash. The lower camera records the reaction of the base of the seat to the simulated crash. All cameras on board use 16-mm film running a t film speeds of 400 pps. An onboard timing-light signal generator activates a light in each camera, marking the film a t time intervals of 0.01 s.
AIRCRAFT CRASH-TEST SPECIMEN
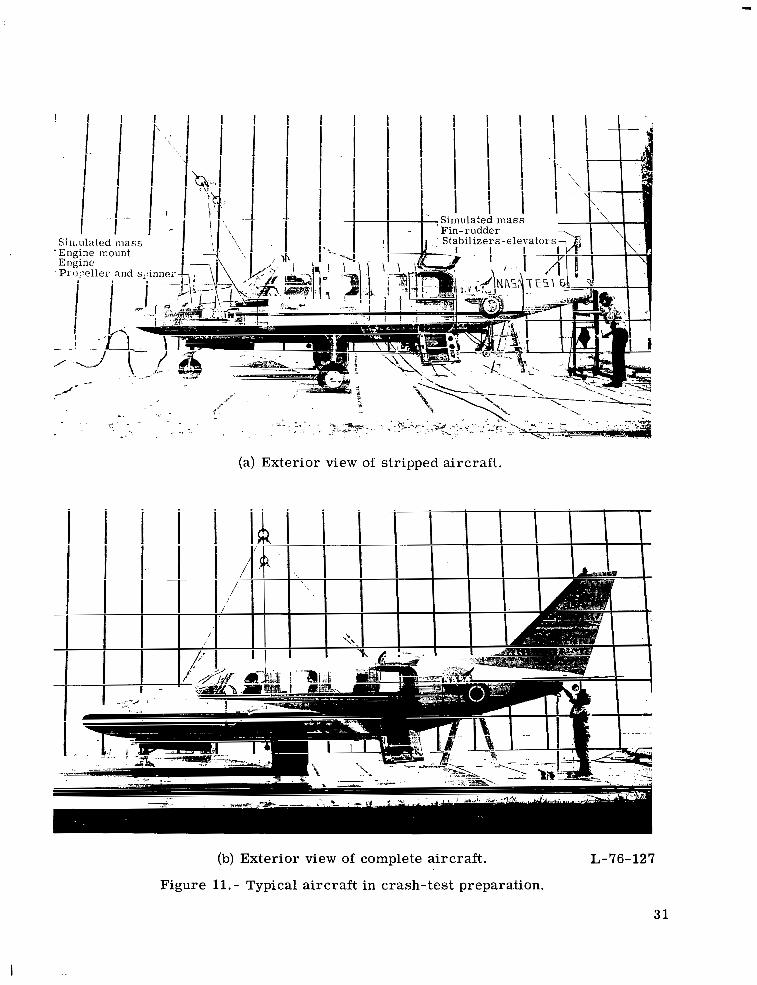
Typical a i rcraf t specimens which have been crash tested a r e shown in figure 11. The stripped aircraf t specimen (fig. l l (a ) )consists of a fuselage structural shell , wings with nacelle fairings, and landing gear. The mass and center of gravity of the empennage are simulated by two concentrated masses representing the fin-rudder and stabil izer-elevator combinations. The ailerons and flaps a r e simulated by concentrated masses . The masses and centers of gravity of the engines a r e represented either by old engines loaded with lead o r by simulated engines made of steel plate and loaded with lead. Concentrated masses are also used to simulate the propellers and spinners.
8

The complete a i rcraf t (fig. l l (b) ) has all the major a i rcraf t par ts and equipment necessary to a flightworthy aircraf t except the propellers and spinners which a r e simulated as with the stripped aircraft .
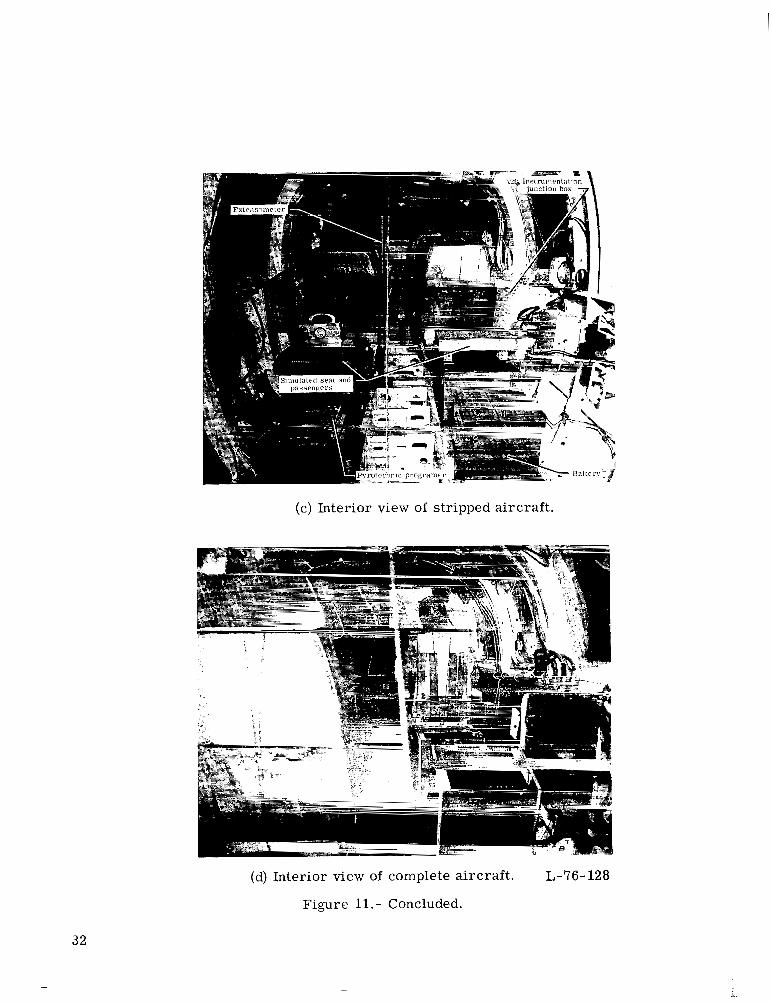
Interior views of the stripped and complete aircraft are shown in figures l l ( c ) and l l (d) . Since the basic a i rcraf t configuration is the same, the inter iors of each must be arranged and equipped so that the total weight, balance, and center-of-gravity locations are the same. Only slight variations can be tolerated i f control of the tes t parameters is to be maintained. Various arrangements of seats , anthropomorphic dummies, and restraint systems can be selected for testing as shown by a comparison of figures l l ( c ) and l l (d ) . The stripped aircraf t does not have floor boards, instrument panel, o r furnishings (except seats). Both tes t specimens contain batteries, instrumentation junction boxes, pyrotechnic programer, and various electrical junction boxes and circuits as needed to prepare the aircraf t for crash testing. Additional mass in concentrated form is used in the stripped aircraf t to simulate some of those i tems which a r e integral to the complete aircraft . Aircraft crash-test preparations common to both the stripped and complete a i rcraf t a r e given in appendix B.
TEST OPERATIONS
The tes t operations a r e carr ied out in three phases. In the f i rs t phase, the ai rcraf t is prepared according to appendix B. The second phase las ts approximately 1week; this phase consists of moving the aircraf t into position under the gantry, integrating the aircraf t with the facility, and making the final preparation of the aircraf t for testing. The third phase of the test operations is the actual a i rcraf t crash test . All the operations a r e directed from the control room with the use of countdown procedures which identify all the necessary steps for conducting a safe test. A discussion of the primary tes t operation activities in condensed form is presented in the following sections.
Aircraft- Facility Integration
There are four primary position alinements (see fig. 12) which must be made to satisfy the tes t parameters. The alinement dimensions which identify these positions a r e determined by the measurements and equations of appendix A. The aircraf t is alined in position with the use of t ransi ts for sighting targets on the aircraf t from survey monuments. These monuments are located on the gantry center line and 30 m to the side of the center line. The side monuments a r e located a t distances K, KCS, and P from the pivot-point monument. The movable bridge is also alined in position from a side monument at a distance S from the pivot-point monument.
9
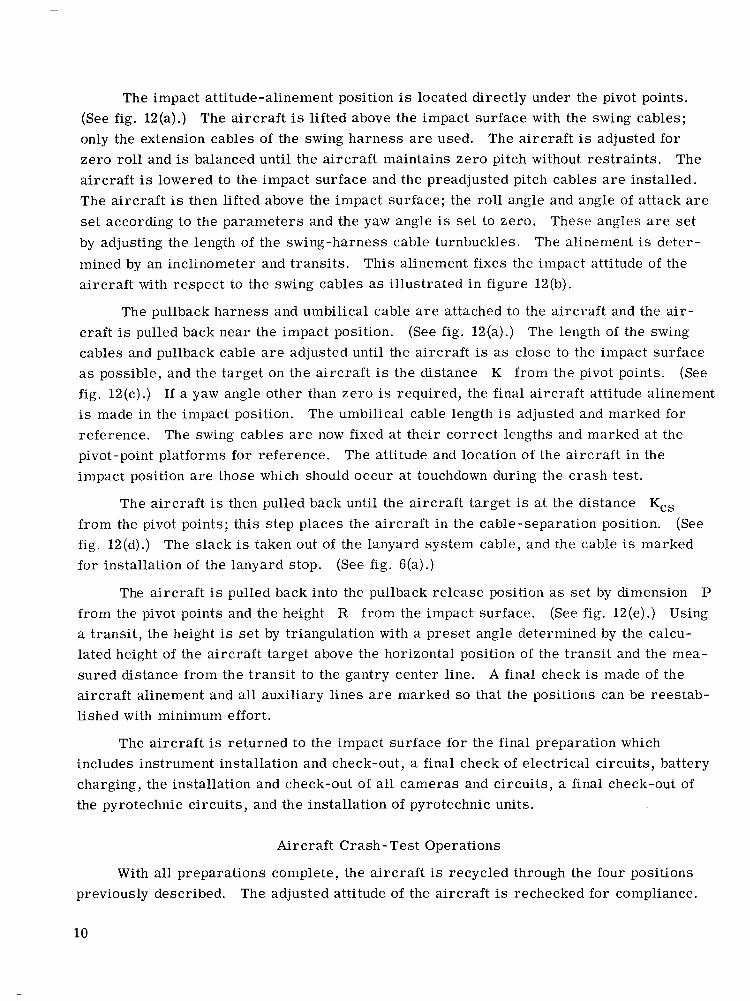
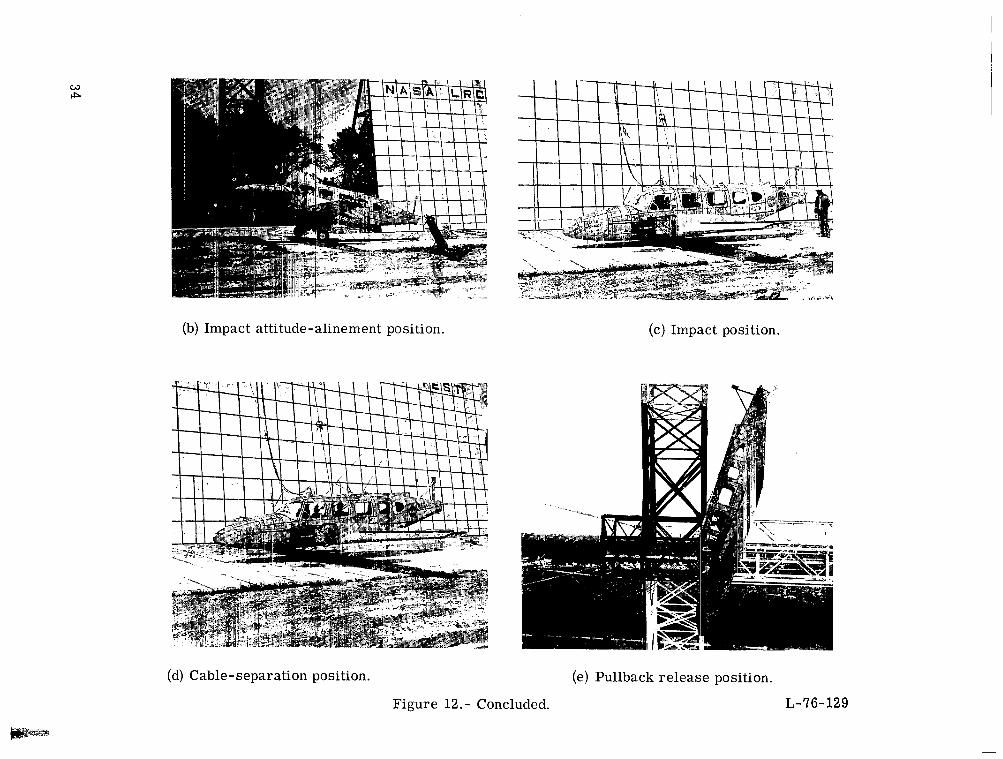
The impact attitude-alinement position is located directly under the pivot points. (See fig. 12(a).) The aircraf t is lifted above the impact surface with the swing cables; only the extension cables of the swing harness are used. The aircraf t is adjusted for zero roll and is balanced until the a i rcraf t maintains zero pitch without res t ra ints . The aircraf t is lowered to the impact surface and the preadjusted pitch cables a r e installed. The aircraf t is then lifted above the impact surface; the roll angle and angle of attack a r e se t according to the parameters and the yaw angle is se t to zero. These angles are set by adjusting the length of the swing-harness cable turnbuckles. The alinement is determined by an inclinometer and transits. This alinement fixes the impact attitude of the a i rc raf t with respect to the swing cables as illustrated in figure 12(b).
The pullback harness and umbilical cable a r e attached to the aircraf t and the aircraf t is pulled back near the impact position. The length of the swing(See fig. 12(a).) cables and pullback cable are adjusted until the a i rcraf t is as close to the impact surface as possible, and the target on the aircraf t is the distance (SeeK from the pivot points. fig. 12(c).) If a yaw angle other than zero is required, the final a i rcraf t attitude alinement is made in the impact position. The umbilical cable length is adjusted and marked for reference. The swing cables a r e now fixed at their correct lengths and marked a t the pivot-point platforms for reference. The attitude and location of the aircraf t in the impact position a r e those which should occur a t touchdown during the crash test .
The aircraf t is then pulled back until the a i rcraf t target is at the distance Kcs from the pivot points; this step places the aircraf t in the cable-separation position. fig. 12(d).) The slack is taken out of the lanyard system cable, and the cable is marked
(See
for installation of the lanyard stop. (See fig. 6(a).)
The aircraf t is pulled back into the pullback release position as se t by dimension P from the pivot points and the height R from the impact surface. (See fig. 12(e).) Using a transit , the height is se t by triangulation with a preset angle determined by the calculated height of the aircraf t target above the horizontal position of the transit and the measured distance from the transit to the gantry center line. A final check is made of the aircraf t alinement and all auxiliary lines a r e marked so that the positions can be reestablished with minimum effort.
The aircraf t is returned to the impact surface for the final preparation which includes instrument installation and check-out, a final check of electrical circuits, battery charging, the installation and check-out of all cameras and circuits, a final check-out of the pyrotechnic circuits, and the installation of pyrotechnic units.
Aircraft Crash-Test Operations
With all preparations complete, the ai rcraf t is recycled through the four positions previously described. The adjusted attitude of the aircraf t is rechecked for compliance.
10
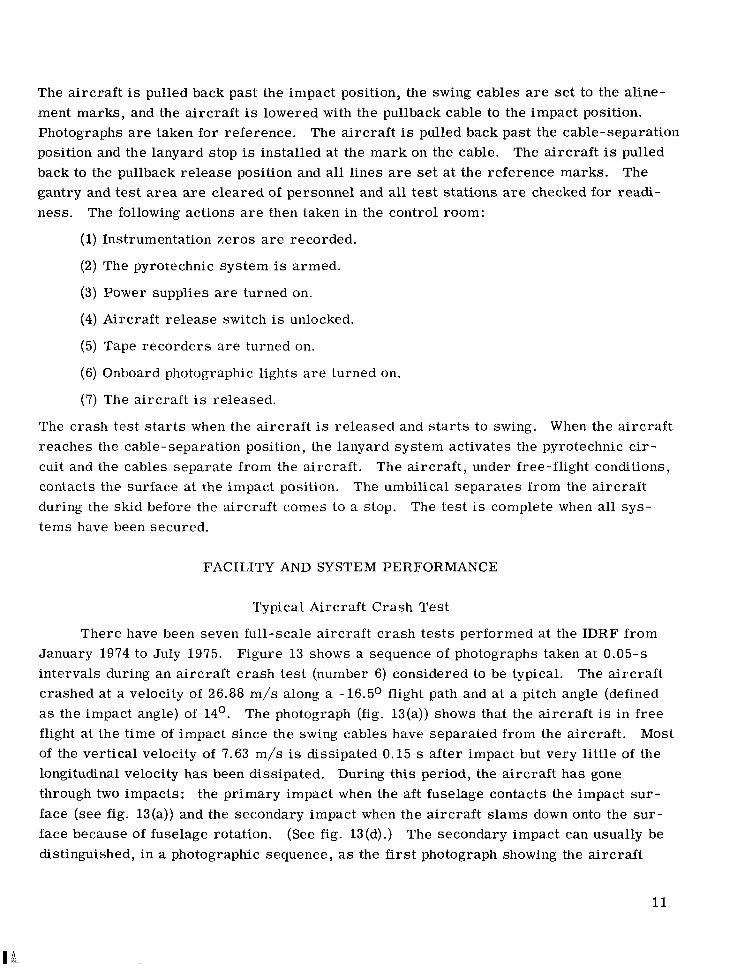
The aircraf t is pulled back past the impact position, the swing cables are se t to the alinement marks, and the aircraf t is lowered with the pullback cable to the impact position. Photographs are taken for reference. The aircraf t is pulled back past the cable-separation position and the lanyard stop is installed at the mark on the cable. The aircraf t is pulled back to the pullback release position and all lines are set at the reference marks. The gantry and tes t a r ea are cleared of personnel and all tes t stations are checked for readiness. The following actions a r e then taken in the control room:
(1) Instrumentation zeros are recorded.
(2) The pyrotechnic system is armed.
(3) Power supplies are turned on.
(4)Aircraft re lease switch is unlocked.
(5) Tape recorders are turned on.
(6) Onboard photographic lights a r e turned on.
(7) The aircraf t is released.
The crash test s t a r t s when the aircraf t is released and s t a r t s to swing. When the aircraf t reaches the cable-separation position, the lanyard system activates the pyrotechnic c i r cuit and the cables separate from the aircraft . The aircraf t , under free-flight conditions, contacts the surface at the impact position. The umbilical separates from the aircraf t during the skid before the aircraf t comes to a stop. The tes t is complete when all systems have been secured.
FACILITY AND SYSTEM PERFORMANCE
Typical Aircraft Crash Test
There have been seven full-scale a i rcraf t crash tes ts performed a t the IDRF from January 1974 to July 1975. Figure 13 shows a sequence of photographs taken a t 0.05-s intervals during an aircraf t crash tes t (number 6) considered to be typical. The aircraf t crashed at a velocity of 26.88 m/s along a -16.5O flight path and a t a pitch angle (defined as the impact angle) of 14'. The photograph (fig. 13(a)) shows that the aircraf t is in f ree flight a t the time of impact since the swing cables have separated from the aircraft . Most of the vertical velocity of 7.63 m/s is dissipated 0.15 s after impact but very little of the longitudinal velocity has been dissipated. During this period, the aircraft has gone through two impacts: the primary impact when the aft fuselage contacts the impact su r face (see fig. 13(a)) and the secondary impact when the aircraf t s lams down onto the su r face because of fuselage rotation. (See fig. 13(d).) The secondary impact can usually be distinguished, in a photographic sequence, as the f i r s t photograph showing the aircraf t
11
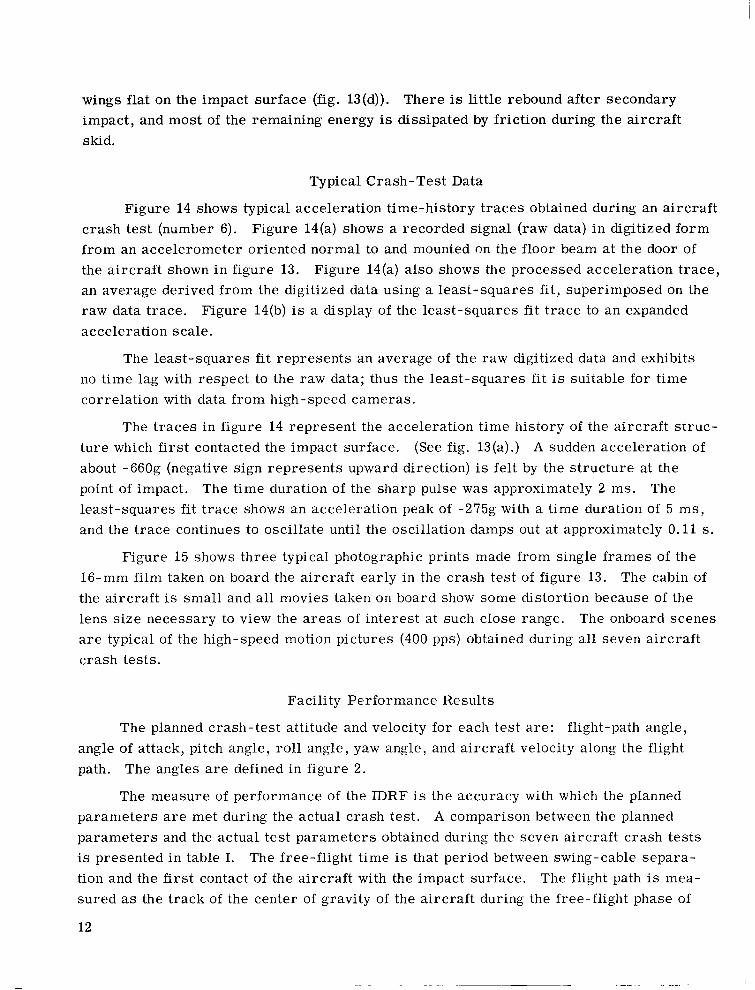
wings flat on the impact surface (fig. 13(d)). There is little rebound after secondary impact, and most of the remaining energy is dissipated by friction during the aircraf t skid.
Typical Crash-Test Data
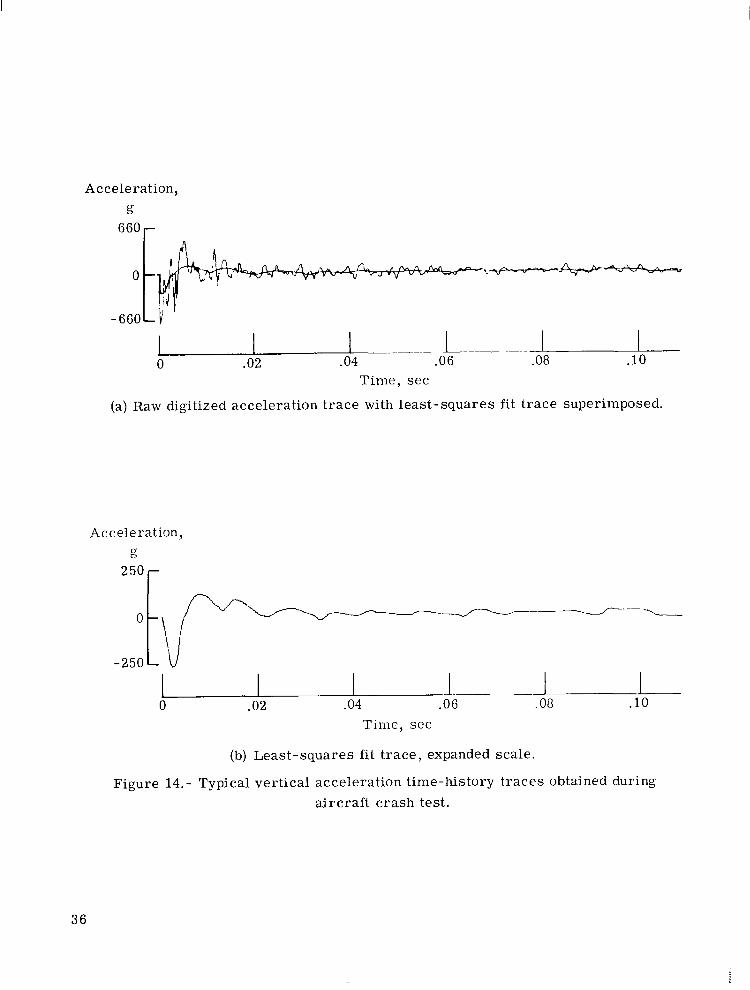
Figure 14 shows typical acceleration time-history t races obtained during an aircraf t crash tes t (number 6). Figure 14(a) shows a recorded signal ( raw data) in digitized form f rom an accelerometer oriented normal to and mounted on the floor beam a t the door of the aircraf t shown in figure 13. Figure 14(a) also shows the processed acceleration t race, an average derived from the digitized data using a least-squares fit, superimposed on the r a w data t race. Figure 14(b) is a display of the least-squares fit t race to an expanded acceleration scale.
The least-squares fit represents an average of the raw digitized data and exhibits no time lag with respect to the r a w data; thus the least-squares fit is suitable for time correlation with data from high-speed cameras .
The t races in figure 14 represent the acceleration time history of the aircraf t s t ructure which f i r s t contacted the impact surface. (See fig. 13(a).) A sudden acceleration of about -660g (negative sign represents upward direction) is felt by the s t ructure at the point of impact. TheThe time duration of the sharp pulse was approximately 2 ins. least-squares fit t race shows an acceleration peak of -275g with a time duration of 5 ms , and the t race continues to oscillate until the oscillation damps out at approximately 0.11 s.
Figure 15 shows three typical photographic prints made from single f rames of the 16-mm film taken on board the aircraf t early in the crash test of figure 13. The cabin of the aircraf t is small and all movies taken on board show some distortion because of the lens s ize necessary to view the a reas of interest at such close range. The onboard scenes a r e typical of the high-speed motion pictures (400 pps) obtained during all seven aircraf t crash tests.
Facility Performance Results
The planned crash-test attitude and velocity angle of attack, pitch angle, roll angle, yaw angle, path. The angles a r e defined in figure 2.
The measure of performance of the IDRF is parameters a r e met during the actual crash test .
for each tes t a re : flight-path angle, and aircraf t velocity along the flight
the accuracy with which the planned A comparison between the planned
parameters and the actual tes t parameters obtained during the seven aircraf t crash tes ts is presented in table I. The free-flight time is that period between swing-cable separation and the f i rs t contact of the aircraf t with the impact surface. The flight path is measured as the track of the center of gravity of the aircraf t during the free-flight phase of
12

the test. The pitching velocity is determined from the change in pitch angle during the free-flight time. The umbilical release time is the period between swing-cable separation and umbilical separation. For tes ts i n which the aircraf t landing gears are extended, impact is defined as the time at which the landing gear f i r s t contacts the impact surface. When landing gears are retracted, impact is defined as the time at which the fuselage makes initial contact with the impact surface. (See fig. 16.)
The first aircraft w a s c rash tested at a velocity of 12.66 m/s along a flight path of -16.75O and a pitch angle of -15.75O. This tes t was used primarily as a check of the facility systems and tes t procedures and was the only tes t performed a t this low velocity. The wind velocity was variable up to 4 . 5 m/s from the west. All tes t parameters obtained were close to those planned. All systems except the umbilical separation functioned properly. The umbilical failed to separate because the pyrotechnic battery discharged when the pyrotechnic circuit w a s shorted by part of the damaged aircraf t structure. Care w a s taken on subsequent tes ts to place circuit wirings in safer locations.
Aircraft tests 1, 2, 4 , 6, and 7 were performed with the landing gears retracted. Tests 3 and 5 were performed with the landing gears extended. A comparison of planned and actual tes t parameters , as given in table I, indicate the following: For all seven tes ts the flight-path angles were accurate to within 8 percent, flight-path velocities were accurate to within 6 percent, and the angles of attack over the range of values from zero to 30° were accurate to within 4.0°.
The pitch angles, which a r e dependent on the flight-path angles and angles of attack, were accurate to within 4.25O. The accuracy of the pitch angle reflects inaccuracies in flight-path angles and angles of attack. The e r r o r in pitch angle is composed of two pr i mary ingredients: an e r r o r introduced by the catenary effects in the swing cables (3.0' o r less) and a deviation from the calculated angular rotations of the aircraf t in f ree flight after cable separation ( l . O o o r less). This e r r o r also reflects the effect of flight-path inaccuracies caused by cable-separation position. The analysis of the performance characterist ics of the facility is presented in detail i n appendix A.
All a i rcraf t crash tes t s performed a t the facility a r e weather dependent. Wind velocities must be l e s s than 4.5 m/s to insure adequate control of yaw and roll of the aircraft. Winds of greater velocity can cause conditions which can result in larger e r r o r s in the aircraf t attitude at impact. During tes t 5 a southeast wind a t a velocity of about 8.5 m/s was experienced. The wind caused roll and yaw angle e r r o r s of approximately 3.5' and displaced the aircraf t 1.0 m laterally f rom the impact target. All other tes ts were made with wind velocities of less than 4 . 5 m/s and the aircraf t experienced negligible roll and yaw e r ro r s , as can be seen in table I.
13
CONCLUDING REMARKS
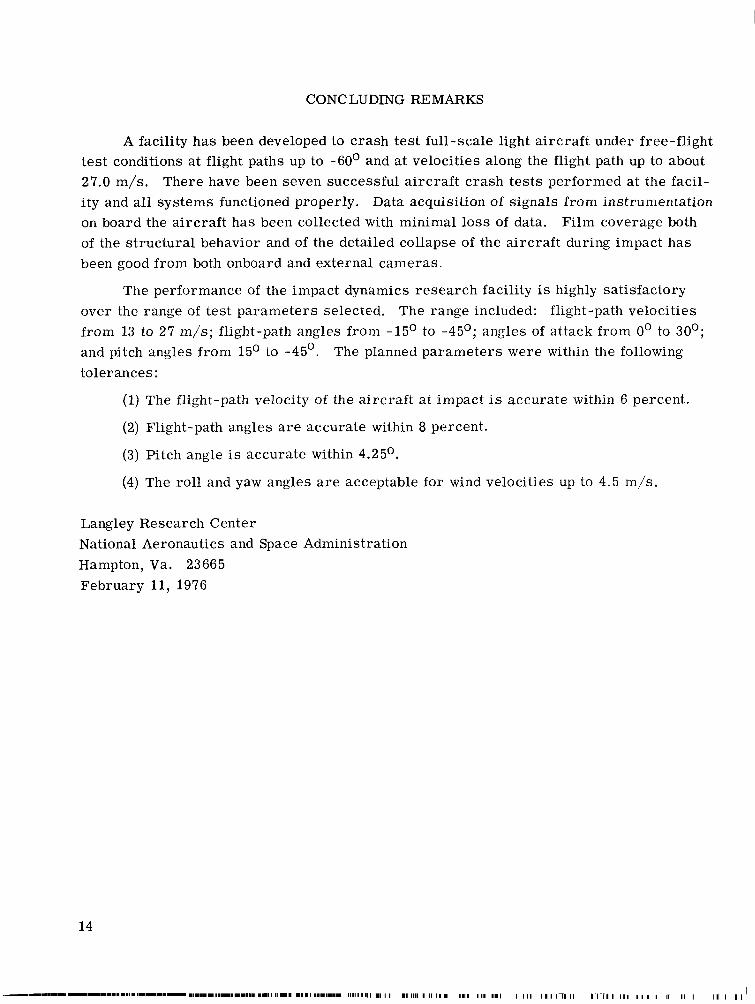
A facility has been developed to crash tes t full-scale light a i rcraf t under free-flight tes t conditions a t flight paths up to -60' and at velocities along the flight path up to about 27.0 m/s. There have been seven successful a i rcraf t crash tes ts performed at the facility and all systems functioned properly. Data acquisition of signals from instrumentation on board the aircraf t has been collected with minimal loss of data. Film coverage both of the structural behavior and of the detailed collapse of the aircraf t during impact has been good from both onboard and external cameras .
The performance of the impact dynamics research facility is highly satisfactory over the range of tes t parameters selected. The range included: flight-path velocities f rom 13 to 27 m/s; flight-path angles from -15O to -45O; angles of attack from 0' to 30'; and pitch angles from 15O to -45'. The planned parameters were within the following tolerances:
(1) The flight-path velocity of the aircraf t at impact is accurate within 6 percent.
(2) Flight-path angles are accurate within 8 percent.
(3) Pitch angle is accurate within 4.25O.
(4) The roll and yaw angles are acceptable for wind velocities up to 4.5 m/s.
Langley Research Center National Aeronautics and Space Administration Hampton, Va. 23665 February 11, 1976
14
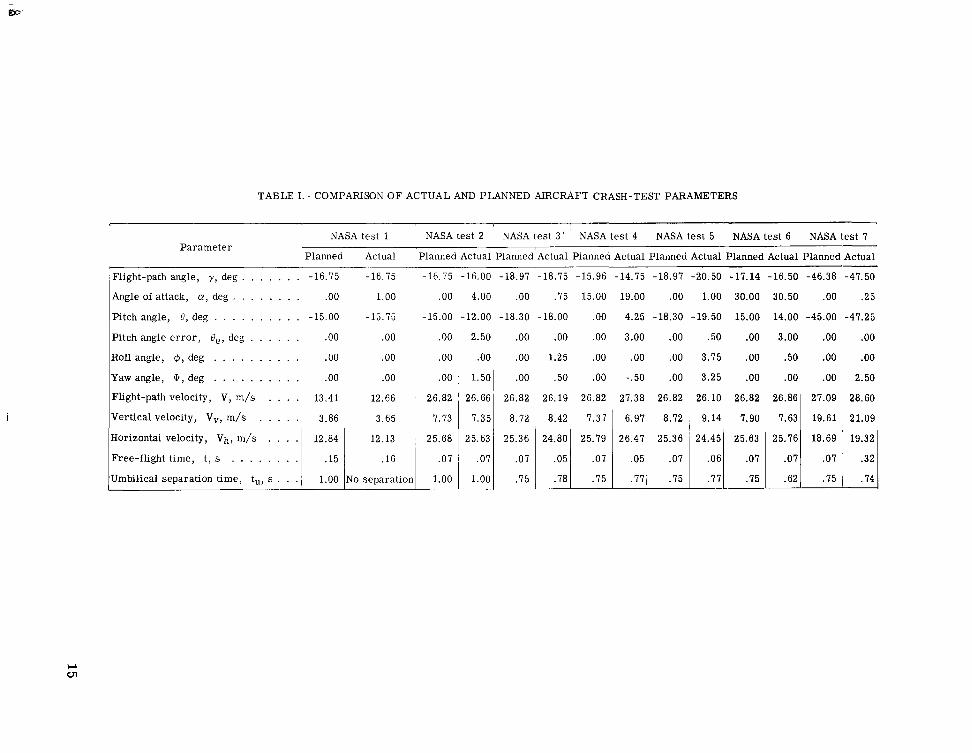
TABLE I . - COMPARISON O F ACTUAL AND PLANNED AIRCRAFT CRASH-TEST PARAMETERS
NASA test 1 NASA test 2 NASA test 3 ' NASA tes t 4 NASA test 5 NASA tes t 6 NASA test 7 Parameter
Planned Actual Planned Actual Planned Actual Planned Actual Planned Actual Planned Actual Planned Actual
,Flight-path angle, y , d e g . . . . . . . -16.75 -16.75 -16.75 -16.00 -18.97 -18.75 -15.96 -14.75 -18.97 -20.50 -17.14 -16.50 -46.38 -47.50
Angle of attack, a,deg . . . . . . . . .OO 1.00 .OO 4.00 .OO .75 15.00
Pitch angle, 0, deg . . . . . . . . . . -15.00 -15.75 -15.00 -12.00 -18.30 -18.00 .OO
Pitch angle e r r o r , ti,, deg . . . . . . Roll angle, @,deg . . . . . . . . . . yaw angle, q ,deg . . . . . . . . . . Flight-path velocity, V, m/s . . . . Vertical velocity, Vv, m/s . . . . , Horizontal velocity, Vh, m/s . . . . Free-flight time, t , s . . . . . . . . Umbilical separation t ime, tu, s . . .1
.OO .oo .OO 2.50 .OO .OO .OO
.OO .00 .OO .OO .OO 1.25 .OO
.OO .oo .OO ' 1.50 .OO .50 .OO
13.41 12.66 ' 26.82 26.66 26.82 26.191 26.82
7.35
25.63
.07
1.00 .75 .75
26.47 25.36 24.45 25.63
.77 .75 .77 .75
30.50 .OO .25
14.00 -45.00 -47.25
3.00 .OO .OO
.50 .OO .OO
.OO .OO 2.50
26.86 27.09 28.60
7.63 19.61 21.09
25.76 18.69 19.32
. O / .07 1 .321
.62 .75 .74
\ \
-Suspended a i rc raf t at predetermined height (velocities up to 27 mys)
' '\ ' \
'1 ',\ '\ '
\ '\'
-I ,:-'.,"
'.-, ,:;- surface r i
- I ,I
lo Flight paths > -60'
Figure 1.- Full-scale aircraft crash-test technique.
+ z
y Flight-path angle cy Angle of attack 6' Pi tch angle,
e = y + a
@ Roll angle
+ Y
* Yaw angle
tude, axes, and force di.rections.
17
+ X
Figure 2.- Sketches identifying flight path, c rash atti
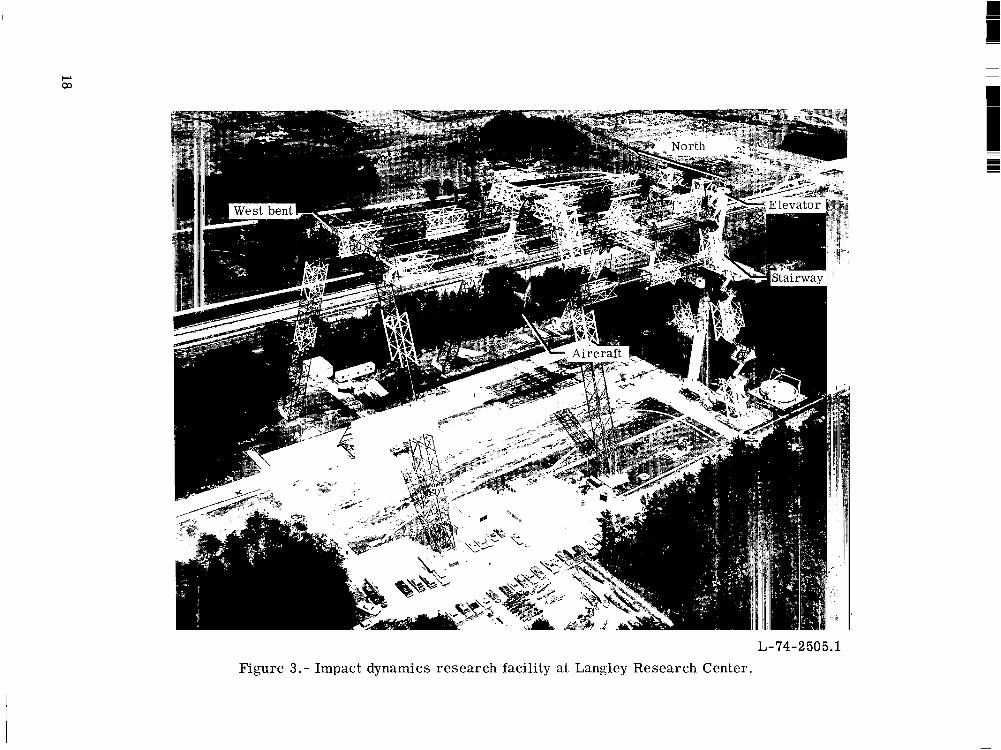
L-74-2505.1 Figure 3. - Impact dynamics research facility a t Langley Research Center.
Movable bridge andAuxiliary umbilical ,--platform 7 pullback platform
Umbilical platform Movable camera with camera mounts
Gantry
Movable photographic
Figure 4. - Diagram of impact dynamics research facility.

kh,-Umbilical
Swing cables Pullback cable -
I I I r P i t c h cables
Pitch cables Pullback harness cables
T \ extension
Center of gravity’
Figure 5. - Aircraft suspension system, swing harness re fers to swing-cable extensions and pitch cables;
pullback harness re fers to pullback harness cables and spreader bar.
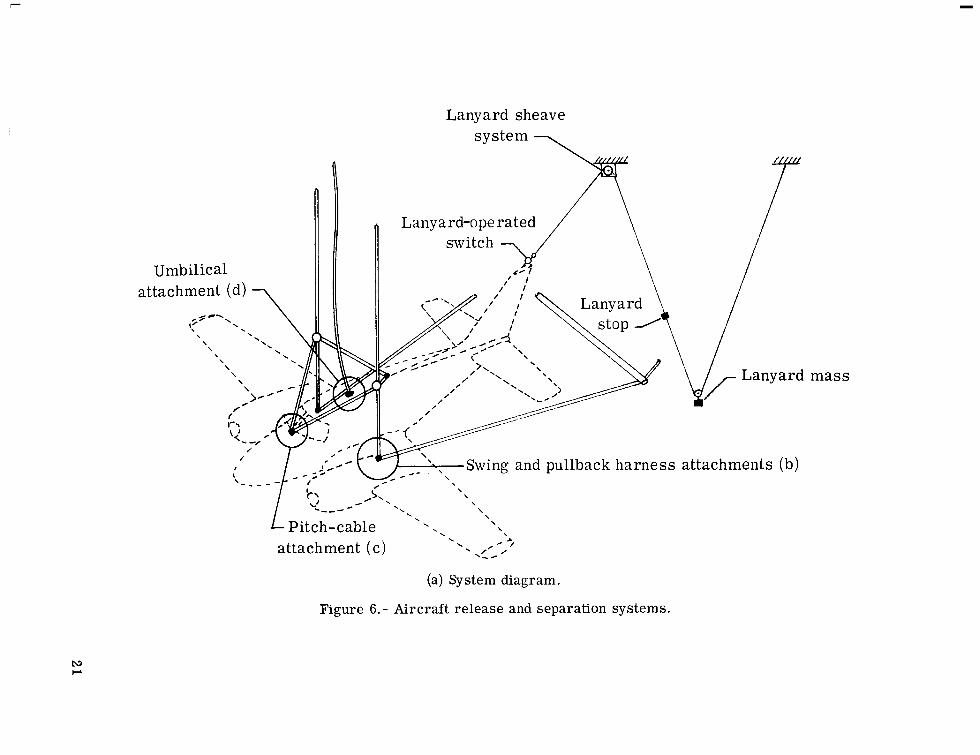
Lanyard sheave system -
Lanyard-operated / \ Pswitch IUmbilica1 attachment (d)
. I
(a) System diagram.
Figure 6.- Aircraft release and separation systems.
Low-shock pyrotechnic n u t s
Pullback cable Hard-point wingarrachnient
/'
t I
L-15-4653.1 (b) Aircraft swing and pullback harness attachment and pyrotechnic units.
Figure 6.- Continued.
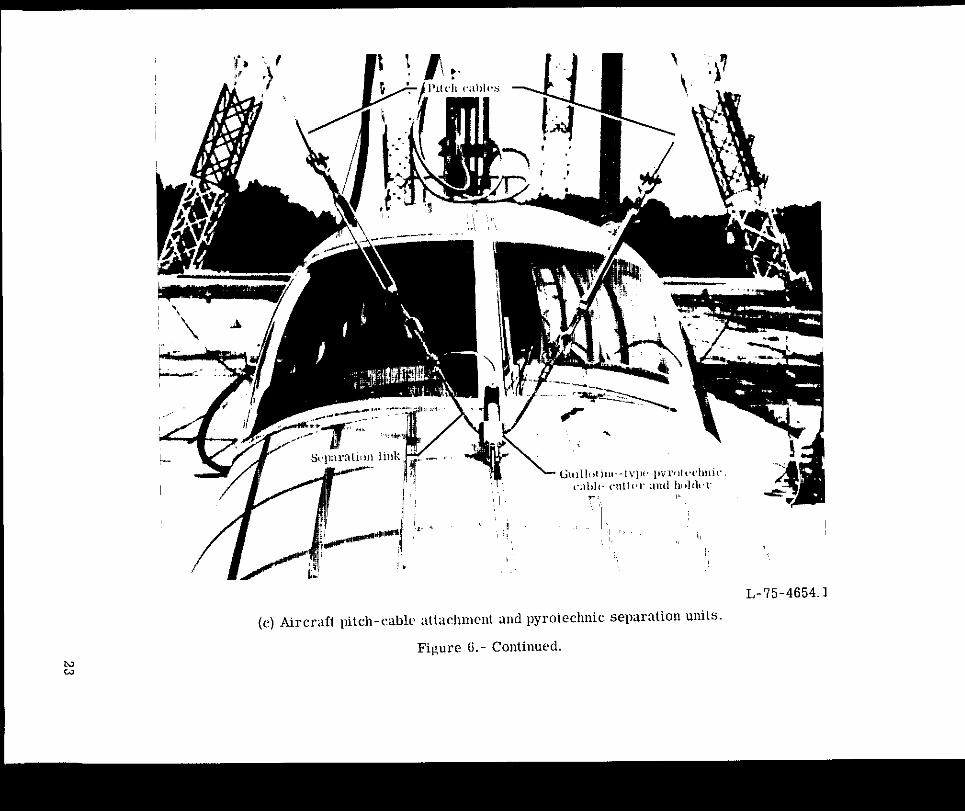
L-75-4654.
(c) &rcr;rft pitch-cabli, ;itt;ichiiicnt and pyrotechnic separltion units.
Figure 6.- Continued. N w
N P
L-'75-4660.1 (d) Aircraft umbilical cable attachment and pyrotechnic separation units.
Figure 6.- Concluded.
~
I
' <
L-76-124 Figure 7.- Control room operation panel.

Accelerometers 1 0 0 Normal direction
o Longitudinal direction + Latera l direction
0
A 1 h
(a) Diagram showing typical accelerometer layout.
Figure 8.- Aircraft onboard data instrumentation.
%, 8%
“b‘dAccelerometer mounting block
Normal acce le romete r
Longitudinal acce le romete r ,e-\*
L-76-125 (b) Typical triaxial accelerometer installation.
Figure 8. - Concluded.
27
// 1 .
2 .
3 .
4 .
5 .
6 .
7 .
8 .
9 .
I D .
1 1 .
1 2 .
1 3 .
1 4 .
L-75-4656.1
E q u i p m e n t l i s t
T a p e r e c o r d e r
A u d i o o s c i l l a t o r
D i g i t a l v o l t - o h m m e t e r
E l e c t r o n i c c o u n t e r
O s c i l l o s c o p e
T a p e r e c o r d e r m o n i t o r s w i t c h
G a l v a n o m e t e r d r i v e r
O s c i 1 l o g r a p h
T a p e r e c o r d e r s q u e l c h u n i t
A c c e l e r o m e t e r c o n d i t i o n i n g c h a s s i s
I R I G - A t i m e c o d e g e n e r a t o r
Amp1 i f ie r s
T a p e r e c o r d e r p o w e r s u p p l y
S t r a i n - g a g e p o w e r s u p p l y
Figure 9.- Control room data conditioning and recording equipment.
Camera looking
u (a) Diagram of typical camera layout.
L-76-126 (b) Camera mounted in instrument panel, looking aft.
Figure 10. - Aircraft onboard.camera coverage.
29
I
L-75-4659.1 (c) Camera located in rear of fuselage, looking forward.
L- 75-4664
(d) Cameras mounted starboard to fuselage structure, looking at first passenger on port side of fuselage.
Figure 10.- Concluded.
30
. . r:’ . - .Le.,1.- . % . .->, . -. . .., . .sL-+.-. .
(a) Exterior view of stripped aircraft .
(b) Exterior view of complete aircraft . L- 76- 127
Figure 11.- Typical a i rcraf t in crash-test preparation.
31
(c) Interior view of stripped aircraft .
(d) Interior view of complete aircraft . L-76-128
Figure 11.- Concluded.
32

I I-; I \ I \
Pullback point
I '//' I ! R
(b) Impact attitude-alinement position (c) Impact position (d) Cable-separation position (e) Pullback release position
(a) Alinement positions diagram.
Figure 12. - Primary alinement positions for aircraft crash-test preparations.
W W
W cp
(b) Impact attitude-alinement position. (c) Impact position.
(d) Cable-separation position. (e) Pullback release position.
Figure 12.- Concluded. L-76- 129

(a) Primary impact. (b) 0.05 s after contact. (c) 0.10 s after contact.
(d) 0.15 s after contact. (e) 0.20 s after contact. (f) 0.25 s after contact.
(g) 0.30 s after contact. (h) 0.35 s after contact. (i) 0.40 s after contact.
L-76- 130 Figure 13.- Sequence photographs showing a typical aircraft crash test. y = -16.50; 0 = 14.0°; CY = 30.5O.
Acceleration, g
660 r
Acceleration, g
250 r
0-1 -02 .04 .06 . 0 8 .10 L
Time, sec
(b) Least-squares fit t race , expanded scale.
Figure 14.- Typical vertical acceleration time-history t races obtained during aircraf t crash test.
36

(a) Camera in instrument panel. (b) Camera on fuselage exterior.
(c) Camera in aft end of fuselage. L-76-131
Figure 15. - Onboard photographs taken during aircraft crash test.
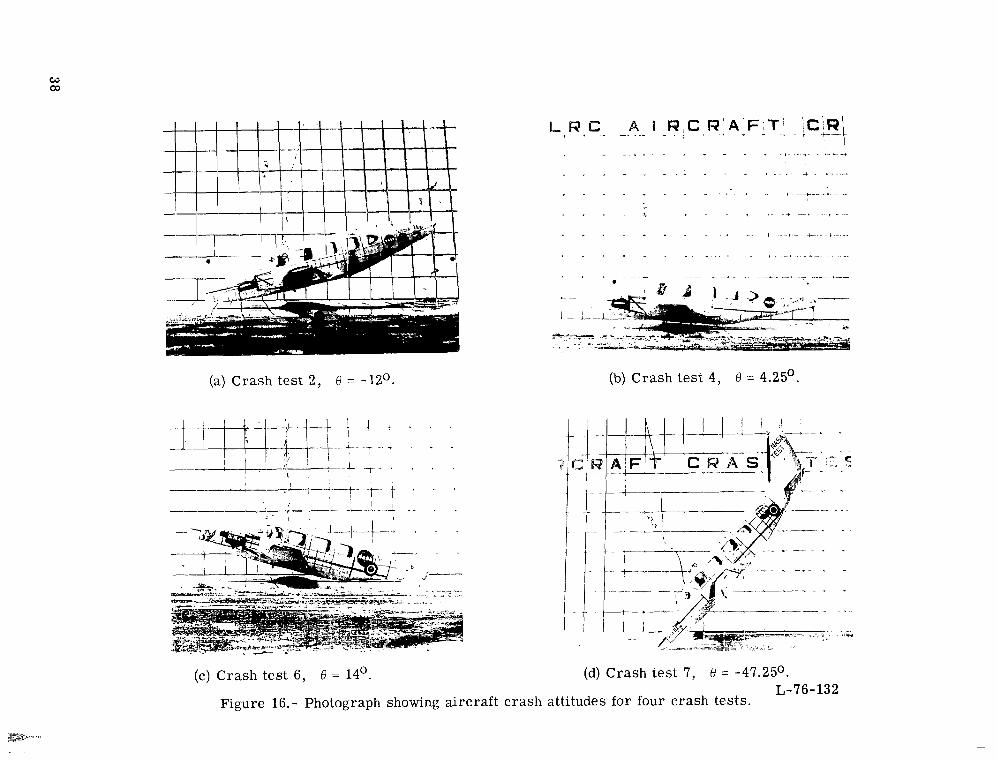
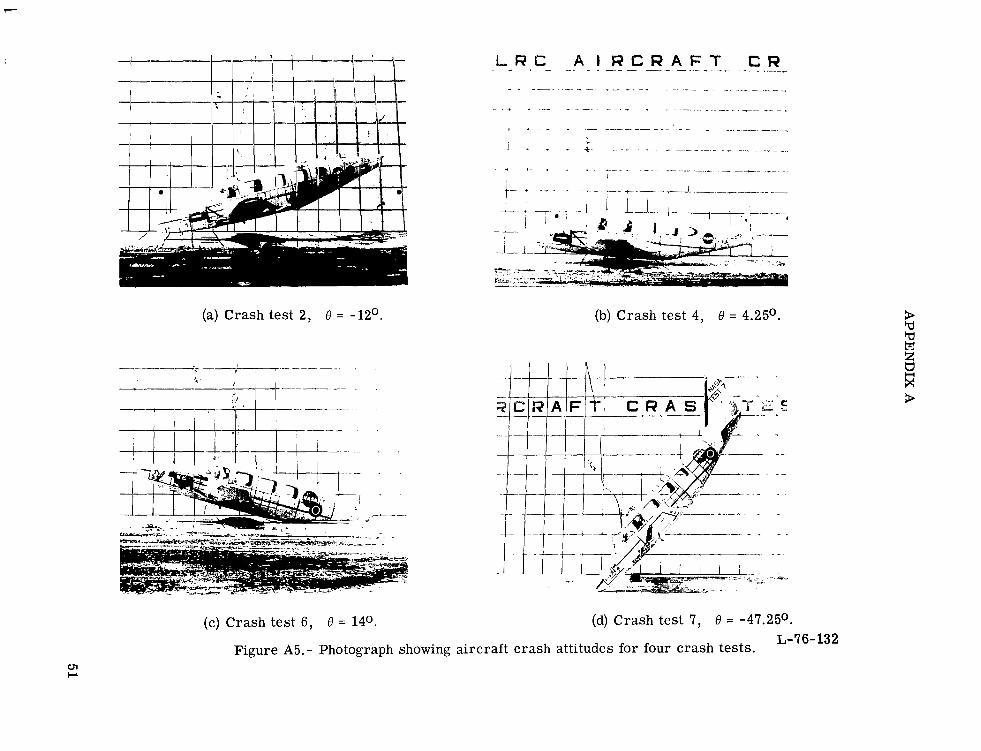
(a) Crash test 2 , 0 = -12O. (b) Crash test 4, 0 = 4.25'
t tf-st-l-i-! i i * *
(c) Crash test 6 , 0 = 14'. (d) Crash test 7, 0 = -47.25O. L-76- 132
Figure 16.- Photograph showing aircraft crash attitudes for four crash tests.
APPENDIX A
DEFINITIONS AND EQUATIONS FOR AIRCRAFT CRASH-TEST GEOMETRY
AND PERFORMANCE ANALYSIS O F THE IMPACT
DYNAMICS RESEARCH FACILITY
General Description
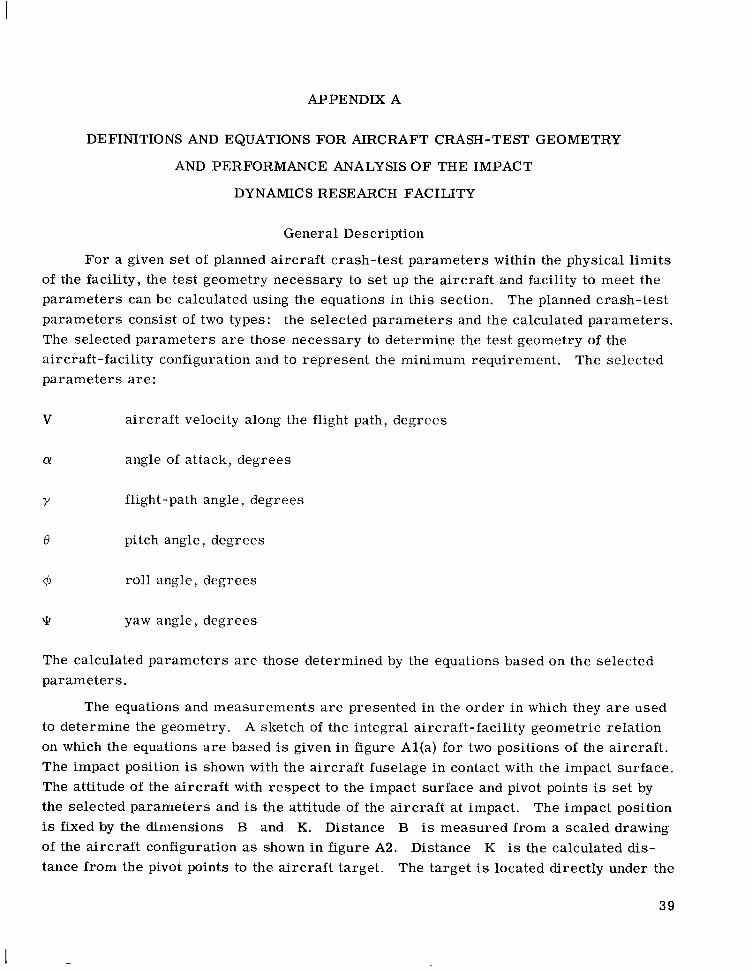
For a given se t of planned aircraf t crash-test parameters within the physical l imits of the facility, the test geometry necessary to set up the aircraf t and facility to meet the parameters can be calculated using the equations in this section. The planned crash-test parameters consist of two types: the selected parameters and the calculated parameters. The selected parameters are those necessary to determine the test geometry of the aircraft-facility configuration and to represent the minimum requirement. The selected parameters a re :
a i rcraf t velocity along the flight path, degrees
a! angle of attack, degrees
Y flight-path angle, degrees
e pitch angle, degrees
@ roll angle, degrees
QJ yaw angle, degrees
The calculated parameters a r e those determined by the equations based on the selected parameters.
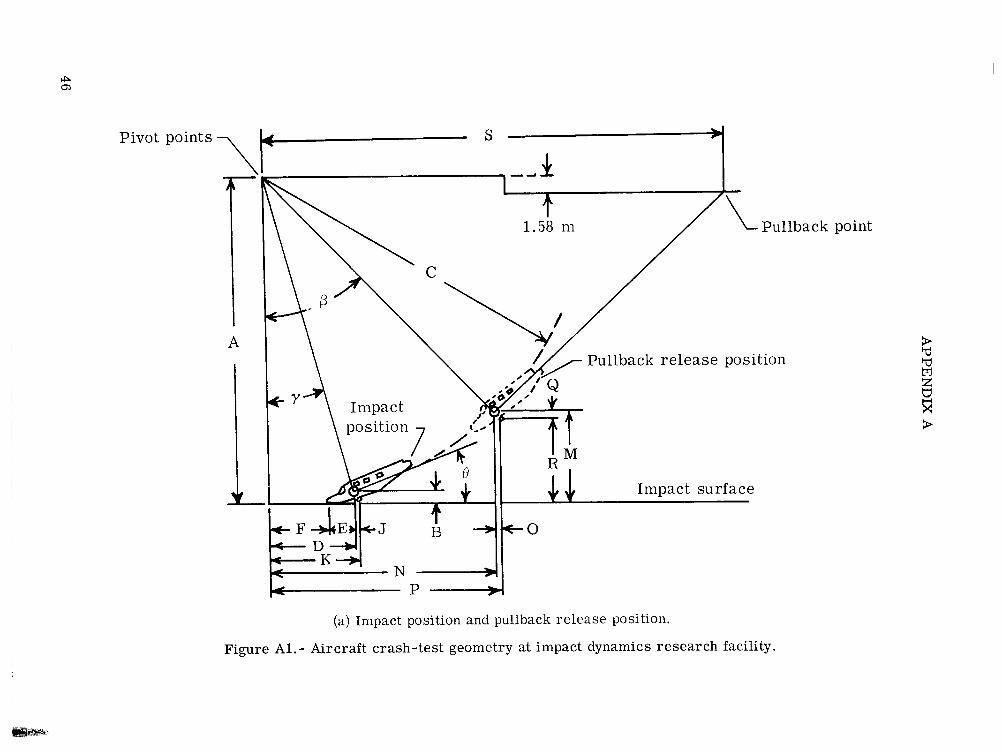
The equations and measurements a r e presented in the order in which they are used to determine the geometry. A sketch of the integral aircraft-facility geometric relation on which the equations are based is given in figure Al(a) for two positions of the aircraft . The impact position is shown with the aircraf t fuselage in contact with the impact surface. The attitude of the a i rc raf t with respect to the impact surface and pivot points is se t by the selected parameters and is the attitude of the aircraf t a t impact. The impact position is fixed by the dimensions B and K. Distance B is measured from a scaled drawing of the aircraft configuration as shown in figure A2. Distance K is the calculated distance from the pivot points to the aircraf t target. The target is located directly under the
39
V
APPENDIX A
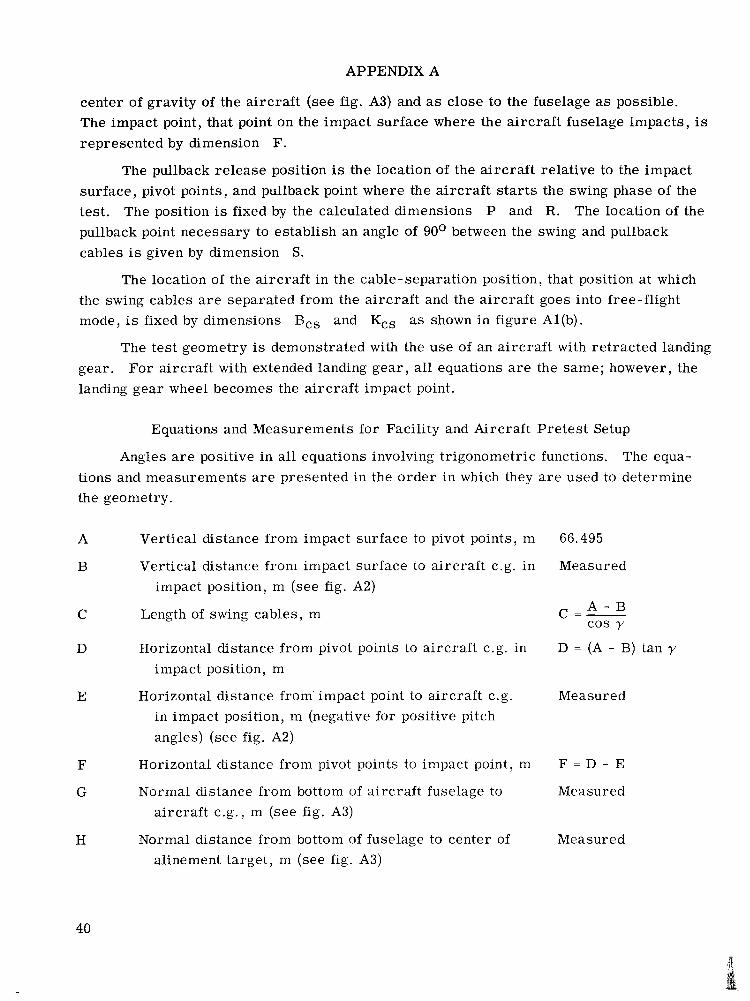
center of gravity of the aircraf t (see fig. A3) and as close to the fuselage as possible. The impact point, that point on the impact surface where the aircraf t fuselage impacts, is represented by dimension F.
The pullback release position is the location of the aircraf t relative to the impact surface, pivot points, and pullback point where the aircraf t starts the swing phase of the test. The position is fixed by the calculated dimensions P and R. The location of the pullback point necessary to establish an angle of 90° between the swing and pullback cables is given by dimension S.
The location of the aircraf t in the cable-separation position, that position at which the swing cables a r e separated from the aircraf t and the aircraf t goes into free-flight mode, is fixed by dimensions Bcs and Kcs as shown in figure Al(b).
The tes t geometry is demonstrated with the use of an aircraf t with ret racted landing gear. For aircraf t with extended landing gear , all equations are the same; however, the landing gear wheel becomes the aircraf t impact point.
Equations and Measurements for Facility and Aircraft Pre tes t Setup
Angles a r e positive in all equations involving trigonometric functions. The equations and measurements a r e presented in the order in which they a r e used to determine the geometry.
A Vertical distance from impact surface to pivot points, m 66.495
B Vertical distance from impact surface to a i rcraf t c.g. in Measured impact position, m (see fig. A2)
Length of swing cables, m c = - A - B cos y
D Horizontal distance from pivot points to a i rcraf t c.g. in D = (A - B) tan y
impact position, m
E Horizontal distance from' impact point to a i rcraf t c.g. Measured in impact position, m (negative for positive pitch angles) (see fig. A2)
F Horizontal distance from pivot points to impact point, m F = D - E
G Normal distance from bottom of a i rcraf t fuselage to Measured aircraf t c.g., m (see fig. A3)
H Normal distance from bottom of fuselage to center of Measured alinement target, m (see fig. A3)
40
C
APPENDIX A
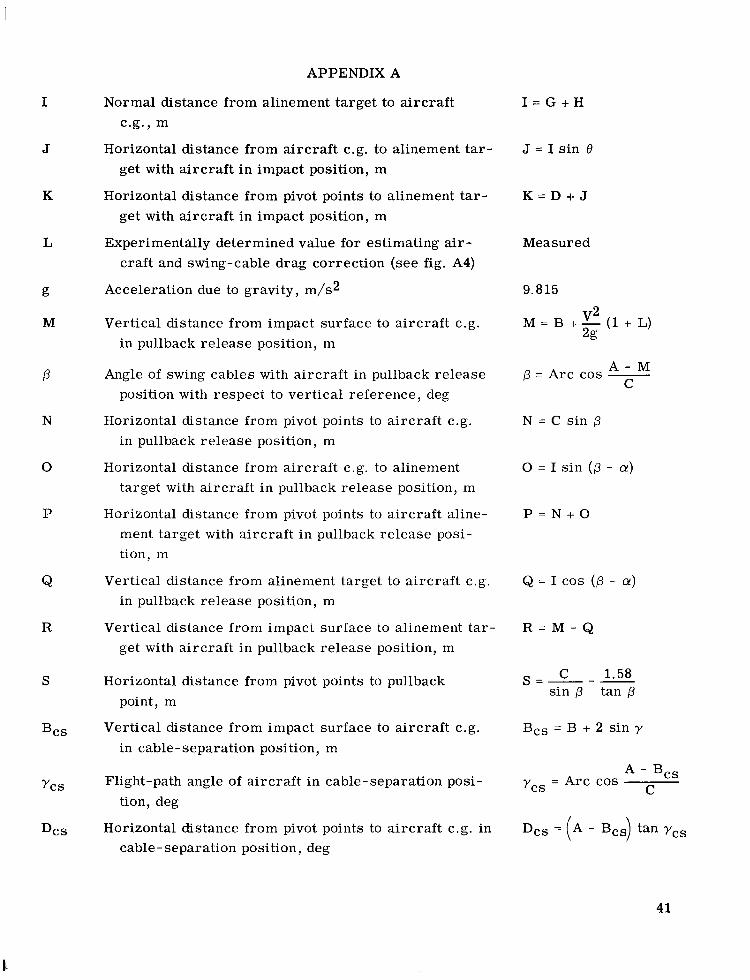
I Normal distance from alinement target to a i rcraf t I = G + H c.g., m
J Horizontal distance from aircraft c.g. to alinement ta r - J = I s in 8 get with aircraft in impact position, m
K Horizontal distance from pivot points to alinement ta r - K = D + J get with ai rcraf t in impact position, m
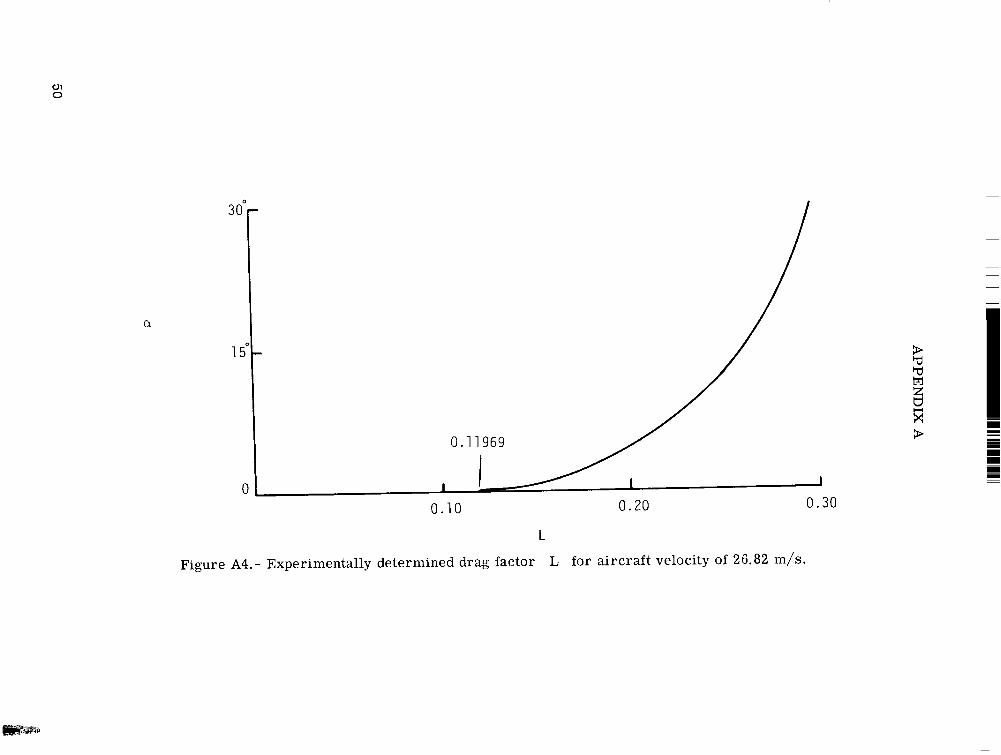
L Experimentally determined value for estimating air- Mea su red craft and swing-cable drag correction (see fig. A4)
g Acceleration due to gravity, m/s2 9.815
M Vertical distance from impact surface to a i rcraf t c.g. in pullback release position, m
V2M = B + -(1 + L)2g
P Angle of swing cables with aircraf t in pullback release position with respect to vertical reference, deg
A - Mp = Arc cos -C
N Horizontal distance from pivot points to a i rcraf t c.g. N = C sin p in pullback release position, m
0 Horizontal distance from aircraf t c.g. to alinement 0 = I s in ( p - a) target with ai rcraf t in pullback release position, m
P Horizontal distance from pivot points to a i rcraf t aline- P = N + O ment target with ai rcraf t in pullback release posi-tion, m
Q Vertical distance from alinement target to a i rcraf t c.g. Q = I COS ( p - a) in pullback release position, m
R Vertical distance from impact surface to alinement t a r - R = M - Q get with ai rcraf t in pullback release position, m
S Horizontal distance from pivot points to pullback point, m
s = - - -C 1.58 sin p tan p
Bcs Vertical distance from impact surface to a i rcraf t c.g. Bcs = B + 2 sin y
in cable-separation position, m
ycs Flight-path angle of a i rcraf t in cable-separation posi- ycs = Arc cos A -C
Bcs
tion, deg
Dcs Horizontal distance from pivot points to a i rcraf t c.g. in cable- separation position, deg
41
APPENDIX A
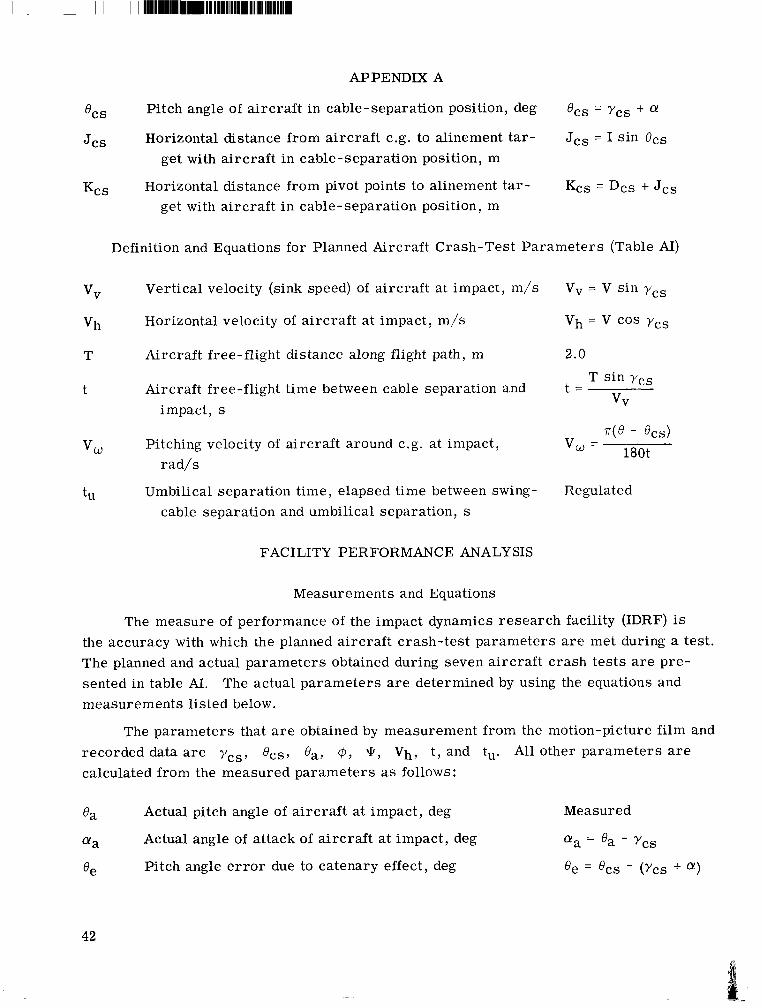
OCS Pitch angle of a i rcraf t in cable-separation position, deg Ocs = ycs + 01
Jcs Horizontal distance from aircraf t c.g. to alinement ta r - Jcs = I s in Ocs get with ai rcraf t in cable-separation position, m
Kcs Horizontal distance from pivot points to alinement t a r - Kcs = Dcs + Jcs get with ai rcraf t in cable-separation position, m
Definition and Equations for Planned Aircraft Crash-Test Parameters (Table AI)
V V Vertical velocity (sink speed) of a i rcraf t at impact, m/s Vv = V sin ycs
v h Horizontal velocity of a i rcraf t a t impact, m/s vh = v cos YCS
T Aircraft free-flight distance along flight path, m 2.0
t Aircraft free-flight t ime between cable separation and t = T s in ycs
impact, s VV
vu Pitching velocity of a i rcraf t around c.g. a t impact, rad/s
tU Umbilical separation time, elapsed time between swing- Regulated cable separation and umbilical separation, s
FACILITY PERFORMANCE ANALYSIS
Measurements and Equations
The measure of performance of the impact dynamics research facility (IDRF) is the accuracy with which the planned aircraf t crash-test parameters are met during a test. The planned and actual parameters obtained during seven aircraf t crash tes t s are presented in table AI. The actual parameters a r e determined by using the equations and measurements listed below.
The parameters that are obtained by measurement from the motion-picture film and recorded data are ycs, Ocs, ea, @, \k, Vh, t , and tu. All other parameters are calculated from the measured parameters as follows :
ea Actual pitch angle of a i rcraf t at impact, deg Measured
O1a Actual angle of attack of a i rcraf t a t impact, deg O1a = ea - YCS
ee Pitch angle e r r o r due to catenary effect, deg Oe = Ocs - (YCS + a)
42
APPENDIX A
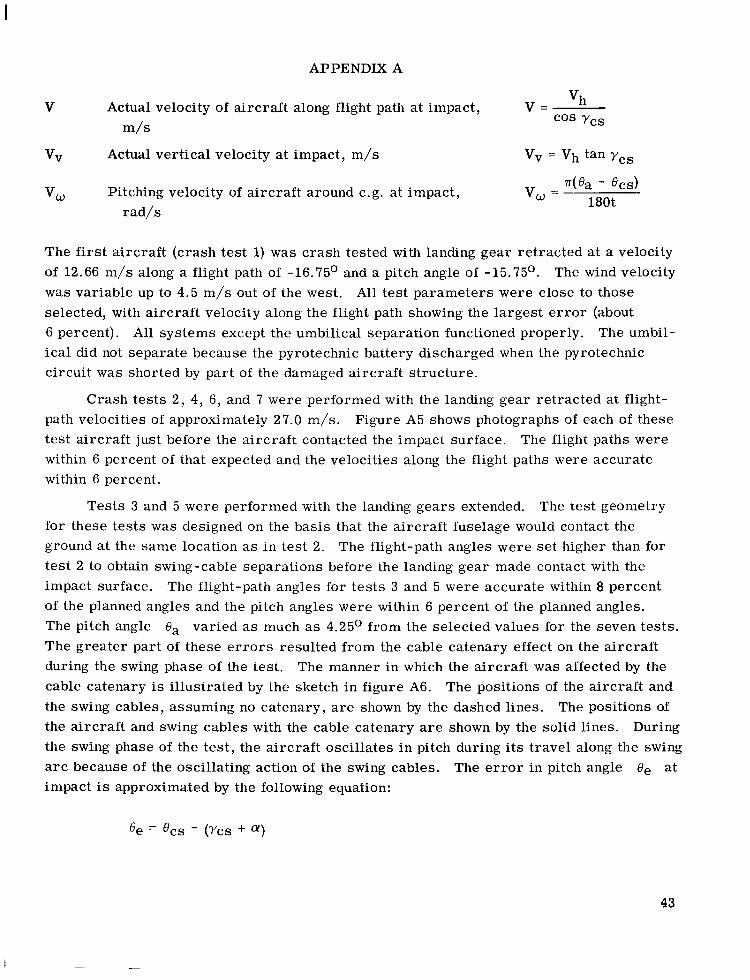
V Actual velocity of a i rcraf t along flight path at impact, V = vh cos Ycs
m/s
VV Actual vertical velocity at impact, m/s Vv = v h tan ycs
VW Pitching velocity of a i rcraf t around c.g. at impact, vw= n(Qa - ~ C S )
180trad/s
The first aircraft (crash tes t 1) was crash tested with landing gear retracted at a velocity of 12.66 m/s along a flight path of -16.75O and a pitch angle of -15.75O. The wind velocity was variable up to 4.5 m/s out of the wes t . All tes t parameters were close to those selected, with ai rcraf t velocity along the flight path showing the largest e r r o r (about 6 percent). All systems except the umbilical separation functioned properly. The umbilical did not separate because the pyrotechnic battery discharged when the pyrotechnic circuit w a s shorted by part of the damaged aircraf t structure.
Crash tes t s 2 , 4, 6, and 7 were performed with the landing gear retracted at flight-path velocities of approximately 27.0 m/s. Figure A5 shows photographs of each of these test a i rcraf t just before the aircraf t contacted the impact surface. The flight paths were within 6 percent of that expected and the velocities along the flight paths were accurate within 6 percent.
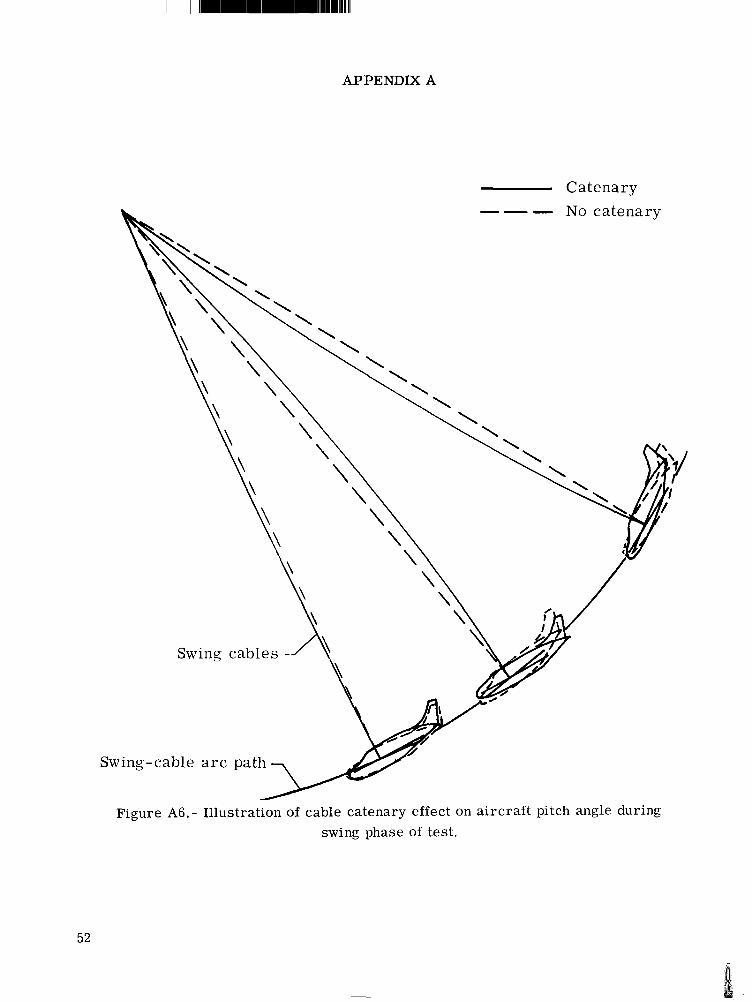
Tests 3 and 5 were performed with the landing gears extended. The tes t geometry for these tes ts w a s designed on the basis that the ai rcraf t fuselage would contact the ground a t the same location as in test 2. The flight-path angles were se t higher than for tes t 2 to obtain swing-cable separations before the landing gear made contact with the impact surface. The flight-path angles for tes ts 3 and 5 were accurate within 8 percent of the planned angles and the pitch angles were within 6 percent of the planned angles. The pitch angle ea varied as much as 4.25O from the selected values for the seven tests. The greater part of these e r r o r s resulted from the cable catenary effect on the aircraf t during the swing phase of the test . The manner in which the aircraf t w a s affected by the cable catenary is illustrated by the sketch in figure A6. The positions of the aircraf t and the swing cables, assuming no catenary, are shown by the dashed lines. The positions of the aircraft and swing cables with the cable catenary are shown by the solid lines. During the swing phase of the test , the a i rc raf t oscillates i n pitch during i t s travel along the swing arc because of the oscillating action of the swing cables. The e r r o r in pitch angle Be at impact is approximated by the following equation:
43
l l l l l l I
APPENDIX A
where OCs is the aircraf t pitch angle a t cable separation, ycs is the flight-path angle at cable separation, and CY is the selected angle of attack. (See table AI.) The greatest e r r o r observed as a result of catenary effect occurred during tests 4 and 6 and measured approximately 3.00. Another e r r o r of l e s s than l . O o is reflected in the pitch angle. This e r r o r w a s caused by a deviation from the calculated angular rotation of the aircraf t i n f ree flight.
There a r e two restoring forces which tend to alleviate the catenary effect. One is the centrifugal force generated as the aircraf t swings toward the impact surface (up to 2g for the tes ts shown in table AI). The second force is the aircraf t drag developed during the swing phase. This force is shown in table AI by the small pitch angle e r r o r Be for tes t s 3 and 5 performed with the landing gear extended. Test 7 also shows no catenary effect because of the flight path of -47.5'. At this flight-path angle, the swing cables were long, and the aircraf t and swing cables oscillated more slowly a t about 0.25 H z .
All a i rcraf t crash tests performed a t the facility are weather dependent. Wind velocities must be less than 4.5 m/s to insure maximum control of the aircraf t in order to obtain the desired test parameters within predetermined tolerances. Winds of greater velocity acting on the aircraf t can cause conditions which can result in larger e r r o r s in the aircraf t attitude at impact. During test 5 a southeast wind of about 8.5 m/s velocity was experienced. The wind caused roll and yaw angle e r r o r s of approximately 3 . 5 O and displaced the aircraf t 1.0 m laterally from the impact target. All other tes ts were made with wind velocities of less than 4 .5 m/s and the aircraf t experienced negligible roll and yaw e r ro r s . (See table AI.)
4 4
-----
- - - - - - - - - - ----- ----- -----
----- ----- ----- ----- ----- ----- ----- -----
----- - - - - -
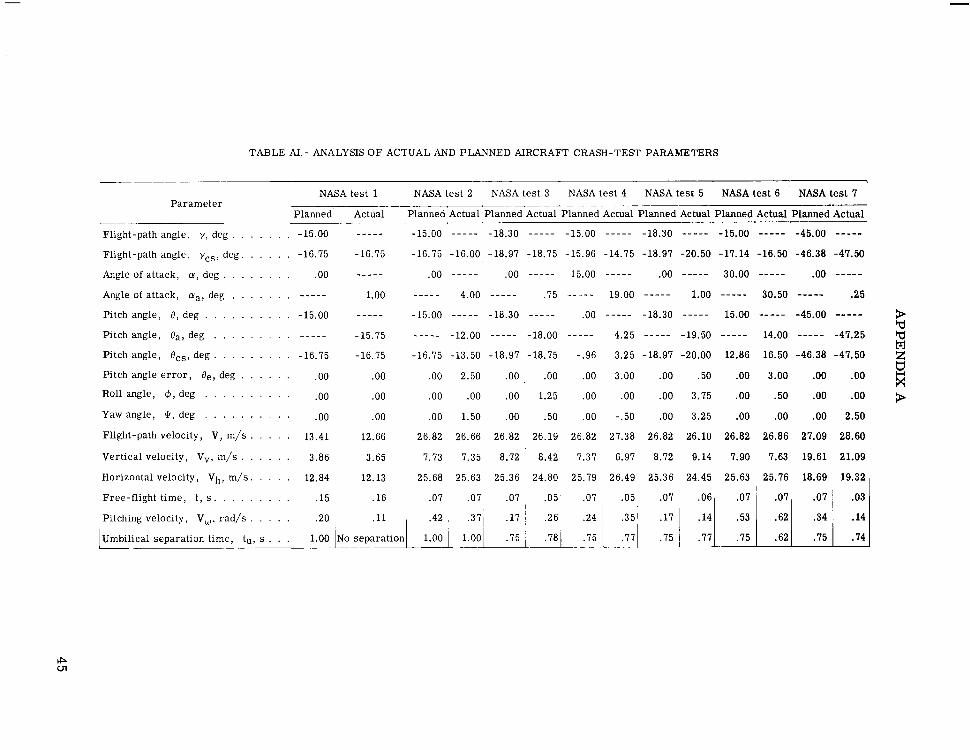
TABLE A I - ANALYSIS O F ACTUAL AND PLANNED AIRCRAFT CRASH-TEST PARAMETERS
NASA test 1 NASA tes t 2 NASA test 3 NASA test 4 NASA tes t 5 NASA t es t 6 NASA test 7 Parameter ___
Planned Actual Planned Actual Planned Actual Planned Actual Planned Actual Planned Actual Planned Actual
Flight-path angle, y , deg , . . . . . . -15.00 _ -__ - -15.00 _ _ _ _ _ -18.30 -15.00 -18.30 -15.00 -45.00
Flight-path angle, ycs , deg . . . . . . -16.75 -16.75 -16.75 -16.00 -18.97 -18.75 -15.96 -14.75 -18.97 -20.50 -17.14 -16.50 -46.38 -47.50
Angle of attack, CY,deg . . . . . . . . .OO -_ - - - 00 _ _ _ _ _ .oo 15.00 .oo 30.00 .oo
Angle of attack, cya, deg , . . . . . , 1.00 - - -_ - 4.00 _ _ _ _ _ .75 _ _ _ - - 19.00 1.00 30.50 .25
Pitch angle, 0, deg . . . . . . . . . . -15.00 _ - -_ ' V
Pitch angle, OCs, deg . . . . . . . . . -16.75 -16.75 -16.75 -13.50 -18.97 -18.75 -.96 3.25 -18.97 -20.00 12.86 16.50 -46.38 -47.50 MZ
Pitch angle e r r o r , 8,, deg . . . . . . .oo .00 .oo 2.50 .OO , .OO .OO 3.00 .OO .50 .OO 3.00 .OO .oo *Roll angle, a , deg . . . . . . . . . . .oo .00 .oo .OO .OO 1.25 .OO .oo .oo 3.75 .OO .50 .OO .oo Yaw angle, J ,deg . . . . . . . . . . .00 .00 .oo 1.50 .OO .50 .OO -.50 .OO 3.25 .OO .OO .OO 2.50
Flight-path velocity, V, m/s . . . . . 13.41 12.66 26.82 26.66 26.82 26.19 26.82 27.38 26.82 26.10 26.82 26.86 27.09 28.60
Vertical velocity, Vv, m/s . . . . . . 3.86 3.65 7.73 7.35 8.72 8.42 7.37 6.97 8.72 9.14 7.90 7.63 19.61 21.09
Horizontal velocity, v h , m/s . . . . . 12.84 12.13 25.68 25.63 25.36 24.80 25.79 26.49 25.36 24.45 25.63 25.76 18.69 19.32
Pitch angle, Ba, deg . . . . . . . . . _ _ _ _ _ -15.75 - - - -_ -12.00 - 18.00 4.25 _ _ _ _ _ -19.50 _ _ _ _ _ 14.00 ___---47.25 "d
Free-flight t ime, t , s . . . . . . . . . .15 .16 .07 .07 .07 .05' .07 .05 .07 .06, .07
Pitching velocity, Vu, rad/s . . . . . , .20 .ll .42 .37; .17 1 . 2 6 ~ .24 .351 .17
jUmbllica1 separation time, tu , s . . . 1.00 No separation 1 1.00 1.001 .75 1 ,781 .75 .77/ .75 __ _ _
8
Pivot points
\
A .tion
(a) Impact position and pullback release position.
Figure A1.- Aircraft crash-test geometry at impact dynamics research facility
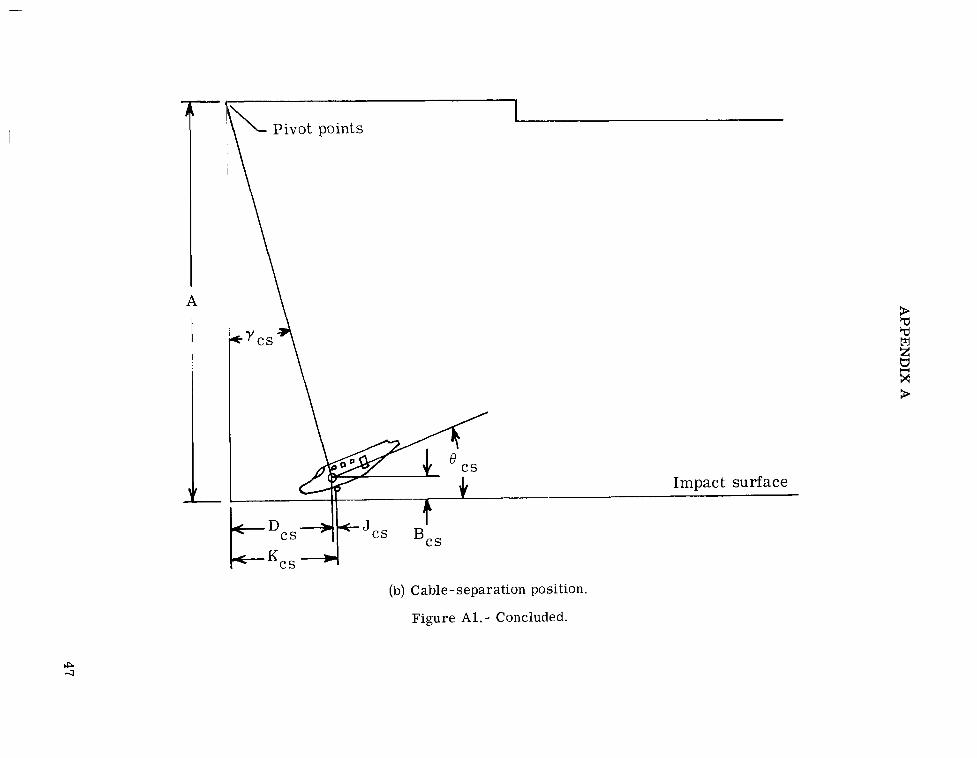
(b) Cable-separation position.
Figure A1.- Concluded.

Impact surface
Figure A2. - Typical a i rcraf t center-of-gravity location with respect to impact surface, pitch angle, and contact point. Dashed lines indicate various pitch angles a t impact position; dimension E is negative for positive pitch angles.
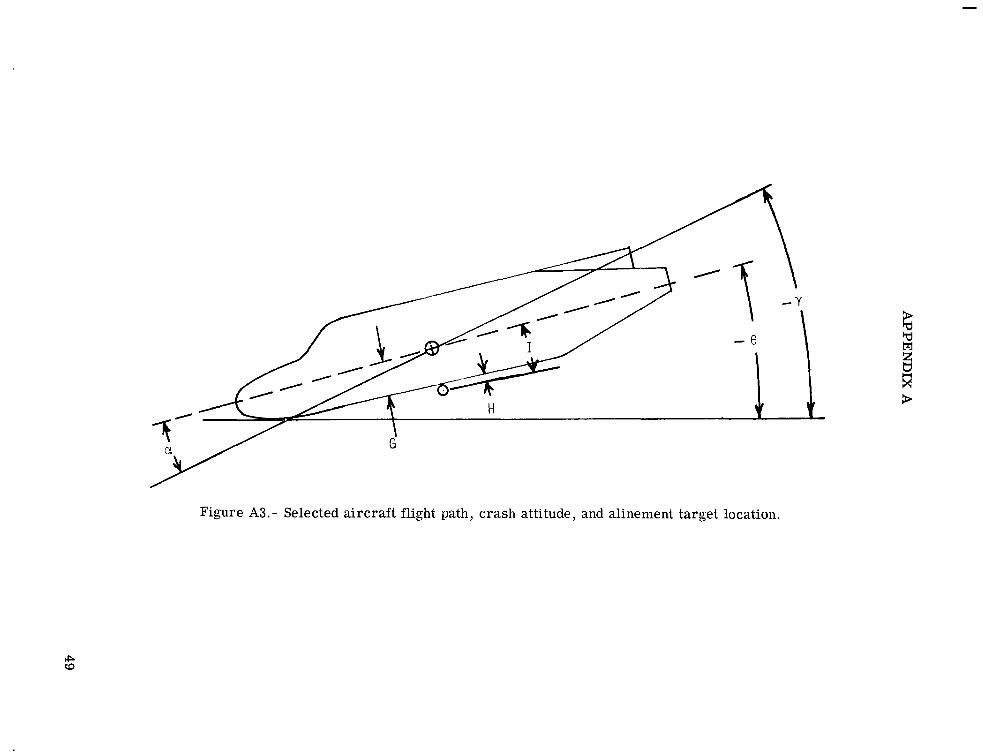
Figure A3.- Selected aircraft flight path, crash attitude, and alinement target location.
tn 0
a
0.10 0.20
L
Figure A4.- Experimentally determined drag factor L for aircraft velocity of 26.82 m/s.
0.30
-
-e-
(a) Crash test 2, 8 = -12O. (b) Crash test 4 , 8 = 4.25O.
A_
(c) Crash test 6, 8= 140. (d) Crash test 7 , 8= -47.250. L-76-132
Figure A5. - Photograph showing aircraft crash attitudes for four crash tests.
- - -
I I I lI~1111~~111111111111l
APPENDIX A
Catenary No catenary
Figure A6.- Illustration of cable catenary effect on aircraf t pitch angle during swing phase of test.
52
APPENDIX B
TEST OPERATIONS - PHASE ONE
Aircraft Crash-Test Preparation
After the aircraft is assembled with wings, empennage (or simulated mass as replacement), engines and mounts, and landing gear the following work must be done to prepare the aircraf t completely for a crash test. This work is typical and is meant only as a reference to be used as a guide to meet the requirements for the facility and test. This a i rc raf t preparation usually takes about 6 weeks to complete. (Items are not necessarily in order . )
(1) Prepare landing gear for pneumatic operation. Drain hydraulic fluid i f necessary and extend all hydraulic lines for gear and door operation outboard of port engine at trailing edge of wing.
(2) Lock all control surfaces in desired position.
(3) Paint a i rcraf t and outline aircraf t fuselage frame on exterior of fuselage. Paint on zero water line.
(4) Install swing-cable attachment hard points.
(5) Install pitch-cable attachment hard points.
(6) Install umbilical attachment plate.
(7) Install camera mounts.
(8) Install accelerometer blocks.
(9) Install mounts for instrumentation junction box, batteries, and pyrotechnic programer.
(10) Install sea ts and restraint systems and simulated dummies and seats i f necessary.
(11) W i r e interior for photographic lighting, camera controls, instrumentation, and pyrotechnic system without pyrotechnics.
(12) Install instrumentation junction box and check all wiring.
(13) Install instrumented dummies.
(14) Install cameras , batteries, pyrotechnic programer and associated apparatus.
(15) Perform a preliminary weight and balance of aircraft.
53

APPENDIX B
(16) Check out pyrotechnic wiring circuits and camera circuits.
(17) Install accelerometers, connect umbilical, and check all circuits. Disconnect umbilical.
54 NASA-Langley, 1976 L-10514