Embed Size (px)
Citation preview
CERTIFICATION
This is to certify that the entire content of this project work was carried out to completion
by my humble self Fuh Sharon Bih, Mat No. 0000161/UCT/SE/CCE/06, for the award of
a Bachelors Degree (BSc) in the department of Journalism and Mass Communication of
the Faculty of Social and Management Sciences of the University of Buea.
Fuh Sharon Bih ____________ ____________ (Candidate) SIGN DATE
Dr Che Tita ____________ ____________ (Supervisor) SIGN DATE
i

DEDICATION
This piece of work is dedicated to the Almighty God for giving me wisdom and showing
me the way out of it. I equally dedicate it to my beloved mother Mrs. Labah Florence for
her tremendous and relentless support to the realization of my studies and this project.
ACKNOWLEDGEMENT
This research project will not carried out without the support of my supervisor Dr Che
Tita, who gave me the topic and followed up closely to make sure I did not go out of
ii
track. I also want to laud the efforts of my elder brother Fuh Anold for his continuous
support. I cannot neglect the God sent William Esapebong who fitted into my shoes when
I thought things were getting too tough for me especially at the final stages of my project.
I equally appreciate the efforts of my entire family members, and friends who followed
me up at each step of the way to make sure this study was accomplished. For those
whose names have not been mentioned here, be rest assured that I appreciate your
enormous support from day one of my entry in UB till these last days. God Bless You.
ABSTRACT
Communication between students and teachers has always been an important aspect of
academia. Many aspects of student-teacher interaction have been researched, but little
academic research has focused on student-teacher interaction occurring within social
networking sites. The ability to understand and interpret student-teacher interaction is a
primary concern for educators, and the increased use of social networking sites has
recently complicated student-teacher interaction.
iii

The purpose of this study was to begin research based on students’ perceptions of
student-teacher interaction on the social networking site Facebook. Specifically, the study
focused on whether interaction on Facebook between students and teachers could
increase the social dimension of the student-teacher relationship. The study focused on
understanding the role a teacher’s sex and age plays in student-teacher interaction on
Facebook. Additionally, the research examined student perceptions regarding whether
students or teachers should initiate interaction on Facebook. Finally, the study allowed
students to share their ideas regarding what types of information teachers should and
should not share with students through Facebook. Although few significant results were
found, the results indicated that students were open to a small increase in student-teacher
interaction on Facebook, but that such interaction should remain mostly task oriented.
Discussion of the results and suggestions for future research are also provided.
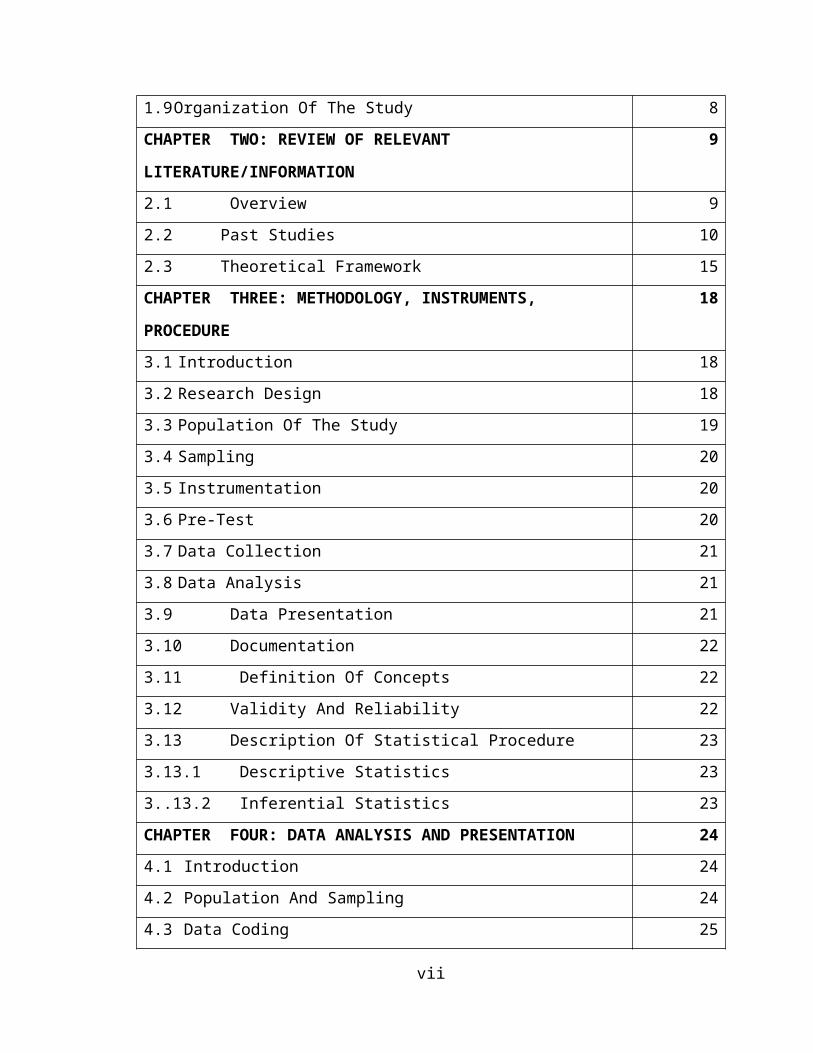
TABLE OF CONTENTS
Page Number
Certification i
Dedication ii
Aknowledgement iii
Abstract iv
Table of Contents v-vii
CHAPTER 0NE: INTRODUCTION 1
1.1 Introduction / Overview 1 -2
1.2 Background Of The Study 3-5
iv
1.3 Statement Of The Problem 5-6
1.4 Research Questions 6
1.5 Hypothesis 7
1.6 Objectives 7
1.7 Significance Of The Study 8
1.8 Scope Of The Study 8
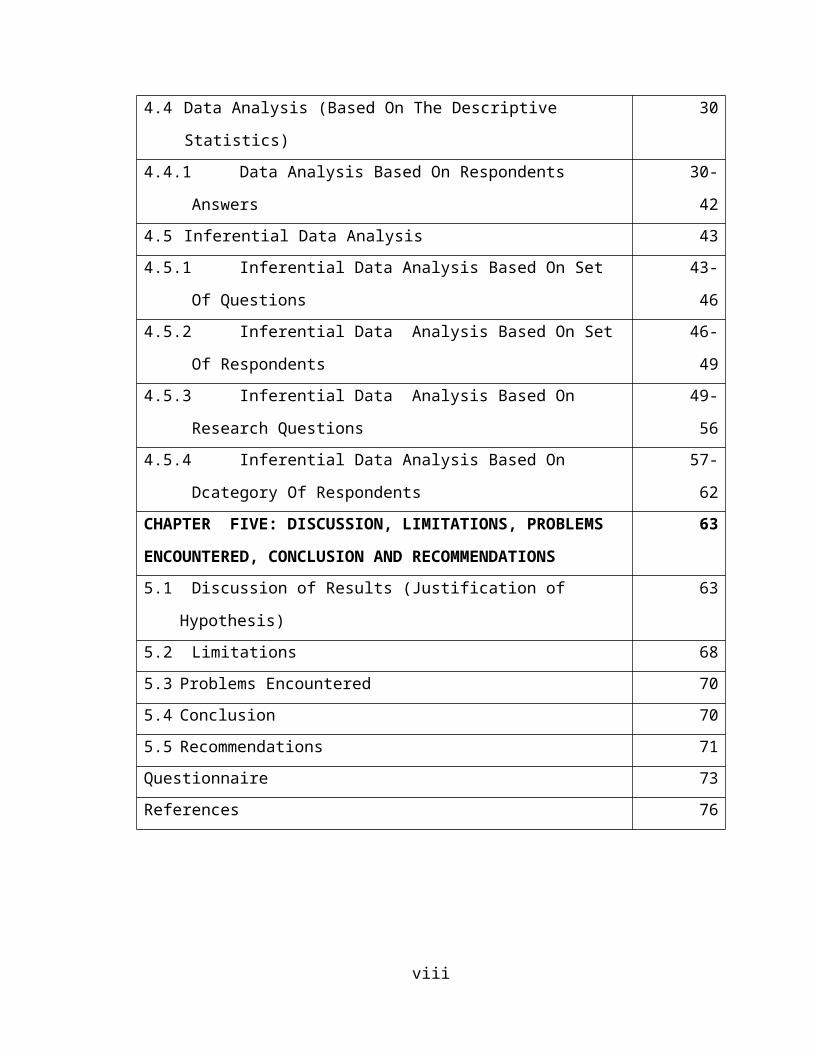
1.9 Organization Of The Study 8
CHAPTER TWO: REVIEW OF RELEVANT
LITERATURE/INFORMATION
9
2.1 Overview 9
2.2 Past Studies 10
2.3 Theoretical Framework 15
CHAPTER THREE: METHODOLOGY, INSTRUMENTS,
PROCEDURE
18
3.1 Introduction 18
3.2 Research Design 18
3.3 Population Of The Study 19
3.4 Sampling 20
3.5 Instrumentation 20
3.6 Pre-Test 20
3.7 Data Collection 21
3.8 Data Analysis 21
3.9 Data Presentation 21
3.10 Documentation 22
3.11 Definition Of Concepts 22
3.12 Validity And Reliability 22
3.13 Description Of Statistical Procedure 23
3.13.1 Descriptive Statistics 23
3..13.2 Inferential Statistics 23
CHAPTER FOUR: DATA ANALYSIS AND PRESENTATION 24
4.1 Introduction 24
v
4.2 Population And Sampling 24
4.3 Data Coding 25
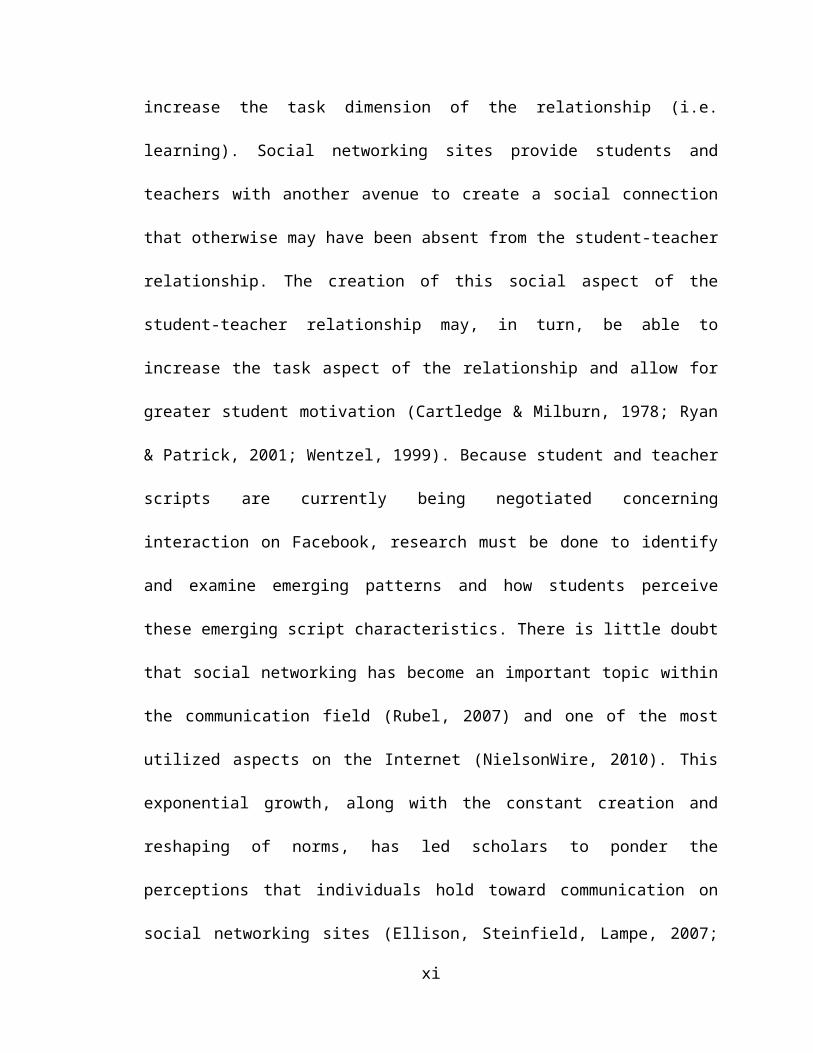
4.4 Data Analysis (Based On The Descriptive Statistics) 30
4.4.1 Data Analysis Based On Respondents Answers 30-42
4.5 Inferential Data Analysis 43
4.5.1 Inferential Data Analysis Based On Set Of Questions 43-46
4.5.2 Inferential Data Analysis Based On Set Of Respondents 46-49
4.5.3 Inferential Data Analysis Based On Research Questions 49-56
4.5.4 Inferential Data Analysis Based On Dcategory Of Respondents 57-62
CHAPTER FIVE: DISCUSSION, LIMITATIONS, PROBLEMS
ENCOUNTERED, CONCLUSION AND RECOMMENDATIONS
63
5.1 Discussion of Results (Justification of Hypothesis) 63
5.2 Limitations 68
5.3 Problems Encountered 70
5.4 Conclusion 70
5.5 Recommendations 71
Questionnaire 73
References 76
vi
CHAPTER ONE
INTRODUCTION
1.1 Introduction/Overview
Communication between students and teachers has always been an important aspect of
academia. Many aspects of student-teacher interaction have been researched, but little
academic research has focused on student-teacher interaction occurring within social
networking sites. The ability to understand and interpret student-teacher interaction is a
primary concern for educators, and the increased use of social networking sites has
recently complicated student teacher interaction. While student-teacher interaction is
unique in that the relationship has defined conditions on which it is based (within an
vii
academic institution and predetermined power dynamics), there are aspects of the
interaction that coincide with most interpersonal relationships. By increasing the social
dimension of the relationship, teachers may also be able to help students increase the task
dimension of the relationship (i.e. learning). Social networking sites provide students and
teachers with another avenue to create a social connection that otherwise may have been
absent from the student-teacher relationship. The creation of this social aspect of the
student-teacher relationship may, in turn, be able to increase the task aspect of the
relationship and allow for greater student motivation (Cartledge & Milburn, 1978; Ryan
& Patrick, 2001; Wentzel, 1999). Because student and teacher scripts are currently being
negotiated concerning interaction on Facebook, research must be done to identify and
examine emerging patterns and how students perceive these emerging script
characteristics. There is little doubt that social networking has become an important topic
within the communication field (Rubel, 2007) and one of the most utilized aspects on the
Internet (NielsonWire, 2010). This exponential growth, along with the constant creation
and reshaping of norms, has led scholars to ponder the perceptions that individuals hold
toward communication on social networking sites (Ellison, Steinfield, Lampe, 2007;
Mazer, Murphy, Simonds, 2007; Mitchell & Watstein, 2007; Patton, 2007; Pempek,
Yermolayeva, Calvert, 2008; O’Malley, 2010). There are a number of prominent social
networking sites, such as MySpace, LinkedIn, Twitter, Friendster, and Facebook.
Facebook, which began solely for the use of individuals in academia, provides an optimal
base for student-teacher interaction because of the site’s increased popularity among
college students.
Over time, some norms have been created and maintained between peers on social
networking sites and these norms have helped individuals follow and understand some
viii

basic guidelines while communicating. Consequently, some of the issues surrounding
communication on social networking sites has already been questioned and researched.
However, one aspect that has been overlooked is interaction between students and
teachers on social networking sites. With the increase in non-students using social
networking sites—almost 51 percent of adults have a profile on at least one social
networking site—the chances of students and teachers to interact on social networking
sites has also increased (O’Malley, 2010). This area deserves consideration because the
increase of teachers participating in social networking has brought forth areas of
frustration concerning interaction between students and teachers (Glater, 2006; Lipka,
2007).
1.2 Background Of The Study
Facebook is a Social Networking Site used as a linked collection of Web pages that
allow members to communicate with one another. It was launched in February 2004,
owned and operated by Facebook Incorporated. Google scholar on the other hand defines
Facebook as a social networking website intended to connect friends, family, and
business associates. It is the largest of the networking sites, with the runner up being
MySpace. As of September 2012; Facebook has over one billion users with more than
half of them using it on a mobile device. It began as a college networking website and has
expanded to include anyone and everyone.
This outstanding website was founded by Mark Zuckerberg with his college roommates
and fellow Harvard University students; Eduardo Saverin, Andrew McCollum, Dustin
Moskovitz and Chris Hughes. At that time, it was available only to schools, universities,
ix

organizations and companies but as years go by, its usage increases geometrically. It
became open to the public in 2006 with over 70% of the users living outside the United
States and half of these users are non university students.
Facebook users create a profile page that shows their friends and network information
about themselves. This profile typically includes: information, status, photos, notes,
groups and the Wall. It is equally used to share opinions, put up adverts and
communication messages for companies in and out of crises.
Facebook offers a range of privacy options to its members. A member can make
all his communications visible to everyone, he can block specific connections or he can
keep all his communications private. Members can choose whether or not to be
searchable, decide which parts of their profile are public, decide what not to put in their
newsfeed and determine exactly who can see their posts. For those members who wish to
use Facebook to communicate privately, there is a message feature, which closely
resembles email.
In May 2007, Facebook opened up its developers' platform to allow third-party
developers to build applications and widgets that, once approved, could be distributed
through the Facebook community. In May 2008, Facebook engineers announced
Facebook Connect, a cross-site initiative that allows users to publish interactions on
third-party partner sites in their Facebook newsfeed.
It has a speedy growth with professors and students being at the spotlight. Definitely, the
communication flow is between professors and their students who have a higher SES to
afford and use Facebook.
x
As long as the usability increases, student-teacher interaction steps up considering the
fact that communication with students is one reason for professors to register to
Facebook. (Hewitt & Forte, 2007).
Stutzman (2006) reported that 90% of the undergraduate students in his study indicated
that they use Facebook. Fogel and Nehmad(2009) also reported that more than ¾ (78.6%)
of their participants in their research done at a four-year undergraduate college had
created a Facebook profile.
Therefore, while there may be other online environments and tools to promote social
learning, it makes sense to utilize Facebook as higher education tool because students are
already engaging in this online environment. In the same light, the department of
Journalism and Mass Communication of the University of Buea has a Facebook account
dubbed ASJUB.com. It is a group created to bring lecturers and students on a platform to
share opinions and ideas. Most of the lecturers pose as mediators to regulate and gate
keep information on this page. In the same way, some announcements and assignments
are put up by lecturers on this page. These strengthens and also strains the relationship
between teachers and students as some exchange messages with their teachers or write
offensive messages on The Wall hence violating one of the laws of journalism which is
gate keeping.
Apart from using this account, lecturers as well as students explore each others’ personal
profile either to poke, exchange messages, comment on each others’ Wall or
photos .Margaret Hartmann(2009) reported that some educators use Facebook to
communicate with students about school work and engage those who do not find it
comfortable speaking up in class.
xi
If schools want to keep all online relationships appropriate, they have to teach students
and teachers how to do that, rather than trying to ignore that technology is becoming
more and more integrated into our lives. Someday students are going to be emailing
college professors and getting friend requests from co-workers. They should learn
beforehand that they need to master the "reply all" button, watch the text speak in emails
to bosses, and not post Facebook updates about their Ferris antics when they've called in
sick. As for teachers, it seems like half of the incidents in the past year could have been
avoided if someone explained how privacy settings work, or just impressed upon them
that nothing they post is ever really totally private. No teacher wants their students to get
a hold of photos of them playing in college, but with new technologies available, many of
us need help figuring out how to keep the professional and the personal separate online.
1.3 Statement Of The Problem
Facebook, a popular social networking site, provides educators with new possibilities for
reaching their students. It is one of the most used social media in the world wherein
people get to make friends and exchange messages. As these technologies are new, there
is not a total understanding of how these technologies could best be used in education.
Students as well as teachers constitute the majority of Facebook users within and out of
the academic milieu. It provides opportunities for teachers and students to interact in new
ways but the guideline and expectations for behaviour have not been clearly defined. As
there are a number of unresolved issues related to integrating Facebook into education,
this study will therefore provide a better understanding of what students find appropriate
as far as student –teacher interaction on Facebook is concerned. As long as Facebook
xii
remains a platform for interaction to many, the question is that is it justifiable for students
to exchange messages with their teachers, poke on their wall or comment on their photos?
1.4 Research Questions
The research seeks to understand what students find appropriate in student- teacher
interaction on Facebook. Thus, the following research questions can be used to
breakdown the idea.
Does students’ knowledge of Facebook have an impact on student-teacher
interaction?
Which interactive behaviors are most appropriate between students and
teachers?
What interactive behaviors of teachers are most welcoming to students?
1.5 Hypotheses
H0. The use of Facebook as an interactive medium between teachers and students
ameliorates their relationship in the academic milieu.
H1. The use of Facebook as an interactive medium between teachers and students does
not ameliorate their relationship in the academic milieu.
Test of Hypothesis: Chi Square goodness-of-fit test will be used to validate either of the
hypotheses, because the test involves nominal data such as yes, no, no idea, or agree,
disagree, neither agree nor disagree.
Distribution; Chi Square goodness-of-fit distribution will be used to guide the test.
1.6 Objectives
xiii
This research has four main goals to exploit and come out with tangible factors to debunk
the research problem. They are as follows:
The study will enable us understand if Facebook is an appropriate medium for
teachers and students to interact?
Our minds will equally be opened to understanding the effects of student- teacher
interaction on Facebook on students’ intellectual upbringing
We will understand if students can differentiate good from bad interactions with
their teachers on Facebook.
Furthermore, we will assess the impact of Facebook on student-teacher
relationship?
1.7 Significance Of The Study
In as much as this study has its goals to accomplish, the implications are diverse. On a
theoretical framework, this research is a Public Relations study aimed at understanding
how students and teachers use a social media platform to create an image for themselves.
At the end, the following aspects will be realized:
This piece of work will serve as groundwork for further research by scholars.
It will help change peoples’ perception of interaction between teachers and
students on Facebook.
From the study, students and teachers may restructure their interaction on
Facebook.
The study will help people understand how Facebook can strengthen Public
Relations.
xiv
1.8 Scope Of Study
In the quest to understand what students find appropriate in student- teacher interaction
on Facebook, the study will be limited to the University of Buea. Also, out of all the
social media in the internet, Facebook is the sphere of influence because most of the
students in this University community are most exposed to Facebook than any other
social media. Most, if not all of the students interact with their teachers on Facebook and
can identify what is appropriate in student-teacher interaction on Facebook.
1.9 Organization Of The Study
This study is divided into five chapters comprising of chapter one which is the General
Introduction, chapter two is Literature Review, chapter three, Methodology, chapter four
will be Data Analysis and Interpretation. The last but not the least chapter will be chapter
five which is the conclusion and recommendations for this study.
CHAPTER TWO
REVIEW OF RELEVANT LITERATURE
2.1 Overview
Emerging technologies, especially those referred to as Web 2.0 technologies, change the
way people access, interact with, create and share data and information (Ajjan &
Hartshorne; 2008, Dearstyne; 2007; Maloney; 2007, Robbie & Zeeng;2008). This change
is taking place due to the emergence of such online technologies as weblogs (blogs),
xv

wikis, and social networking sites (SNS) as well as new mobile hardware capabilities for
accessing these online technologies. These emerging technologies have the potential to
significantly impact education.
An example of a web 2.0 technology with the potential to positively impact education are
social networking sites such as Facebook, MySpace, Flickr and YouTube. These
technologies allow users to create personal profiles for themselves as well as connect,
network, and interact with family, friends, and others with similar interests. Cardon
(2009) provides numbers that illustrate just how prevalent the use of SNS has become,
reporting that nine SNS boast over 50,000,000 registered users. Topping the list is
Facebook with over 2 billion registered users, followed by Windows Live Spaces with
120,000,000. The numbers continue to grow with Facebook recently advertising over
200,000,000 potential registered users.
SNS promote social interaction between individuals, potentially supporting active
learning, social learning, and student knowledge construction within a student-centered,
constructivist environment. (Ferdig, 2007) According to Vygotsky’s theory, known as
socio-cultural perspective, cognitive growth is influenced by society and culture and not
performed in isolation (Driscoll, 2005; Omrod, 2004). Omrod argues that knowledge
construction may occur as an independent activity of the individual or when individuals
work together (known as social construction). Clark and Peterson (1985) claim teachers
and their beliefs may play a major role in education reform since teachers’ beliefs lead to
actions and these actions impact students. Since their beliefs may impact their actions,
teachers’ beliefs play a critical role in restructuring science education.
xvi

The largest number of Facebook users was cited previously, and among higher education
Students its use appears to be even more widespread. (Ellison, 2008; Milshtein, 2007)
2.2 Past Studies
According to Margaret Hartmann (2009), in the past years people have proven that they
have a truly undeniable urge to say and do stupid things on Facebook, and that includes
plenty of teachers. Educators have been disciplined, let go, or even arrested for things
they posted online, even when they had little to do with their students. Now schools
across the country are trying to combat the problem by issuing new guidelines that ban
teachers from private communications with kids through social networking sites. The
intention is to protect both teachers and students, but the new rules may be punishing
those who use the technology effectively rather than just a handful of idiots and sleaze
balls that shouldn't be in a classroom.
In understanding student-teacher interaction on Facebook and what students
find appropriate, a lot of research findings have been written in text for further research.
As Facebook gains fertile grounds in the academic milieu worth understanding is what
other people perceive of this particular issue. Before proceeding to understand what
students find appropriate in student- teacher interaction on Facebook, it is extremely
necessary to know what appropriate student – teacher interaction is.
A recent research carried out by Brehane Teclehaimanot and Torey Hickman, Facebook
provides opportunities for teachers and student to interact in new ways, but the guidelines
and expectations for behaviour have clearly been defined. Hewitt and Forte (2006)
reports that many students did not want to have a social relationship with their professors,
xvii
but preferred to keep it professional. Brehane and Torey further asserted that the
popularity of Facebook among college students might have its roots in the founding of
the network as a site designed for college students. At its inception in 2004, Facebook
required all users to register using an email address ending in .edu. While faculty and
staff might also receive .edu.email address, they did not join Facebook in large numbers
because they were yet to get acquainted to the system. On one hand, there appeared to be
a large number of students who did not find Facebook as an appropriate medium for
student-teacher interaction. These were especially female students. On the other hand,
there was the potential for improved student attitude towards their teacher which could
translate a more positive educational experience. In order to effectively utilise Facebook
as a tool to create social learning opportunities, teachers must understand how to interact
with their students in a way that promotes the improved positive perception of the teacher
and classroom environment while not engaging in behaviours that might harm these
perceptions.
Social media has allowed students and teachers to interact in new ways that some
say helps extend education beyond the classroom, but a new Missouri law views the
situation differently. Governor Jay Nixon (D) signed Missouri Senate Bill 54 into law on
July 14th. The law, which is also known as the Amy Hestir Student Prevention Act,
aims to protect students from sexual harassment. It has become known as the “Facebook
Law” in recent weeks due to a portion of the bill that forbids teachers and students from
communicating through social networks and other websites that allow private one-on-one
contact. The two sentences in questions (from the 35 page long bill) read as follows:
xviii
- No teacher shall establish, maintain or use a work-related Internet site unless such
site is available to school administrators and the child's legal custodian, physical
custodian or legal guardian.
- No teacher shall establish, maintain or use a no work-related Internet site which
allows exclusive access with a current or former student.
This roughly means that teachers and students cannot be friends on Facebook, follow
each other on Twitter or connect through any other form of social media that would allow
them to communicate privately.
Teachers are still allowed to create public Facebook Pages, which anyone can
view and “Like” without becoming friends with the creator of the page.
Educators, coaches, band directors and others who might interact with students
can use these pages to disseminate information without violating the law because
such pages can be viewed by the wider public.
Despite the ability to create these pages, the law has sparked controversy among
educators who say it diminishes their ability to reach students outside the classroom and
limits learning opportunities in many other ways. Social media is not the only
communication method affected. Students can also no longer instant- message their
teachers, and email is subject to review by parents and administrators.
Cheri Simonds, a professor of Communications at Illinois State University, has studied
communication between students and teachers. "This concept of teacher immediacy
(approachability, availability and warmth) has been widely studied," Simonds told
xix
the Huffington Post. "Facebook is an avenue for establishing immediacy with students on
their level." He concluded
State Senator Jane Cunningham (R - West County), one of the sponsors of the
Missouri senate bill, said lawmakers are merely trying to make student-teacher
communication safer for all involved by keeping it open.
"We are by no means trying to stop communication, just make it appropriate and make it
available to those who should be seeing it." "Exclusive communication is a pathway into
the sexual misconduct.” Cunningham affirmed.
Still, educators and researchers like Simonds worry that the law will have unintended side
effects. Teachers may begin to shy away from all out-of-class communication with their
students for fear that it could be deemed illegal. As a result, students will lose the
educational benefits that come with being in touch with their instructors, especially
because social media outlets like Facebook and Twitter are such popular platforms for
distributing information and engaging with others. It is also apparent that although
university students make up a large proportion of the SNS user population, other
demographic groups are becoming increasingly active in these cyber-communities. In
addition to Facebook and Myspace, posting tweets on Twitter have become extremely
popular. Tweets are short text based posts that are used for the rapid dissemination of
real-time information. Although this medium has been used to communicate important
information in volatile social-political situations (e.g., political demonstration as a result
of the most recent election in Iran), many Tweets contain relatively mundane status
xx
updates or information about the Tweeter. Regardless of the purpose, the contents of the
tweet can now be accessed when conducting a standard online Google search.
In line with the Mussori Bill, many argue that the bill assumes the worst of
teachers and unfairly calls student-teacher communication into question. It presumes that
any teacher and student who interact outside of the typical classroom setting may be
involved in misconduct. Supporters of the bill say there are numerous methods for
publicly communicating online that teachers and students can pursue. Blogs, Facebook
Fan Pages and message boards can serve the purposes of educators while eliminating the
possibility of private, inappropriate contact.
The New York Times reported a similar article in response to various incidents.
School boards in at least 12 states across the country updated their social media policies
during the first semester. Some told teachers they could not post photos of themselves
using alcohol and drugs, and others said there should be absolutely no fraternization with
students online.
Schools were particularly sensitive to the issue since in several recent cases of
teachers abusing students, it was revealed that the inappropriate relationship started out
with hundreds of text and Facebook messages before becoming physical. This greatly
distorts the purpose for which Facebook was intended.
Missouri school districts must independently implement a policy that conforms to the
new law. Before then, however, the law may come under fire from groups like the
ACLU or others who believe it goes too far in limiting speech. Others question how
anyone could hope to police such a law and point out that those who engage in a
xxi
questionable relationship are still likely to do so in other private means, which parents
and administrators cannot easily detect . Whether anyone will challenge the law in court
and how exactly it will be implemented remains to be seen.
2.3 Theoretical Framework
In order to fully ascertain this study various mass communication theories are necessary.
These theories were propounded by communication scholars who sought to understand
the effects of the media on its audience. Facebook being a social media is not left out.
The idea of this study being how appropriate students find student teacher interaction can
be simplified by the following communication theories.
Knowledge Gap Hypothesis (Philip J. Tichenor et al,1970)
Specifically, the hypothesis predicts that ; as the infusion of mass media
information into a social system increases, higher socio- economic status segments tend
to acquire this information faster than lower socio-economic status population. This
therefore creates the gap in knowledge between the two which tends to increase rather
than decrease. According to this theory, we will be finding out how student-teacher
interaction on Facebook is perceived by some students over the others.
- Agenda Setting Theory (Max McCombs and Donald Shaw,1968)
These two communication scholars came out with findings on how the mass
media determines what its audience should think or worry about. They later on
discovered that it is not only the media that sets the agenda but the audience as
well as policies set agendas for the media. In this study we will be able to find out
xxii
how Facebook determines what students and teachers should think or worry
about.
- Technology Acceptance Model (TAM) (Davis, 1989)
This is an information system theory that models how users come to accept and
use a technology. The model suggests that when users are presented with a new
technology, a number of factors influence their decision about how and when they
will use it. We will therefore be finding out how teachers and students have
accepted and use Facebook. In the same way, we will understand the factors that
determine student- teacher interaction on Facebook.
- Uses and Gratifications Theory (UGT) (Blumler and Elihu Katz)
It is an approach to understanding why and how people actively seek out specific
media to satisfy specific needs. UGT is an audience-centered approach to
understanding mass communication. Divergent from other media effect theories
who question “what media do to people, UGT focuses on what people do with
media. The driving question of UGT is: Why do people use media and what do
they use them for? In this study we will be finding out why students and teachers
use Facebook for interaction.
xxiii
CHAPTER THREE
METHODOLOGY, INSTRUMENTS, PROCEDURE
3.1 Introduction
This chapter will clearly describe the methods, instruments, and procedures that will be
adopted or used by the researcher in carrying out the study. They include:
- Research Design
- Population of Study
- Sampling Technique
- Instrumentation
- Pre-Test
- Collection of data
- Data Analysis
xxiv
- Data Presentation
- Documentation
- Definition of Concepts
- Validity and reliability
- Description of statistical procedure
3.2 Research Design
Research design is the blueprint for fulfilling objectives and answering questions. There
are various types of research method amongst which include content analysis, survey and
experimental design and for this study we will use the survey research method. This will
require the researcher to design and administer questionnaires face to face with
respondents. Then, we will assess what students definitely find appropriate when students
and teachers interact on Facebook and by so doing proposals may be advanced in order
for them to improve or adjust their mode of interaction on this medium.
The structure of the research is depicted in the table below.
Activity March April May June
Topic collection XXXXXXX
Proposal Development XXXXXXXXX
Administration of
Questionnaires
XXXXXXXXXX XXXXXXXX
Collection of
Questionnaires
XXXXXXXX
xxv
Data Analysis and
Presentation
XXXXXXXX
Write-up and
Submitting of Final
copy
XXXXXXXX XXXXXXX
Table 3.1 Shows the research design
3.3 Population Of Study
The population under study will be students of the University of Buea. The reason for
choosing them is that they understand and use Facebook on a day to day basis. They can
equally determine what is appropriate in student-teacher interaction of Facebook due to
their level of education. Another reason why the study is limited just to this University is
because the cost of transportation to administer questionnaires in other Universities will
be too high for me to foot.
3.4 Sampling
The sampling technique is purposive stratified random sampling. Of all the students
involved in the study, not only those in departments operating a Facebook account will be
expected to participate but those who use or know Facebook will be indispensable to the
study. This is because with their exposure to this site, they are versed with the system and
can determine what is appropriate for students to discuss with their teachers on Facebook.
In the same way, the level of students under study are University students so it would be
unheard of to use secondary or high school students because very few of them interact
with their teachers on Facebook.
xxvi
3.5 Instrumentation
The research will be carried out in the University of Buea and the instruments to be used
for data collection will be questionnaires as well as the collection of primary data from
the field. These questionnaires will be designed by the researcher with the help of the
supervisor. The items of the questionnaires will be open and close ended questions. The
use of interviews and an observation checklist will be used as the secondary source
through which information will be gotten.
3.6 Pre-Test
The questionnaires were pre-tested with some students prior to proper administration in
order to do all necessary corrections. This was also done to make sure if the variables
were correctly presented and answered the research questions. Ten questionnaires were
given out to be pre-tested and fortunately no questions were changed.
3.7 Data Collection
For the collection of data, a literature review of past and present journals and books as
well as other write-ups will be consulted. Other data collection tools that will be used will
be questionnaires, Interviews and observation checklist.
3.8 Data Analysis
Data for this research will be collected basically from two sources that is the primary and
secondary sources. Data from the primary source will be questionnaires that will be
distributed, interviews, and personal observations. While the secondary will be data
xxvii
collected from the books, and other material related to the topic. It will be analyzed using
both descriptive and inferential statistics.
3.9 Data Presentation
Data that will be collected from the field will be coded and presented in charts including;
pie charts, bar charts, and frequency tables as well as any other method that is used in
presentation of data.
3.10 Documentation
After a proper analysis and presentation of data and collection from the field, the research
will -be documented as a confirmation that the data that was collected was gotten from
the right sources and that no form of corruption was done by the researcher. The
documentation will be very essential because it will help the general public to benefit
from the research work.
3.11 Definition Of Concepts
Facebook: It is a social networking site where people interact, exchange messages and
share ideas.
Social networking sites (SNS): These are technologies that allow user to create personal
profiles for themselves as well as connect, network, and interact with family, friends, and
others with similar interests.
Interaction: this is a mode of communication where there is a flow of information.
The following questions will answer specific research questions:
xxviii
Which interactive behaviours are most appropriate between students and
teachers.
Do students who do not want interaction on Facebook differ from other
students in how appropriate they find student-teacher interaction on
Facebook?
At the end of this research, clarifications will be given on what students find appropriate
in student teacher interaction on Facebook based on their responses on the questionnaires.
3.12 Validity And Reliability
The research will be valid and reliable as data will be collected from direct sources, with
the use of questionnaires and interviews that will be administered in the field.
3.13 Description Of Statistical Procedure
Questionnaire administered to respondents provided us with a sample of 20 answers
categorized into two groups of respondents: Bachelors Degree students and Masters
Degree Students with an equal percentage. The option of answers given to respondents
was also classified into three groups. According to their degree of importance as follows:
- First class answers (Yes, Agree)
- Second class answers (No, Disagree)
- Third class answers (No idea, not sure or neither agree or disagree)
Therefore according to the data collected the test statistics requires the Goodness of fit
and the chi square distribution X2 to compare an observed set of frequencies to expected
set of frequencies.
(fo – fe) 2
xxix
X2 = ∑ [ ] fe
3.13.1 Descriptive Statistics
A descriptive statistical method is used to analyze data collected from the field. This is
because the study seeks to investigate, identify and to recommend the use of security best
practices in commercial communication companies in Cameroon.
After administering the questionnaires, descriptive statistics is applied for better
understanding of the data coding. This classifies the answers into three groups of
importance.
3.13.2 Inferential Statistics
A sample population of 100 students of the University of Buea will serve as respondents
for the questionnaires.
CHAPTER FOURDATA ANALYSIS AND PRESENTATION
4.1 Introduction
This chapter analyses, presents and interprets the data that is collected from field. The
analysis is to justify the fact that a systems approach to network security can guarantee
security for a commercially viable company.
4.2 Population And Sampling
From the research topic “What students find appropriate in student –teacher
interaction on Facebook” data was gotten only from a cross section of Bachelor and
xxx
Masters Degree students. This is simply due to the there is a high probability that the
potential for improved student attitude towards their teachers, could translate a more
positive educational experience. In order to effectively utilise Facebook as a tool to create
social learning opportunities, teachers and students must understand how to interact with
each other in a way that promotes the improved positive perception of the teachers and
classroom environment while not engaging in behaviours that might harm these
perceptions. The research therefore targeted the both Bachelors and Masters Degree
students of the University of Buea.
A total of 100 questionnaires were distributed; each having 20 questions to be answered.
Just two groups of respondents as earlier mentioned, answered the questionnaires. This
limited us to two categories as follows:
Category 1 = Bachelor’s Degree Students
Category 2 = Masters Degree Students
For convenience sake it should be noted that Category 1 and 2 will be coded as B and M
respectively.
4.3 Data Coding
Data coding involves assigning numbers or symbols to answer and response so as to
group them into classes. The data collected was coded as follows:
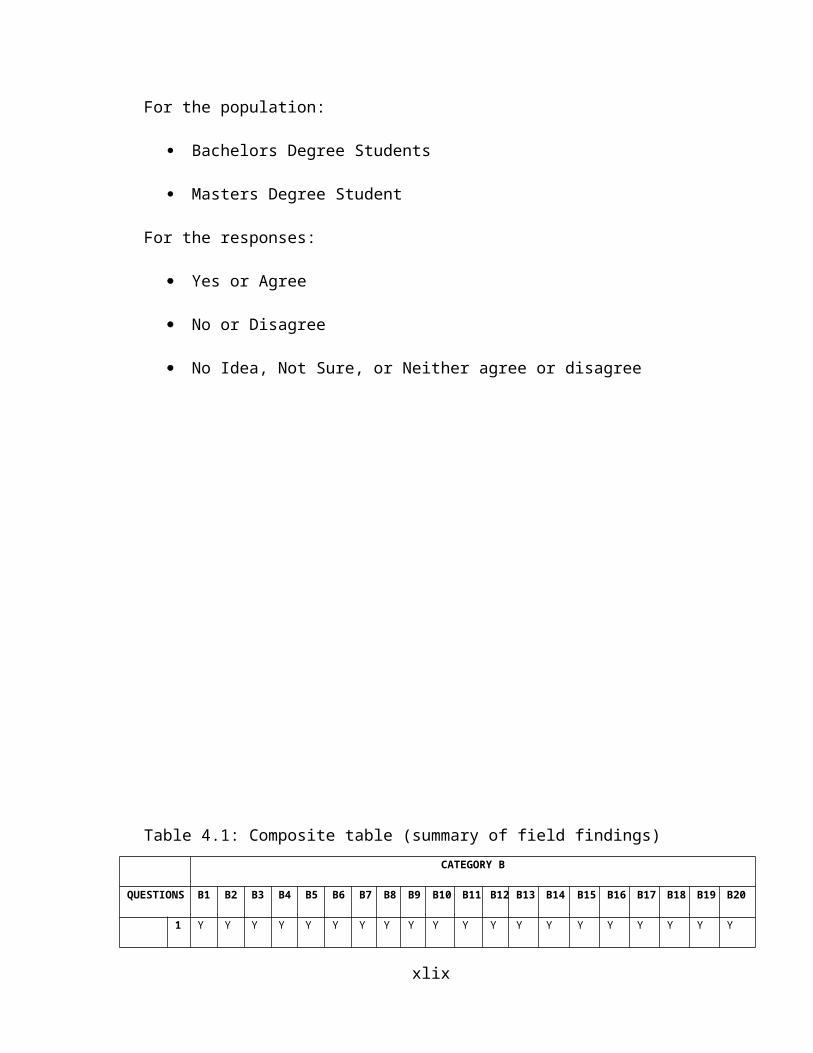
For the population:
Bachelors Degree Students
Masters Degree Student
For the responses:
xxxi
Yes or Agree
No or Disagree
No Idea, Not Sure, or Neither agree or disagree
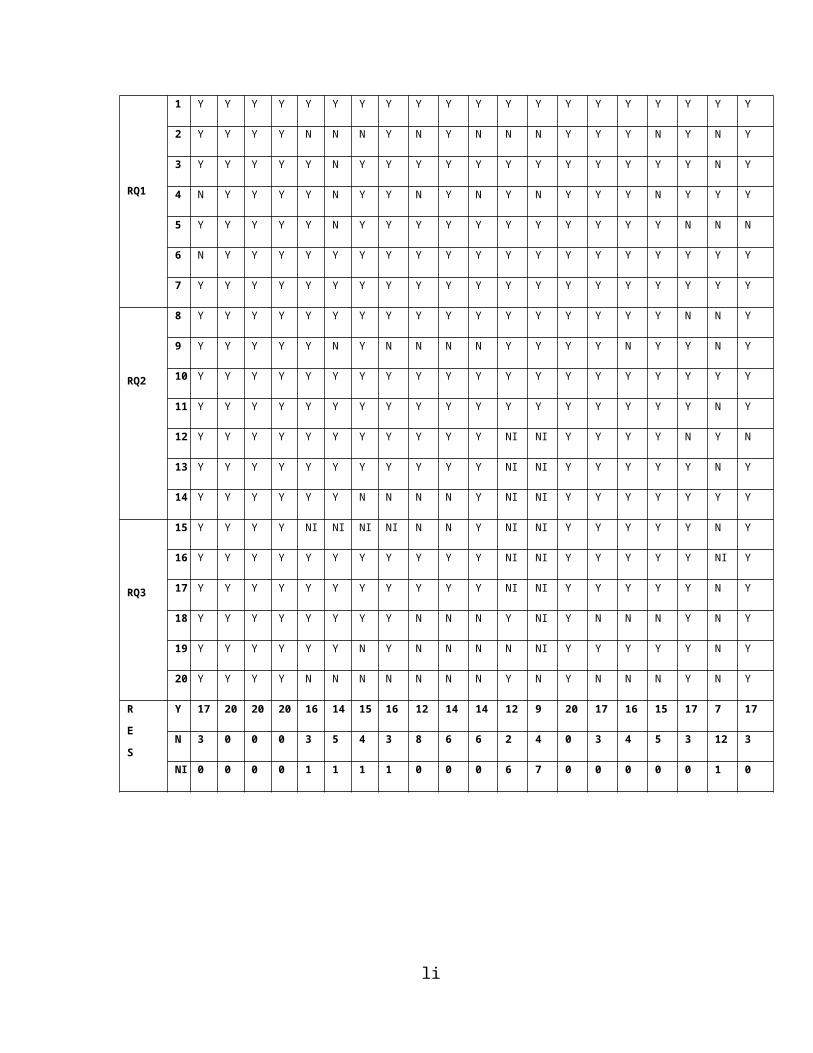
Table 4.1: Composite table (summary of field findings)
CATEGORY B
QUESTIONS B1 B2 B3 B4 B5 B6 B7 B8 B9 B10 B11 B12 B13 B14 B15 B16 B17 B18 B19 B20
RQ1
1 Y Y Y Y Y Y Y Y Y Y Y Y Y Y Y Y Y Y Y Y
2 Y Y N Y Y N Y Y Y Y N N Y Y N Y N Y Y N
3 Y Y N Y Y N Y Y Y Y N N Y Y N Y N Y Y Y
4 Y Y Y Y Y Y Y Y Y Y Y Y Y Y Y Y Y Y Y N
5 Y Y N Y Y N Y Y Y Y N N Y Y N Y N Y Y Y
6 Y N N Y Y N Y Y N Y N N Y Y N Y N Y Y N
7 Y Y Y Y Y Y Y Y Y Y Y Y Y Y Y Y Y Y Y Y
RQ2
8 N N N N N N N Y N Y N N Y Y N Y N Y N Y
9 Y Y Y Y N Y Y Y Y Y Y Y Y Y Y Y Y Y Y Y
10 Y N Y Y Y Y Y Y Y Y Y Y Y Y Y Y Y Y Y Y
11 Y N Y Y Y Y Y Y Y Y N N Y Y Y Y Y Y Y Y
xxxii
12 Y N Y Y Y Y Y Y N Y N N Y Y Y Y Y Y Y Y
13 Y N N Y Y N N Y Y Y N N Y Y N Y Y Y Y Y
14 Y N Y Y Y Y Y Y N Y N N Y Y Y Y Y Y Y Y
RQ3
15 NI Y N NI N N NI Y N Y Y Y Y Y Y Y Y Y Y NI
16 Y Y Y Y Y Y Y Y Y Y Y Y Y Y Y Y Y Y Y Y
17 Y Y N Y N N Y Y Y Y Y Y Y Y Y N Y Y Y Y
18 Y Y N Y N N Y Y Y Y Y Y Y Y Y Y Y Y Y Y
19 Y Y Y Y Y Y Y Y Y Y Y Y Y Y N Y N Y Y Y
20 N N N N N N N N N Y N N Y N Y Y N Y Y Y
R
E
S
Y 17 12 10 17 13 10 17 19 14 20 10 10 20 19 11 20 13 19 17 15
N 2 8 10 2 7 10 2 1 6 0 10 10 0 1 9 0 7 1 2 4
NI 1 0 0 1 0 0 1 0 0 0 0 0 0 0 0 0 0 0 1 1
CATEGORY B CONTINUED
QUESTIONS B21 B22 B23 B24 B25 B26 B27 B28 B29 B30 B31 B32 B33 B34 B35 B36 B37 B38 B39 B40
RQ1
1 Y Y Y Y Y Y Y Y Y Y Y Y Y Y Y Y Y Y Y Y
2 Y Y Y Y N N N Y N Y N N N Y Y Y N Y N Y
3 Y Y Y Y Y N Y Y Y Y Y Y Y Y Y Y Y Y N Y
4 N Y Y Y Y N Y Y N Y N Y N Y Y Y N Y Y Y
5 Y Y Y Y Y N Y Y Y Y Y Y Y Y Y Y Y N N N
6 N Y Y Y Y Y Y Y Y Y Y Y Y Y Y Y Y Y Y Y
7 Y Y Y Y Y Y Y Y Y Y Y Y Y Y Y Y Y Y Y Y
RQ2
8 Y Y Y Y Y Y Y Y Y Y Y Y Y Y Y Y Y N N Y
9 Y Y Y Y Y N Y N N N N Y Y Y Y N Y Y N Y
10 Y Y Y Y Y Y Y Y Y Y Y Y Y Y Y Y Y Y Y Y
11 Y Y Y Y Y Y Y Y Y Y Y Y Y Y Y Y Y Y N Y
12 Y Y Y Y Y Y Y Y Y Y Y NI NI Y Y Y Y N Y N
13 Y Y Y Y Y Y Y Y Y Y Y NI NI Y Y Y Y Y N Y
xxxiii

14 Y Y Y Y Y Y N N N N Y NI NI Y Y Y Y Y Y Y
RQ3
15 Y Y Y Y NI NI NI NI N N Y NI NI Y Y Y Y Y N Y
16 Y Y Y Y Y Y Y Y Y Y Y NI NI Y Y Y Y Y NI Y
17 Y Y Y Y Y Y Y Y Y Y Y NI NI Y Y Y Y Y N Y
18 Y Y Y Y Y Y Y Y N N N Y NI Y N N N Y N Y
19 Y Y Y Y Y Y N Y N N N N NI Y Y Y Y Y N Y
20 Y Y Y Y N N N N N N N Y N Y N N N Y N Y
R
E
S
Y 17 20 20 20 16 14 15 16 12 14 14 12 9 20 17 16 15 17 7 17
N 3 0 0 0 3 5 4 3 8 6 6 2 4 0 3 4 5 3 12 3
NI 0 0 0 0 1 1 1 1 0 0 0 6 7 0 0 0 0 0 1 0
CATEGORY B CONTINUED CATEGORY M
QUESTIONS B41 B42 B43 B44 B45 B46 B47 B48 B49 B50 M1 M2 M3 M4 M5 M6 M7 M8 M9 M10
RQ1
1 Y Y Y Y Y Y Y Y Y Y Y Y Y Y Y Y Y Y Y Y
2 N N Y Y Y N Y Y Y Y Y Y Y Y Y Y Y Y Y Y
3 N N Y Y Y N Y Y Y Y Y Y Y Y Y Y Y Y Y Y
4 Y Y Y Y Y Y Y Y Y Y Y Y Y Y Y Y Y Y Y Y
5 N N N N N N N N Y Y Y Y Y N N N N N N N
6 Y Y Y Y Y Y Y Y Y Y Y Y Y Y Y Y Y Y Y Y
7 Y Y Y Y Y Y Y Y Y Y Y Y Y Y N Y Y Y Y Y
RQ2
8 N N N Y N N N N Y Y N N Y N N Y N N N N
9 N N Y Y Y N Y Y Y Y Y Y Y Y NI Y Y Y Y Y
10 Y Y Y Y Y Y Y Y Y Y Y Y Y Y NI Y Y Y Y Y
11 N N Y Y Y N Y Y Y Y Y Y Y Y NI Y Y Y Y Y
12 Y Y N N N Y N N Y Y N N Y N NI Y N N Y N
13 N N Y Y Y N Y Y Y Y Y Y Y Y NI Y Y Y Y Y
xxxiv
14 Y Y Y Y Y Y Y Y Y Y Y Y Y Y NI Y Y Y Y Y
RQ3
15 N Y Y Y Y N Y Y Y Y Y Y Y Y NI Y Y Y Y Y
16 NI Y Y NI Y NI NI NI NI NI NI NI Y Y NI NI Y Y NI NI
17 N Y Y Y Y N Y Y Y Y Y Y Y Y NI Y Y Y Y Y
18 N Y Y N Y N Y N N Y NI NI Y Y NI NI Y NI NI NI
19 N Y Y N Y N Y N N Y NI NI Y Y NI NI Y NI NI NI
20 N Y Y N Y N Y N N N NI NI Y Y NI NI Y NI NI Y
R
E
S
Y 7 13 17 14 17 7 16 13 16 18 14 14 20 17 6 15 17 14 14 14
N 12 7 3 5 3 12 3 6 3 1 2 2 0 3 2 1 3 3 2 3
NI 1 0 0 1 1 1 1 1 1 1 4 4 0 0 12 4 0 3 4 3
CATEGORY M CONTINUED RESPONSES
QUESTIONS M11 M12 M13 M14 M15 M16 M17 M18 M19 M20 M21 M22 M23 M24 M25 M26 M27 M28 M29 M20 Y N NI
RQ1
1 Y Y Y Y Y Y Y Y Y Y Y Y Y Y Y Y Y Y Y Y 80 0 0
2 Y Y Y Y Y Y Y Y Y N Y Y Y Y Y Y Y Y Y Y 60 20 0
3 Y Y Y Y Y Y Y Y Y N Y Y Y Y Y Y Y Y Y Y 69 11 0
4 Y Y Y Y Y Y Y Y Y Y Y Y N N Y Y Y Y Y Y 71 9 0
5 N Y Y N Y Y Y Y Y N Y Y N N Y Y Y Y Y Y 48 32 0
6 Y Y Y Y Y Y Y Y Y Y Y Y Y Y Y Y Y Y Y Y 70 10 0
7 Y Y Y Y Y Y Y Y Y Y Y Y Y Y Y Y Y Y Y Y 79 1 0
RQ2
8 N Y Y N Y N N Y Y N Y Y N N Y Y Y Y Y Y 42 38 0
9 Y Y Y Y Y Y Y Y Y Y Y Y Y Y Y Y Y Y Y Y 68 11 1
10 Y Y Y Y Y N N Y Y Y Y Y NI NI Y Y Y Y NI Y 79 0 1
11 Y Y Y Y Y Y Y Y Y Y Y Y NI NI Y Y Y Y Y Y 67 9 4
12 Y Y Y Y Y N N Y Y N Y Y NI Y Y Y Y Y NI Y 58 17 5
13 Y Y Y Y Y N N Y Y N Y Y NI Y Y Y Y Y Y Y 61 14 5
14 Y Y Y Y Y N N Y Y NI Y Y NI Y Y Y Y Y Y Y 65 11 4
15 Y Y Y Y Y N N Y Y NI Y Y NI N Y Y Y Y Y Y 55 11 14
16 Y Y Y Y Y N N Y Y NI Y Y NI N Y Y Y Y Y Y 59 3 18
xxxv
RQ3
17 Y Y Y Y Y NI NI Y Y NI Y Y NI N Y Y Y Y Y Y 65 8 7
18 Y Y Y NI Y NI NI Y Y N Y NI NI N Y Y Y Y NI Y 49 17 14
19 Y Y Y NI Y NI NI Y Y NI Y NI NI NI Y Y Y Y NI Y 48 16 16
20 N Y Y NI Y NI NI Y Y NI Y NI NI N Y Y Y Y NI Y 31 36 13
R
E
S
Y 17 20 20 15 20 11 10 20 20 8 20 17 7 10 20 20 20 20 15 20 1224 --- ---
N 3 0 0 2 0 5 6 0 0 7 0 0 3 7 0 0 0 0 0 0 --- 274 ---
NI 0 0 0 3 0 4 4 0 0 5 0 3 10 3 0 0 0 0 5 0 --- --- 102
Figure 4.1 Mother Pie Chart showing Summary of Field Findings.
4.4 Data Analysis(Based On The Descriptive Statistics)
4.4.1 Data Analysis based on Respondents Answers
Q1 Do you know about Facebook?
Table 4.2; Summary of respondents’ answers to question one
Answer Yes No No Idea
xxxvi

Number 80 0 0
Figure 4.2 Pie Chart representing summary of respondents’ answers to question one
From the pie chart above we see that all eighty respondents think know about facebook
Q2 Do you frequently visit facebook?
\Table 4.3; Summary of respondents’ answers to question two
Answer Yes No No Idea
Number 60 20 0
Figure 4.3 Pie Chart representing summary of respondents’ answers to question two
From the pie chart above we see that sixty of the eighty respondents agree that they
frequently visit facebook.
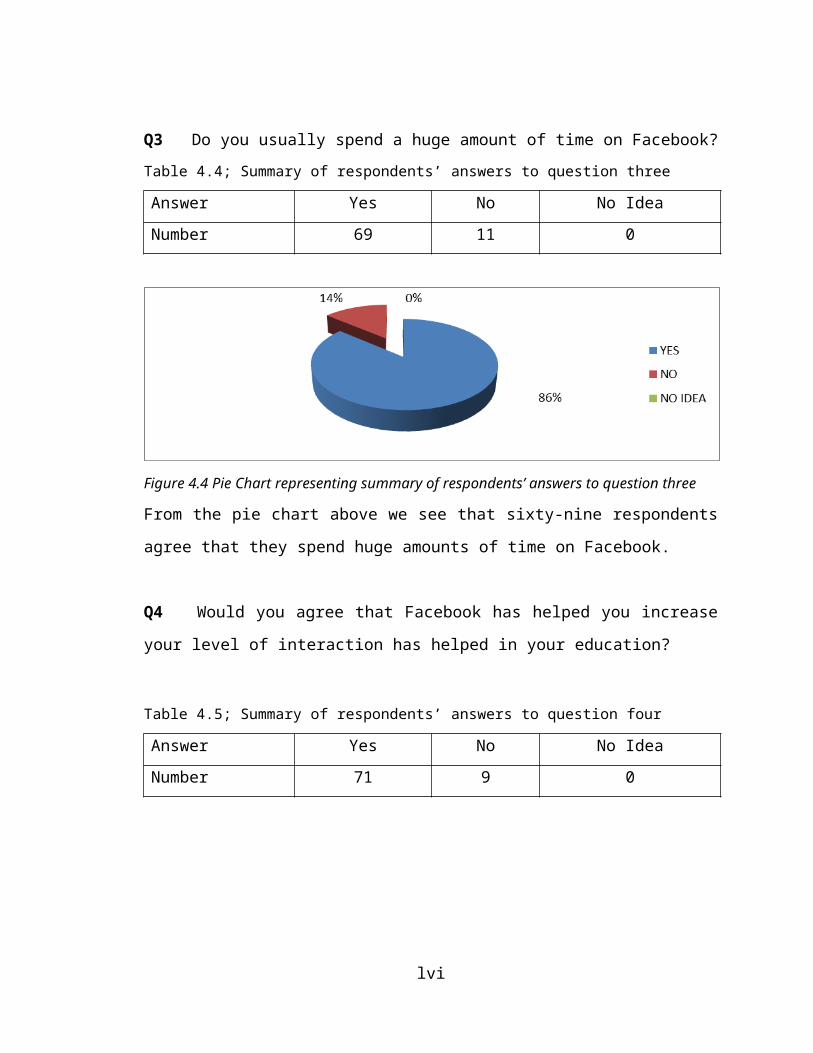
Q3 Do you usually spend a huge amount of time on Facebook?
xxxvii

Table 4.4; Summary of respondents’ answers to question three
Answer Yes No No Idea
Number 69 11 0
Figure 4.4 Pie Chart representing summary of respondents’ answers to question three
From the pie chart above we see that sixty-nine respondents agree that they spend huge
amounts of time on Facebook.
Q4 Would you agree that Facebook has helped you increase your level of interaction
has helped in your education?
Table 4.5; Summary of respondents’ answers to question four
Answer Yes No No Idea
Number 71 9 0
Figure 4.5 Pie Chart representing summary of respondents’ answers to question four
xxxviii

From the pie chart above we see that seventy-one of the eighty one respondents agree that
Facebook has helped increase their level of interaction and their education.
Q5 Would you fancy interacting with lecturers on Facebook?
Table 4.6; Summary of respondents’ answers to question five
Answer Good Bad Average
Number 48 32 0
Figure 4.6 Pie Chart representing summary of respondents’ answers to question five
From the pie chart above we see that sixty of the eighty respondents fancy interacting
with lectures on Facebook.
Q6 Would you agree that interacting with lecturers on Facebook has improved on your
grades?
Table 4.7; Summary of respondents’ answers to question six
Answer Good Bad Average
Number 70 10 0
xxxix
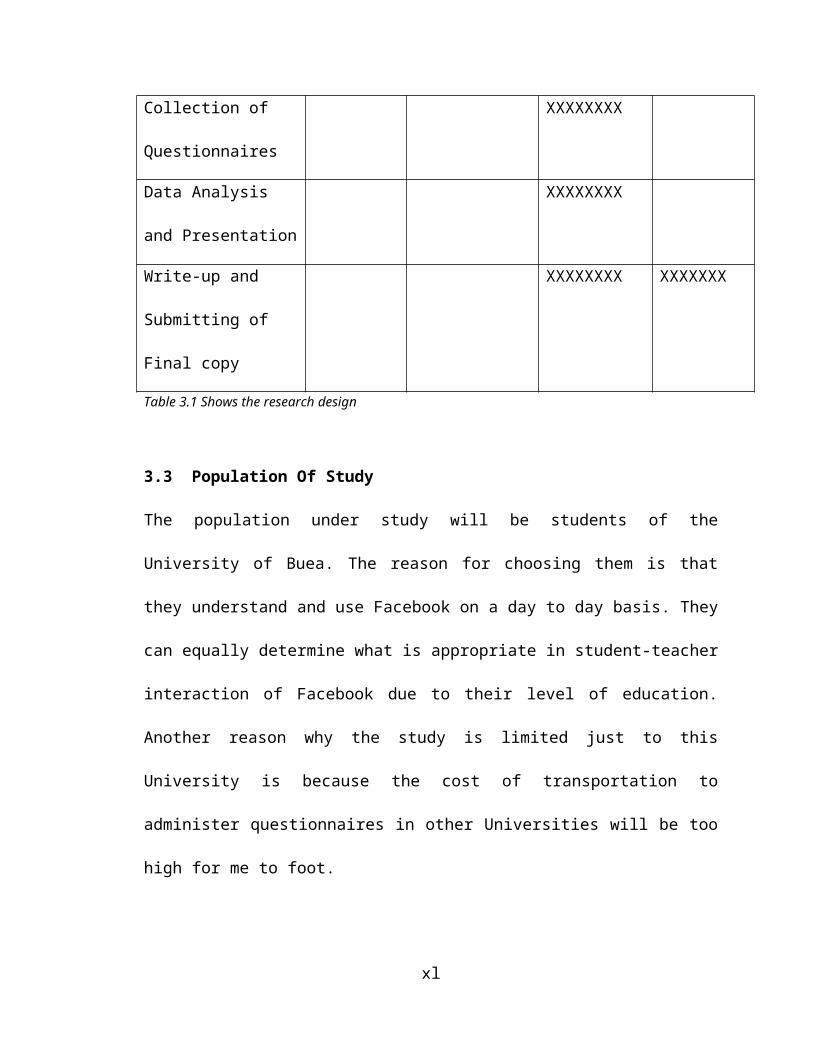
Figure 4.7 Pie Chart representing summary of respondents’ answers to question six
From the pie chart above we see that seventy of the eighty respondents agree that
interacting with lecturers on Facebook has improved on their grades.
Q7 Would you agree that Facebook as a social media is satisfactory?
Table 4.8; Summary of respondents’ answers to question seven
Answer Yes No No Idea
Number 79 1 0
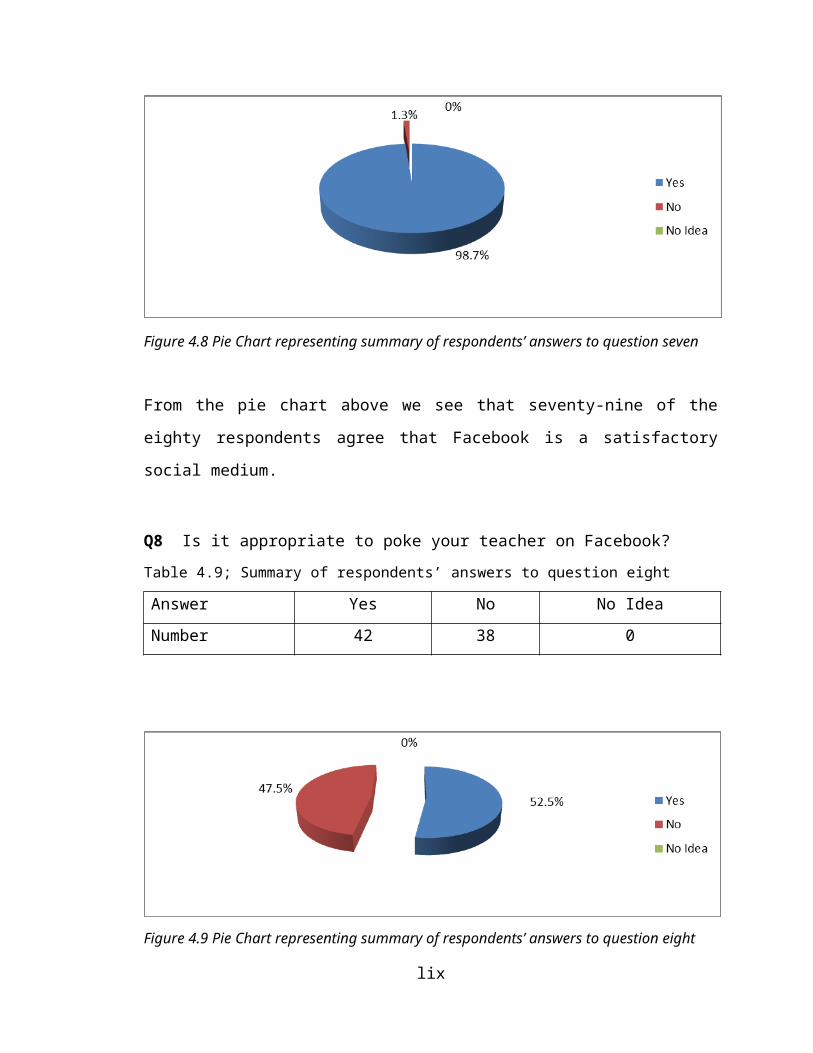
Figure 4.8 Pie Chart representing summary of respondents’ answers to question seven
From the pie chart above we see that seventy-nine of the eighty respondents agree that
Facebook is a satisfactory social medium.
Q8 Is it appropriate to poke your teacher on Facebook?
xl
Table 4.9; Summary of respondents’ answers to question eight
Answer Yes No No Idea
Number 42 38 0
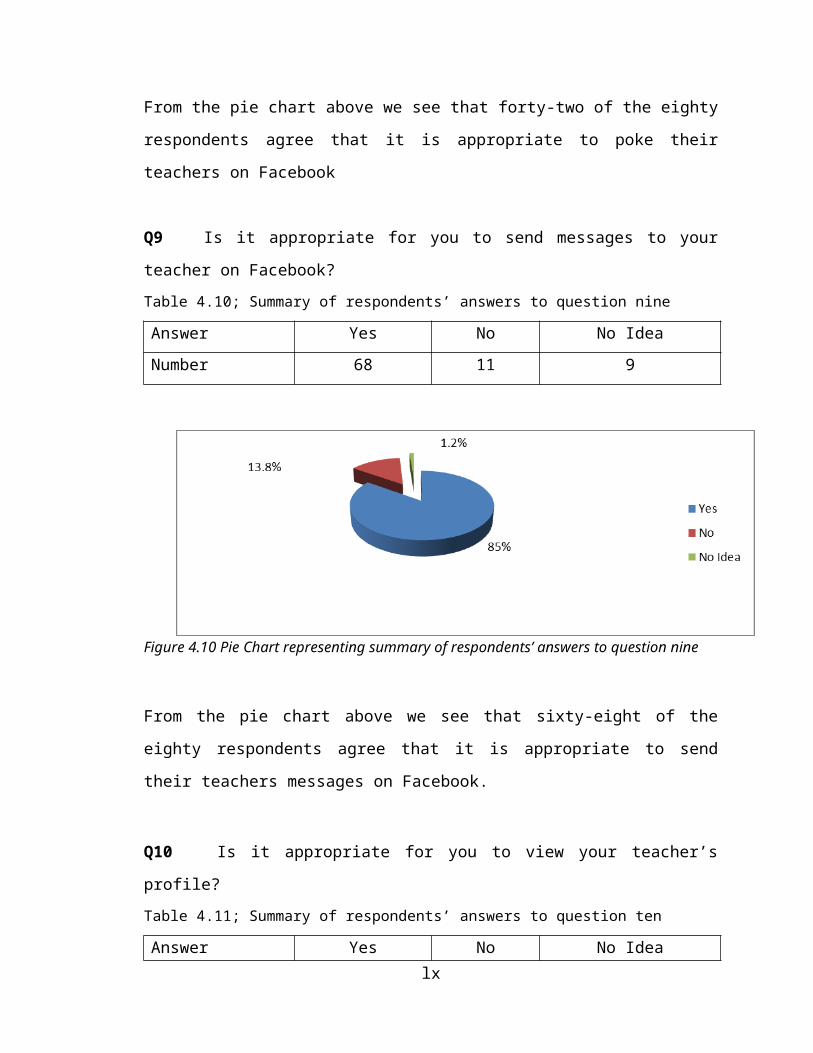
Figure 4.9 Pie Chart representing summary of respondents’ answers to question eight
From the pie chart above we see that forty-two of the eighty respondents agree that it is
appropriate to poke their teachers on Facebook
Q9 Is it appropriate for you to send messages to your teacher on Facebook?
Table 4.10; Summary of respondents’ answers to question nine
Answer Yes No No Idea
Number 68 11 9
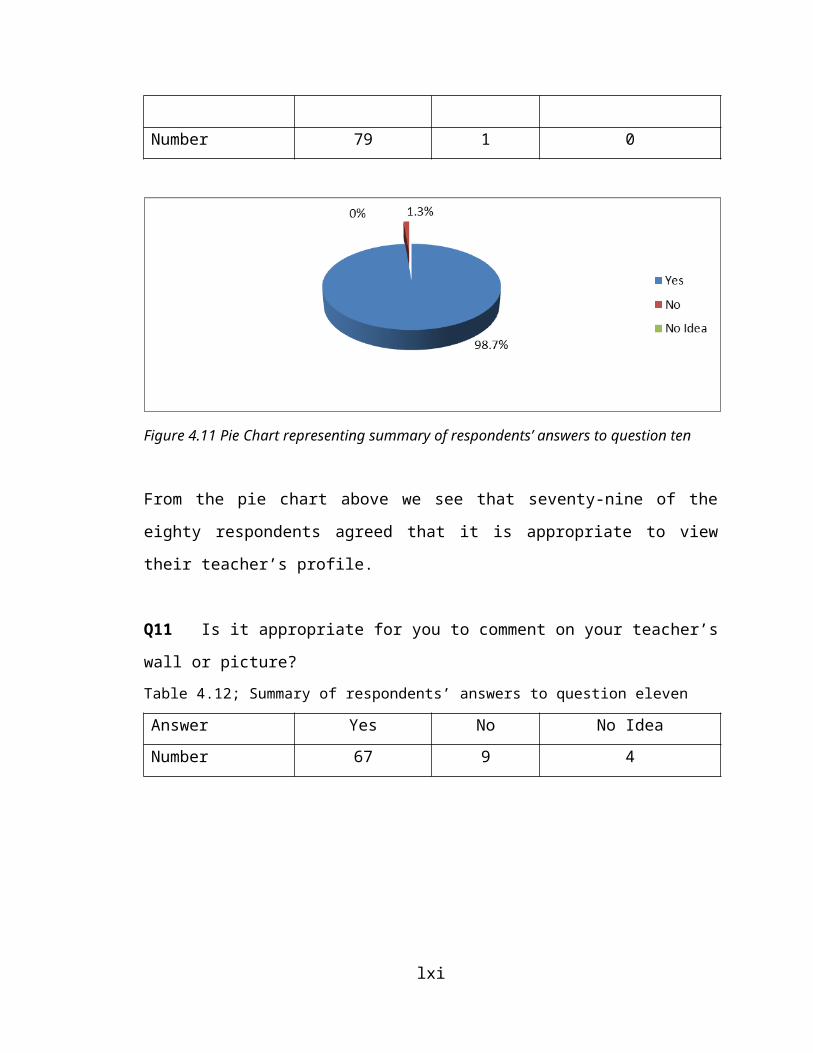
Figure 4.10 Pie Chart representing summary of respondents’ answers to question nine
xli
From the pie chart above we see that sixty-eight of the eighty respondents agree that it is
appropriate to send their teachers messages on Facebook.
Q10 Is it appropriate for you to view your teacher’s profile?
Table 4.11; Summary of respondents’ answers to question ten
Answer Yes No No Idea
Number 79 1 0
Figure 4.11 Pie Chart representing summary of respondents’ answers to question ten
From the pie chart above we see that seventy-nine of the eighty respondents agreed that it
is appropriate to view their teacher’s profile.
Q11 Is it appropriate for you to comment on your teacher’s wall or picture?
Table 4.12; Summary of respondents’ answers to question eleven
Answer Yes No No Idea
Number 67 9 4
xlii
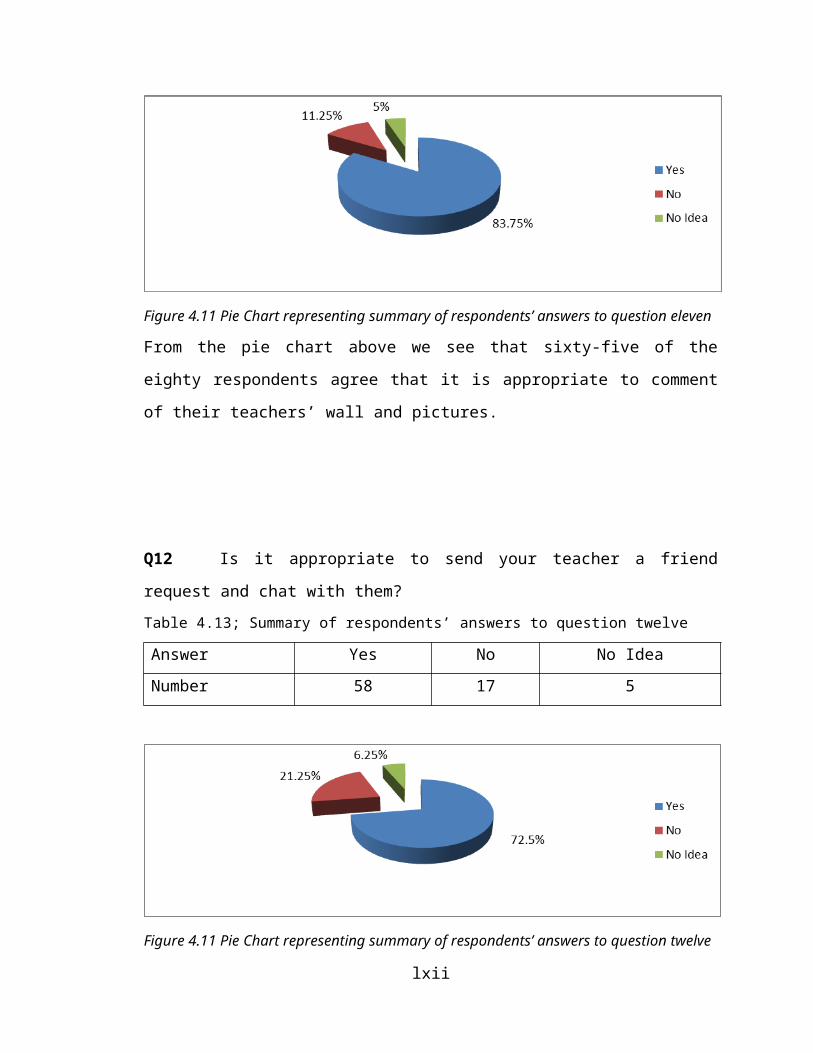
Figure 4.11 Pie Chart representing summary of respondents’ answers to question eleven
From the pie chart above we see that sixty-five of the eighty respondents agree that it is
appropriate to comment of their teachers’ wall and pictures.
Q12 Is it appropriate to send your teacher a friend request and chat with them?
Table 4.13; Summary of respondents’ answers to question twelve
Answer Yes No No Idea
Number 58 17 5
Figure 4.11 Pie Chart representing summary of respondents’ answers to question twelve
From the pie chart above we see that fifty-eight of the eighty respondents agreed that it’s
okay to send friend requests to their teachers as well as chat with them.
Q13 Is it appropriate to read your teacher’s personal information and comment on
his/her posts?
xliii

Table 4.14; Summary of respondents’ answers to question thirteen
Answer Yes No No Idea
Number 61 14 5
Figure 4.14 Pie Chart representing summary of respondents’ answers to question thirteen
From the pie chart above we see that sixty-one of the eighty respondents agreed that it
was okay to read their teachers personal information as well as comment on posts.
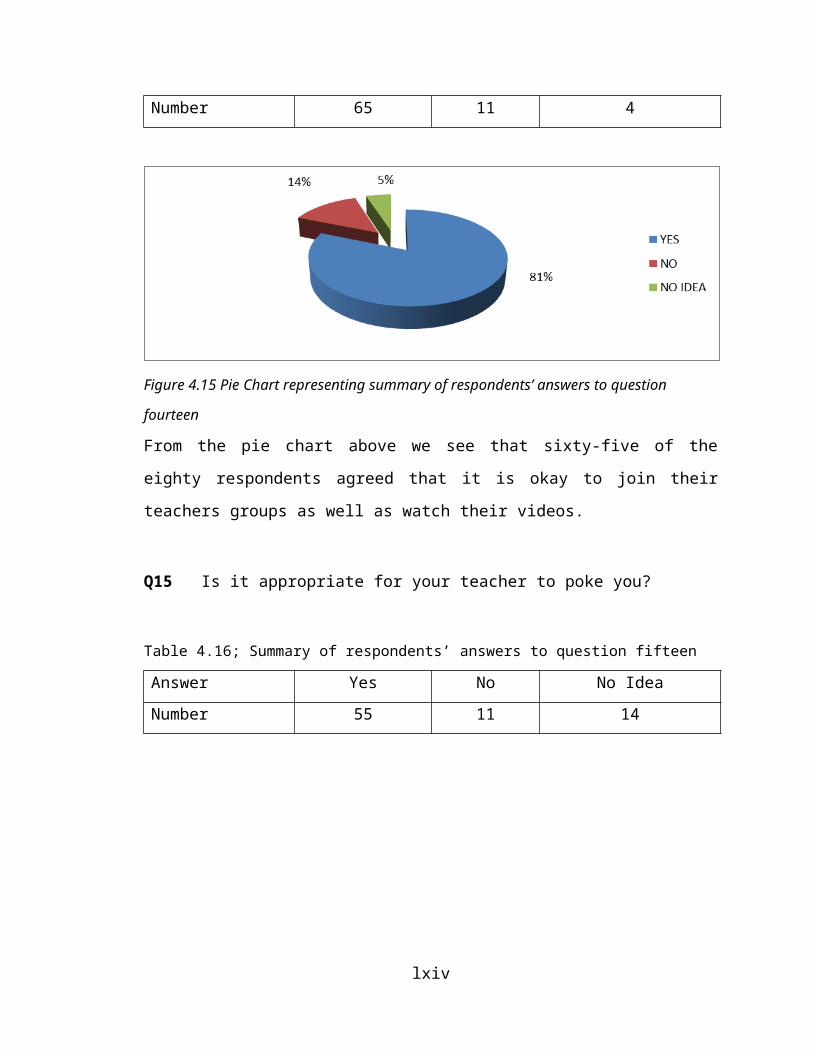
Q14 Is it appropriate to join your teachers groups as well as watch their video?
Table 4.15; Summary of respondents’ answers to question fourteen
Answer Yes No No Idea
Number 65 11 4
Figure 4.15 Pie Chart representing summary of respondents’ answers to question fourteen
From the pie chart above we see that sixty-five of the eighty respondents agreed that it is
okay to join their teachers groups as well as watch their videos.
xliv

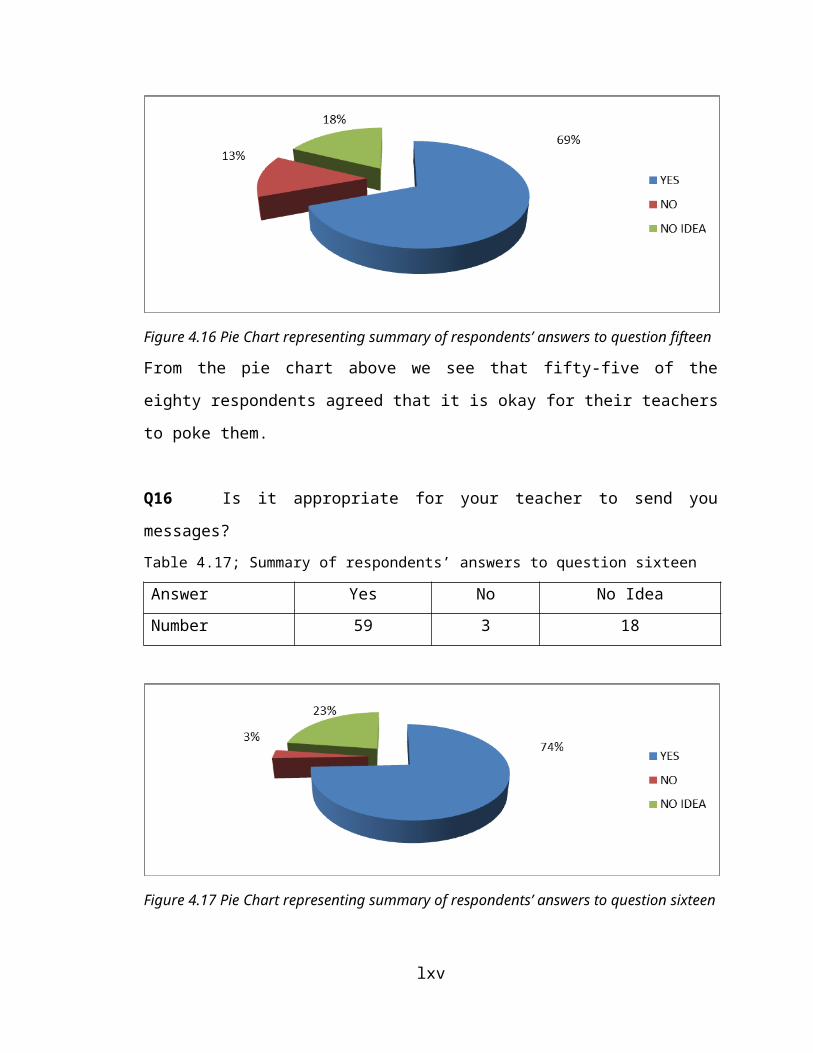
Q15 Is it appropriate for your teacher to poke you?
Table 4.16; Summary of respondents’ answers to question fifteen
Answer Yes No No Idea
Number 55 11 14
Figure 4.16 Pie Chart representing summary of respondents’ answers to question fifteen
From the pie chart above we see that fifty-five of the eighty respondents agreed that it is
okay for their teachers to poke them.
Q16 Is it appropriate for your teacher to send you messages?
Table 4.17; Summary of respondents’ answers to question sixteen
Answer Yes No No Idea
Number 59 3 18
xlv
Figure 4.17 Pie Chart representing summary of respondents’ answers to question sixteen
From the pie chart above we see that fifty-none of the eighty respondents agreed that it
was okay for their teacher to send them messages.
Q17 Is it appropriate for your teacher to view your pictures?
Table 4.18; Summary of respondents’ answers to question seventeen
Answer Yes No No Idea
Number 65 8 7
Figure 4.18 Pie Chart representing summary of respondents’ answers to question seventeen
From the pie chart above we see that sixty-five of the eighty respondents agreed that it
was okay for their teachers to view their pictures.
xlvi
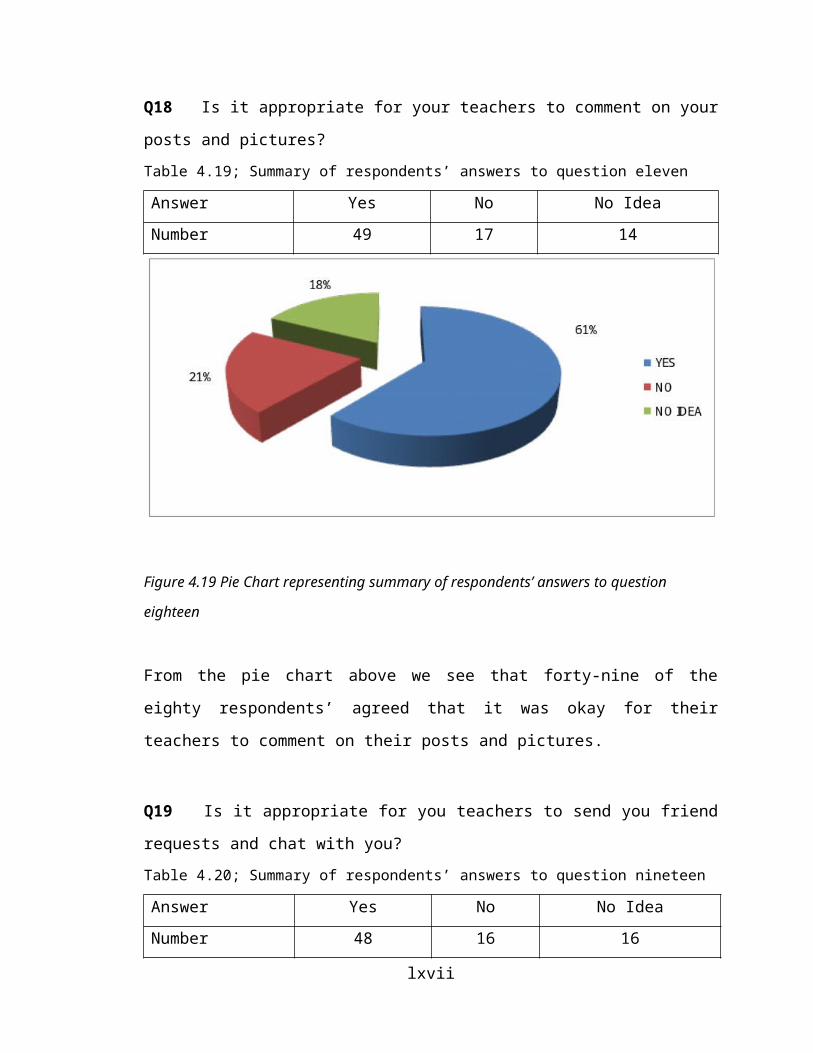
Q18 Is it appropriate for your teachers to comment on your posts and pictures?
Table 4.19; Summary of respondents’ answers to question eleven
Answer Yes No No Idea
Number 49 17 14
Figure 4.19 Pie Chart representing summary of respondents’ answers to question eighteen
From the pie chart above we see that forty-nine of the eighty respondents’ agreed that it
was okay for their teachers to comment on their posts and pictures.
Q19 Is it appropriate for you teachers to send you friend requests and chat with you?
Table 4.20; Summary of respondents’ answers to question nineteen
Answer Yes No No Idea
Number 48 16 16
xlvii

Figure 4.20 Pie Chart representing summary of respondents’ answers to question nineteen
From the pie chart above we see that forty-eight of the eighty respondents agreed that it
was okay for their teachers to send them friend requests and chat with them.
Q20 Is it appropriate for your teacher to read you personal information and join your
groups?
Table 4.21; Summary of respondents’ answers to question twenty
Answer Yes No No Idea
Number 31 36 13
Figure 4.21 Pie Chart representing summary of respondents’ answers to question twenty
xlviii
From the pie chart above we see that only thirty-one of all eighty respondents think it is
appropriate for their teachers to view their personal information and join their groups.
4.5 Inferential Data Analysis(Based On The Descriptive Statistics)
4.5.1 Inferential Data Analysis Based on Set of Questions
Step 1: State the hypothesis
H0: The use of Facebook as an interactive medium between teachers and students
ameliorates their relationship in the academic milieu.
H1: The use of Facebook as an interactive medium between teachers and students does
not ameliorate their relationship in the academic milieu.
Step 2: Choose the Statistical test and give the reason for your choice:
The one-sample (Chi Square) is used to compare the observed distribution to a
hypothesized distribution. The is used because the responses are classified into nominal
categories and there are sufficient observations.
Step 3: Choose the significance level and give the reason for your choice:
Let α = 0.05.
The reason is that we are dealing with a simple social survey and the data is nominal and
also accounts for error margin.
Step 4: Calculations:
xlix
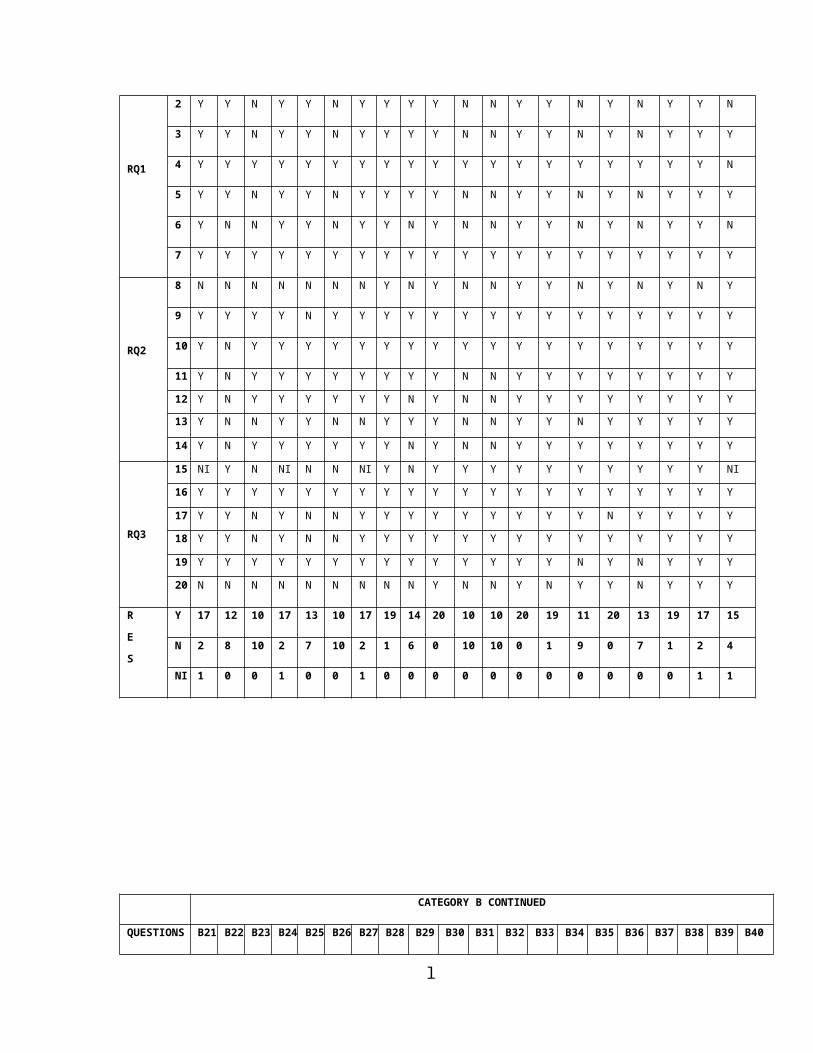
Table 4.40 Calculation of mother chi square table for set of questions (Extrapolated from the
composite table)
Questions fo fe fo- fe (fo- fe)2/ fe
R
Q
1
Q1 80 61.2 18.8 5.78
Q2 60 61.2 -1.2 0.02
Q3 69 61.2 7.8 0.99
Q4 71 61.2 9.8 1.57
Q5 48 61.2 -13.2 2.85
Q6 70 61.2 8.8 1.27
Q7 79 61.2 17.8 5.18
R
Q
2
Q8 42 61.2 -19.2 6.02
Q9 68 61.2 6.8 0.76
Q10 79 61.2 17.8 5.18
Q11 67 61.2 5.8 0.55
Q12 58 61.2 -3.2 0.17
Q13 61 61.2 -0.2 0.00
Q14 65 61.2 3.8 0.24
R
Q
3
Q15 55 61.2 -6.2 0.63
Q16 59 61.2 -2.2 0.08
Q17 65 61.2 3.8 0.24
Q18 49 61.2 -12.2 2.43
Q19 48 61.2 -13.2 2.85
l
Q20 31 61.2 -30.2 14.90
Total 229 0.0 51.29
=
=Chi Square
fo= observed frequency
fe= expected frequency
The table above has individual Chi Square values for each question such that the
cumulative or the sum total gives the calculated value
= 51.29
The degree of freedom (d.f.) is calculated from 20 columns designating the individual
questions and two rows designating the observed and the expected frequencies
d.f. = (c-1)(r-1)
= (20-1)(2-1)=19
Step 5: The critical value:
From the Chi Square table we can get the critical value from a d.f. =19 and α = 0.05
Using these 2 parameters we find out from the table above that the critical value is =
30.14
Step 6: Interpret
We observe that this critical value (30.14) is less than the calculated Chi Square value
(51.29), so we reject the null hypothesis. In other words, the calculated value is in the
zone of rejection as indicated by the following diagram;
li
Zone of Acceptance

]
Figure 4.41: One-tailed test α = 0.05 for the inferential data analysis based on set of questions
The calculated value 51.29, is greater than the critical value of 30.14 and is in the zone of
rejection, therefore we reject the null hypothesis.
4.5.2 Inferential Data Analysis Based on Set of Respondents
Step 1: State the hypothesis
H0: The use of Facebook as an interactive medium between teachers and students
ameliorates their relationship in the academic milieu.
H1: The use of Facebook as an interactive medium between teachers and students does
not ameliorate their relationship in the academic milieu.
Step 2: Choose the Statistical test and give the reason for your choice:
The one-sample (Chi Square) is used to compare the observed distribution to a
hypothesized distribution. The is used because the responses are classified into nominal
categories and there are sufficient observations.
Step 3: Choose the significance level and give the reason for your choice:
Let α = 0.05.
lii
Calculated Value=51.29
Critical Value=30.14
α = 0.05
Zone of Rejection

The reason is that we are dealing with a simple social survey and the data is nominal and
also accounts for error margins.
Step 4: Calculations:
Table 4.41 Extrapolated from the composite table
CATEGORY B
B1 B2 B3 B4 B5 B6 B7 B8 B9 B10 B11 B12 B13 B14 B15 B16 B17 B18 B19 B20
fo 17 12 10 17 13 10 17 19 14 20 10 10 20 19 11 20 13 19 17 15
fe 15.3
15.3
15.3 15.3 15.3 15.3 15.3 15.3 15.3 15.3
15.3 15.3 15.3 15.3
15.3 15.3 15.3 15.3 15.3
15.3
fo- fe 1.7 -3.3 -5.3 1.7 -2.3 -5.3 1.7 3.7 -1.3 4.7 -5.3 -5.3 4.7 3.7 -4.3 4.7 -2.3 3.7 1.7 -0.3
(fo- fe)2/ fe 0.9 0.7 1.8 0.9 0.3 1.8 0.9 0.9 0.1 1.4 1.8 1.8 1.4 0.9 1.2 1.4 0.3 0.9 0.9 0.0
CATEGORY B CONTINUED
B21 B22 B23 B24 B25 B26 B27 B28 B29 B30 B31 B32 B33 B34 B35 B36 B37 B38 B39 B40
17 20 20 20 16 14 15 16 12 14 14 12 9 20 17 16 15 17 7 17
15.
3
15.3
15.3 15.3 15.3 15.3 15.3 15.3 15.3 15.3
15.3 15.3 15.3 15.3
15.3 15.3 15.3 15.3 15.3
15.3
1.7 4.7 4.7 4.7 0.7 -1.3 -0.3 0.7 -3.3 -1.3
-1.3 -3.3 -6.3 4.7 1.7 0.7 -0.3 1.7 -8.3
1.7
0.9 1.4 1.4 1,4 0.3 0.1 0.0 0.3 0.7 0.1 0.1 0.7 2.6 1.4 0.9 0.3 0.0 0.9 4.5 0.9
CATEGORY B CONTINUED CATEGORY M
B41 B42 B43 B44 B45 B46 B47 B48 B49 B40 M1 M2 M3 M4 M5 M6 M7 M8 M9 M10
liii

7 13 17 14 17 7 16 13 16 18 14 14 20 17 6 15 17 14 14 14
15.3
15.3
15.3 15.3 15.3 15.3 15.3 15.3 15.3 15.3
15.3 15.3 15.3 15.3
15.3 15.3 15.3 15.3 15.3
15.3
-8.3
-2.3 1.7 -1.3 1.7 -8.3 0.7 -2.3 0.7 1.7 -1.3 -1.3 4.7 1.7 -9.3 -0.3 1.7 -1.3 -1.3
-1.3
4.5 0.3 0.9 0.1 0.9 4.5 0.3 0.3 0.3 0.9 0.1 0.1 1.4 0.9 5.7 0.0 0.0 0.1 0.1 0.1
CATEGORY M CONTINUED
M11 M12 M13 M14 M15 M16 M17 M18 M19 M20 M21 M22 M23 M244M25 M26 M27 M28 M29 M30 TOTAL
17 20 20 15 20 11 10 20 20 8 20 17 7 10 20 20 20 20 15 20 1224
15.3
15.3
15.3 15.3 15.3 15.3 15.3 15.3 15.3 15.3
15.3 15.3 15.3 15.3
15.3
15.3 15.3 15.3 15.3
15.3 15.3
1.7 4.7 4.7 -0.3 4.7 -4.3 -5.3 4.7 4.7 -7.3
4.7 1.7 -8.3 -5.3
4.7 4.7 4.7 4.7 -0.3
4.7 0.0
0.9 1.4 1.4 0.0 1.4 1.2 1.8 1.4 1.4 3.5 1.4 0.9 4.5 1.8 1.4 1.4 1.4 1.4 0.0 1.4 89.89
=Chi Square
fo= observed frequency
fe= expected frequency
The table above has individual Chi Square values for each question such that the
cumulative or the sum total gives the calculated value
= 89.89
The degree of freedom d.f. is calculated from 16 columns designating the individual
questions and two rows designating the observed and the expected frequencies
d.f. = (c-1)(r-1)
= (80-1)(2-1)= 79
Step 5: The critical value:
From the Chi Square table we can get the critical value from a d.f. = 79 and α = 0.05
Using these 2 parameters we find out from the table above that the critical value is =
101.9
Step 6: Interpret liv

We observe that this calculated value (89.89) is less than the critical value (101.9), so we
accept the null hypothesis. In other words, the calculated value is in the zone of
acceptance as indicated by the following diagram.
Figure 4.42: One-tailed test α = 0.05 for the inferential data analysis based on set of respondents
4.5.3 Inferential Data Analysis Based on Research Questions
4.5.3.1 Inferential data analysis based on research question one
Step 1: State the hypothesis
H0: The use of Facebook as an interactive medium between teachers and students
ameliorates their relationship in the academic milieu.
H1: The use of Facebook as an interactive medium between teachers and students does
not ameliorate their relationship in the academic milieu.
Step 2: Choose the Statistical test and give the reason for your choice:
lv
Calculated Value=32.2
Critical Value=25.00
α = 0.05
Zone of Rejection
Zone of Acceptance
The one-sample (Chi Square) is used to compare the observed distribution to a
hypothesized distribution. The is used because the responses are classified into nominal
categories and there are sufficient observations.
Step 3: Choose the significance level and give the reason for your choice:
Let α = 0.05.
The reason is that we are dealing with a simple social survey and the data is nominal and
also accounts for error margin.
Step 4: Calculations:
Table 4.43; Extrapolated from the composite table
=
=Chi Square
fo= observed frequency
fe= expected frequency
The table above has individual Chi Square values for each question such that the
cumulative or the sum total gives the calculated value
lvi
fo fe fo- fe (fo- fe)2/ fe
RQ1
Q1 80 68.1 11.9 5.78
Q2 60 68.1 -8.1 0.02
Q3 69 68.1 0.9 0.99
Q4 71 68.1 2.9 1.57
Q5 48 68.1 -20.1 2.85
Q6 70 68.1 1.9 1.27
Q7 79 68.1 10.9 5.18
477 0.00 17.66

= 17.66
The degree of freedom d.f. is calculated from 5 columns designating the individual
questions and two rows designating the observed and the expected frequencies
d.f. =(c-1) (r-1)
= (2-1) (7-1) = 6
Step 5: The critical value:
From the Chi Square table we can get the critical value from a d.f. = 4 and α = 0.05
Using these 2 parameters we find out from the table above that the critical value is =
12.59
Step 6: Interpret
We observe that this critical value (12.59) is less than the calculated Chi Square value
(17.66), so we reject the null hypothesis. In other words, the calculated value is in the
zone of rejection as indicated by the following diagram.
lvii
Zone of Acceptance
Zone of Rejection
α = 0.05
Critical Value=
Calculated Value= 17.66

Figure 4.41: One-tailed test α = 0.05 for the inferential data analysis based on research question one
4.5.3.2 Inferential data analysis based on research question two
Step 1: State the hypothesis
H0: The use of Facebook as an interactive medium between teachers and students
ameliorates their relationship in the academic milieu.
H1: The use of Facebook as an interactive medium between teachers and students does
not ameliorate their relationship in the academic milieu.
Step 2: Choose the Statistical test and give the reason for your choice:
The one-sample (Chi Square) is used to compare the observed distribution to a
hypothesized distribution. The is used because the responses are classified into nominal
categories and there are sufficient observations.
Step 3: Choose the significance level and give the reason for your choice:
Let α = 0.05.
The reason is that we are dealing with a simple social survey and the data is nominal and
also accounts for error margin
Step 4: Calculations:
Table 4.44; Extrapolated from the composite table
fo fe fo- fe (fo- fe)2/ fe
RQ2
Q8 42 62.8 -20.8 6.89
Q9 68 62.8 5.2 0.43
Q10 79 62.8 16.2 4.17
Q11 67 62.8 4.2 0.28
lviii
Q12 58 62.8 -4.8 0.37
Q13 61 62.8 -1.8 0.05
Q14 65 62.8 2.2 0.07
440 0 12.26
=
=Chi Square
fo= observed frequency
fe= expected frequency
The table above has individual Chi Square values for each question such that the
cumulative or the sum total gives the calculated value
= 12.26
The degree of freedom d.f. is calculated from 6 columns designating the individual
questions and two rows designating the observed and the expected frequencies
d.f. =(c-1)(r-1)
= (2-1)(7-1)= 6
Step 5: The critical value:
From the Chi Square table we can get the critical value from a d.f. =5 and α = 0.05
Using these 2 parameters we find out from the table above that the critical value is =
12.59
Step 6: Interpret
lix
We observe that this critical value (12.59) is more than the calculated Chi Square value
(12.26), so we accept the null hypothesis. In other words, the calculated value is in the
zone of acceptance as indicated by the following diagram.
Figure 4.44: One-tailed test α = 0.05 for the inferential data analysis based on research question two
4.5.3.3 Inferential data analysis based on Research Question Three
Step 1: State the hypothesis
H0: The use of Facebook as an interactive medium between teachers and students
ameliorates their relationship in the academic milieu.
H1: The use of Facebook as an interactive medium between teachers and students does
not ameliorate their relationship in the academic milieu.
lx
Zone of Acceptance
Zone of Rejection
α = 0.05
Critical Value=
Calculated Value= 12.26
Step 2: Choose the Statistical test and give the reason for your choice:
The one-sample (Chi Square) is used to compare the observed distribution to a
hypothesized distribution. The is used because the responses are classified into nominal
categories and there are sufficient observations.
Step 3: Choose the significance level and give the reason for your choice:
Let α = 0.05.
The reason is that we are dealing with a simple social survey and the data is nominal and
also accounts for error margin.
Step 4: Calculations:
Table 4.45; Extrapolated from the composite table
fo fe fo- fe (fo- fe)2/ fe
RQ3
Q15 55 51.2 3.8 0.28
Q16 59 51.2 7.8 1.18
Q17 65 51.2 13.8 3.71
Q18 49 51.2 -2.2 0.80
Q19 48 51.2 -3.2 2.85
Q20 31 51.2 -20.2 7.96
307 0.0 15.65
=
=Chi Square
fo= observed frequency
fe= expected frequency
The table table above has individual Chi Square values for each question such that the
cumulative or the sum total gives the calculated value
lxi
= 15.65
The degree of freedom d.f. is calculated from columns designating the individual
questions and two rows designating the observed and the expected frequencies
d.f. =(c-1)(r-1)
=(2-1)(6-1)= 5
Step 5: The critical value:
From the Chi Square table we can get the critical value from a d.f. = 5 and α = 0.05
Using these 2 parameters we find out from the table above that the critical value is =
11.07
Step 6: Interpret
We observe that this critical value (11.07) is less than the calculated Chi Square value
(15.65), so we reject the null hypothesis. In other words, the calculated value is in the
zone of rejection as indicated by the following diagram:
lxii
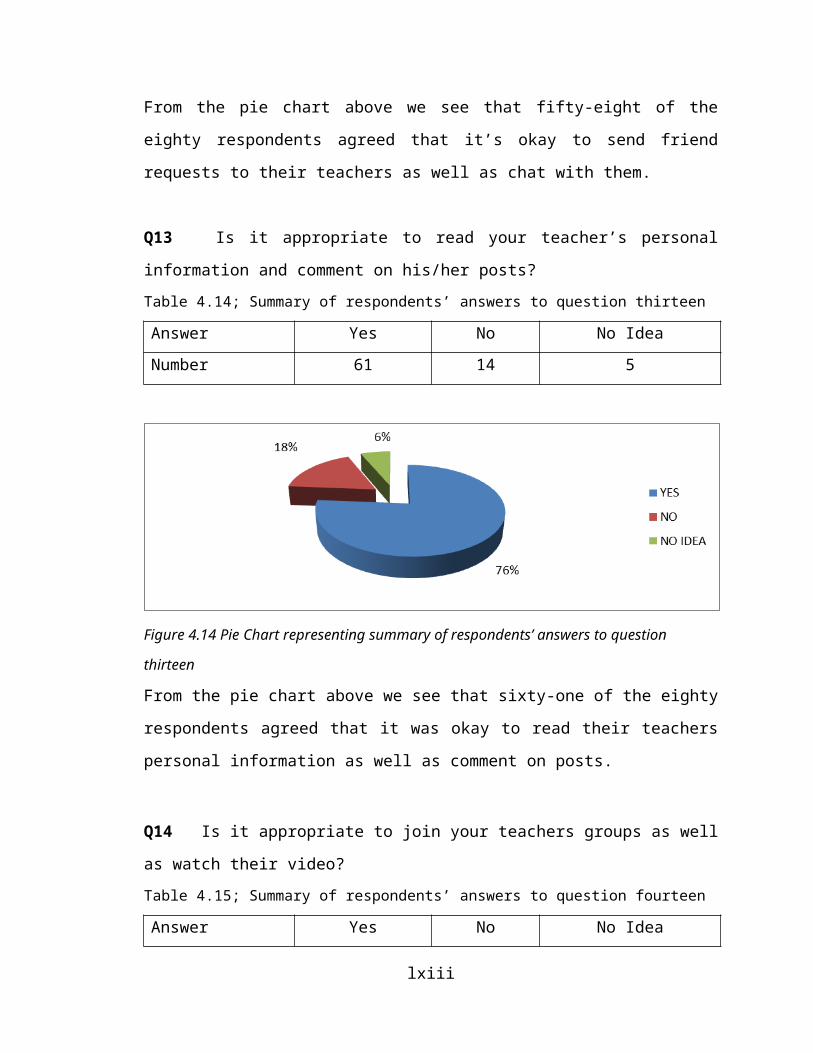
Figure 4.45: One-tailed test α = 0.05 for the inferential data analysis based on research question three
4.5.4 Inferential Data Analysis Based on Category of Respondents
4.5.4.1 Inferential Data Analysis Based on Category B Respondents
Step 1: State the hypothesis
H0: The use of Facebook as an interactive medium between teachers and students
ameliorates their relationship in the academic milieu.
H1: The use of Facebook as an interactive medium between teachers and students does
not ameliorate their relationship in the academic milieu.
Step 2: Choose the Statistical test and give the reason for your choice:
lxiii
Zone of Acceptance
Zone of Rejection
α = 0.05
Calculated Value= 15.56
Critical Value=11.07
The one-sample (Chi Square) is used to compare the observed distribution to a
hypothesized distribution. The is used because the responses are classified into nominal
categories and there are sufficient observations.
Step 3: Choose the significance level and give the reason for your choice:
Let α = 0.05.
The reason is that we are dealing with a simple social survey and the data is nominal and
also accounts for error margin.
Step 4: Calculation
Table 4.46; Extrapolated from the composite table
CATEGORY B
B1 B2 B3 B4 B5 B6 B7 B8 B9 B10 B11 B12 B13 B14 B15 B16 B17 B18 B19 B20
fo 17 12 10 17 13 10 17 19 14 20 10 10 20 19 11 20 13 19 17 15
fe 15 15 15 15 15 15 15 15 15 15 15 15 15 15 15 15 15 15 15 15
fo- fe 2 -3 -5 2 -2 -5 2 4 -1 5 -5 -5 5 4 -4 5 -2 4 3 0
(fo- fe)2/ fe 0.3 0.6 1.7 0.3 0.3 1.7 0.3 1.1 0.1 1.7 1.7 1.7 1.7 1.1 1.1 1.7 0.3 1.1 0.6 0.0
CATEGORY B CONTINUED
B21 B22 B23 B24 B25 B26 B27 B28 B29 B30 B31 B32 B33 B34 B35 B36 B37 B38 B39 B40
17 20 20 20 16 14 15 16 12 14 14 12 9 20 17 16 15 17 7 17
15 15 15 15 15 15 15 15 15 15 15 15 15 15 15 15 15 15 15 152 5 5 5 1 -1. 0 1 -3 -1 -1 -3 -6 5 2 1 0 2 -8 20.3 1.7 1.7 1.7 0.1 0.1 0.0 0.1 0.6 0.1 0.1 0.6 2.4 1.7 0.3 0.1 0.0 0.3 4.2 0.3
lxiv
CATEGORY B CONTINUED
B41 B42 B43 B44 B45 B46 B47 B48 B49 B40 TOTAL
7 13 17 14 17 7 16 13 16 18 74915 15 15 15 15 15 15 15 15 15 15-8 -2 2 -1 2 -8 1 -2 1 3 0.04.2 0.3 0.3 0.1 0.3 4.2 0.1 0.3 0.1 0.6 46
=
=Chi Square
fo= observed frequency
fe= expected frequency
The table above has individual Chi Square values for each question such that the
cumulative or the sum total gives the calculated value
= 46
The degree of freedom d.f. is calculated from 6 columns designating the individual
questions and two rows designating the observed and the expected frequencies
d.f. = (c-1)(r-1)
= (2-1)(50-1)= 49
Step 5: The critical value:
From the Chi Square table we can get the critical value from a d.f. = 49 and α = 0.05
Using these 2 parameters we find out from the table above that the critical value is =
55.76
Step 6: Interpret
We observe that this critical value (55.76) is more than the calculated Chi Square value
(46), so we accept the null hypothesis. In other words, the calculated value is in the zone
of acceptance as indicated by the following diagram.
lxv
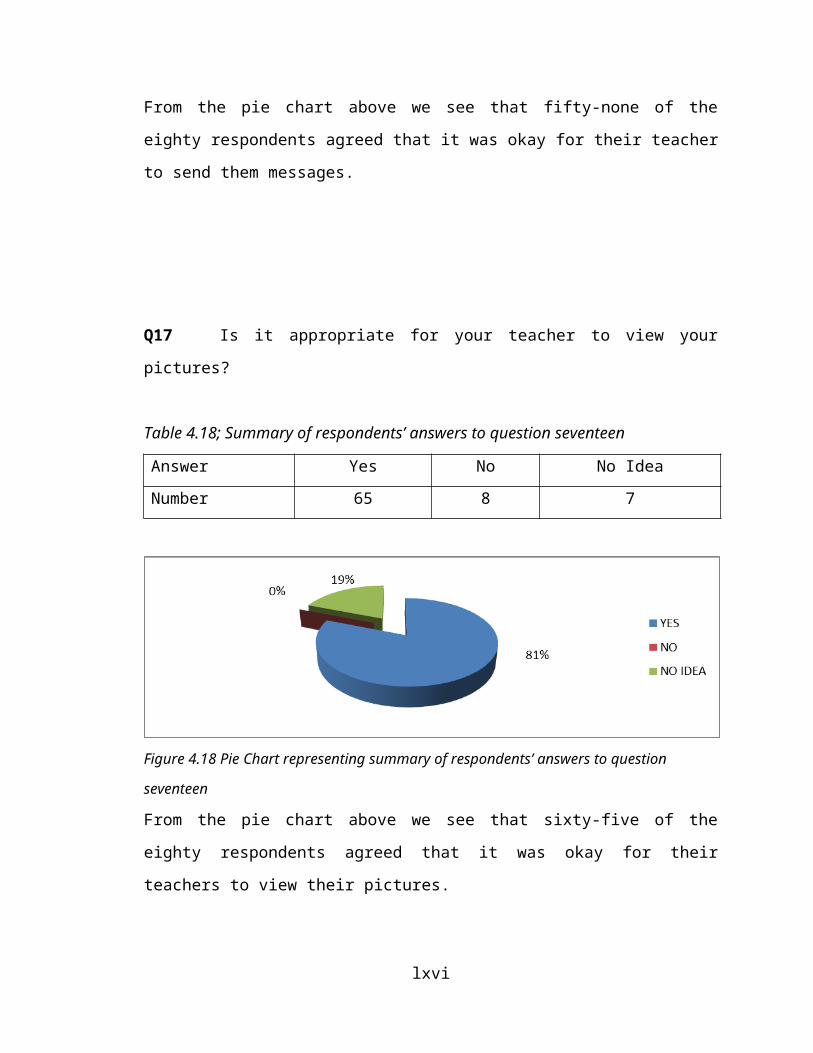
Figure 4.46; One-tailed test α = 0.05 for the inferential data analysis based on Category B respondents
4.5.4.2 Inferential Data Analysis Based on Category Respondents
Step 1: State the hypothesis
H0: The use of Facebook as an interactive medium between teachers and students
ameliorates their relationship in the academic milieu.
H1: The use of Facebook as an interactive medium between teachers and students does
not ameliorate their relationship in the academic milieu.
Step 2: Choose the Statistical test and give the reason for your choice:
The one-sample (Chi Square) is used to compare the observed distribution to a
hypothesized distribution. The is used because the responses are classified into nominal
categories and there are sufficient observations.
Step 3: Choose the significance level and give the reason for your choice:
Let α = 0.05. lxvi
Zone of Acceptance
Zone of Rejection
α = 0.05
Critical Value=55.76
Calculated Value= 46
The reason is that we are dealing with a simple social survey and the data is nominal and
also accounts for error margin.
Step 4: Calculations:
Table 4.46; Extrapolated from the composite table
CATEGORY M
M1 M2 M3 M4 M5 M6 M7 M8 M9 M10
14 14 20 17 6 15 17 14 14 14
15.8 15.8 15.8 15.8 15.8 15.8 15.8 15.8 15.8 15.8-1.8 -1.8 4.2 1.2 -9.2 -0.8 1.2 -1.8 -1.8 -1.80.2 0.2 1.2 0.9 5.6 0.0 0.9 0.2 0.2 0.2
CATEGORY M CONTINUED
M11 M12 M13 M14 M15 M16 M17 M18 M19 M20 M21 M22 M23 M244M25 M26 M27 M28 M29 M30 TOTAL
17 20 20 15 20 11 10 20 20 8 20 17 7 10 20 20 20 20 15 20 475
15.8
15.8
15.8 15.8 15.8 15.8 15.8 15.8 15.8 15.8
15.8 15.8 15.8 15.8
15.8
15.8 15.8 15.8 15.8
15.8 15.8
1.2 4.2 4.2 -0.8 4.2 -4.8 -5.8 4.2 4.2 -7.8
4.2 1.2 -8.8 -5.8
4.2 4.2 4.2 4.2 -0.2
4.2 0.0
0.9 1.2 1.4 0.0 1.2 1.5 2.2 1.2 1.2 3.9 1.2 0.9 4.9 2.2 1.2 1.2 1.2 1.2 0.0 1.2 39.5
=
=Chi Square
fo= observed frequency
fe= expected frequency
The table above has individual Chi Square values for each question such that the
cumulative or the sum total gives the calculated value
= 39.5
lxvii
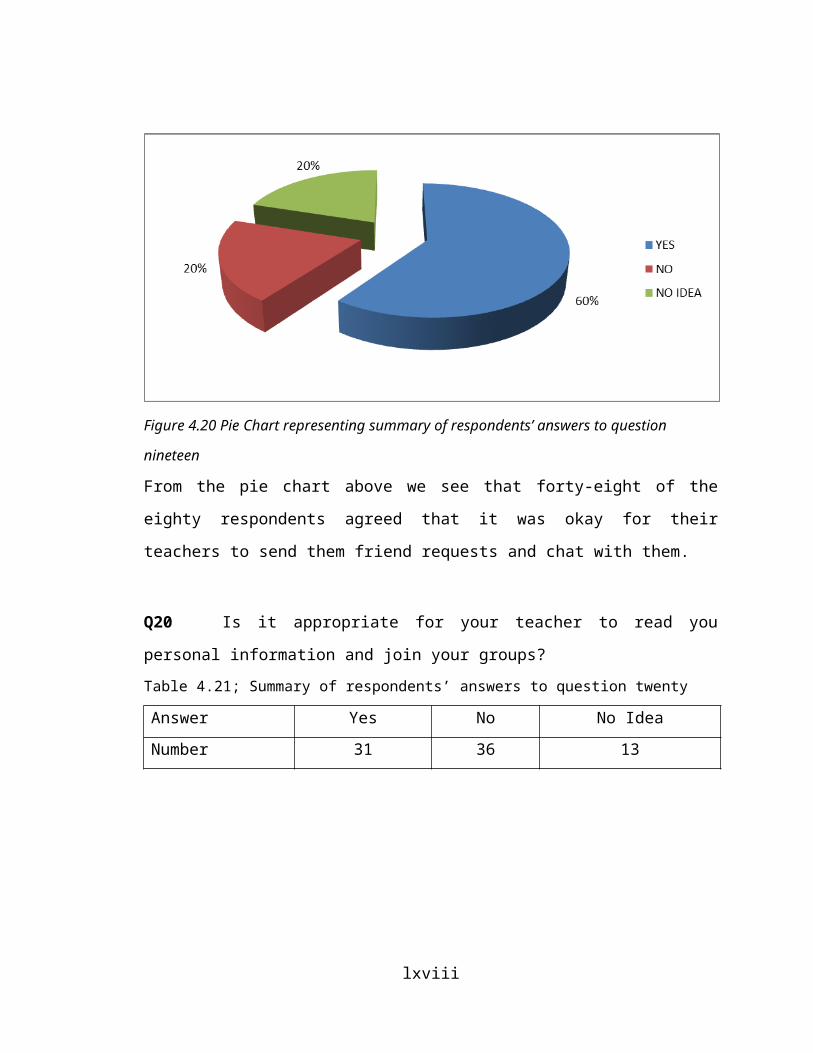
The degree of freedom d.f. is calculated from 10 columns designating the individual
questions and two rows designating the observed and the expected frequencies
d.f. = (c-1)(r-1)
= (2-1)(30-1)= 29
Step 5: The critical value:
From the Chi Square table we can get the critical value from a d.f. = 29 and α = 0.05
Using these 2 parameters we find out from the table above that the critical value is =
43.77
Step 6: Interpret
We observe that this critical value (43.77) far greater than the calculated Chi Square
value (39.5), so we accept the null hypothesis. In other words, the calculated value is in
the zone of acceptance as indicated by the following diagram:
Figure 4.46: One-tailed test α = 0.05 for the inferential data analysis based on Category M respondent
lxviii
Zone of Acceptance
Zone of Rejection
α = 0.05
Calculated Value= 39.5
Critical Value=
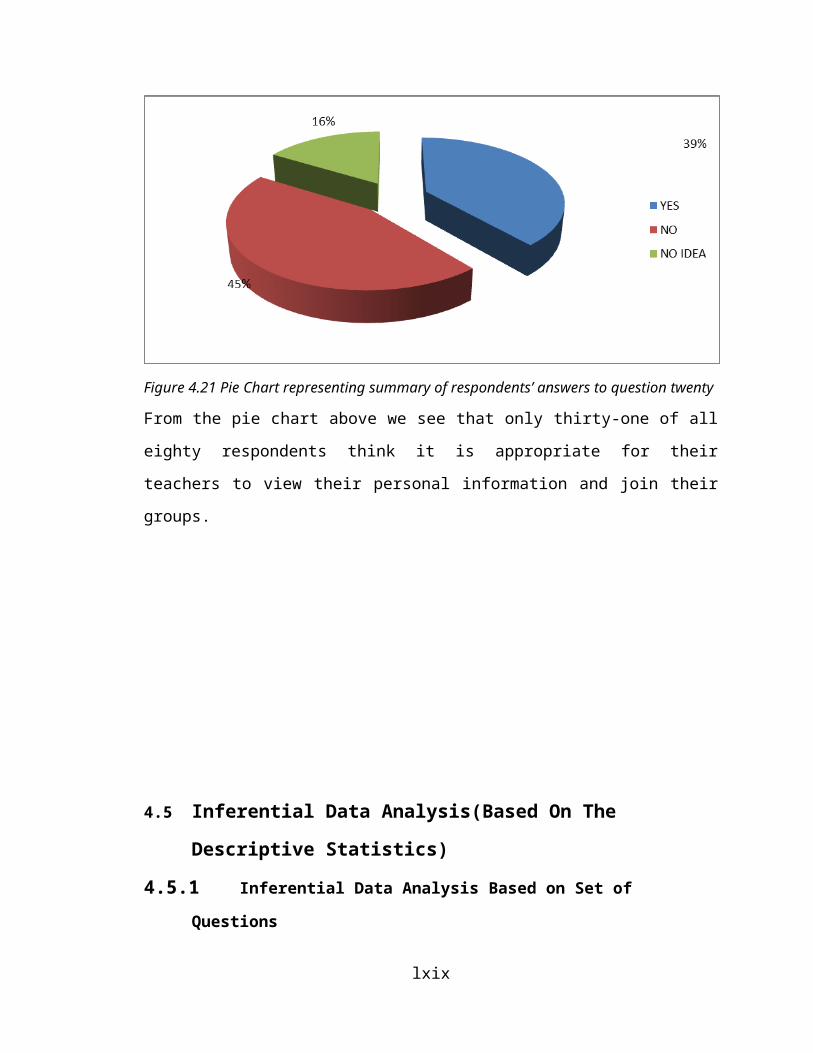
CHAPTER FIVEDISCUSSION, LIMITATIONS, PROBLEMS ENCOUNTERED,
CONCLUSION AND RECOMMENDATIONS
5.1 Discussion Of Results (Justification Of Hypothesis)
The goal of this research is to begin to understand the perceptions students have toward
interaction with their teachers on the social networking site, Facebook. With increased
integration of teachers into the realm of Facebook, norms are still being created and
modified concerning interaction with students (Ellison, Steinfield, Lampe, 2007; Mazer,
Murphy, Simonds, 2007; Mitchell & Watstein, 2007; Patton, 2007; Pempek,
Yermolayeva, Calvert, 2008; O’Malley, 2010). These norms must be identified and
mediated by and between both students and teachers. As little research has been done
surrounding student perceptions of student-teacher interaction on Facebook, this study
looked to identify four major areas of importance surrounding student-teacher interaction
lxix
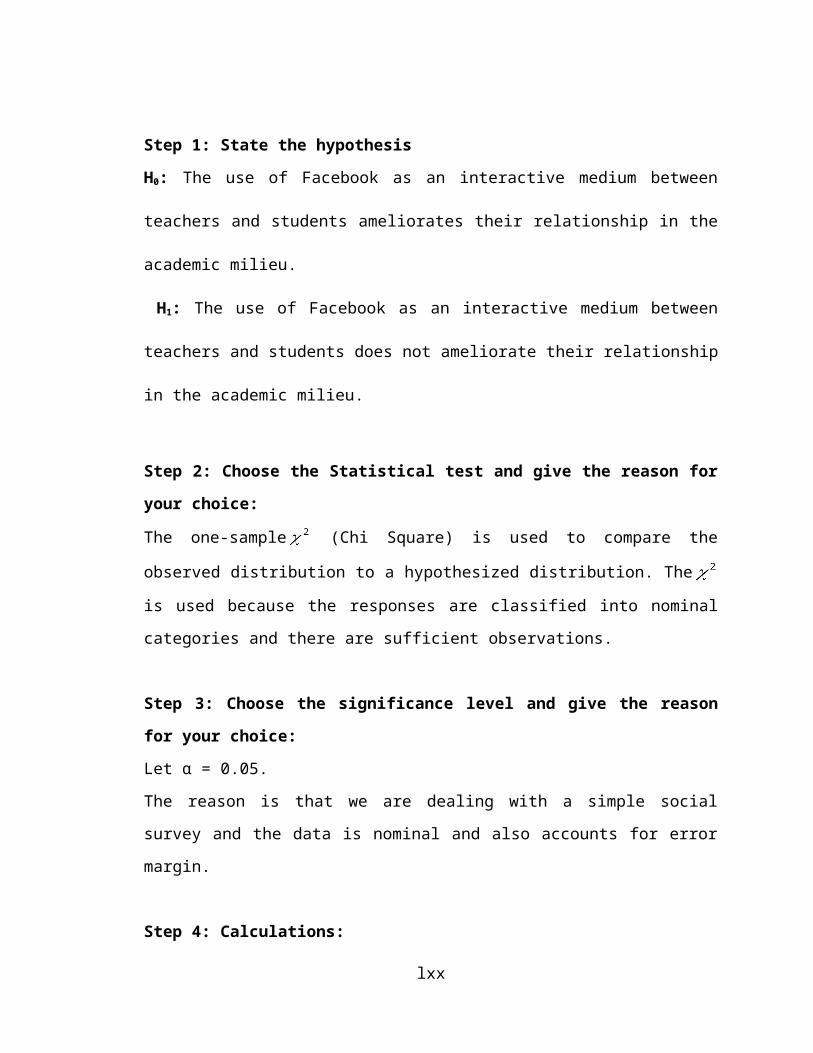
on Facebook. First, this research examined student perceptions toward the use of
facebook as an interactive medium with their teachers. Second, this study examined
which interactions are most appropriate to students. Third, the study analyzed what
interactions students find most convenient with their teachers. The varying results and
corresponding implications of the current study warrant further in-depth discussion. Data
analysis in the current study found significant results in two areas.
H0: The use of Facebook as an interactive medium between teachers and students
ameliorates their relationship in the academic milieu.
H1: The use of Facebook as an interactive medium between teachers and students does
not ameliorate their relationship in the academic milieu.
From the hypotheses, restated for convenience here, we observe that a total number of
options for or against or indifference to it is 1600. Of the 1600 options 1224 were in
agreement (yes) given a percentage of 77% to the fact of the HO which states that the use
of Facebook as an interactive medium between teachers and students ameliorates their
relationship in the academic milieu. However, 274 of the responses disagreed (no) giving
17% and the remaining 102 of 1600 responses were indifferent (no idea) leaving us with
6%. Apart from generally discussing, we are equally going to see those elements that lent
validity and reliability to our result.
lxx
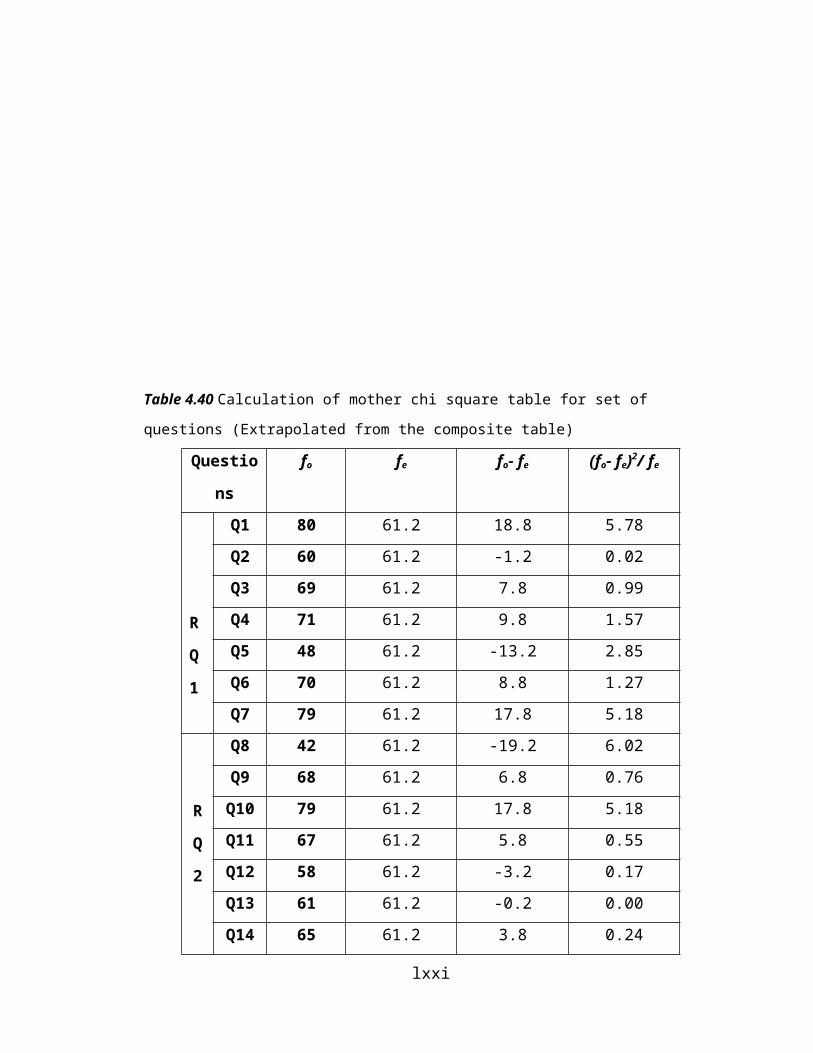
Figure 6.1: Mother Pie Chart showing Summary of Field Findings.
From chapter four we calculated inferential data analysis based on (1) set of questions
and also based on (2) the set respondents.
1. Based on the set of respondents the critical value (30.14) is less than the
calculated Chi Square value (51.29) thereby giving us reason to reject the null
hypothesis. It should be noted here that although there are a number of social
networking sites available for research (Friendster, LinkedIn, MySpace, Twitter)
Facebook is the one that began as a tool for those in academia. When first
launched, only individuals with educational institution emails (i.e., .edu) were
able to join the site. The criterion for membership has changed and individuals no
longer need an educational email address. Facebook still maintains a vast appeal
to college students (Lupsa, 2006). Eillison et al. (2007) found that 94 percent of
their sampled college students had a Facebook account. Being the largest and
most influential social networking site (Gross, 2009), Facebook is the logical
choice for such research concerning students and teachers. The new privacy
restrictions have also made Facebook the logical choice because individuals can
now control who has access to each part of their profile (Richmond, 2009;
lxxi
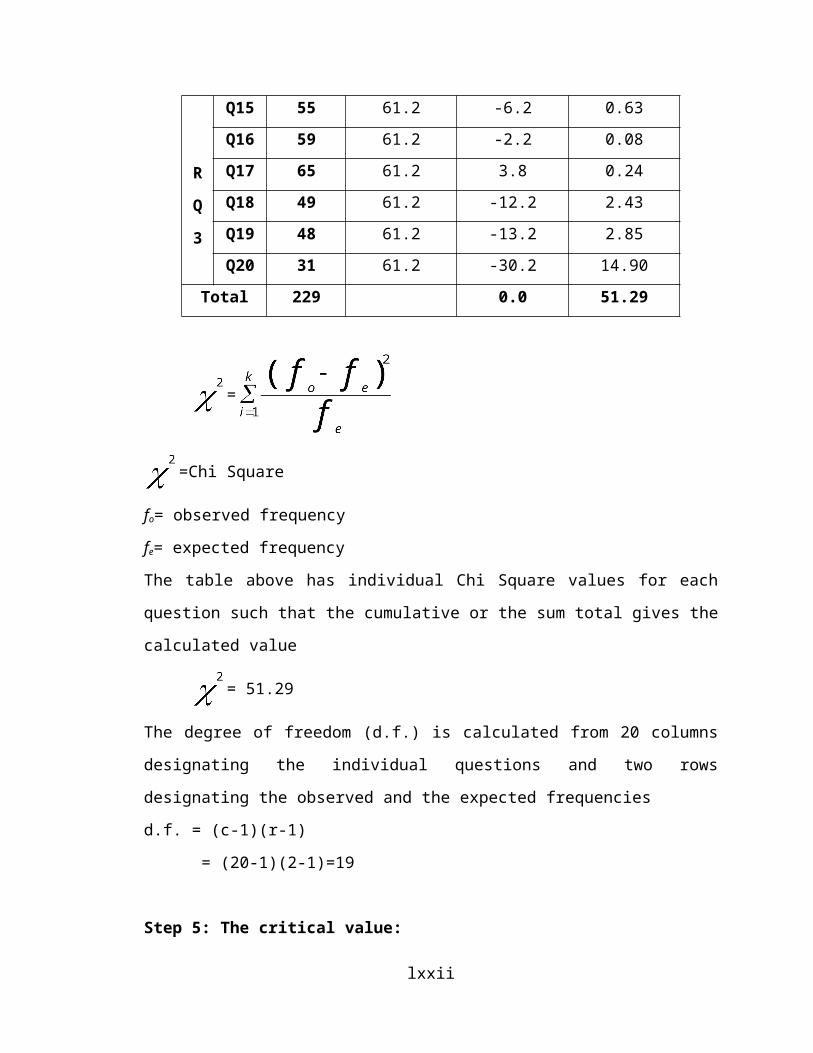
Richmond, 2010). Previous academic research concerning Facebook and student-
teacher relationships has focused on privacy and self-disclosure (boyd, 2008;
Mazer, Murphy, and Simonds, 2007). Mazer et al. (2007) tested whether teacher
self-disclosure (on Facebook) would have an impact on student motivation,
affective learning, and classroom climate. Mazer et al. created three different
Facebook profiles with different levels of disclosure available for the same
teacher. They concluded that higher levels of disclosure might have led to “higher
levels of anticipated motivation and affective learning and lead to a more
comfortable classroom climate” (Mazer et al., 2007, p. 12). This research showed
that students who interacted with their teacher were able to build a social
connection and “may feel more comfortable communicating in the classroom”
and such interaction “may have a positive influence on important learning
outcomes” (Mazer et al., 2007, p. 13).
2. From the set of research questions we realize that all three research questions
agree or accept the null hypothesis, which strongly confirms the reason for us to
say without compromise that the information gathered from all research questions
is reliable.
Respondent’s Category
Based on Bachelor’s Degree Students’ Responses, we observe that the
critical value (55.46) is more than the calculated Chi Square value (46), which is
relatively close to the point of symmetry or total agreement. This category of
lxxii

respondents has simply proven that they are highly reliable and seemingly know
what benefits there are if and when they interact with their teachers on Facebook.
Based on Masters Students’ Respondents, We observe that this critical
value 43.77 is greater than the calculated Chi Square value 39.5, which falls
within the zone of acceptance, so we accept the null hypothesis.
From the above observations, we see that both categories of respondents accept
the null hypothesis. However it is obvious that out of class communication with
teachers is necessary to students’ behaviors in class. Interaction allows a student
and teacher a means to gather information from each other without having to rely
solely on face-to-face communication. Interaction on social networks like
Facebook, allows users to gather small bits of information without going in-depth
in the type of information they are trying to find. This occurs for one of two
reasons. First, either the student or the teacher can limit the amount of information
they want to share with the other party. Second, students and teachers determine
the amount of information they want to actively find about the other party. Social
networking allows for this difference in traditional out of class communication.
Baxter (1988) found that interpersonal relationships have dialectical tensions and
how individuals deal with these tensions depends on the other person and the type
of relationship. Because student-teacher relationships are interpersonal in nature
(Frymier & Houser, 2000) we would expect dialectical tensions to be found
within these relationships. Social networking can help manage these tensions,
especially the need for openness and closedness, as well as autonomy-
connectedness, because students and teachers now have another route to gather
lxxiii
information from each other that also allows the individual to choose how much
they want to participate. Specific classroom tensions have also been researched
and student-teacher interaction on social networking can also help manage these
tensions. Prentice and Kramer (2006) argue that three dialectical tensions are
found within a classroom setting pertaining to students. The three tensions are:
student’s desire to participate and their desire to remain silent; student’s desire for
predictable and novel classroom activities; and a student’s management of
personal time and class time (Prentice & Kramer, 2006).
5.2 Limitations
Although the research provides a start to analyzing students’ perceptions of student-
teacher interaction on Facebook, there were some limitations to the current study that
need to be discussed.
One limitation to the study is that the questionnaire could have been more
effective in collecting a sample of responses for the difference between student
perceptions concerning teacher age. To properly analyze the hypothesis (students
will be more inclined to interact with a teacher of similar age, rather than a
teacher from a different age group) the participant sample needs a wider range of
ages. The first limitation to the analysis of research question two was found in the
operation of the questions. The participants were given directions to answer the
following two questions as to how they would perceive the initiation of
interaction between students and teachers on Facebook: a teacher initiating
interaction by sending a student a friend request and a student initiating
interaction by sending a teacher a friend request. Because all participants were
lxxiv

asked to answer the same questions it was difficult to separate how the
participants compared the two different actors initiating interaction. The
responses for these two questions were compiled into a single set of responses
and a dummy variable was created in order to separate the two sets of data and
allow for a comparison of participant responses. Although the sample size was
doubled, the magnitude of the effect was small.
The second limitation to the analysis of research question two was found in the
measurement created to measure “appropriateness”. The measure was created by
using synonyms of the word “appropriate” and then designing a 7-point semantic
differential. Although this measure does begin to attain the basic concept of
“appropriateness,” the created scale may in fact be measuring a different, more
elaborate, concept. The current study finds similarities with the concept of
“liking.” The research of Rubin (1970, 1973) describes liking as an
undifferentiated positive regard. Similarities between the current research
measure and the concept of liking can be found through the use of the terms
“good,” “satisfying,” and valuable but they do not represent a strong operational
measure. Rubin’s measure of liking (1970), however, would not have been a
viable scale for the current study as the liking measure asks about a specific
individual teacher and the current research was looking at a general abstract of
the teacher. An analysis of Westmyer, DiCioccio and Rubin’s (1998) study on
the appropriateness and effectiveness on communication channels, and the
measure used, could offer a more transparent explanation to student perceptions
of student-teacher interaction on Facebook. The questionnaire created by
Westmyer et al. (1998) contained items measuring the appropriateness and
lxxv
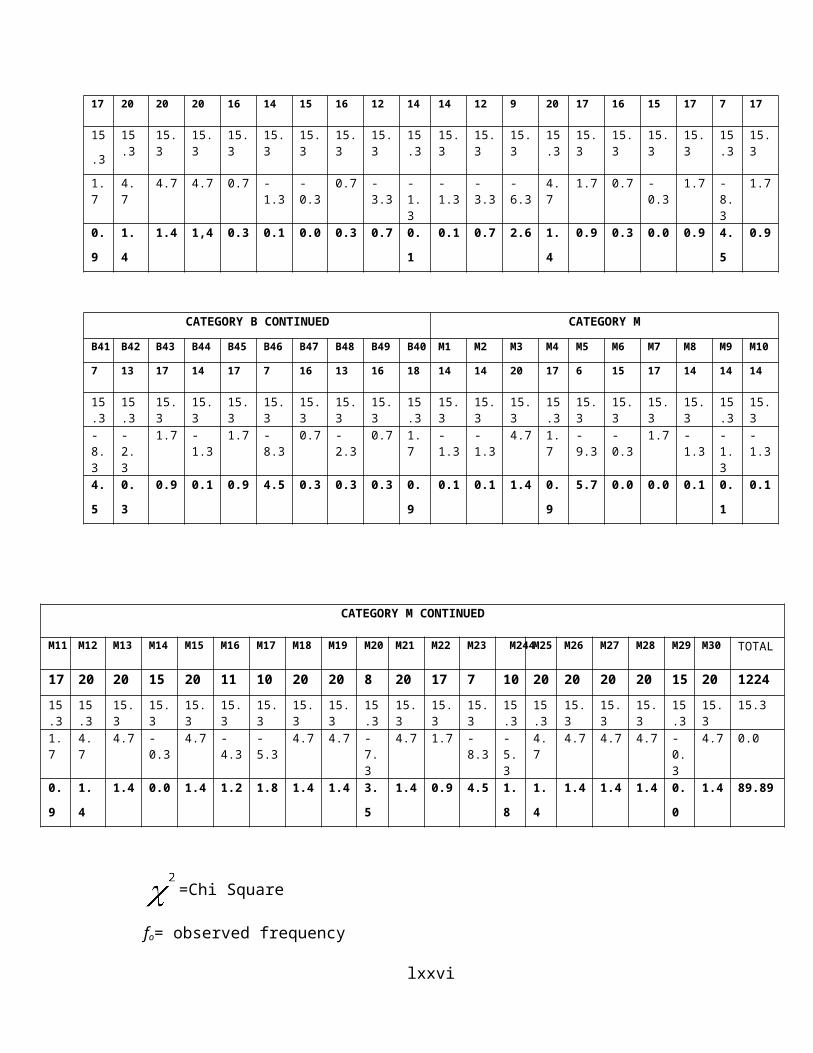
effectiveness of different communication channels used for different types of
communication. Future research could not only utilize this measure to gauge
student perceptions of who should initiate interaction on Facebook, but also to
measure student perceptions on what type of information should be shared on
Facebook. The analysis of information sharing through different communication
channels could be very effective in advancing an understanding of student-
teacher interaction on Facebook. Another measure that may have been
appropriate is McCroskey and McCain’s (1974) interpersonal attraction scale.
The use of McCroskey and McCain’s (1974) interpersonal attraction scale may
have allowed for a stronger measurement of student perceptions of interaction
initiation, at least through the dimensions of social and task attraction. However,
the interpersonal attraction scale also has a physical attraction dimension that is
not consistent with the scope of the current research.
5.3 Problems Encountered
It will be absurd to conclude without enumerating the obstacles faced in the course of this study.
The problems encountered were not enormous and were easily overcome. They problems
encountered and the measures put in place to overcome them were as follows;
1. Many students were reluctant to fill the questionnaires and attributed this to their busy
schedules but I made them to understand that the questions were clear and concise and
did not require respondents to write too much. This however motivated people to answer.
2. At the point of data analysis, getting a specific test for hypothesis patterning to the
research question was quite difficult but after concerting my supervisor the Chi Square
test was approved for me to use in analyzing my data.
lxxvi
3. Still at the point of data analysis, I was not quite versed with the use of a composite table
but as time went on and all necessary explanations were given, I was satisfied.
5.4 Conclusion
Facebook has become a 50 billion dollar company (Ortutay, 2011) and its influence on
academia should only increase. Facebook’s popularity among students shows fertile
ground for teachers to try and utilize this social networking site to help stimulate
students’ education. The current study was able to identify that students were open to a
small increase in student-teacher interaction on Facebook, but that such interaction
should remain mostly task oriented. Any
social interaction between students and teachers on Facebook should be limited to the
peripheral level of personal information (Altman and Taylor, 1973). The current research
has found that students would tend to use Facebook interaction with teachers as a form of
“virtual office hours” rather than a tool to foster increased social interaction. The current
study, specifically, shed light on whether students or teachers should initiate such
interaction and began to identify themes as to what information teachers should and
should not share with students through Facebook. Also, the current study found
significance in the perceptions some students hold toward interaction with teachers of
differing sex and age.
This study points to some directions to help navigate future research. There can be
multiple reasons for the creation of certain student perceptions of student-teacher
interaction on Facebook and the current research only begins to scratch the surface.
lxxvii

Teachers need to understand student perceptions of Facebook interaction to further utilize
Facebook as a tool to help increase student education.
5.5 Recommendations
Although some topics for future research have been previously noted, there are areas
worth expanding upon.
First, as the current research focused on students in a traditional four year college,
future research could expand into the realm of community and technical colleges. This
expansion would help research include more non-traditional college student participants.
Expanding the sampling frame to include non-traditional students would allow for greater
generalizability of student perceptions toward interaction on Facebook between teachers
of similar or different ages, as well as provide expanded information toward interaction
with male or female teachers. Non-traditional students may be more open to interaction
with teachers on Facebook as oftentimes there are other circumstances (i.e., jobs, family)
that may diminish their ability to develop significant out-of-class communication with a
teacher.
Second, future research should be expanded to include new areas of analysis.
Future research should look to include student perceptions on when students feel it would
be more beneficial to interact with a teacher on Facebook. The current study assumes that
interaction will take place while the student is currently enrolled in the teacher’s class.
However, a student may feel that a teacher’s out-of-class availability, as well as in-class
interaction, meets their expectation of student-teacher interaction while currently enrolled
in the class. When the class has concluded, and the student no longer has consistent
interaction with the teacher, the student may then feel that Facebook would be a viable
lxxviii
option to maintain interaction with the teacher. Also, future studies should increase the
amount of qualitative research done on student-teacher interaction on Facebook to help
understand student perceptions. Future qualitative research on the topic could help
increase understanding of whether students view Facebook interaction with teachers
positively or negatively, explore student opinions of how teachers could effectively
interact with students on Facebook, and identify how this interaction should take place
between the student and the teacher.
QUESTIONNAIRE
I am a 400 level student of the department of Journalism and Mass Communication
carrying out a study on; What students find appropriate in student–teacher
interaction on Facebook. The information you provide will be strictly confidential and
used for academic purposes only. I count on your sincere responses to make this study a
success. Place a tick (√) in the boxes that correspond to your choice. Thanks for your
cooperation.
Part One: Demographics
NAME (optional)………………………………………………………………………………….
SEX Male Female
Department…………………………………………………………………………………
Part Two: Research Questions
lxxix

Research Question One: Does students’ knowledge of Facebook have an impact on student-teacher interaction?
(1) Do you know about Facebook? Yes No No Idea
(2) Do you freauently visit Facebook? Yes No No Idea
(3) Do you usually spend a huge amount of time on Facebook? Yes No No Idea
(4) Would you agree that Facebook has helped you increased your level of interaction and has helped in your education? Agree Disagree Neutral
(5) Would you fancy interacting with your lecturers on Facebook? Yes No No Idea
(6) Would you agree that interacting with your lecturers on Facebook has improved on your grades? Yes No No Idea
(7) Would you agree that Facebook as a social media is satisfactory? Agree Disagree Neutral
Research Question Two : Which interactive behaviors are most appropriate between students and teachers?
Question No:
Is it appropriate for you to...?
Agree Disagree Neither agree nor disagree
8 Poke my teacher
9 Send messages to your teacher
10 View teacher’s profile
11 Comment on your teacher’s wall or picture
12 Send teacher a friend request/chat with your teacher
lxxx
13 Read your teacher’s personal information as well as comment on posts
14 Join your teacher’s groups and watch videos
Research Question Three: What interactive behaviors of teachers are most welcoming to students?
Question No: Is it appropriate for your teacher to...?
Agree Disagree Neither agree nor disagree
15 Poke you
16 Send you messages
17 View your picture
18 Comment on your wall posts or pictures
19 Send you a friend request and chat with you
20 Read your personal information and join your groups?
Thank you for your contribution
lxxxi
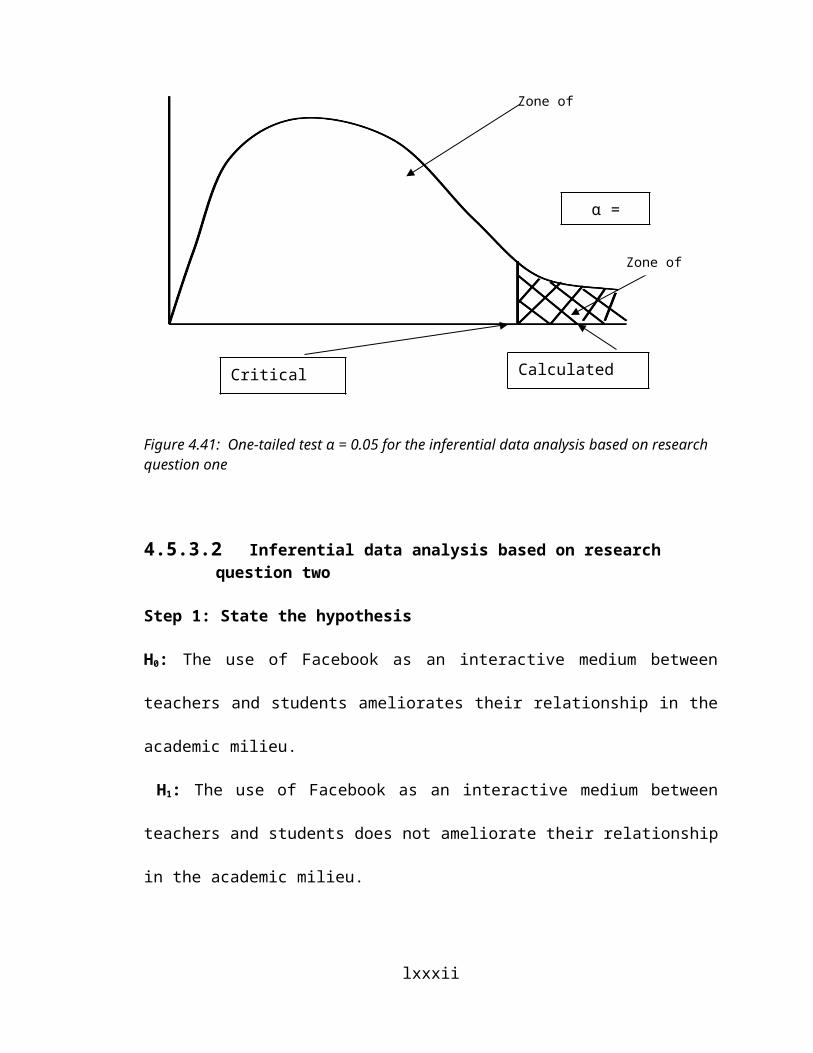
REFERENCES
What students find appropriate in student-teacher interaction on Facebook.By
Berhane Teclehaimanot and Torey Hickman; May/June 2010.
McCroskey, J. C., & Richmond, V. P. (1983). Power in the classroom I:
Teacher and student perceptions. Communication Education, 32, p. 175-184.
Mazer, J. P., Murphy, R. E., & Simonds, C. J. (2007). I’ll see you on
“facebook”: The effects of computer-mediated teacher self-disclosure on
student motivation, affective learning, and classroom climate.
Communication Education, 56, p. 1-17.
Mazer, J. P., Murphy. R. E., & Simonds, C. J. (2009). The effects of teacher
self-disclosure via facebook on teacher credibility. Learning, Media and
TechnoChristofides, E., Muise, A., & Desmarais, S. (2009). Information
disclosure and control on
lxxxii
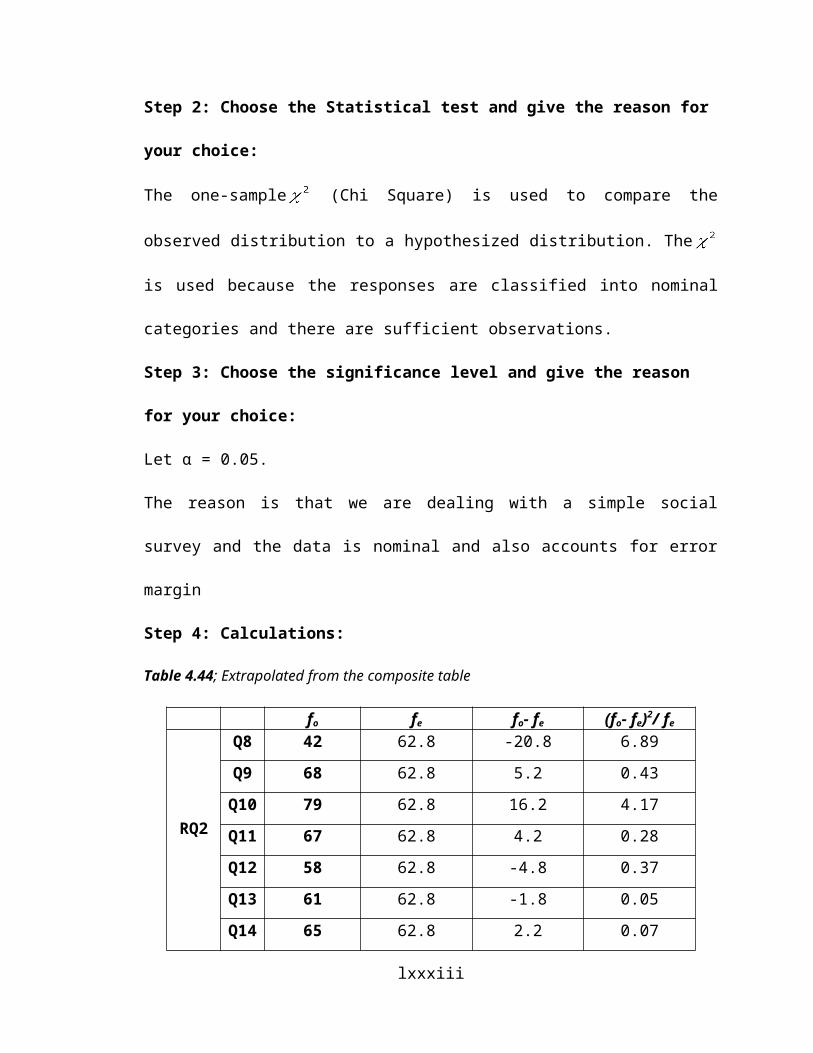
facebook: Are they two sides of the same coin or two different processes?
CyberPsychology & Behavior, 12, p. 341-345.
Davis, H. A. (2003). Conceptualizing the role and influence of student-
teacher relationships on children’s social and cognitive development.
Educational Psychologist, 38, p. 201-234.
Dobransky, N. D., & Frymier, A. B. (2004). Developing teacher-student
relationships through out of class communication. Communication Quarterly,
52 (3), p. 211-223logy, 34, p. 175-183
McCarthy, C. (2010, April 30). Facebook’s impending fight with D.C. CNet
News. Retrieved from http://news.cnet.com/8301-13577_3-20003717-
36.html
McCroskey, J. C., & McCain, T. A. (1974). The measurement of
interpersonal attraction. Communication Monographs, 41, p. 261-266.
Maloney, E. 2007. What Web 2.0 can teach us about learning. Chronicle of
Higher Education.
Margarett Hartmann. (2009) What is appropriate student- teacher interaction?
Reasons Why Educators Need To Embrace Internet Technologies.
A face(book) in the crowd: Social searching vs. social browsing. In
Proceedings of ACM CSCW06 Conference on Computer-Supported
Cooperative Work (pp. 167-170). New York, NY:
2008 Conference on Computer Sup-ported Cooperative Work(pp. 721-730).
New York, NY: ACM Press.
Teacher Education. (2008). Profes-sional standards for the accreditation of
teacher preparation institutions. Retrieved from http://www.ncate.org/
lxxxiii
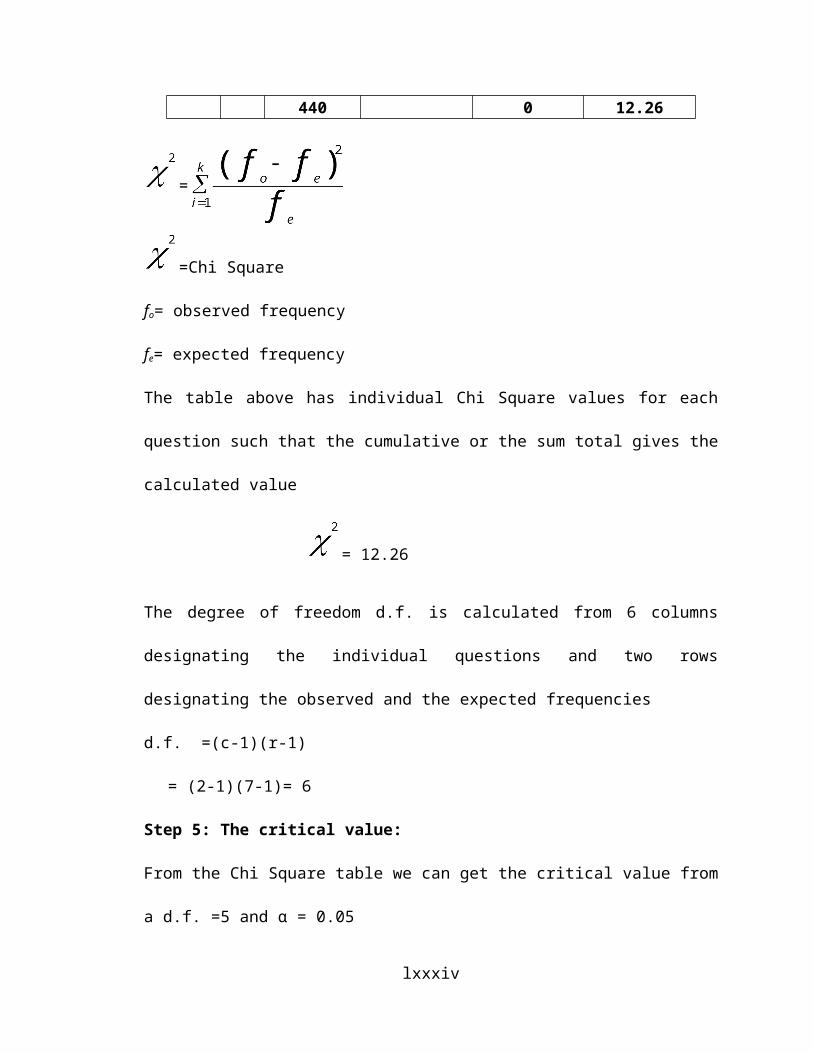
(Davis, 1989)The Technology Acceptance Model, version 1.
Unified Theory of Acceptance and Use of Technology (or UTAUT,
Venkatesh et al. 2003).
Donner, M. B. (2009). Myspace, your space, facebook and blogs: Self-
disclosure on the Internet.TheCalifornia Psychologist, 28.
Kolbert, J. B., Morgan, B., & Brendel, J. M. (2002). Faculty and student
perceptions of dual relationships within counselor education: A qualitative
analysis.Counselor Education and Supervision, 41,193–206.
McNaughton, D., & Rawling, P. (2006). Deontology. In D. Copp (Ed.),The
Oxford handbook of ethical theory (pp. 424–458). New York, New York:
Oxford University Press.
lxxxiv