Embed Size (px)
Citation preview
Fuel Cell Handbook
(Sixth Edition)
DOE/NETL-2002/1179
By EG&G Technical Services, Inc.
Science Applications International Corporation
Under Contract No. DE-AM26-99FT40575
U.S. Department of Energy Office of Fossil Energy
National Energy Technology Laboratory P.O. Box 880
Morgantown, West Virginia 26507-0880
November 2002

DISCLAIMER This report was prepared as an account of work sponsored by an agency of the United States Government. Neither the United States Government nor any agency thereof, nor any of their employees, makes any warranty, express or implied, or assumes any legal liability or respon-sibility for the accuracy, completeness, or usefulness of any information, apparatus, product, or process disclosed, or represents that its use would not infringe privately owned rights. Reference herein to any specific commercial product, process, or service by trade name, trademark, manu-facturer, or otherwise does not necessarily constitute or imply its endorsement, recommendation, or favoring by the United States Government or any agency thereof. The views and opinions of authors expressed herein do not necessarily state or reflect those of the United States Govern-ment or any agency thereof. Available to DOE and DOE contractors from the Office of Scientific and Technical Information, P.O. Box 62, 175 Oak Ridge Turnpike, Oak Ridge, TN 37831; prices available at (423) 576-8401, fax: (423) 576-5725, E-mail: [email protected] Available to the public from the National Technical Information Service, U.S. Department of Commerce, 5285 Port Royal Road, Springfield, VA 22161; phone orders accepted at (703) 487-4650.
i
TABLE OF CONTENTS
Section Title Page 1. TECHNOLOGY OVERVIEW ................................................................................................. 1-1
1.1 FUEL CELL DESCRIPTION ................................................................................................ 1-1 1.2 CELL STACKING .............................................................................................................. 1-7 1.3 FUEL CELL PLANT DESCRIPTION .................................................................................... 1-8 1.4 CHARACTERISTICS........................................................................................................... 1-9 1.5 ADVANTAGES/DISADVANTAGES................................................................................... 1-11 1.6 APPLICATIONS, DEMONSTRATIONS, AND STATUS ........................................................ 1-13
1.6.1 Stationary Electric Power................................................................................. 1-13 1.6.2 Distributed Generation ..................................................................................... 1-22 1.6.3 Vehicle Motive Power...................................................................................... 1-25 1.6.4 Space and Other Closed Environment Power .................................................. 1-27 1.6.5 Fuel Cell Auxiliary Power Systems ................................................................. 1-27 1.6.6 Derivative Applications ................................................................................... 1-36
1.7 REFERENCES.................................................................................................................. 1-36
2. FUEL CELL PERFORMANCE............................................................................................... 2-1
2.1 GIBBS FREE ENERGY AND NERNST POTENTIAL.............................................................. 2-1 2.1.1 Ideal Performance .............................................................................................. 2-4 2.1.2 Cell Energy Balance........................................................................................... 2-6 2.1.3 Cell Efficiency ................................................................................................... 2-7 2.1.4 Efficiency Comparison to Heat Engines ............................................................ 2-9 2.1.5 Actual Performance............................................................................................ 2-9 2.1.6 Fuel Cell Performance Variables ..................................................................... 2-14
2.2 COMPUTER MODELS...................................................................................................... 2-22 2.2.1 System Models ................................................................................................. 2-22 2.2.2 Mechanistic Models ......................................................................................... 2-24
2.3 REFERENCES.................................................................................................................. 2-26
3. POLYMER ELECTROLYTE FUEL CELLS ........................................................................ 3-1
3.1 CELL COMPONENTS......................................................................................................... 3-1 3.1.1 State-of-the-Art Components ............................................................................. 3-6 3.1.2 Development Components ............................................................................... 3-11
3.2 PERFORMANCE .............................................................................................................. 3-13 3.3 DIRECT METHANOL PROTON EXCHANGE FUEL CELL .................................................. 3-16 3.4 REFERENCES.................................................................................................................. 3-17
4. ALKALINE FUEL CELL ......................................................................................................... 4-1
4.1 CELL COMPONENTS......................................................................................................... 4-5 4.1.1 State-of-the-Art Components ............................................................................. 4-5 4.1.2 Development Components ................................................................................. 4-6
4.2 PERFORMANCE ................................................................................................................ 4-7 4.2.1 Effect of Pressure ............................................................................................... 4-8 4.2.2 Effect of Temperature ........................................................................................ 4-9 4.2.3 Effect of Impurities .......................................................................................... 4-11 4.2.4 Effects of Current Density................................................................................ 4-12 4.2.5 Effects of Cell Life........................................................................................... 4-14
4.3 SUMMARY OF EQUATIONS FOR AFC............................................................................. 4-14

ii
4.4 REFERENCES.................................................................................................................. 4-16
5. PHOSPHORIC ACID FUEL CELL ........................................................................................ 5-1
5.1 CELL COMPONENTS......................................................................................................... 5-2 5.1.1 State-of-the-Art Components ............................................................................. 5-2 5.1.2 Development Components ................................................................................. 5-6
5.2 PERFORMANCE .............................................................................................................. 5-11 5.2.1 Effect of Pressure ............................................................................................. 5-12 5.2.2 Effect of Temperature ...................................................................................... 5-13 5.2.3 Effect of Reactant Gas Composition and Utilization ....................................... 5-14 5.2.4 Effect of Impurities .......................................................................................... 5-16 5.2.5 Effects of Current Density................................................................................ 5-19 5.2.6 Effects of Cell Life........................................................................................... 5-20
5.3 SUMMARY OF EQUATIONS FOR PAFC........................................................................... 5-21 5.4 REFERENCES.................................................................................................................. 5-22
6. MOLTEN CARBONATE FUEL CELL .................................................................................. 6-1
6.1 CELL COMPONENTS......................................................................................................... 6-4 6.1.1 State-of-the-Art Componments .......................................................................... 6-4 6.1.2 Development Components ................................................................................. 6-9
6.2 PERFORMANCE .............................................................................................................. 6-13 6.2.1 Effect of Pressure ............................................................................................. 6-15 6.2.2 Effect of Temperature ...................................................................................... 6-19 6.2.3 Effect of Reactant Gas Composition and Utilization ....................................... 6-21 6.2.4 Effect of Impurities .......................................................................................... 6-25 6.2.5 Effects of Current Density................................................................................ 6-30 6.2.6 Effects of Cell Life........................................................................................... 6-30 6.2.7 Internal Reforming ........................................................................................... 6-30
6.3 SUMMARY OF EQUATIONS FOR MCFC ......................................................................... 6-34 6.4 REFERENCES.................................................................................................................. 6-38
7. SOLID OXIDE FUEL CELL.................................................................................................... 7-1
7.1 CELL COMPONENTS......................................................................................................... 7-1 7.1.1 State-of-the-Art Components ............................................................................. 7-1 7.1.2 Cell Configuration Options .............................................................................. 7-12 7.1.3 Development Status ......................................................................................... 7-17
7.2 PERFORMANCE .............................................................................................................. 7-25 7.2.1 Effect of Pressure ............................................................................................. 7-26 7.2.2 Effect of Temperature ...................................................................................... 7-27 7.2.3 Effect of Reactant Gas Composition and Utilization ....................................... 7-29 7.2.4 Effect of Impurities .......................................................................................... 7-32 7.2.5 Effect of Current Density ................................................................................. 7-34 7.2.6 Effect of Cell Life ............................................................................................ 7-34
7.3 SUMMARY OF EQUATIONS FOR SOFC........................................................................... 7-35 7.4 REFERENCES.................................................................................................................. 7-35
8. FUEL CELL SYSTEMS............................................................................................................ 8-1
8.1 SYSTEM PROCESSES ........................................................................................................ 8-2 8.1.1 Fuel Processing .................................................................................................. 8-2
8.2 POWER CONDITIONING.................................................................................................. 8-27 8.2.1 Introduction to Fuel Cell Power Conditioning Systems................................... 8-27

iii
8.2.2 Fuel Cell Power Conversion for Supplying a Dedicated / Stand-Alone Load . 8-60 8.2.3 Fuel Cell Power Conversion for Supplying Backup Power (UPS) to a Load
Connected to a Local Utility ............................................................................ 8-72 8.2.4 Fuel Cell Power Conversion for Supplying a Load Operating in Parallel With the
Local Utility .................................................................................................... 8-79 8.2.5 Fuel Cell Power Conversion for Connecting Directly to the Local Utility...... 8-80 8.2.6 Power Conditioners for Automotive Fuel Cells ............................................... 8-82 8.2.7 Power Conversion Architectures for a Fuel Cell Turbine Hybrid Interfaced to
Local Utility ..................................................................................................... 8-84 8.2.8 Fuel Cell Ripple Current ................................................................................. 8-87 8.2.9 System Issues: Power Conversion Size, Cost .................................................. 8-88
8.3 REFERENCES (SECTIONS 8.1 AND 8.2) ........................................................................... 8-89 8.4 SYSTEM OPTIMIZATION................................................................................................. 8-93
8.4.1 Pressure ............................................................................................................ 8-93 8.4.2 Temperature ..................................................................................................... 8-95 8.4.3 Utilization......................................................................................................... 8-96 8.4.4 Heat Recovery.................................................................................................. 8-97 8.4.5 Miscellaneous................................................................................................... 8-98 8.4.6 Concluding Remarks on System Optimization ................................................ 8-98
8.5 FUEL CELL SYSTEM DESIGNS ....................................................................................... 8-99 8.5.1 Natural Gas Fueled PEFC System ................................................................... 8-99 8.5.2 Natural Gas Fueled PAFC System................................................................. 8-100 8.5.3 Natural Gas Fueled Internally Reformed MCFC System .............................. 8-103 8.5.4 Natural Gas Fueled Pressurized SOFC System.............................................. 8-104 8.5.5 Natural Gas Fueled Multi-Stage Solid State Power Plant System ................. 8-109 8.5.6 Coal Fueled SOFC System (Vision 21) ......................................................... 8-113 8.5.7 Power Generation by Combined Fuel Cell and Gas Turbine System ............ 8-116 8.5.8 Heat and Fuel Recovery Cycles ..................................................................... 8-117
8.6 FUEL CELL NETWORKS ............................................................................................... 8-129 8.6.1 Molten Carbonate Fuel Cell Networks: Principles, Analysis and Performance............................................................................................. 8-129 8.6.2 MCFC Network.............................................................................................. 8-133 8.6.3 Recycle Scheme ............................................................................................. 8-133 8.6.4 Reactant Conditioning Between Stacks in Series........................................... 8-133 8.6.5 Higher Total Reactant Utilization .................................................................. 8-134 8.6.6 Disadvantages of MCFC Networks................................................................ 8-135 8.6.7 Comparison of Performance........................................................................... 8-135 8.6.8 Conclusions .................................................................................................... 8-136
8.7 HYBRIDS...................................................................................................................... 8-136 8.7.1 Technology..................................................................................................... 8-136 8.7.2 Projects........................................................................................................... 8-138 8.7.3 World’s First Hybrid Project.......................................................................... 8-140 8.7.4 Hybrid Electric Vehicles (HEV) .................................................................... 8-140
8.8 REFERENCES................................................................................................................ 8-142
9. SAMPLE CALCULATIONS .................................................................................................... 9-1
9.1 UNIT OPERATIONS........................................................................................................... 9-1 9.1.1 Fuel Cell Calculations ........................................................................................ 9-1 9.1.2 Fuel Processing Calculations ........................................................................... 9-13 9.1.3 Power Conditioners .......................................................................................... 9-16 9.1.4 Others ............................................................................................................... 9-16
iv
9.2 SYSTEM ISSUES.............................................................................................................. 9-17 9.2.1 Efficiency Calculations .................................................................................... 9-17 9.2.2 Thermodynamic Considerations ...................................................................... 9-19
9.3 SUPPORTING CALCULATIONS........................................................................................ 9-22 9.4 COST CALCULATIONS.................................................................................................... 9-26
9.4.1 Cost of Electricity ............................................................................................ 9-26 9.4.2 Capital Cost Development ............................................................................... 9-27
9.5 COMMON CONVERSION FACTORS ................................................................................. 9-28 9.6 AUTOMOTIVE DESIGN CALCULATIONS......................................................................... 9-29 9.7 REFERENCES.................................................................................................................. 9-30
10. APPENDIX ............................................................................................................................... 10-1
10.1 EQUILIBRIUM CONSTANTS ............................................................................................ 10-1 10.2 CONTAMINANTS FROM COAL GASIFICATION................................................................ 10-2 10.3 SELECTED MAJOR FUEL CELL REFERENCES, 1993 TO PRESENT................................... 10-4 10.4 LIST OF SYMBOLS........................................................................................................ 10-11 10.5 FUEL CELL RELATED CODES AND STANDARDS.......................................................... 10-14
10.5.1 Introduction .................................................................................................... 10-14 10.5.2 Organizations ................................................................................................. 10-15 10.5.3 Codes & Standards......................................................................................... 10-17 10.5.4 Codes and Standards for Fuel Cell Manufacturers......................................... 10-18 10.5.5 Codes and Standards for the Installation of Fuel Cells .................................. 10-19 10.5.6 Codes and Standards for Fuel Cell Vehicles .................................................. 10-19 10.5.7 Application Permits........................................................................................ 10-20 10.5.8 References ...................................................................................................... 10-21
10.6 FUEL CELL FIELD SITE DATA...................................................................................... 10-21 10.6.1 Worldwide Sites ............................................................................................. 10-21 10.6.2 DoD Field Sites .............................................................................................. 10-23 10.6.3 IFC Field Units............................................................................................... 10-24 10.6.4 FuelCell Energy ............................................................................................. 10-24 10.6.5 Siemens Westinghouse................................................................................... 10-24
10.7 HYDROGEN.................................................................................................................. 10-32 10.7.1 Introduction .................................................................................................... 10-32 10.7.2 Hydrogen Production ..................................................................................... 10-33 10.7.3 DOE’s Hydrogen Research ............................................................................ 10-35 10.7.4 Hydrogen Storage........................................................................................... 10-36 10.7.5 Barriers........................................................................................................... 10-36
10.8 THE OFFICE OF ENERGY EFFICIENCY AND RENEWABLE ENERGY WORK IN FUEL CELLS................................................................................................................. 10-37
10.8.1 The Office of Industrial Technologies ........................................................... 10-38 10.8.2 The Office of Transportation Technologies ................................................... 10-39 10.8.3 The Office of Power Technologies ................................................................ 10-44 10.8.4 Office of Building Technology, State and Community Programs ................. 10-46
10.9 RARE EARTH MINERALS ............................................................................................. 10-47 10.9.1 Introduction .................................................................................................... 10-47 10.9.2 Demand .......................................................................................................... 10-49
10.10 REFERENCES................................................................................................................ 10-49
INDEX ................................................................................................................................................... 11-1

v
LIST OF FIGURES
Figure Title Page Figure 1-1 Schematic of an Individual Fuel Cell ...................................................................1-1 Figure 1-2 Simplified Fuel Cell Schematic............................................................................1-2 Figure 1-3 External Reforming and Internal Reforming MCFC System Comparison ..........1-6 Figure 1-4 Expanded View of a Basic Fuel Cell Repeated Unit in a Fuel Cell Stack...........1-8 Figure 1-5 Fuel Cell Power Plant Major Processes.................................................................1-9 Figure 1-6 Relative Emissions of PAFC Fuel Cell Power Plants
Compared to Stringent Los Angeles Basin Requirements .................................1-10 Figure 1-7 PC-25 Fuel Cell..................................................................................................1-14 Figure 1-8 Combining the SOFC with a Gas Turbine Engine to Improve Efficiency.........1-19 Figure 1-9 Overview of Fuel Cell Activities Aimed at APU Applications .........................1-28 Figure 1-10 Overview of APU Applications .........................................................................1-28 Figure 1-11 Overview of typical system requirements..........................................................1-29 Figure 1-12 Stage of development for fuel cells for APU applications.................................1-30 Figure 1-13 Overview of subsystems and components for SOFC and PEFC systems..........1-32 Figure 1-14 Simplified System process flow diagram of pre-reformer/SOFC system..........1-33 Figure 1-15 Multilevel system modeling approach. ..............................................................1-34 Figure 1-16 Projected cost structure of a 5kWnet APU SOFC system. Gasoline fueled POX reformer, Fuel cell operating at 300mW/cm2, 0.7 V, 90 % fuel utilization, 500,000 units per year production volume.......................................1-36 Figure 2-1 H2/O2 Fuel Cell Ideal Potential as a Function of Temperature ............................2-5 Figure 2-2 Ideal and Actual Fuel Cell Voltage/Current Characteristic .................................2-9 Figure 2-3 Example of a Tafel Plot......................................................................................2-10 Figure 2-4 Contribution to Polarization of Anode and Cathode..........................................2-14 Figure 2-5 Flexibility of Operating Points According to Cell Parameters ..........................2-15 Figure 2-6 Voltage/Power Relationship...............................................................................2-16 Figure 2-7 Dependence of the Initial Operating Cell Voltage of Typical Fuel Cells on
Temperature .......................................................................................................2-18 Figure 2-8 The Variation in the Reversible Cell Voltage as a Function of Reactant Utilization............................................................................................2-20 Figure 3-1a Schematic of Representative PEFC......................................................................3-2 Figure 3-1b Single Cell Structure of Representative PEFC.....................................................3-2 Figure 3-2 PEFC Schematic...................................................................................................3-7 Figure 3-3 Polarization Curves for 3M 7 Layer MEA...........................................................3-8 Figure 3-4 Endurance Test Results for Gore Primea 56 MEA at Three Current Densities..................................................................................................3-9 Figure 3-5 Multi-Cell Stack Performance on Dow Membrane............................................3-11 Figure 3-6 Effect on PEFC Performances of Bleeding Oxygen into the Anode Compartment ..........................................................................................3-13 Figure 3-7 Evolutionary Changes in PEFCs Performance (a) H2/O2, (b) H2/Air, (c) Reformate Fuel/Air, (d) H2/unkown .............................................................3-14 Figure 3-8 Influence of O2 Pressure on PEFCs Performance ..............................................3-15 Figure 3-9 Cell Performance with Carbon Monoxide in Reformed Fuel ............................3-16 Figure 3-10 Single Cell Direct Methanol Fuel Cell Data ......................................................3-17
vi
Figure 4-1 Principles of Operation of H2/O2 Alkaline Fuel Cell, Immobilized Electrolyte ............................................................................................................4-4 Figure 4-2 Principles of Operation of H2/Air Alkaline Fuel Cell, Circulating Electrolyte ............................................................................................................4-4 Figure 4-3 Evolutionary Changes in the Performance of AFCs ............................................4-8 Figure 4-4 Reversible Voltage of the Hydrogen-Oxygen Cell ..............................................4-9 Figure 4-5 Influence of Temperature on O2, (air) Reduction in 12 N KOH........................4-10 Figure 4-6 Influence of Temperature on the AFC Cell Voltage ..........................................4-11 Figure 4-7 Degradation in AFC Electrode Potential with CO2 Containing and CO2 Free Air................................................................................................4-12 Figure 4-8 iR-Free Electrode Performance with O2 and Air in 9 N KOH at 55-60°C. .......4-13 Figure 4-9 iR Free Electrode Performance with O2 and Air in 12N KOH at 65°C. ............4-14 Figure 4-10 Reference for Alkaline Cell Performance ..........................................................4-15 Figure 5-1 Principles of Operation of Phosphoric Acid Fuel Cell.........................................5-2 Figure 5-2 Improvement in the Performance of H2-Rich Fuel/Air PAFCs ...........................5-6 Figure 5-3 Advanced Water-Cooled PAFC Performance......................................................5-8 Figure 5-4 Effect of Temperature: Ultra-High Surface Area Pt Catalyst. Fuel: H2, H2 + 200 ppm H2S and Simulated Coal Gas.......................................5-14 Figure 5-5 Polarization at Cathode (0.52 mg Pt/cm2) as a Function of O2 Utilization, which is Increased by Decreasing the Flow Rate of the Oxidant at Atmospheric Pressure 100% H3PO4, 191°C, 300 mA/cm2, 1 atm. ....................5-15 Figure 5-6 Influence of CO and Fuel Gas Composition on the Performance of Pt Anodes in 100% H3PO4 at 180°C. 10% Pt Supported on Vulcan XC-72, 0.5 mg Pt/cm2. Dew Point, 57°. Curve 1, 100% H2; Curves 2-6, 70% H2 and CO2/CO Contents (mol%) Specified ...........................................................5-18 Figure 5-7 Effect of H2S Concentration: Ultra-High Surface Area Pt Catalyst..................5-19 Figure 5-8 Reference Performances at 8.2 atm and Ambient Pressure. Cells from Full Size Power Plant .........................................................................................5-22 Figure 6-1 Principals of Operation of Molten Carbonate Fuel Cells.....................................6-2 Figure 6-2 Dynamic Equilibrium in Porous MCFC Cell Elements .......................................6-4 Figure 6-3 Progress in the Generic Performance of MCFCs on Reformate Gas and Air .........................................................................................................6-6 Figure 6-4 Effect of Oxidant Gas Composition on MCFC Cathode Performance at 650°C..............................................................................................................6-14 Figure 6-5 Voltage and Power Output of a 1.0/m2 19 cell MCFC Stack after 960 Hours at 965°C and 1 atm, Fuel Utilization, 75%.......................................6-15 Figure 6-6 Influence of Cell Pressure on the Performance of a 70.5 cm2 MCFC at 650°C..................................................................................................6-18 Figure 6-7 Influence of Pressure on Voltage Gain ..............................................................6-19 Figure 6-8 Effect of CO2/O2 Ratio on Cathode Performance in an MCFC, Oxygen Pressure is 0.15 atm..............................................................................6-22 Figure 6-9 Influence of Reactant Gas Utilization on the Average Cell Voltage of an
MCFC Stack.......................................................................................................6-23 Figure 6-10 Dependence of Cell Voltage on Fuel Utilization ...............................................6-25
vii
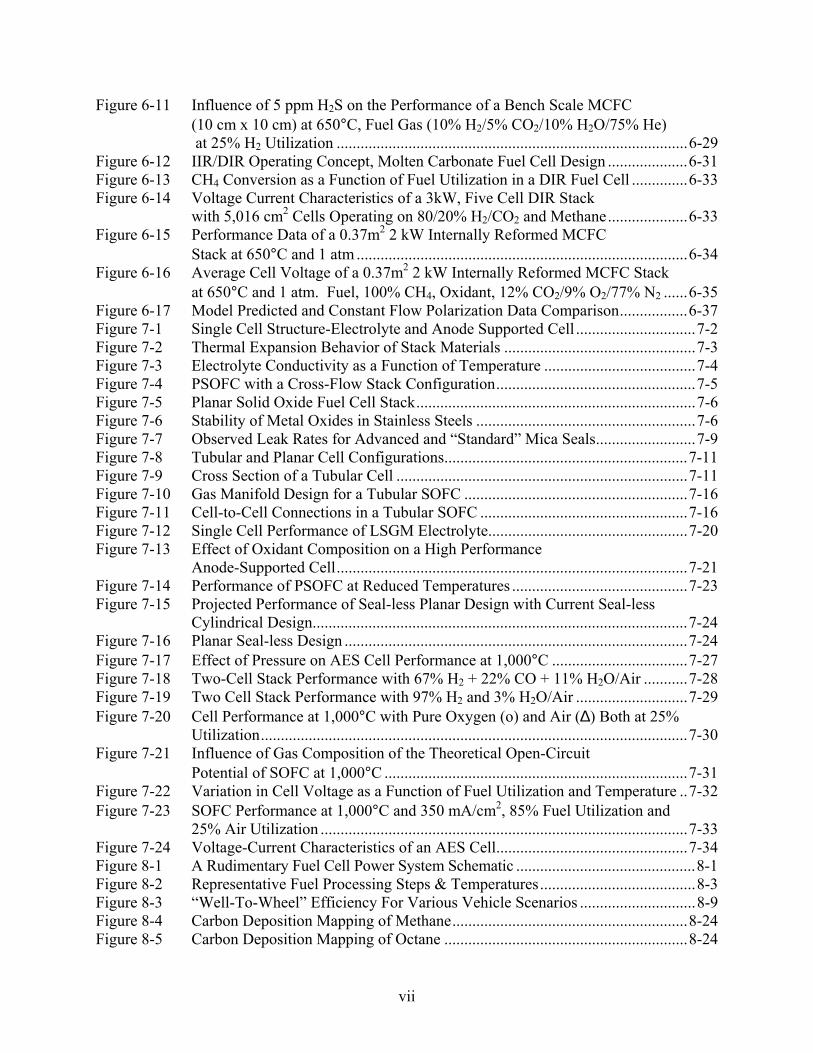
Figure 6-11 Influence of 5 ppm H2S on the Performance of a Bench Scale MCFC (10 cm x 10 cm) at 650°C, Fuel Gas (10% H2/5% CO2/10% H2O/75% He)
at 25% H2 Utilization ........................................................................................6-29 Figure 6-12 IIR/DIR Operating Concept, Molten Carbonate Fuel Cell Design ....................6-31 Figure 6-13 CH4 Conversion as a Function of Fuel Utilization in a DIR Fuel Cell ..............6-33 Figure 6-14 Voltage Current Characteristics of a 3kW, Five Cell DIR Stack
with 5,016 cm2 Cells Operating on 80/20% H2/CO2 and Methane....................6-33 Figure 6-15 Performance Data of a 0.37m2 2 kW Internally Reformed MCFC Stack at 650°C and 1 atm ...................................................................................6-34 Figure 6-16 Average Cell Voltage of a 0.37m2 2 kW Internally Reformed MCFC Stack at 650°C and 1 atm. Fuel, 100% CH4, Oxidant, 12% CO2/9% O2/77% N2 ......6-35 Figure 6-17 Model Predicted and Constant Flow Polarization Data Comparison.................6-37 Figure 7-1 Single Cell Structure-Electrolyte and Anode Supported Cell ..............................7-2 Figure 7-2 Thermal Expansion Behavior of Stack Materials ................................................7-3 Figure 7-3 Electrolyte Conductivity as a Function of Temperature ......................................7-4 Figure 7-4 PSOFC with a Cross-Flow Stack Configuration..................................................7-5 Figure 7-5 Planar Solid Oxide Fuel Cell Stack......................................................................7-6 Figure 7-6 Stability of Metal Oxides in Stainless Steels .......................................................7-6 Figure 7-7 Observed Leak Rates for Advanced and “Standard” Mica Seals.........................7-9 Figure 7-8 Tubular and Planar Cell Configurations.............................................................7-11 Figure 7-9 Cross Section of a Tubular Cell .........................................................................7-11 Figure 7-10 Gas Manifold Design for a Tubular SOFC ........................................................7-16 Figure 7-11 Cell-to-Cell Connections in a Tubular SOFC ....................................................7-16 Figure 7-12 Single Cell Performance of LSGM Electrolyte..................................................7-20 Figure 7-13 Effect of Oxidant Composition on a High Performance Anode-Supported Cell........................................................................................7-21 Figure 7-14 Performance of PSOFC at Reduced Temperatures ............................................7-23 Figure 7-15 Projected Performance of Seal-less Planar Design with Current Seal-less
Cylindrical Design..............................................................................................7-24 Figure 7-16 Planar Seal-less Design ......................................................................................7-24 Figure 7-17 Effect of Pressure on AES Cell Performance at 1,000°C ..................................7-27 Figure 7-18 Two-Cell Stack Performance with 67% H2 + 22% CO + 11% H2O/Air ...........7-28 Figure 7-19 Two Cell Stack Performance with 97% H2 and 3% H2O/Air ............................7-29 Figure 7-20 Cell Performance at 1,000°C with Pure Oxygen (o) and Air (∆) Both at 25%
Utilization...........................................................................................................7-30 Figure 7-21 Influence of Gas Composition of the Theoretical Open-Circuit Potential of SOFC at 1,000°C ............................................................................7-31 Figure 7-22 Variation in Cell Voltage as a Function of Fuel Utilization and Temperature ..7-32 Figure 7-23 SOFC Performance at 1,000°C and 350 mA/cm2, 85% Fuel Utilization and
25% Air Utilization ............................................................................................7-33 Figure 7-24 Voltage-Current Characteristics of an AES Cell................................................7-34 Figure 8-1 A Rudimentary Fuel Cell Power System Schematic .............................................8-1 Figure 8-2 Representative Fuel Processing Steps & Temperatures.......................................8-3 Figure 8-3 “Well-To-Wheel” Efficiency For Various Vehicle Scenarios .............................8-9 Figure 8-4 Carbon Deposition Mapping of Methane...........................................................8-24 Figure 8-5 Carbon Deposition Mapping of Octane .............................................................8-24

viii
Figure 8-6 Block diagram of a fuel cell power system........................................................8-28 Figure 8-7 Block Diagram of a typical Fuel Cell Power Conditioning Stage .....................8-29 Figure 8-8a Typical fuel cell voltage / current characteristics...............................................8-29 Figure 8-8b Fuel cell, power vs. current curve ......................................................................8-30 Figure 8-9 Diode symbol and volt-ampere characteristics ..................................................8-31 Figure 8-10 Thyristor symbol and volt-ampere characteristics .............................................8-32 Figure 8-11a Power MOSFET symbol, (b) Normalized volt-ampere characteristics .............8-33 Figure 8-12 Silicon cross-section of an IGBT with its equivalent circuit and symbol..........8-34 Figure 8-13 Preferred application of IGBTs and MOSFETs.................................................8-34 Figure 8-14a A 4.5kV, 3kA IGCT and the gate drive unit. .....................................................8-36 Figure 8-14b A 30MW Medium voltage power management system and the 9MVA IGCT power electronic building block (51).......................................................8-36 Figure 8-15 Single switch boost converter schematic ...........................................................8-37 Figure 8-16 Boost converter states.........................................................................................8-38 Figure 8-17 Idealized boost converter waveforms.................................................................8-38 Figure 8-18 Voltage gain as a function of duty cycle. ...........................................................8-39 Figure 8-19 Closed loop control ............................................................................................8-40 Figure 8-20 Current waveform. .............................................................................................8-41 Figure 8-21a Push-pull DC-DC Converter ..............................................................................8-42 Figure 8-21b Push-pull DC-DC converter with voltage doubling center-tapped DC output ..8-43 Figure 8-22a Flyback current fed push-pull topology. Clamp diode D3 is connected to the output........................................................................................................8-44 Figure 8-22b Flyback current fed push-pull topology. Clamp diode D3 is connected to the input..........................................................................................................8-44 Figure 8-23a Full bridge DC to DC Converter ........................................................................8-45 Figure 8-23b A Buck current-fed full bridge DC to DC converter..........................................8-45 Figure 8-24a Inverter block diagram .......................................................................................8-46 Figure 8-24b Basic half bridge PWM inverter.........................................................................8-46 Figure 8-24 Single inverter basic operation...........................................................................8-47 Figure 8-25 Pulse width modulation......................................................................................8-48 Figure 8-26a Single Phase full bridge DC to AC Inverter.......................................................8-50 Figure 8-26b ............................................................................................................................8-50 Figure 8-26c ............................................................................................................................8-50 Figure 8-26d Full bridge inverter output voltage VAB and its frequency spectrum. ................8-51 Figure 8-27 Dual output voltage inverter with four switches ................................................8-52 Figure 8-28a Dual voltage inverter output voltage & current on phase VAn for linear load.....8-53 Figure 8-28b Dual voltage inverter output voltage & current on phase VAn for nonlinear load.....................................................................................................8-53 Figure 8-29a Six switch dual output voltage inverter topology...............................................8-54 Figure 8-29b Output voltage Van ..............................................................................................8-54 Figure 8-29c Filtered output voltage Van and Vbn ....................................................................8-54 Figure 8-30 Three phase PWM signal generation .................................................................8-56 Figure 8-31a Three phase inverter supplying a three phase R-L load. ....................................8-57 Figure 8-31b Three phase inverter waveforms ........................................................................8-57 Figure 8-31c Dc-link current Idc ..............................................................................................8-57 Figure 8-31d Frequency spectrum of Idc ..................................................................................8-57
ix
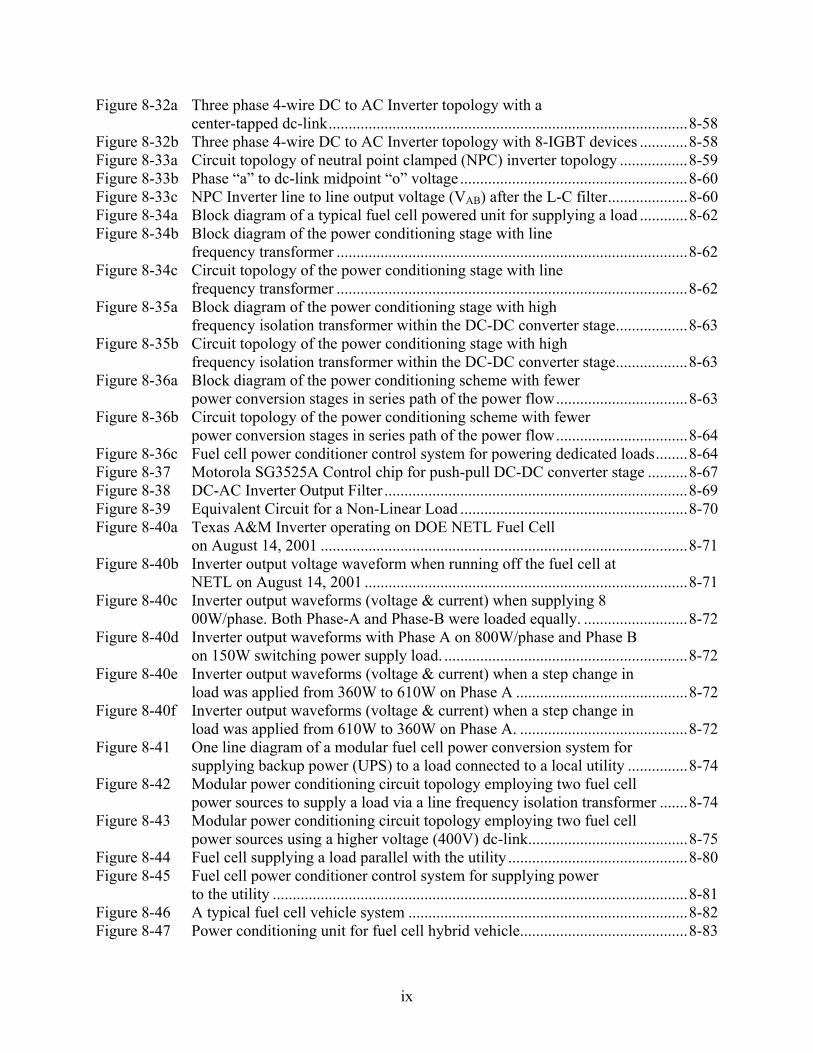
Figure 8-32a Three phase 4-wire DC to AC Inverter topology with a center-tapped dc-link..........................................................................................8-58 Figure 8-32b Three phase 4-wire DC to AC Inverter topology with 8-IGBT devices ............8-58 Figure 8-33a Circuit topology of neutral point clamped (NPC) inverter topology .................8-59 Figure 8-33b Phase “a” to dc-link midpoint “o” voltage .........................................................8-60 Figure 8-33c NPC Inverter line to line output voltage (VAB) after the L-C filter....................8-60 Figure 8-34a Block diagram of a typical fuel cell powered unit for supplying a load ............8-62 Figure 8-34b Block diagram of the power conditioning stage with line frequency transformer ........................................................................................8-62 Figure 8-34c Circuit topology of the power conditioning stage with line frequency transformer ........................................................................................8-62 Figure 8-35a Block diagram of the power conditioning stage with high frequency isolation transformer within the DC-DC converter stage..................8-63 Figure 8-35b Circuit topology of the power conditioning stage with high frequency isolation transformer within the DC-DC converter stage..................8-63 Figure 8-36a Block diagram of the power conditioning scheme with fewer power conversion stages in series path of the power flow.................................8-63 Figure 8-36b Circuit topology of the power conditioning scheme with fewer power conversion stages in series path of the power flow.................................8-64 Figure 8-36c Fuel cell power conditioner control system for powering dedicated loads........8-64 Figure 8-37 Motorola SG3525A Control chip for push-pull DC-DC converter stage ..........8-67 Figure 8-38 DC-AC Inverter Output Filter ............................................................................8-69 Figure 8-39 Equivalent Circuit for a Non-Linear Load .........................................................8-70 Figure 8-40a Texas A&M Inverter operating on DOE NETL Fuel Cell on August 14, 2001 ............................................................................................8-71 Figure 8-40b Inverter output voltage waveform when running off the fuel cell at NETL on August 14, 2001 .................................................................................8-71 Figure 8-40c Inverter output waveforms (voltage & current) when supplying 8 00W/phase. Both Phase-A and Phase-B were loaded equally. ..........................8-72 Figure 8-40d Inverter output waveforms with Phase A on 800W/phase and Phase B on 150W switching power supply load. .............................................................8-72 Figure 8-40e Inverter output waveforms (voltage & current) when a step change in load was applied from 360W to 610W on Phase A ...........................................8-72 Figure 8-40f Inverter output waveforms (voltage & current) when a step change in load was applied from 610W to 360W on Phase A. ..........................................8-72 Figure 8-41 One line diagram of a modular fuel cell power conversion system for supplying backup power (UPS) to a load connected to a local utility ...............8-74 Figure 8-42 Modular power conditioning circuit topology employing two fuel cell power sources to supply a load via a line frequency isolation transformer .......8-74 Figure 8-43 Modular power conditioning circuit topology employing two fuel cell power sources using a higher voltage (400V) dc-link........................................8-75 Figure 8-44 Fuel cell supplying a load parallel with the utility .............................................8-80 Figure 8-45 Fuel cell power conditioner control system for supplying power to the utility ........................................................................................................8-81 Figure 8-46 A typical fuel cell vehicle system ......................................................................8-82 Figure 8-47 Power conditioning unit for fuel cell hybrid vehicle..........................................8-83
x
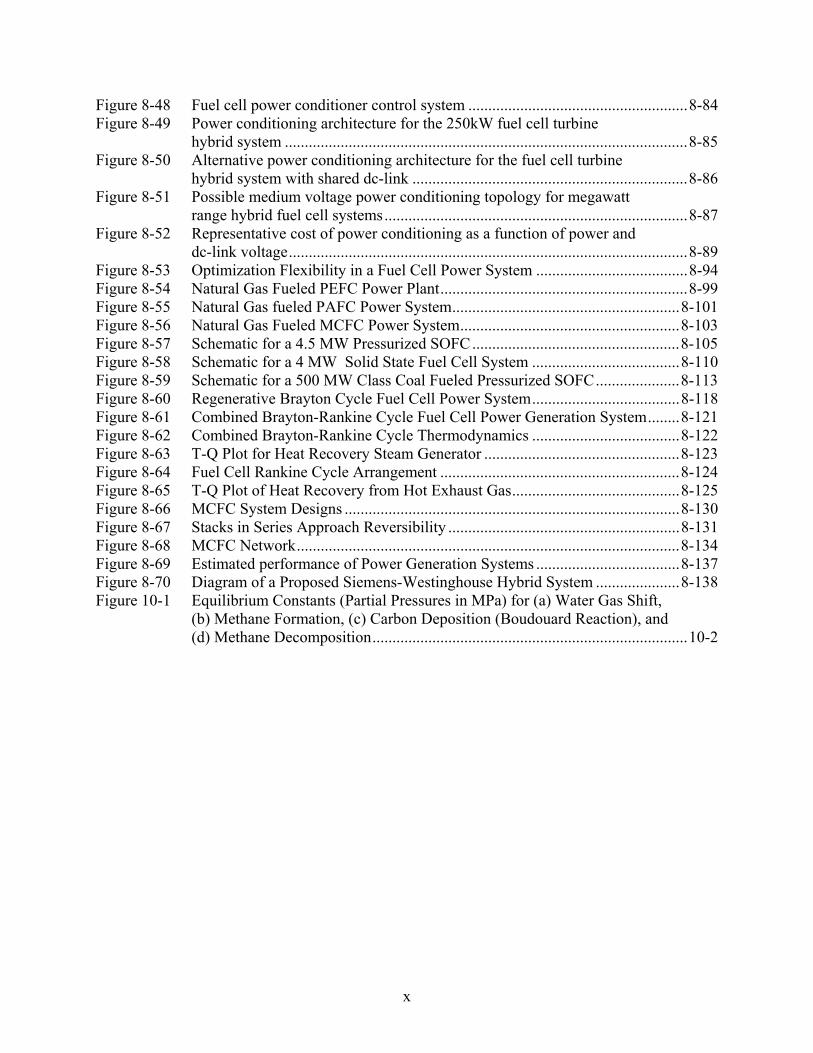
Figure 8-48 Fuel cell power conditioner control system .......................................................8-84 Figure 8-49 Power conditioning architecture for the 250kW fuel cell turbine hybrid system .....................................................................................................8-85 Figure 8-50 Alternative power conditioning architecture for the fuel cell turbine hybrid system with shared dc-link .....................................................................8-86 Figure 8-51 Possible medium voltage power conditioning topology for megawatt range hybrid fuel cell systems............................................................................8-87 Figure 8-52 Representative cost of power conditioning as a function of power and dc-link voltage....................................................................................................8-89 Figure 8-53 Optimization Flexibility in a Fuel Cell Power System ......................................8-94 Figure 8-54 Natural Gas Fueled PEFC Power Plant..............................................................8-99 Figure 8-55 Natural Gas fueled PAFC Power System.........................................................8-101 Figure 8-56 Natural Gas Fueled MCFC Power System.......................................................8-103 Figure 8-57 Schematic for a 4.5 MW Pressurized SOFC....................................................8-105 Figure 8-58 Schematic for a 4 MW Solid State Fuel Cell System .....................................8-110 Figure 8-59 Schematic for a 500 MW Class Coal Fueled Pressurized SOFC.....................8-113 Figure 8-60 Regenerative Brayton Cycle Fuel Cell Power System.....................................8-118 Figure 8-61 Combined Brayton-Rankine Cycle Fuel Cell Power Generation System........8-121 Figure 8-62 Combined Brayton-Rankine Cycle Thermodynamics .....................................8-122 Figure 8-63 T-Q Plot for Heat Recovery Steam Generator .................................................8-123 Figure 8-64 Fuel Cell Rankine Cycle Arrangement ............................................................8-124 Figure 8-65 T-Q Plot of Heat Recovery from Hot Exhaust Gas..........................................8-125 Figure 8-66 MCFC System Designs ....................................................................................8-130 Figure 8-67 Stacks in Series Approach Reversibility ..........................................................8-131 Figure 8-68 MCFC Network................................................................................................8-134 Figure 8-69 Estimated performance of Power Generation Systems ....................................8-137 Figure 8-70 Diagram of a Proposed Siemens-Westinghouse Hybrid System .....................8-138 Figure 10-1 Equilibrium Constants (Partial Pressures in MPa) for (a) Water Gas Shift,
(b) Methane Formation, (c) Carbon Deposition (Boudouard Reaction), and (d) Methane Decomposition...............................................................................10-2
xi
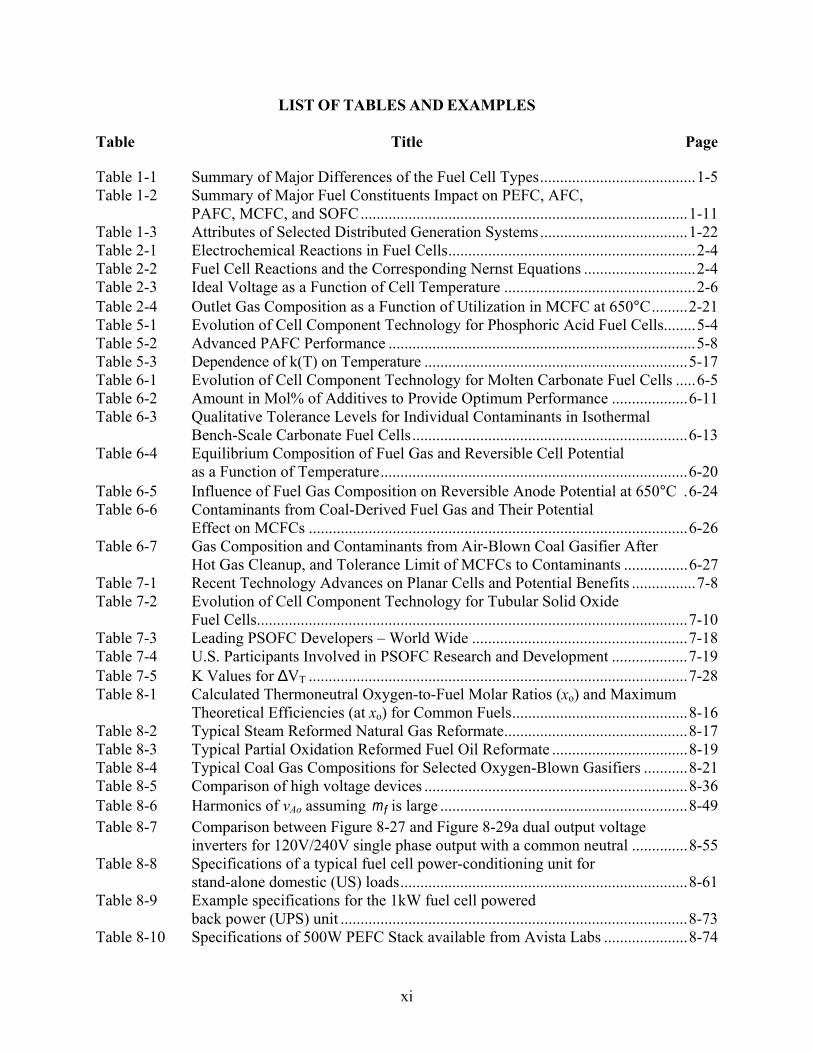
LIST OF TABLES AND EXAMPLES Table Title Page Table 1-1 Summary of Major Differences of the Fuel Cell Types.......................................1-5 Table 1-2 Summary of Major Fuel Constituents Impact on PEFC, AFC,
PAFC, MCFC, and SOFC..................................................................................1-11 Table 1-3 Attributes of Selected Distributed Generation Systems.....................................1-22 Table 2-1 Electrochemical Reactions in Fuel Cells..............................................................2-4 Table 2-2 Fuel Cell Reactions and the Corresponding Nernst Equations ............................2-4 Table 2-3 Ideal Voltage as a Function of Cell Temperature ................................................2-6 Table 2-4 Outlet Gas Composition as a Function of Utilization in MCFC at 650°C.........2-21 Table 5-1 Evolution of Cell Component Technology for Phosphoric Acid Fuel Cells........5-4 Table 5-2 Advanced PAFC Performance .............................................................................5-8 Table 5-3 Dependence of k(T) on Temperature ..................................................................5-17 Table 6-1 Evolution of Cell Component Technology for Molten Carbonate Fuel Cells .....6-5 Table 6-2 Amount in Mol% of Additives to Provide Optimum Performance ...................6-11 Table 6-3 Qualitative Tolerance Levels for Individual Contaminants in Isothermal
Bench-Scale Carbonate Fuel Cells.....................................................................6-13 Table 6-4 Equilibrium Composition of Fuel Gas and Reversible Cell Potential as a Function of Temperature.............................................................................6-20 Table 6-5 Influence of Fuel Gas Composition on Reversible Anode Potential at 650°C .6-24 Table 6-6 Contaminants from Coal-Derived Fuel Gas and Their Potential Effect on MCFCs ...............................................................................................6-26 Table 6-7 Gas Composition and Contaminants from Air-Blown Coal Gasifier After Hot Gas Cleanup, and Tolerance Limit of MCFCs to Contaminants ................6-27 Table 7-1 Recent Technology Advances on Planar Cells and Potential Benefits ................7-8 Table 7-2 Evolution of Cell Component Technology for Tubular Solid Oxide Fuel Cells............................................................................................................7-10 Table 7-3 Leading PSOFC Developers – World Wide ......................................................7-18 Table 7-4 U.S. Participants Involved in PSOFC Research and Development ...................7-19 Table 7-5 K Values for ∆VT ...............................................................................................7-28 Table 8-1 Calculated Thermoneutral Oxygen-to-Fuel Molar Ratios (xo) and Maximum
Theoretical Efficiencies (at xo) for Common Fuels............................................8-16 Table 8-2 Typical Steam Reformed Natural Gas Reformate..............................................8-17 Table 8-3 Typical Partial Oxidation Reformed Fuel Oil Reformate ..................................8-19 Table 8-4 Typical Coal Gas Compositions for Selected Oxygen-Blown Gasifiers ...........8-21 Table 8-5 Comparison of high voltage devices ..................................................................8-36 Table 8-6 Harmonics of vAo assuming fm is large ..............................................................8-49 Table 8-7 Comparison between Figure 8-27 and Figure 8-29a dual output voltage inverters for 120V/240V single phase output with a common neutral ..............8-55 Table 8-8 Specifications of a typical fuel cell power-conditioning unit for stand-alone domestic (US) loads........................................................................8-61 Table 8-9 Example specifications for the 1kW fuel cell powered back power (UPS) unit .......................................................................................8-73 Table 8-10 Specifications of 500W PEFC Stack available from Avista Labs .....................8-74

xii
Table 8-11 Stream Properties for the Natural Gas Fueled Pressurized PAFC ...................8-101 Table 8-12 Operating/Design Parameters for the NG fueled PAFC ..................................8-102 Table 8-13 Performance Summary for the NG fueled PAFC.............................................8-102 Table 8-14 Operating/Design Parameters for the NG Fueled IR-MCFC...........................8-104 Table 8-15 Overall Performance Summary for the NG Fueled IR-MCFC ........................8-104 Table 8-16 Stream Properties for the Natural Gas Fueled Pressurized SOFC ...................8-106 Table 8-17 Operating/Design Parameters for the NG Fueled Pressurized SOFC..............8-107 Table 8-18 Overall Performance Summary for the NG Fueled Pressurized SOFC ...........8-108 Table 8-19 Heron Gas Turbine Parameters ........................................................................8-108 Table 8-20 Example Fuel Utilization in a Multi-Stage Fuel Cell Module .........................8-109 Table 8-21 Stream Properties for the Natural Gas Fueled Solid State Fuel Cell Power Plant System..........................................................................................8-110 Table 8-22 Operating/Design Parameters for the NG fueled Multi-Stage Fuel Cell System ..............................................................................................8-112 Table 8-23 Overall Performance Summary for the NG fueled Multi-Stage Fuel Cell System ..............................................................................................8-112 Table 8-24 Stream Properties for the 500 MW Class Coal Gas Fueled Cascaded SOFC..8-114 Table 8-25 Coal Analysis ...................................................................................................8-115 Table 8-26 Operating/Design Parameters for the Coal Fueled Pressurized SOFC ............8-116 Table 8-27 Overall Performance Summary for the Coal Fueled Pressurized SOFC .........8-116 Table 8-28 Performance Calculations for a Pressurized, High Temperature Fuel Cell (SOFC) with a Regenerative Brayton Bottoming Cycle; Approach Delta T=30F ....................................................................................8-119 Table 8-29 Performance Computations for Various High Temperature Fuel Cell (SOFC) Heat Recovery Arrangements .....................................................8-120 Table 9-1 HHV Contribution of Common Gas Constituents .............................................9-24 Table 9-2 Distributive Estimating Factors..........................................................................9-27 Table10-1 Typical Contaminant Levels Obtained from Selected Coal Gasification Processes........................................................................................10-3 Table 10-2 Summary of Related Codes and Standards ......................................................10-17 Table 10-3 DoD Field Site..................................................................................................10-25 Table 10-4 IFC Field Units................................................................................................. 10-27 Table 10-5 FuelCell Energy Field Site ...............................................................................10-30 Table 10-6 Siemens Westinghouse SOFC Field Units.......................................................10-31 Table 10-7 Hydrogen Producers1........................................................................................10-34 Table 10-8 World Mine Production and Reserves .............................................................10-48 Table 10-9 Rhodia Rare Earth Oxide Prices in 2,000 ........................................................10-48
xiii
FORWARD
Fuel cells are an important technology for a potentially wide variety of applications including micropower, auxiliary power, transportation power, stationary power for buildings and other distributed generation applications, and central power. These applications will be in a large number of industries worldwide. In this Sixth Edition of the Fuel Cell Handbook, we have included over 5,000 fuel cell patent abstracts and their claims. In addition, the handbook features a new fuel cell power conditioning section, and overviews on the hydrogen industry and rare earth minerals market. Finally, an updated list of fuel cell URLs is included in the Appendix and an updated index assists the reader in locating specific information quickly. It is an important task that NETL undertakes to provide you with this handbook. We realize it is an important educational and informational tool for a wide audience. We welcome suggestions to improve the handbook. Mark C. Williams Strategic Center for Natural Gas National Energy Technology Laboratory

xiv
PREFACE
The last edition of the Fuel Cell Handbook was published in November, 2000. Since that time, polymer electrolyte fuel cells, molten carbonate fuel cells, and solid oxide fuel cells have been demonstrated at commercial size. The previously-demonstrated phosphoric acid fuel cells have entered the marketplace with over 250 fuel cells in 19 countries around the world. Highlighting this commercial entry, the phosphoric acid power plant fleet has demonstrated 95+% availability, and one plant has completed over 50,000 hours of operation. Fourteen additional plants have operated over 35,000 hours; several of those have passed 40,000 hours of operation. Early expectations of very low emissions and relatively high efficiencies have been met in power plants with each type of fuel cell. Fuel flexibility has been demonstrated using natural gas, propane, landfill gas, anaerobic digester gas, military logistic fuels, and coal gas, greatly expanding market opportunities. Transportation markets worldwide have shown remarkable interest in fuel cells; nearly every major vehicle manufacturer in the U.S., Europe, and the Far East is supporting development. Still in its infancy, fuel cell technology development offers further opportunities for significant performance and cost improvements. To achieve 100% successful commercial-scale demonstration, more aggressive pre-testing may be needed to ensure more robust cell technologies. Deficiencies in funding for research and development and for commercial demonstration place tremendous pressure on fuel cell developers. This Handbook provides a foundation in fuel cells for persons wanting a better understanding of the technology, its benefits, and the systems issues that influence its application. Trends in technology are discussed, including next-generation concepts that promise ultra-high efficiency and low cost, while providing exceptionally clean power plant systems. Section 1 summarizes fuel cell progress since the last edition, and includes existing power plant nameplate data. Section 2 addresses the thermodynamics of fuel cells to provide an understanding of fuel cell operation. Sections 3 through 7 describe the five major fuel cell types and their performance. Polymer electrolyte, alkaline, phosphoric acid, molten carbonate, and solid oxide fuel cell technology descriptions have been updated from the previous edition. Manufacturers are focusing on reducing fuel cell life cycle costs. In this edition, we have included over 5,000 fuel cell patent abstracts and their claims. In addition, the handbook features a new fuel cell power conditioning section, and overviews on the hydrogen industry and rare earth minerals market. An updated list of fuel cell URLs is included in the Appendix.

xv
ACKNOWLEDGEMENTS
The authors of this edition of the Fuel Cell Handbook acknowledge the cooperation of the fuel cell community for their contributions to this Handbook. Many colleagues provided data, information, references, valuable suggestions, and constructive comments that were incorporated into the Handbook. In particular, we would like to acknowledge the contributions of the following individuals: R. Kumar of Argonne National Laboratory, M. Farooque of FuelCell Energy, B. Ernst of Plug Power, , P. Enjeti of Texas A&M University, D. Archer of Carnegie Mellon University, J. Hirschenhofer, M. Cifrain and UTC Fuel Cells. C. Hitchings, SAIC, provided technical editing and final layout of the Handbook. The authors wish to thank M. Williams, R. Dennis, and N. Holcombe of the U.S. Department of Energy, National Energy Technology Laboratory, for their support and encouragement, and for providing the opportunity to enhance the quality of this Handbook. This work was supported by the U.S. Department of Energy, National Energy Technology Laboratory, under Contract DE-AM21-94MC31166.
1-1
1. TECHNOLOGY OVERVIEW
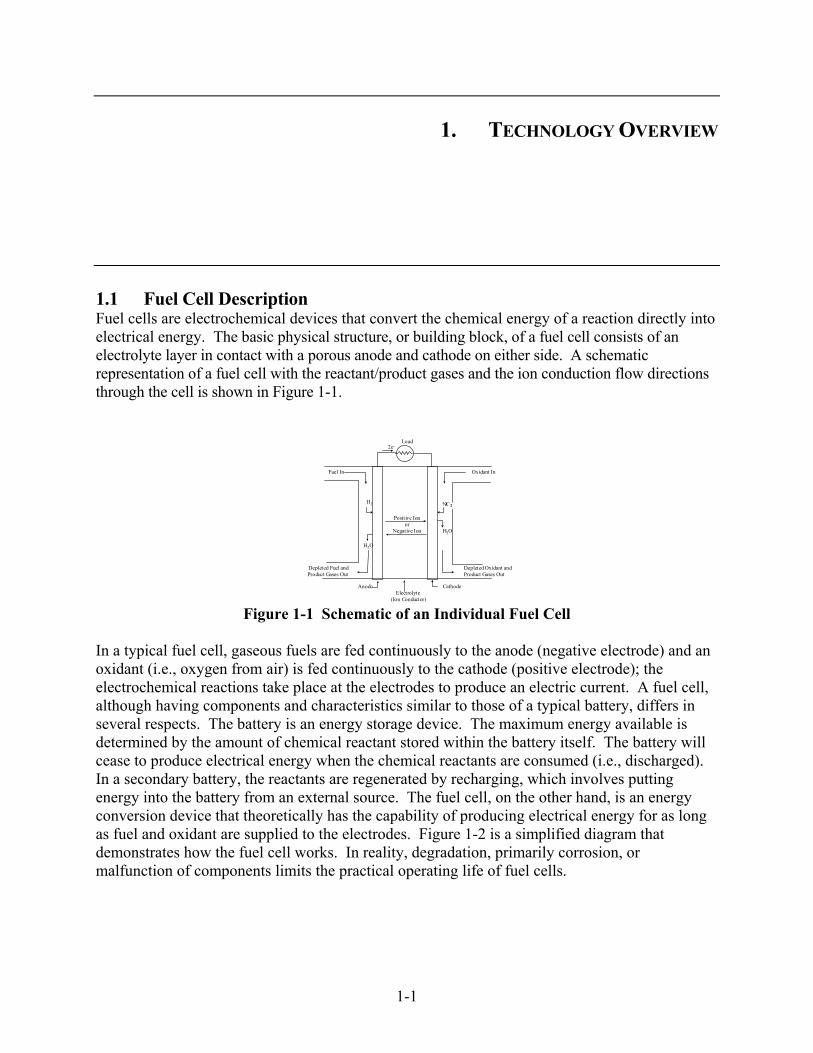
1.1 Fuel Cell Description Fuel cells are electrochemical devices that convert the chemical energy of a reaction directly into electrical energy. The basic physical structure, or building block, of a fuel cell consists of an electrolyte layer in contact with a porous anode and cathode on either side. A schematic representation of a fuel cell with the reactant/product gases and the ion conduction flow directions through the cell is shown in Figure 1-1.
Load2e -
Fuel In Oxidant In
Positive Ion or
Negative Ion
Depleted Oxidant and Product Gases Out
Depleted Fuel and Product Gases Out
Anode Cathode Electrolyte
(Ion Conductor)
H 2
H 2 O
H 2 O
½O 2
Figure 1-1 Schematic of an Individual Fuel Cell
In a typical fuel cell, gaseous fuels are fed continuously to the anode (negative electrode) and an oxidant (i.e., oxygen from air) is fed continuously to the cathode (positive electrode); the electrochemical reactions take place at the electrodes to produce an electric current. A fuel cell, although having components and characteristics similar to those of a typical battery, differs in several respects. The battery is an energy storage device. The maximum energy available is determined by the amount of chemical reactant stored within the battery itself. The battery will cease to produce electrical energy when the chemical reactants are consumed (i.e., discharged). In a secondary battery, the reactants are regenerated by recharging, which involves putting energy into the battery from an external source. The fuel cell, on the other hand, is an energy conversion device that theoretically has the capability of producing electrical energy for as long as fuel and oxidant are supplied to the electrodes. Figure 1-2 is a simplified diagram that demonstrates how the fuel cell works. In reality, degradation, primarily corrosion, or malfunction of components limits the practical operating life of fuel cells.

1-2
Figure 1-2 Simplified Fuel Cell Schematic Note that an ion specie and its transport direction can differ, influencing the site of water production and removal. The ion can be either a positive or a negative ion, meaning that the ion carries either a positive or negative charge (surplus or deficit of electrons). The fuel or oxidant gases flow past the surface of the anode or cathode opposite the electrolyte and generate electrical energy by the electrochemical oxidation of fuel, usually hydrogen, and the electrochemical reduction of the oxidant, usually oxygen. Appleby and Foulkes (1) have noted that, in theory, any substance capable of chemical oxidation that can be supplied continuously (as a fluid) can be burned galvanically as fuel at the anode of a fuel cell. Similarly, the oxidant can be any fluid that can be reduced at a sufficient rate. Gaseous hydrogen has become the fuel of choice for most applications, because of its high reactivity when suitable catalysts are used, its ability to be produced from hydrocarbons for terrestrial applications, and its high energy density when stored cryogenically for closed environment applications, such as in space. Similarly, the most common oxidant is gaseous oxygen, which is readily and economically available from air for terrestrial applications, and again easily stored in a closed environment. A three-phase interface is established among the reactants, electrolyte, and catalyst in the region of the porous electrode. The nature of this interface plays a critical role in the electrochemical performance of a fuel cell, particularly in those fuel cells with liquid electrolytes. In such fuel cells, the reactant gases diffuse through a thin electrolyte film that wets portions of the porous electrode and react electrochemically on their respective electrode surface. If the porous electrode contains an excessive amount of electrolyte, the electrode may "flood" and restrict the transport of gaseous species in the electrolyte phase to the reaction sites. The consequence is a reduction in the electrochemical performance of the porous electrode. Thus, a delicate balance must be maintained among the electrode, electrolyte, and gaseous phases in the porous electrode structure. Much of the recent effort in development of fuel cell technology has been devoted to reducing the thickness of cell components while refining and improving the electrode structure and the electrolyte phase, with the aim of obtaining a higher and more stable electrochemical performance while lowering cost.
1-3
The electrolyte not only transports dissolved reactants to the electrode, but also conducts ionic charge between the electrodes and thereby completes the cell electric circuit, as illustrated in Figure 1-1. It also provides a physical barrier to prevent the fuel and oxidant gas streams from directly mixing. The functions of porous electrodes in fuel cells are: 1) to provide a surface site where gas/liquid ionization or de-ionization reactions can take place, 2) to conduct ions away from or into the three-phase interface once they are formed (so an electrode must be made of materials that have good electrical conductance), and 3) to provide a physical barrier that separates the bulk gas phase and the electrolyte. A corollary of Item 1 is that, in order to increase the rates of reactions, the electrode material should be catalytic as well as conductive, porous rather than solid. The catalytic function of electrodes is more important in lower temperature fuel cells and less so in high-temperature fuel cells because ionization reaction rates increase with temperature. It is also a corollary that the porous electrodes must be permeable to both electrolyte and gases, but not such that the media can be easily "flooded" by the electrolyte or "dried" by the gases in a one-sided manner. A variety of fuel cells are in different stages of development. They can be classified by use of diverse categories, depending on the combination of type of fuel and oxidant, whether the fuel is processed outside (external reforming) or inside (internal reforming) the fuel cell, the type of electrolyte, the temperature of operation, whether the reactants are fed to the cell by internal or external manifolds, etc. The most common classification of fuel cells is by the type of electrolyte used in the cells and includes 1) polymer electrolyte fuel cell (PEFC), 2) alkaline fuel cell (AFC), 3) phosphoric acid fuel cell (PAFC), 4) molten carbonate fuel cell (MCFC), and 5) solid oxide fuel cell (SOFC). These fuel cells are listed in the order of approximate operating temperature, ranging from ~80°C for PEFC, ~100°C for AFC, ~200°C for PAFC, ~650°C for MCFC, ~600-1000°C for SOFC. The operating temperature and useful life of a fuel cell dictate the physicochemical and thermomechanical properties of materials used in the cell components (i.e., electrodes, electrolyte, interconnect, current collector, etc.). Aqueous electrolytes are limited to temperatures of about 200°C or lower because of their high water vapor pressure and rapid degradation at higher temperatures. The operating temperature also plays an important role in dictating the type of fuel that can be used in a fuel cell. The low-temperature fuel cells with aqueous electrolytes are, in most practical applications, restricted to hydrogen as a fuel. In high-temperature fuel cells, CO and even CH4 can be used because of the inherently rapid electrode kinetics and the lesser need for high catalytic activity at high temperature. A brief description of various electrolyte cells of interest follows. A detailed description of these fuel cells may be found in Sections 3 through 7. Polymer Electrolyte Fuel Cell (PEFC): The electrolyte in this fuel cell is an ion exchange membrane (fluorinated sulfonic acid polymer or other similar polymer) that is an excellent proton conductor. The only liquid in this fuel cell is water; thus, corrosion problems are minimal. Water management in the membrane is critical for efficient performance; the fuel cell must operate under conditions where the byproduct water does not evaporate faster than it is produced because the membrane must be hydrated. Because of the limitation on the operating temperature imposed by the polymer, usually less than 120°C, and because of problems with
1-4
water balance, a H2-rich fuel is used. Higher catalyst loading (Pt in most cases) than that used in PAFCs is required for both the anode and cathode. Because CO “poisons” the catalyst, the fuel may contain no CO. Alkaline Fuel Cell (AFC): The electrolyte in this fuel cell is concentrated (85 wt%) KOH in fuel cells operated at high temperature (~250°C), or less concentrated (35-50 wt%) KOH for lower temperature (<120°C) operation. The electrolyte is retained in a matrix (usually asbestos), and a wide range of electrocatalysts can be used (e.g., Ni, Ag, metal oxides, spinels, and noble metals). The fuel supply is limited to non-reactive constituents except for hydrogen. CO is a poison, and CO2 will react with the KOH to form K2CO3, thus altering the electrolyte. Even the small amount of CO2 in air is detrimental to the alkaline cell. Phosphoric Acid Fuel Cell (PAFC): Phosphoric acid concentrated to 100% is used for the electrolyte in this fuel cell, which operates at 150 to 220°C. At lower temperatures, phosphoric acid is a poor ionic conductor, and CO poisoning of the Pt electrocatalyst in the anode becomes severe. The relative stability of concentrated phosphoric acid is high compared to other common acids; consequently the PAFC is capable of operating at the high end of the acid temperature range (100 to 220°C). In addition, the use of concentrated acid (100%) minimizes the water vapor pressure so water management in the cell is not difficult. The matrix universally used to retain the acid is silicon carbide (1), and the electrocatalyst in both the anode and cathode is Pt. Molten Carbonate Fuel Cell (MCFC): The electrolyte in this fuel cell is usually a combination of alkali carbonates, which is retained in a ceramic matrix of LiAlO2. The fuel cell operates at 600 to 700°C where the alkali carbonates form a highly conductive molten salt, with carbonate ions providing ionic conduction. At the high operating temperatures in MCFCs, Ni (anode) and nickel oxide (cathode) are adequate to promote reaction. Noble metals are not required. Solid Oxide Fuel Cell (SOFC): The electrolyte in this fuel cell is a solid, nonporous metal oxide, usually Y2O3-stabilized ZrO2. The cell operates at 600-1000°C where ionic conduction by oxygen ions takes place. Typically, the anode is Co-ZrO2 or Ni-ZrO2 cermet, and the cathode is Sr-doped LaMnO3. In low-temperature fuel cells (PEFC, AFC, PAFC), protons or hydroxyl ions are the major charge carriers in the electrolyte, whereas in the high-temperature fuel cells (MCFC and SOFC) carbonate ions and oxygen ions are the charge carriers, respectively. Detailed discussions of these different types of fuel cells are presented in Sections 3 through 7. Major differences between the various cells are shown in Table 1-1.

1-5
Table 1-1 Summary of Major Differences of the Fuel Cell Types
PEFC AFC PAFC MCFC SOFC Electrolyte
Ion Exchange Membranes
Mobilized or Immobilized Potassium Hydroxide
Immobilized Liquid
Phosphoric Acid
Immobilized Liquid Molten
Carbonate
Ceramic
Operating Temperature 80°C 65°C - 220°C 205°C 650° 600-1000°C
Charge Carrier H+ OH- H+ CO3= O=
External Reformer for CH4 (below)
Yes Yes Yes No No
Prime Cell Components Carbon-based Carbon-based Graphite-based Stainless-
based Ceramic
Catalyst Platinum Platinum Platinum Nickel Perovskites
Product Water Management
Evaporative Evaporative Evaporative Gaseous Product
Gaseous Product
Product Heat Management
Process Gas + Independent
Cooling Medium
Process Gas + Electrolyte Circulation
Process Gas + Independent
Cooling Medium
Internal Reforming + Process Gas
Internal Reforming + Process Gas
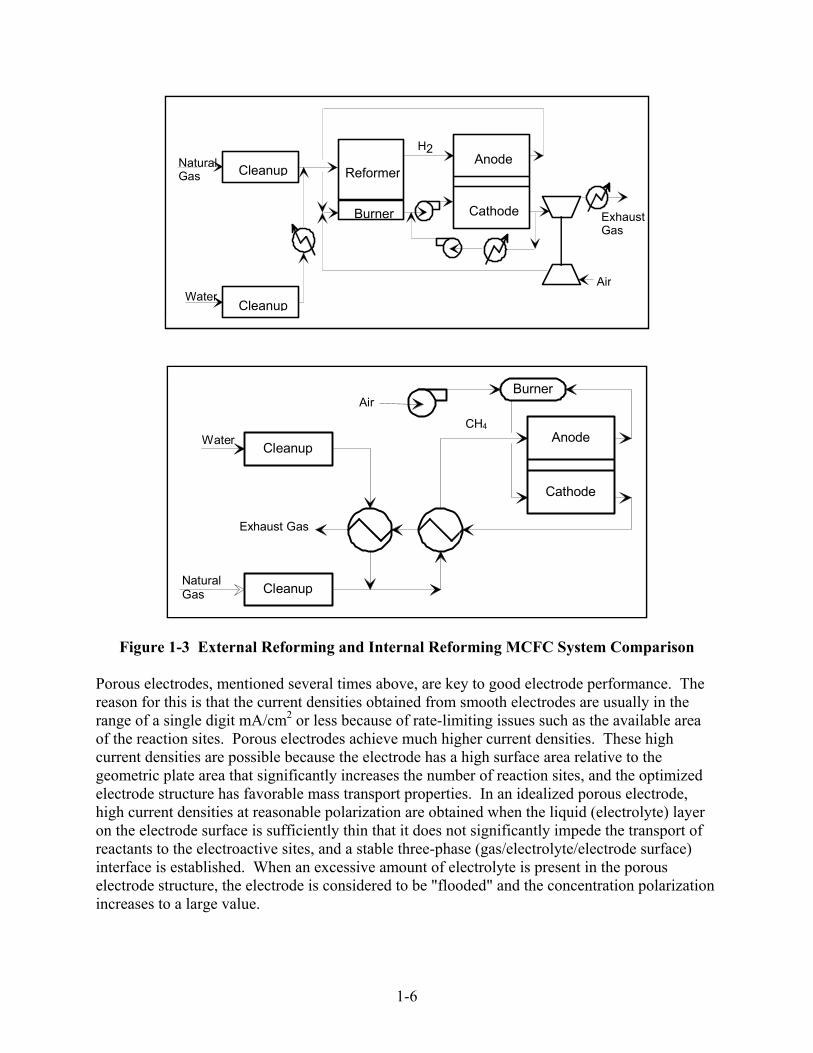
Even though the electrolyte has become the predominant means of characterizing a cell, another important distinction is the method used to produce hydrogen for the cell reaction. Hydrogen can be reformed from natural gas and steam in the presence of a catalyst starting at a temperature of ~760°C. The reaction is endothermic. MCFC, and SOFC operating temperatures are high enough that reforming reactions can occur within the cell, a process referred to as internal reforming. Figure 1-3 compares internal reforming and external reforming MCFCs. The reforming reaction is driven by the decrease in hydrogen as the cell produces power. This internal reforming can be beneficial to system efficiency because there is an effective transfer of heat from the exothermic cell reaction to satisfy the endothermic reforming reaction. A reforming catalyst is needed adjacent to the anode gas chamber for the reaction to occur. The cost of an external reformer is eliminated and system efficiency is improved, but at the expense of a more complex cell configuration and increased maintenance issues. This provides developers of high-temperature cells a choice of an external reforming or internal reforming approach. Section 6 will show that the present internal reforming MCFC is limited to ambient pressure operation, whereas external reforming MCFC can operate at pressures up to 3 atmospheres. The slow rate of the reforming reaction makes internal reforming impractical in the lower temperature cells. Instead, a separate external reformer is used.
1-6
Cleanup
CleanupAnode
Cathode
Water
Reformer
Burner ExhaustGas
Air
NaturalGas
H2
Cleanup
Cleanup
Anode
Cathode
Burner
Water
NaturalGas
Exhaust Gas
Air
CH4
Figure 1-3 External Reforming and Internal Reforming MCFC System Comparison Porous electrodes, mentioned several times above, are key to good electrode performance. The reason for this is that the current densities obtained from smooth electrodes are usually in the range of a single digit mA/cm2 or less because of rate-limiting issues such as the available area of the reaction sites. Porous electrodes achieve much higher current densities. These high current densities are possible because the electrode has a high surface area relative to the geometric plate area that significantly increases the number of reaction sites, and the optimized electrode structure has favorable mass transport properties. In an idealized porous electrode, high current densities at reasonable polarization are obtained when the liquid (electrolyte) layer on the electrode surface is sufficiently thin that it does not significantly impede the transport of reactants to the electroactive sites, and a stable three-phase (gas/electrolyte/electrode surface) interface is established. When an excessive amount of electrolyte is present in the porous electrode structure, the electrode is considered to be "flooded" and the concentration polarization increases to a large value.
1-7
The porous electrodes used in low-temperature fuel cells consist of a composite structure that contains platinum (Pt) electrocatalyst on a high surface area carbon black and a PTFE (polytetrafluoroethylene) binder. Such electrodes for acid and alkaline fuel cells are described by Kordesch, et al. (3). In these porous electrodes, PTFE is hydrophobic (acts as a wet proofing agent) and serves as the gas permeable phase, and carbon black is an electron conductor that provides a high surface area to support the electrocatalyst. Platinum serves as the electrocatalyst, which promotes the rate of electrochemical reactions (oxidation/reduction) for a given surface area. The carbon black is also somewhat hydrophobic, depending on the surface properties of the material. The composite structure of PTFE and carbon establishes an extensive three-phase interface in the porous electrode, which is the benchmark of PTFE bonded electrodes. Some interesting results have been reported by Japanese workers on higher performance gas diffusion electrodes for phosphoric acid fuel cells (see Section 5.1.2). In MCFCs, which operate at relatively high temperature, no materials are known that wet-proof a porous structure against ingress by molten carbonates. Consequently, the technology used to obtain a stable three-phase interface in MCFC porous electrodes is different from that used in PAFCs. In the MCFC, the stable interface is achieved in the electrodes by carefully tailoring the pore structures of the electrodes and the electrolyte matrix (LiA1O2) so that capillary forces establish a dynamic equilibrium in the different porous structures. Pigeaud, et al. (4) provide a discussion of porous electrodes for MCFCs. In a SOFC, there is no liquid electrolyte present that is susceptible to movement in the porous electrode structure, and electrode flooding is not a problem. Consequently, the three-phase interface that is necessary for efficient electrochemical reaction involves two solid phases (solid electrolyte/electrode) and a gas phase. A critical requirement of porous electrodes for SOFC is that they are sufficiently thin and porous to provide an extensive electrode/electrolyte interfacial region for electrochemical reaction. 1.2 Cell Stacking Additional components of a cell are best described by using a typical cell schematic, Figure 1-4. This figure depicts a PAFC. As with batteries, individual fuel cells must be combined to produce appreciable voltage levels and so are joined by interconnects. Because of the configuration of a flat plate cell, Figure 1-4, the interconnect becomes a separator plate with two functions: 1) to provide an electrical series connection between adjacent cells, specifically for flat plate cells, and 2) to provide a gas barrier that separates the fuel and oxidant of adjacent cells. The interconnect of a solid oxide fuel cell is a special case, and the reader is referred to Section 7 for its slightly altered function. All interconnects must be an electrical conductor and impermeable to gases. Other important parts of the cell are 1) the structure for distributing the reactant gases across the electrode surface and which serves as mechanical support, shown as ribs in Figure 1-4, 2) electrolyte reservoirs for liquid electrolyte cells to replenish electrolyte lost over life, and 3) current collectors (not shown) that provide a path for the current between the electrodes and the separator of flat plate cells. Other arrangements of gas flow and current flow are used in fuel cell stack designs, and are mentioned in Sections 3 through 7 for the various type cells.

1-8
Figure 1-4 Expanded View of a Basic Fuel Cell Repeated Unit in a Fuel Cell Stack (1) 1.3 Fuel Cell Plant Description As shown in Figure 1-1, the fuel cell combines hydrogen produced from the fuel and oxygen from the air to produce dc power, water, and heat. In cases where CO and CH4 react in the cell to produce hydrogen, CO2 is also a product. These reactions must be carried out at a suitable temperature and pressure for fuel cell operation. A system must be built around the fuel cell to supply air and clean fuel, convert the power to a more usable form such as grid quality ac power, and remove the depleted reactants and heat that are produced by the reactions in the cells. Figure 1-5 shows a simple rendition of a fuel cell power plant. Beginning with fuel processing, a conventional fuel (natural gas, other gaseous hydrocarbons, methanol, naphtha, or coal) is cleaned, then converted into a gas containing hydrogen. Energy conversion occurs when dc electricity is generated by means of individual cells combined in stacks or bundles. A varying number of cells or stacks can be matched to a particular power application. Finally, power conditioning converts the electric power from dc into regulated dc or ac for consumer use. Section 8.1 describes the processes of a fuel cell power plant system.
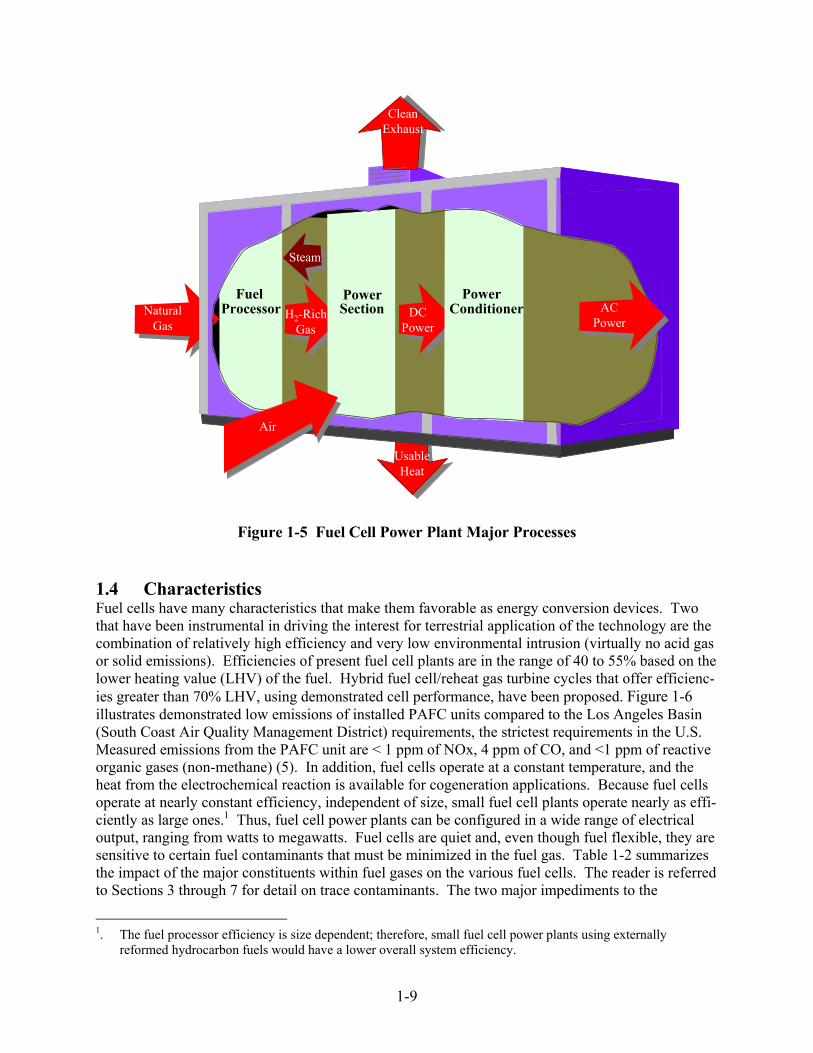
1-9
CleanExhaust
FuelProcessor
PowerSection
PowerConditioner
Air
ACPower
H2-RichGas
DCPower
UsableHeat
NaturalGas
Steam
CleanExhaust
Figure 1-5 Fuel Cell Power Plant Major Processes
1.4 Characteristics Fuel cells have many characteristics that make them favorable as energy conversion devices. Two that have been instrumental in driving the interest for terrestrial application of the technology are the combination of relatively high efficiency and very low environmental intrusion (virtually no acid gas or solid emissions). Efficiencies of present fuel cell plants are in the range of 40 to 55% based on the lower heating value (LHV) of the fuel. Hybrid fuel cell/reheat gas turbine cycles that offer efficienc-ies greater than 70% LHV, using demonstrated cell performance, have been proposed. Figure 1-6 illustrates demonstrated low emissions of installed PAFC units compared to the Los Angeles Basin (South Coast Air Quality Management District) requirements, the strictest requirements in the U.S. Measured emissions from the PAFC unit are < 1 ppm of NOx, 4 ppm of CO, and <1 ppm of reactive organic gases (non-methane) (5). In addition, fuel cells operate at a constant temperature, and the heat from the electrochemical reaction is available for cogeneration applications. Because fuel cells operate at nearly constant efficiency, independent of size, small fuel cell plants operate nearly as effi-ciently as large ones.1 Thus, fuel cell power plants can be configured in a wide range of electrical output, ranging from watts to megawatts. Fuel cells are quiet and, even though fuel flexible, they are sensitive to certain fuel contaminants that must be minimized in the fuel gas. Table 1-2 summarizes the impact of the major constituents within fuel gases on the various fuel cells. The reader is referred to Sections 3 through 7 for detail on trace contaminants. The two major impediments to the
1. The fuel processor efficiency is size dependent; therefore, small fuel cell power plants using externally
reformed hydrocarbon fuels would have a lower overall system efficiency.
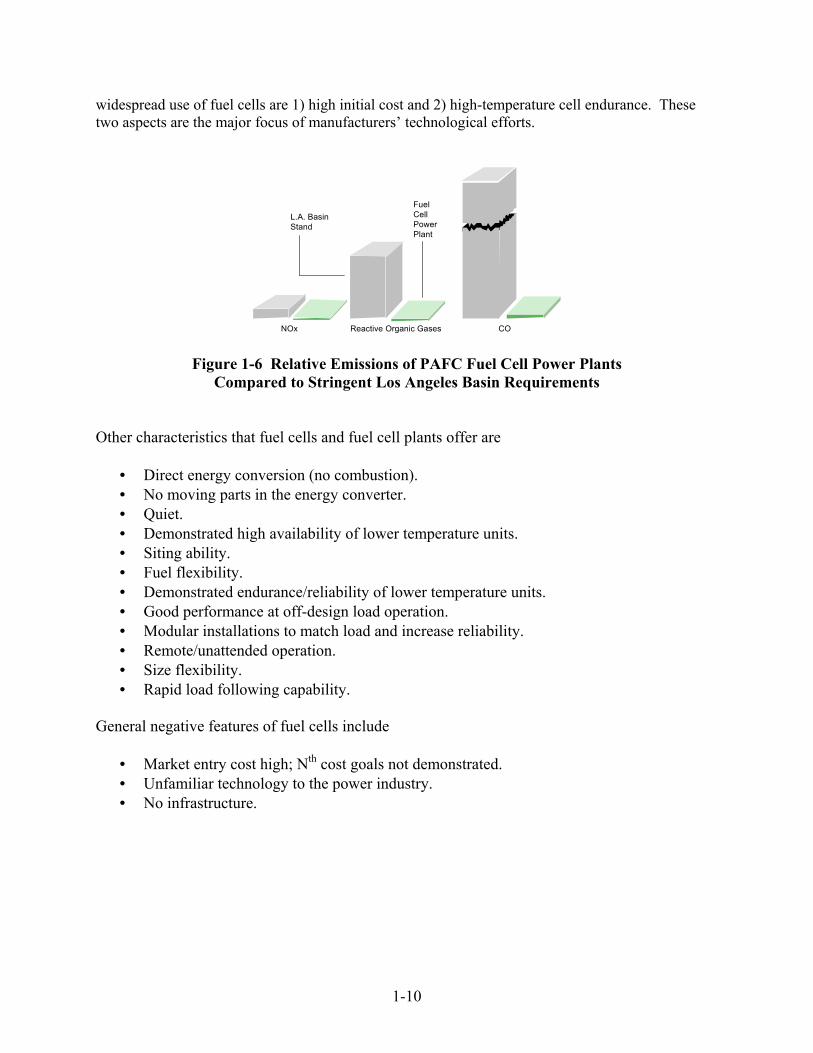
1-10
widespread use of fuel cells are 1) high initial cost and 2) high-temperature cell endurance. These two aspects are the major focus of manufacturers’ technological efforts.
NOx CO
L.A. BasinStand
FuelCellPowerPlant
Reactive Organic Gases
Figure 1-6 Relative Emissions of PAFC Fuel Cell Power Plants Compared to Stringent Los Angeles Basin Requirements
Other characteristics that fuel cells and fuel cell plants offer are
• Direct energy conversion (no combustion). • No moving parts in the energy converter. • Quiet. • Demonstrated high availability of lower temperature units. • Siting ability. • Fuel flexibility. • Demonstrated endurance/reliability of lower temperature units. • Good performance at off-design load operation. • Modular installations to match load and increase reliability. • Remote/unattended operation. • Size flexibility. • Rapid load following capability.
General negative features of fuel cells include
• Market entry cost high; Nth cost goals not demonstrated. • Unfamiliar technology to the power industry. • No infrastructure.
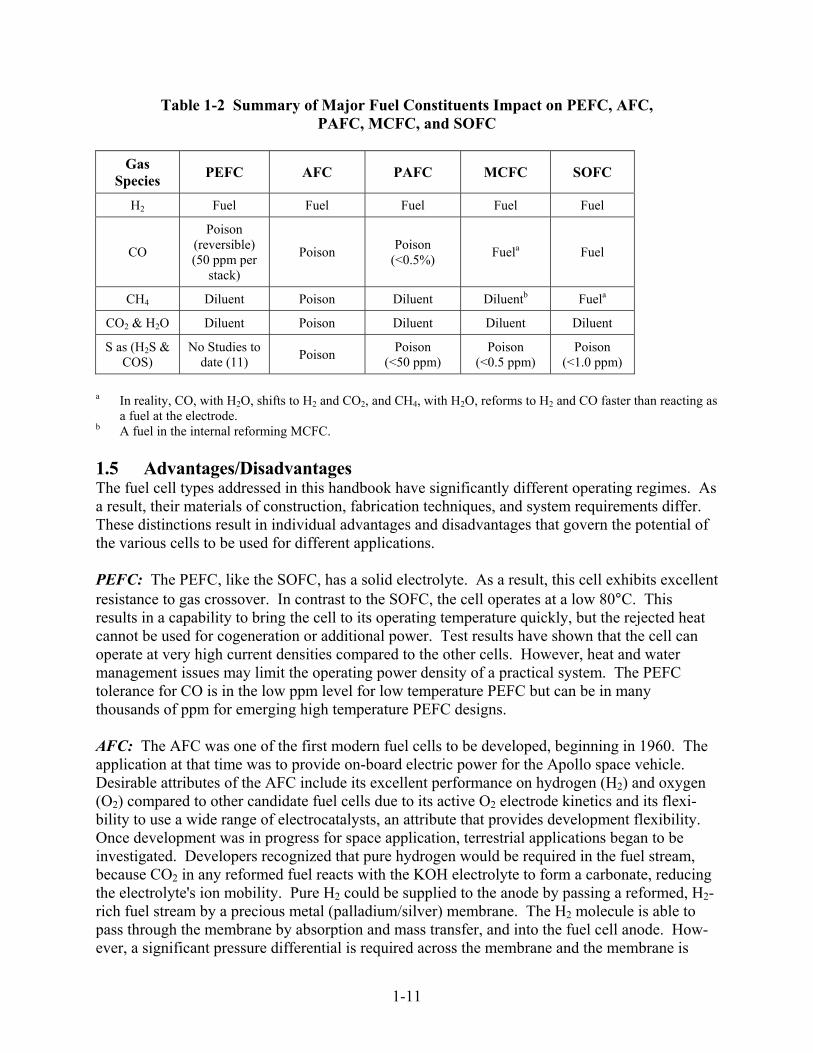
1-11
Table 1-2 Summary of Major Fuel Constituents Impact on PEFC, AFC, PAFC, MCFC, and SOFC
Gas
Species PEFC AFC PAFC MCFC SOFC
H2 Fuel Fuel Fuel Fuel Fuel
CO
Poison (reversible) (50 ppm per
stack)
Poison Poison (<0.5%) Fuela Fuel
CH4 Diluent Poison Diluent Diluentb Fuela
CO2 & H2O Diluent Poison Diluent Diluent Diluent
S as (H2S & COS)
No Studies to date (11) Poison Poison
(<50 ppm) Poison
(<0.5 ppm) Poison
(<1.0 ppm)
a In reality, CO, with H2O, shifts to H2 and CO2, and CH4, with H2O, reforms to H2 and CO faster than reacting as
a fuel at the electrode. b A fuel in the internal reforming MCFC. 1.5 Advantages/Disadvantages The fuel cell types addressed in this handbook have significantly different operating regimes. As a result, their materials of construction, fabrication techniques, and system requirements differ. These distinctions result in individual advantages and disadvantages that govern the potential of the various cells to be used for different applications.
PEFC: The PEFC, like the SOFC, has a solid electrolyte. As a result, this cell exhibits excellent resistance to gas crossover. In contrast to the SOFC, the cell operates at a low 80°C. This results in a capability to bring the cell to its operating temperature quickly, but the rejected heat cannot be used for cogeneration or additional power. Test results have shown that the cell can operate at very high current densities compared to the other cells. However, heat and water management issues may limit the operating power density of a practical system. The PEFC tolerance for CO is in the low ppm level for low temperature PEFC but can be in many thousands of ppm for emerging high temperature PEFC designs. AFC: The AFC was one of the first modern fuel cells to be developed, beginning in 1960. The application at that time was to provide on-board electric power for the Apollo space vehicle. Desirable attributes of the AFC include its excellent performance on hydrogen (H2) and oxygen (O2) compared to other candidate fuel cells due to its active O2 electrode kinetics and its flexi-bility to use a wide range of electrocatalysts, an attribute that provides development flexibility. Once development was in progress for space application, terrestrial applications began to be investigated. Developers recognized that pure hydrogen would be required in the fuel stream, because CO2 in any reformed fuel reacts with the KOH electrolyte to form a carbonate, reducing the electrolyte's ion mobility. Pure H2 could be supplied to the anode by passing a reformed, H2-rich fuel stream by a precious metal (palladium/silver) membrane. The H2 molecule is able to pass through the membrane by absorption and mass transfer, and into the fuel cell anode. How-ever, a significant pressure differential is required across the membrane and the membrane is
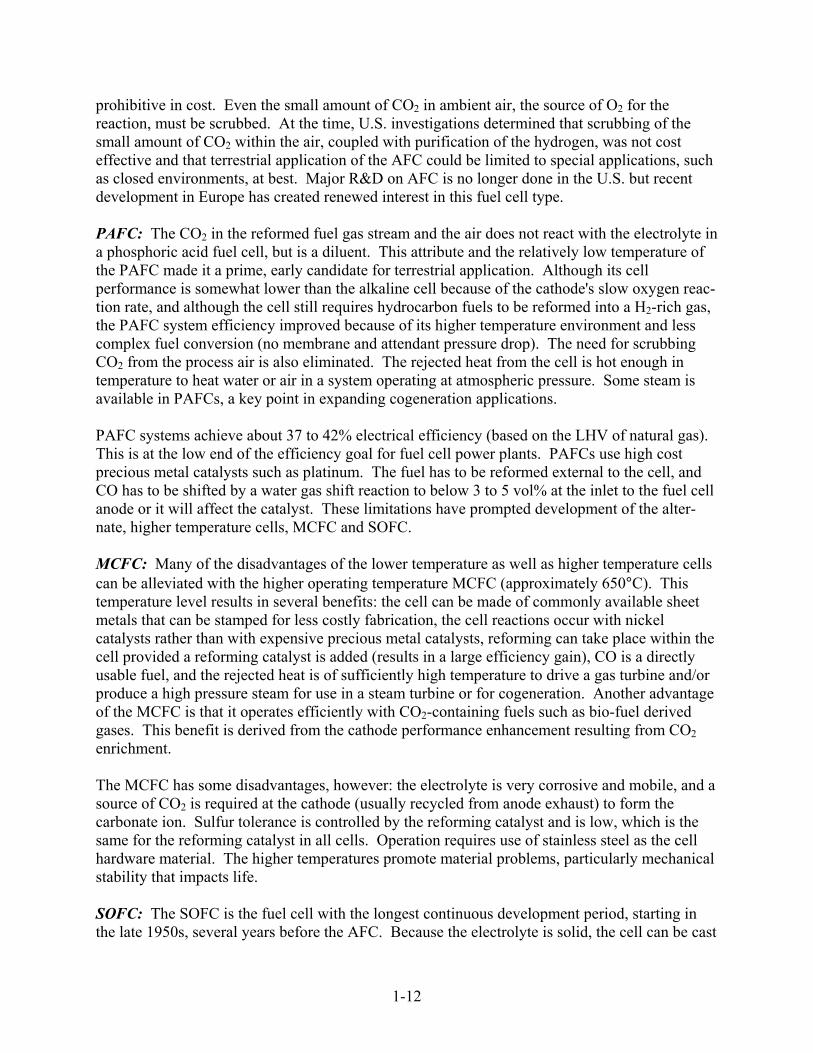
1-12
prohibitive in cost. Even the small amount of CO2 in ambient air, the source of O2 for the reaction, must be scrubbed. At the time, U.S. investigations determined that scrubbing of the small amount of CO2 within the air, coupled with purification of the hydrogen, was not cost effective and that terrestrial application of the AFC could be limited to special applications, such as closed environments, at best. Major R&D on AFC is no longer done in the U.S. but recent development in Europe has created renewed interest in this fuel cell type. PAFC: The CO2 in the reformed fuel gas stream and the air does not react with the electrolyte in a phosphoric acid fuel cell, but is a diluent. This attribute and the relatively low temperature of the PAFC made it a prime, early candidate for terrestrial application. Although its cell performance is somewhat lower than the alkaline cell because of the cathode's slow oxygen reac-tion rate, and although the cell still requires hydrocarbon fuels to be reformed into a H2-rich gas, the PAFC system efficiency improved because of its higher temperature environment and less complex fuel conversion (no membrane and attendant pressure drop). The need for scrubbing CO2 from the process air is also eliminated. The rejected heat from the cell is hot enough in temperature to heat water or air in a system operating at atmospheric pressure. Some steam is available in PAFCs, a key point in expanding cogeneration applications. PAFC systems achieve about 37 to 42% electrical efficiency (based on the LHV of natural gas). This is at the low end of the efficiency goal for fuel cell power plants. PAFCs use high cost precious metal catalysts such as platinum. The fuel has to be reformed external to the cell, and CO has to be shifted by a water gas shift reaction to below 3 to 5 vol% at the inlet to the fuel cell anode or it will affect the catalyst. These limitations have prompted development of the alter-nate, higher temperature cells, MCFC and SOFC. MCFC: Many of the disadvantages of the lower temperature as well as higher temperature cells can be alleviated with the higher operating temperature MCFC (approximately 650°C). This temperature level results in several benefits: the cell can be made of commonly available sheet metals that can be stamped for less costly fabrication, the cell reactions occur with nickel catalysts rather than with expensive precious metal catalysts, reforming can take place within the cell provided a reforming catalyst is added (results in a large efficiency gain), CO is a directly usable fuel, and the rejected heat is of sufficiently high temperature to drive a gas turbine and/or produce a high pressure steam for use in a steam turbine or for cogeneration. Another advantage of the MCFC is that it operates efficiently with CO2-containing fuels such as bio-fuel derived gases. This benefit is derived from the cathode performance enhancement resulting from CO2 enrichment. The MCFC has some disadvantages, however: the electrolyte is very corrosive and mobile, and a source of CO2 is required at the cathode (usually recycled from anode exhaust) to form the carbonate ion. Sulfur tolerance is controlled by the reforming catalyst and is low, which is the same for the reforming catalyst in all cells. Operation requires use of stainless steel as the cell hardware material. The higher temperatures promote material problems, particularly mechanical stability that impacts life. SOFC: The SOFC is the fuel cell with the longest continuous development period, starting in the late 1950s, several years before the AFC. Because the electrolyte is solid, the cell can be cast
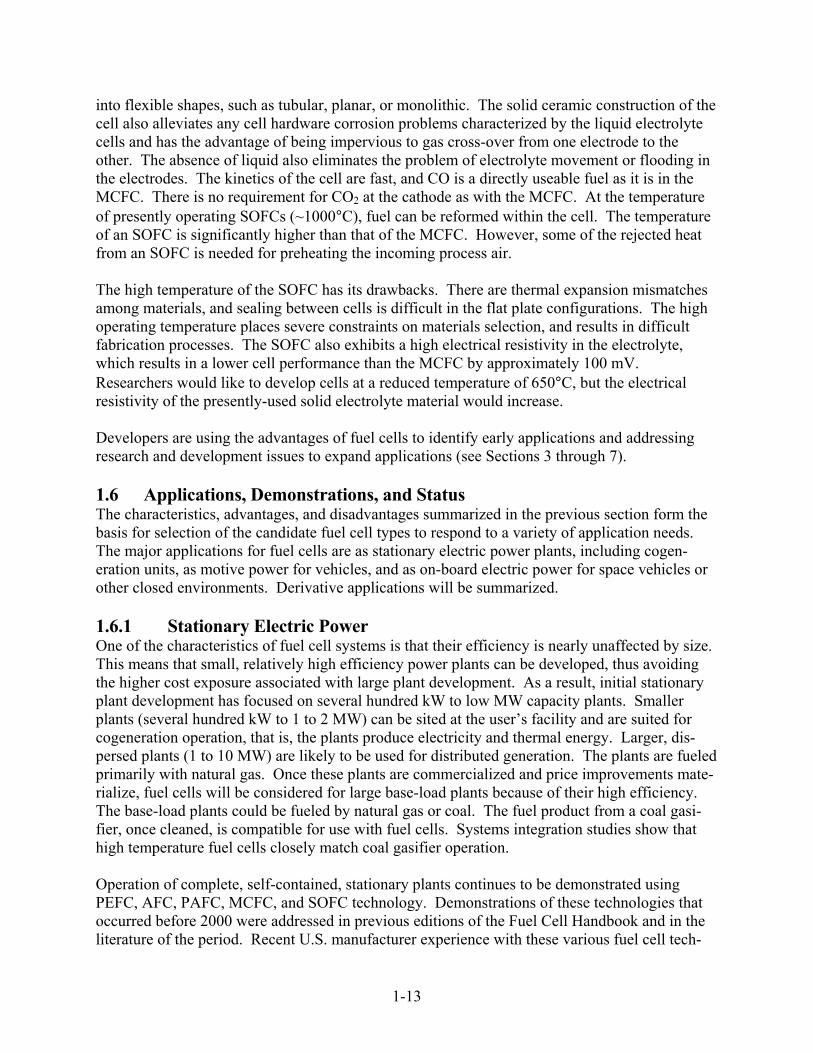
1-13
into flexible shapes, such as tubular, planar, or monolithic. The solid ceramic construction of the cell also alleviates any cell hardware corrosion problems characterized by the liquid electrolyte cells and has the advantage of being impervious to gas cross-over from one electrode to the other. The absence of liquid also eliminates the problem of electrolyte movement or flooding in the electrodes. The kinetics of the cell are fast, and CO is a directly useable fuel as it is in the MCFC. There is no requirement for CO2 at the cathode as with the MCFC. At the temperature of presently operating SOFCs (~1000°C), fuel can be reformed within the cell. The temperature of an SOFC is significantly higher than that of the MCFC. However, some of the rejected heat from an SOFC is needed for preheating the incoming process air. The high temperature of the SOFC has its drawbacks. There are thermal expansion mismatches among materials, and sealing between cells is difficult in the flat plate configurations. The high operating temperature places severe constraints on materials selection, and results in difficult fabrication processes. The SOFC also exhibits a high electrical resistivity in the electrolyte, which results in a lower cell performance than the MCFC by approximately 100 mV. Researchers would like to develop cells at a reduced temperature of 650°C, but the electrical resistivity of the presently-used solid electrolyte material would increase. Developers are using the advantages of fuel cells to identify early applications and addressing research and development issues to expand applications (see Sections 3 through 7). 1.6 Applications, Demonstrations, and Status The characteristics, advantages, and disadvantages summarized in the previous section form the basis for selection of the candidate fuel cell types to respond to a variety of application needs. The major applications for fuel cells are as stationary electric power plants, including cogen-eration units, as motive power for vehicles, and as on-board electric power for space vehicles or other closed environments. Derivative applications will be summarized. 1.6.1 Stationary Electric Power One of the characteristics of fuel cell systems is that their efficiency is nearly unaffected by size. This means that small, relatively high efficiency power plants can be developed, thus avoiding the higher cost exposure associated with large plant development. As a result, initial stationary plant development has focused on several hundred kW to low MW capacity plants. Smaller plants (several hundred kW to 1 to 2 MW) can be sited at the user’s facility and are suited for cogeneration operation, that is, the plants produce electricity and thermal energy. Larger, dis-persed plants (1 to 10 MW) are likely to be used for distributed generation. The plants are fueled primarily with natural gas. Once these plants are commercialized and price improvements mate-rialize, fuel cells will be considered for large base-load plants because of their high efficiency. The base-load plants could be fueled by natural gas or coal. The fuel product from a coal gasi-fier, once cleaned, is compatible for use with fuel cells. Systems integration studies show that high temperature fuel cells closely match coal gasifier operation. Operation of complete, self-contained, stationary plants continues to be demonstrated using PEFC, AFC, PAFC, MCFC, and SOFC technology. Demonstrations of these technologies that occurred before 2000 were addressed in previous editions of the Fuel Cell Handbook and in the literature of the period. Recent U.S. manufacturer experience with these various fuel cell tech-
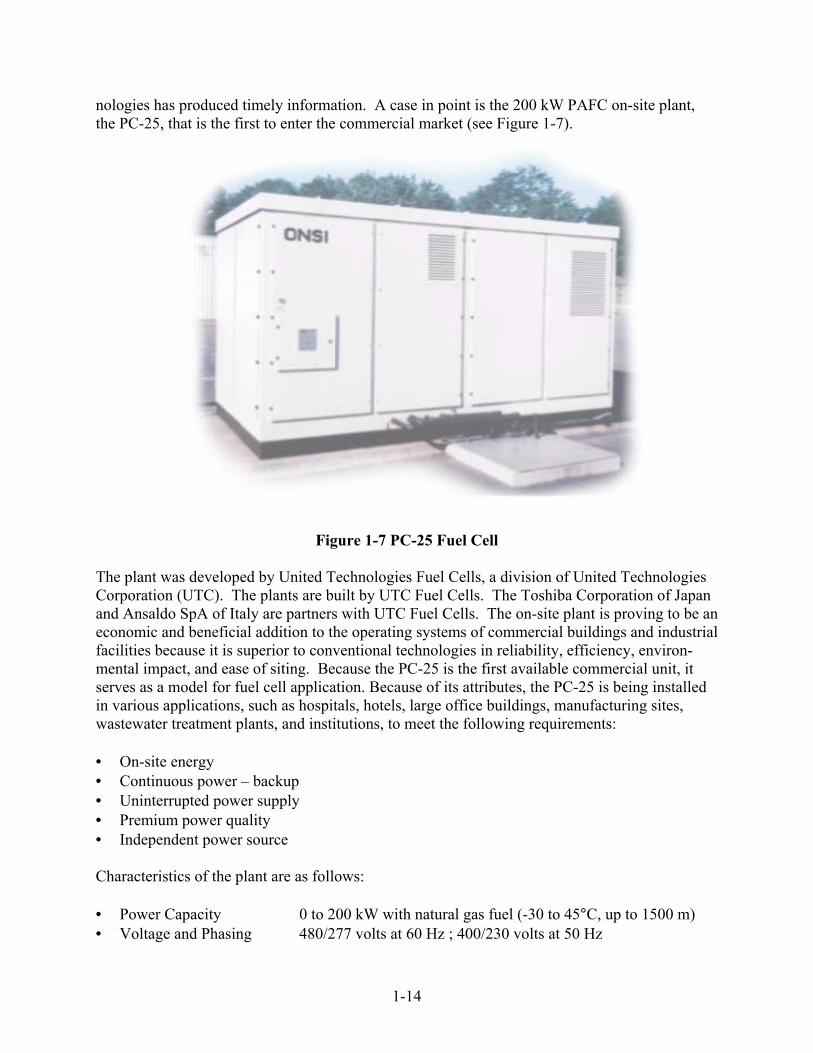
1-14
nologies has produced timely information. A case in point is the 200 kW PAFC on-site plant, the PC-25, that is the first to enter the commercial market (see Figure 1-7).
Figure 1-7 PC-25 Fuel Cell
The plant was developed by United Technologies Fuel Cells, a division of United Technologies Corporation (UTC). The plants are built by UTC Fuel Cells. The Toshiba Corporation of Japan and Ansaldo SpA of Italy are partners with UTC Fuel Cells. The on-site plant is proving to be an economic and beneficial addition to the operating systems of commercial buildings and industrial facilities because it is superior to conventional technologies in reliability, efficiency, environ-mental impact, and ease of siting. Because the PC-25 is the first available commercial unit, it serves as a model for fuel cell application. Because of its attributes, the PC-25 is being installed in various applications, such as hospitals, hotels, large office buildings, manufacturing sites, wastewater treatment plants, and institutions, to meet the following requirements: • On-site energy • Continuous power – backup • Uninterrupted power supply • Premium power quality • Independent power source Characteristics of the plant are as follows: • Power Capacity 0 to 200 kW with natural gas fuel (-30 to 45°C, up to 1500 m) • Voltage and Phasing 480/277 volts at 60 Hz ; 400/230 volts at 50 Hz
1-15
• Thermal Energy 740,000 kJ/hour at 60°C (700,000 Btu/hour heat at 140°F); (Cogeneration) module provides 369,000 kJ/hour at 120°C (350,000Btu/hour at 250°F) and 369,000 kJ/hour at 60°C
• Electric Connection Grid-connected for on-line service and grid-independent for on-site premium service
• Power Factor Adjustable between 0.85 to 1.0 • Transient Overload None • Grid Voltage Unbalance 1% • Grid Frequency Range +/-3% • Voltage Harmonic Limits <3% • Plant Dimensions 3 m (10 ft) wide by 3 m (10 ft) high by 5.5 m (18 ft) long, not
including a small fan cooling module (5) • Plant Weight 17,230 kg (38,000 lb)
UTC Fuel Cells: Results from the operating units as of August, 2002 are as follows: total fleet operation stands at more than 5.3 million hours. The plants achieve 40% LHV electric efficiency, and overall use of the fuel energy approaches 80% for cogeneration applications (6). Operations confirm that rejected heat from the initial PAFC plants can be used for heating water, space heating, and low pressure steam. One plant has completed over 50,000 hours of operation, and a number of plants have operated over 40,000 hours (6). Fourteen additional plants have operated over 35,000 hours. The longest continuous run stands at 9,500 hours for a unit purchased by Tokyo Gas for use in a Japanese office building (9). This plant ended its duration record because it had to be shut down for mandated maintenance. It is estimated at this time that cell stacks can achieve a life of 5 to 7 years. The fleet has attained an average of over 95% availability. The latest model, the PC-25C, is expected to achieve over 96%. The plants have operated on natural gas, propane, butane, landfill gas (10,11), hydrogen (12), and gas from anaerobic digestors (13). Emissions are so low (see Figure 1-6) that the plant is exempt from air permitting in the South Coast and Bay Area (California) Air Quality Management Districts, which have the most stringent limits in the U.S. The sound pressure level is 62 dBA at 9 meters (30 feet) from the unit. The PC-25 has been subjected to ambient conditions varying from -32°C to +49°C and altitudes from sea level to 1600 meters (~1 mile). Impressive ramp rates result from the solid state electronics. The PC-25 can be ramped at 10 kW/sec up or down in the grid connected mode. The ramp rate for the grid independent mode is idle to full power in ~one cycle or essentially one-step instantaneous from idle to 200 kW. Following the initial ramp to full power, the unit can adjust at an 80 kW/sec ramp up or down in one cycle. The fuel cell stacks are made and assembled into units at an 80,000 ft2 facility located in South Windsor, Connecticut. Low cost/high volume production depends on directly insertable sub-assemblies as complete units and highly automatic processes such as robotic component handling and assembly. The stack assembly is grouped in a modified spoke arrangement to allow for individual manufacturing requirements of each of the cell components while bringing them in a continuous flow to a central stacking elevator (14). UTC Fuel Cells had the best sales year in 2001, selling 23 of its PC25 units. Other notable events that occurred in 2001 were:

1-16
• A Hyundai Santa Fe powered by 75-kW UTC PEFC scored best in class in two key performance tests at the Michelin Challenge Bibendum, an annual event where new automotive technologies are evaluated by independent judges.
• Shell Hydrogen and UTC Fuel Cells established HydrogenSource, LLC, a fuel-processing joint venture.
• UTC Fuel Cells and Buderus Heiztechnik agreed to jointly develop and market residential fuel cells in Europe.
New field and planned installations announced since the previous fuel cell handbook are discussed below. UTC Fuel Cells announced that a PC25TM unit will be installed at the Rebekah Baines Johnson Health Center in Austin, Texas. The 200-kilowatt unit will produce electricity and provide heat for producing hot water. The electricity produced by this unit is fed into the Austin Energy electric grid, making it the first fuel cell in Texas to feed power to the grid. Seven PC25TM units will be installed at the Verizon facility on Long Island, New York to provide primary power for critical call-routing center. The combined fuel cells will produce 1.4 megawatts of electricity. Verizon also plans to install four natural gas-powered generators to operate in parallel with the fuel cells as a hybrid system that can generate up to 4.4 megawatts of electrical power. UTC Fuel Cells will install a PC25TM unit Rio de Janeiro, Brazil. Petrobras, Brazil’s oil, gas, and energy company, will install the fuel cell at its research and development center. The unit will be the fourth installed in South America, where UTC Fuel Cells is represented by Sieco S.A., a provider of premium power equipment and services based in Argentina. The New York Power Authority purchased eight PC25TM units. The units will produce power for, and reduce emissions from, wastewater treatment plants in Brooklyn, Staten Bronx, and Queens. The units will run off anaerobic digester gas, a byproduct of the treatment process that would otherwise be burned with no energy recovery. Ballard Generation Systems: Ballard Generation Systems, a subsidiary of Ballard Power Systems, produces a PEFC stationary on-site plant. It has these characteristics: • Power Capacity 250 kW with natural gas fuel • Electric Efficiency 40% LHV • Thermal Energy 854,600 kJ/hour at 74°C (810,000 Btu/hour at 165°F) • Plant Dimensions 2.4 m (8 ft) wide by 2.4 m (8 ft) high by 5.7 m (18.5 ft) long • Plant Weight 12,100 kg (26,700 lb)
Ballard completed 10- and 60-kW engineering prototypes stationary fuel cell power generators in 2001. Ballard, Shell Hydrogen, and Westcoast Energy established a private capital joint venture to help build early stage fuel cell systems. Ballard launched the NexaTM, a portable 1.2 kW power module, in September 2001. Ballard is also selling carbon fiber products for gas diffusion

1-17
layers for proton exchange membrane fuel cells (PEFC’s). Highlights of Ballard’s fuel cell sales are shown below. One of Ballard’s 250 kW generator units completed a 2-year field trail in Basel, Switzerland. Of the remaining eight other 250 kW stationary generators, four are in field tests, two are being prepared for site acceptance testing, one has completed the test program, and one has yet to be sited. Ballard and EBARA Corporation reached an agreement to develop a pilot-scale plant for manufacturing processes and equipment for fuel cell membranes. During an 18-month development period, EBARA will construct and demonstrate capabilities for manufacturing Ballard’s BAM Grafted Proton Exchange Membrane. Ballard continues to develop a next generation prototype 1 kW cogeneration stationary system for the Japanese residential market. FuelCell Energy (FCE): FCE reached 50 MW manufacturing capacity, and plans to expand its manufacturing capacity to 400 MW in 2004. The focus of the utility demonstrations and FCE’s fuel cell development program is the commercialization of 300 kilowatt, 1.5 megawatt, and 3 megawatt MCFC plants. • Power Capacity 3.0 MW net AC • Electric efficiency 57% (LHV) on natural gas • Voltage and Phasing Voltage is site dependent, 3 phase 60 Hz • Thermal energy ~4.2 million kJ/hour (~4 million Btu/hour) • Availability 95% Field trials employing FCE’s commercial MCFC design are being planned at a number of sites. Some are discussed below. FCE and PPL Energy Services announced that a DFC® unit will be installed at Ocean County College, New Jersey. The unit will operate in a cogeneration mode supplying heat and power. FCE will demonstrate a two-megawatt size unit on coal-derived syngas from the Wabash River Integrated Gasification Combined Cycle facility located in West Terre Haute, Indiana. The unit will operate at FCE’s Torrington facility on natural gas before it is shipped to the site in the second half of 2003. FCE installed a 1 MW DFC® power plant at the King Country wastewater treatment facility in Renton, Washington. The two year demonstration project is cost-shared equally by FCE and King County through a cooperative grant to the County from the U.S. Environmental Protection Agency (EPA). Operations are expected to commence during the third quarter of 2002. The project will demonstrate that wastewater treatment systems can generate sufficient quantities of gas to supply the fuel cell plant. The King County municipal wastewater treatment system uses an anaerobic digester process to stabilize solids and reduce microorganisms, and produces a methane-rich gas that can be fed to the DFC® power plant.
1-18
FCE’s partner in Europe, the MTU Friedrichshafen GmbH unit of DaimlerChrysler, placed a 250 kW DFC® unit at the Rhon-Klinkum Hospital in Bad Neustadt. The power plant is connected to the internal system of the hospital, and will also provide heat energy. In July 2001, FCE began operations of a DFC® power plant integrated with a Capstone Turbine Corporation modified Model 330 microturbine. The power plant is designed to operate in a dual mode: as a standalone fuel cell system or in combination with the microturbine. FCE installed a 250 kW DFC® power unit at the Los Angeles Department of Water and Power headquarters the fourth quarter of 2001. A second unit was installed the second quarter 2002. Since the DFC® power plant operates without producing measurable nitrogen and sulfur emissions, it can be readily sited in the middle of Los Angeles. FCE and Marubeni plans to place a 250 kW DFC® power plant in Asia at the Kirin brewery plant outside Tokyo Japan. The fuel cell will operate in cogeneration mode, using a methane-like digester gas produced from the brewery effluent. FCE announced that it is installing a 250 kW DFC® power plant at the University of Connecticut. FCE and its partner, PPL Energy Plus, a subsidiary of PPL Corporation, announced that they are providing two DFC® power plants for installation at New Jersey hotels owned by Starwood Hotels & Resorts Worldwide, Inc. PPL and Starwood Hotels have signed an agreement to install, own and operate one 250-kilowatt DFC® fuel cell power plant at the Sheraton Parsippany Hotel and another at the Sheraton Edison Raritan Center. FCE received an order from PPL Spectrum, Inc., a subsidiary of PPL Corp., for the purchase of a 250 kW DFC® power plant for installation at the United States Coast Guard Air Station Cape Cod located in Bourne, MA. The power plant will provide electricity and heating to the base, which includes barracks, hangars, and administrative buildings. Siemens Westinghouse Power Corporation (SWPC): SWPC selected the Pittsburgh, Pennsylvania area for expansion of its stationary fuel cell business. The 22-acre site located in Munhall, Allegheny County will have a 430,000-ft2 manufacturing facility; SWPC plans to deploy its fuel cell product line in commercial market by fall 2003. SWPC has three SOFC systems employing tubular cell technology operating on user sites. All were produced in their Pittsburgh, Pennsylvania facility. The capacities of the systems are 220 kilowatts, 100 kilowatts, and 25 kilowatts. The 220 kilowatt fuel cell/gas turbine power plant operating at the University of California’s National Fuel Cell Research Center located in Irvine, California is the world’s first SOFC/gas turbine system. The hybrid power plant consists of a 200 kilowatt fuel cell generator pressurized at about 3.5 atmospheres in combination with a 20 kilowatt two-shaft gas turbine. The system was first run at the Pittsburgh facility and started operating at Irvine in June 2000. As of January, 2002, the system has operated for 900+ hours and has demonstrated 53 percent
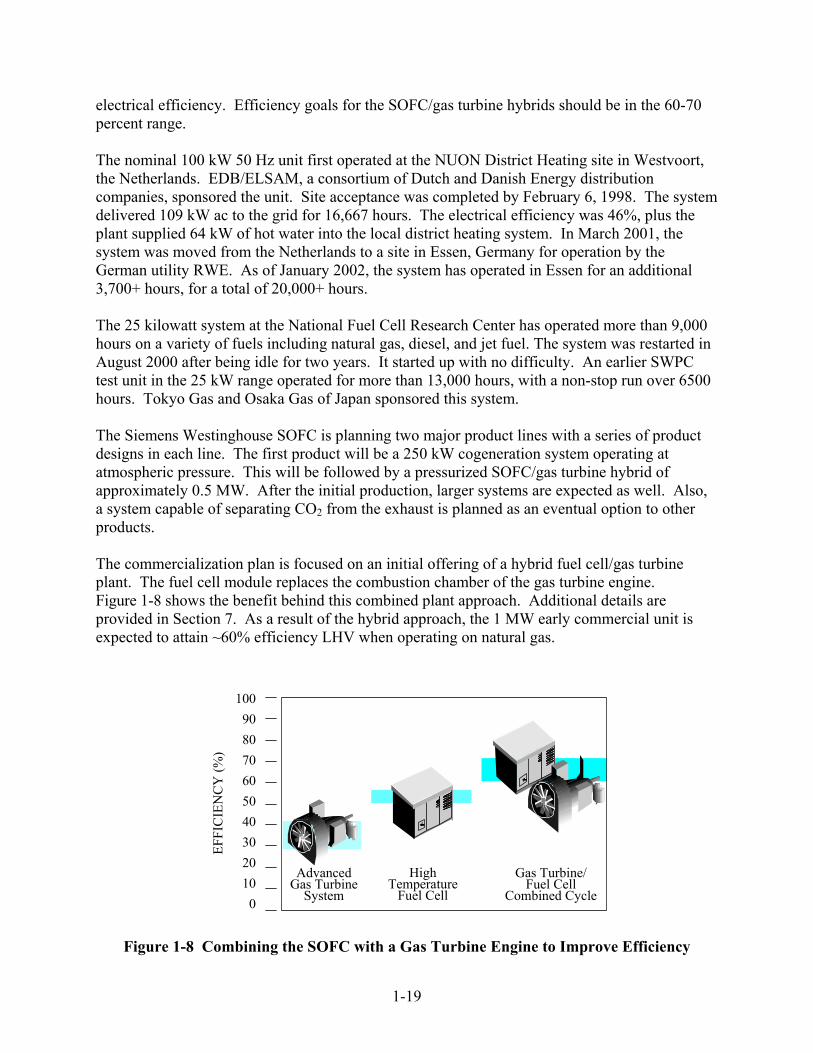
1-19
electrical efficiency. Efficiency goals for the SOFC/gas turbine hybrids should be in the 60-70 percent range. The nominal 100 kW 50 Hz unit first operated at the NUON District Heating site in Westvoort, the Netherlands. EDB/ELSAM, a consortium of Dutch and Danish Energy distribution companies, sponsored the unit. Site acceptance was completed by February 6, 1998. The system delivered 109 kW ac to the grid for 16,667 hours. The electrical efficiency was 46%, plus the plant supplied 64 kW of hot water into the local district heating system. In March 2001, the system was moved from the Netherlands to a site in Essen, Germany for operation by the German utility RWE. As of January 2002, the system has operated in Essen for an additional 3,700+ hours, for a total of 20,000+ hours. The 25 kilowatt system at the National Fuel Cell Research Center has operated more than 9,000 hours on a variety of fuels including natural gas, diesel, and jet fuel. The system was restarted in August 2000 after being idle for two years. It started up with no difficulty. An earlier SWPC test unit in the 25 kW range operated for more than 13,000 hours, with a non-stop run over 6500 hours. Tokyo Gas and Osaka Gas of Japan sponsored this system. The Siemens Westinghouse SOFC is planning two major product lines with a series of product designs in each line. The first product will be a 250 kW cogeneration system operating at atmospheric pressure. This will be followed by a pressurized SOFC/gas turbine hybrid of approximately 0.5 MW. After the initial production, larger systems are expected as well. Also, a system capable of separating CO2 from the exhaust is planned as an eventual option to other products. The commercialization plan is focused on an initial offering of a hybrid fuel cell/gas turbine plant. The fuel cell module replaces the combustion chamber of the gas turbine engine. Figure 1-8 shows the benefit behind this combined plant approach. Additional details are provided in Section 7. As a result of the hybrid approach, the 1 MW early commercial unit is expected to attain ~60% efficiency LHV when operating on natural gas.
1009080706050403020100
AdvancedGas Turbine
System
HighTemperature
Fuel Cell
Gas Turbine/Fuel Cell
Combined Cycle
EFFI
CIE
NC
Y (%
)
Figure 1-8 Combining the SOFC with a Gas Turbine Engine to Improve Efficiency
1-20
Siemens Westinghouse is planning a number of tests on power plants that are prototypes of future products. All systems employ the tubular SOFC concept and most are combined with gas turbines in a hybrid configuration. Capacities of these systems are 250 kilowatts atmospheric, 300 kilowatt class hybrid, and 1 megawatt class hybrid. They are to operate at various sites in the U.S., Canada, and Europe. Some of them are discussed below. A 250 kilowatt atmospheric system is planned for a Toronto, Ontario, Canada site. The system will be operated by Ontario Power Technologies (formerly Ontario Hydro). The unit will supply 145 kilowatts of heat to the site heating system. Electric efficiency is expected to be about 47% (LHV). Operation of the combined heat and power system is expected in 2002. Operation of a 230 kilowatt class hybrid system is planned for Essen, Germany. The utility RWE will operate the system. Efficiency of the system will be about 57% (LHV). Operation is expected in 2002. A 230 kilowatt class hybrid system is planned to operate near Milan, Italy. Edison SpA will operate the power plant. Efficiency will be about 57% (LHV). Operation is expected to begin in 2002. A 250 kilowatt system is planned for a site in Norway. The system will be operated by Norske Shell to demonstrate that CO2 can be economically recovered. The CO2 recovery technology is being developed by Shell Hydrogen. The CO2 could be sequestered in underground reservoirs or could be used for special applications such as fish farms or agricultural greenhouses. The test system will be sited at a fish hatchery. The system is expected to begin operation in 2003. An eventual market for fuel cells is the large (100 to 300 MW), base-loaded, stationary plants operating on coal or natural gas. Another related, early opportunity may be in repowering older, existing plants with high-temperature fuel cells (19). MCFCs and SOFCs, coupled with coal gasifiers, have the best attributes to compete for the large, base load market. The rejected heat from the fuel cell can be used to produce steam for the existing plant's turbines. Studies showing the potential of high-temperature fuel cells for plants of this size have been performed (see Section 8). These plants are expected to attain from 50 to 60% efficiency based on the HHV of the fuel. Coal gasifiers produce a fuel gas product requiring cleaning to the stringent require-ments of the fuel cells’ electrochemical environment, a costly process. The trend of environmen-tal regulations has also been towards more stringent cleanup. If this trend continues, coal-fired technologies will be subject to increased cleanup costs that may worsen process economics. This will improve the competitive position of plants based on the fuel cell approach. Fuel cell sys-tems will emit less than target emissions limits. U.S. developers have begun investigating the viability of coal gas fuel to MCFCs and SOFCs (20,21,22). An FCE 20 kW MCFC stack was tested for a total of 4,000 hours, of which 3,900 hours was conducted at Plaquemine, LA, using coal gas as well as pipeline gas. The test included 1,500 hours of operation using 9,142 kJ/m3 syngas from a slip stream of a 2,180 tonne/day Destec entrained gasifier. The fuel processing system incorporated cold gas cleanup for bulk removal of H2S and other contaminants, allowing the 21 kW MCFC stack to demonstrate that the FCE technology can operate on either natural gas or coal gas.

1-21
User groups have organized together with the manufacturers in stationary plant development programs. The groups are listed below: • PAFC, IFC The North American Fuel Cell Owners Group • MCFC, FCE The Fuel Cell Commercialization Group • SOFC, Siemens Westinghouse SOFC Commercialization Association (SOCA) These groups provide invaluable information from a user viewpoint about fuel cell technology for stationary power plant application. They can be contacted though the manufacturers. A series of standards is being developed to facilitate the application of stationary fuel cell technology power plants. Standard development activities presently underway are • Design and Manufacturing Standard ANSI Z21.83/CGA 12.10 • Interconnect Standards for Interfacing Revive/Revise ANSI/IEEE Std 1001-1988 • Performance Test ASME PTC50, Fuel Cell Performance Code
Committee • Emergency Generator Standards NFPA 70,110 • Installation Standard Review NFPA TC 850 MILITARY APPLICATIONS The military finds certain characteristics of fuel cell power plants desirable for field duty. Fore-most, a fuel cell unit is quiet and has a low heat profile so can be close to the front line. It can be scaled to various sizes, from a few kW backpack to larger mobile power plant. The main drawback for the military is that the existing infrastructure is limited to logistic fuels. Logistic fuels (defined as easily transportable and stored, and compatible with military uses) are difficult to convert to hydrogen for fuel cell use. The burden of changing the fuel infrastructure to accommodate lighter fuels, normally used in fuel cells, is far greater than the benefits fuel cells offer the military. The Advanced Research Projects Agency of DOD funded several projects to investigate adapting logistics fuels to fuel cell use. IFC conducted testing of a 100 kW mobile electric power plant (MEP) with the logistic fuels of JP-8 and DF-2. An auto-thermal reformer that achieved 98% conversion was used to convert the logistic fuel to a methane rich fuel. FCE tested a lab-scale carbonate fuel cell stack on a model diesel-like fuel (Exxsol) using an adiabatic pre-reformer to convert the liquid fuel to methane in 1991 to 1993. In 1995 and 1996, FCE verified a 32 kW MCFC stack operation on jet fuel (JP-8) and diesel (DF-2) in system inte-grated tests using the diesel-to-methane adiabatic pre-reformer approach. Test results showed that there was a 5% power derating compared to natural gas operation. The 25 kW SOFC power unit (see Siemens Westinghouse, above) was fitted with a pre-reformer similar to the FCE and operated with JP-8 (766 hours) and DF-2 (1555 hours) while the unit was installed at FCE’s Highgrove Station.
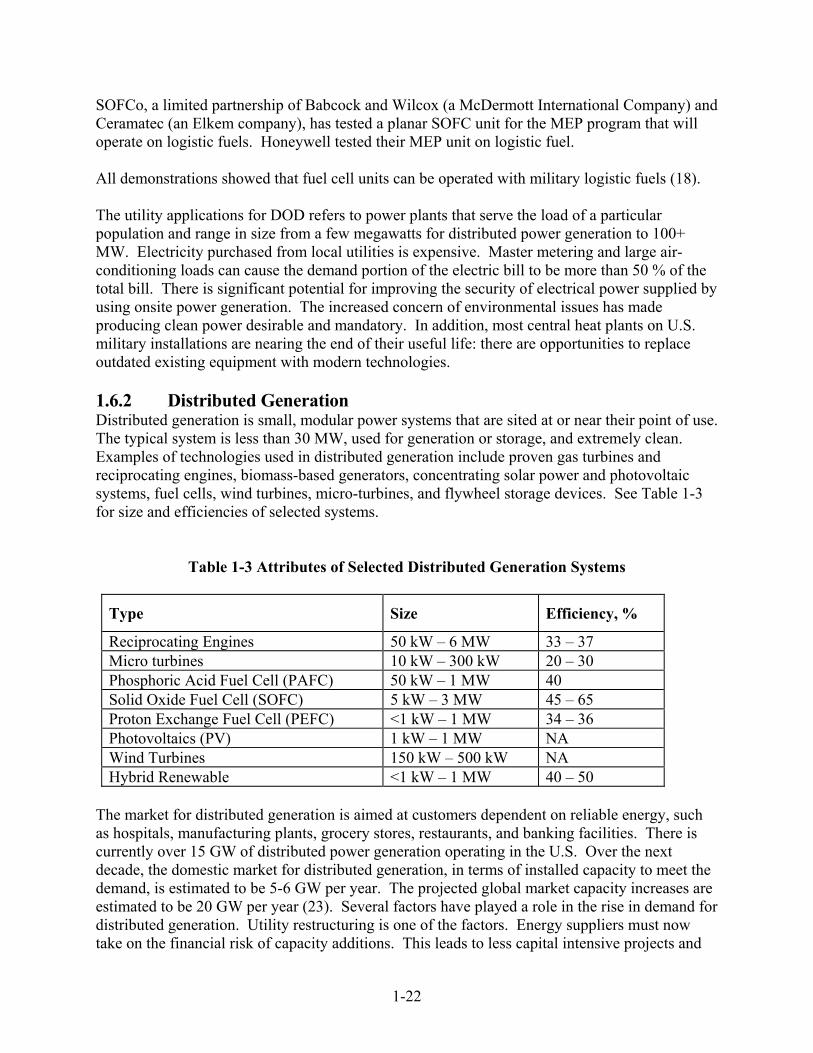
1-22
SOFCo, a limited partnership of Babcock and Wilcox (a McDermott International Company) and Ceramatec (an Elkem company), has tested a planar SOFC unit for the MEP program that will operate on logistic fuels. Honeywell tested their MEP unit on logistic fuel. All demonstrations showed that fuel cell units can be operated with military logistic fuels (18). The utility applications for DOD refers to power plants that serve the load of a particular population and range in size from a few megawatts for distributed power generation to 100+ MW. Electricity purchased from local utilities is expensive. Master metering and large air-conditioning loads can cause the demand portion of the electric bill to be more than 50 % of the total bill. There is significant potential for improving the security of electrical power supplied by using onsite power generation. The increased concern of environmental issues has made producing clean power desirable and mandatory. In addition, most central heat plants on U.S. military installations are nearing the end of their useful life: there are opportunities to replace outdated existing equipment with modern technologies. 1.6.2 Distributed Generation Distributed generation is small, modular power systems that are sited at or near their point of use. The typical system is less than 30 MW, used for generation or storage, and extremely clean. Examples of technologies used in distributed generation include proven gas turbines and reciprocating engines, biomass-based generators, concentrating solar power and photovoltaic systems, fuel cells, wind turbines, micro-turbines, and flywheel storage devices. See Table 1-3 for size and efficiencies of selected systems.
Table 1-3 Attributes of Selected Distributed Generation Systems
Type Size Efficiency, %
Reciprocating Engines 50 kW – 6 MW 33 – 37 Micro turbines 10 kW – 300 kW 20 – 30 Phosphoric Acid Fuel Cell (PAFC) 50 kW – 1 MW 40 Solid Oxide Fuel Cell (SOFC) 5 kW – 3 MW 45 – 65 Proton Exchange Fuel Cell (PEFC) <1 kW – 1 MW 34 – 36 Photovoltaics (PV) 1 kW – 1 MW NA Wind Turbines 150 kW – 500 kW NA Hybrid Renewable <1 kW – 1 MW 40 – 50
The market for distributed generation is aimed at customers dependent on reliable energy, such as hospitals, manufacturing plants, grocery stores, restaurants, and banking facilities. There is currently over 15 GW of distributed power generation operating in the U.S. Over the next decade, the domestic market for distributed generation, in terms of installed capacity to meet the demand, is estimated to be 5-6 GW per year. The projected global market capacity increases are estimated to be 20 GW per year (23). Several factors have played a role in the rise in demand for distributed generation. Utility restructuring is one of the factors. Energy suppliers must now take on the financial risk of capacity additions. This leads to less capital intensive projects and

1-23
shorter construction periods. Also, energy suppliers are increasing capacity factors on existing plants rather than installing new capacity, which places pressure on reserve margins. This increases the possibility of forced outages, thereby increasing the concern for reliable service. There is also a demand for capacity additions that offer high efficiency and use of renewables as the pressure for enhanced environmental performance increases (23). There are many applications for distributed generation systems. They include: • Peak shaving - Power costs fluctuate hour by hour depending upon demand and generation,
therefore customers would select to use distributed generation during relatively high-cost on-peak periods.
• Combined heat and power (CHP) (Cogeneration) –The thermal energy created while converting fuel to electricity would be utilized for heat in addition to electricity in remote areas and electricity and heat for sites that have a 24 hour thermal/electric demand.
• Grid support – Strategic placement of distributed generation can provide system benefits and preclude the need for expensive upgrades and provide electricity in regions where small increments of new baseload capacity is needed.
• Standby power – Power during system outages is provided by a distributed generation system until service can be restored. This is used for customers that require reliable back-up power for health or safety reasons, companies with voltage sensitive equipment, or where outage costs are unacceptably high.
• Remote/Stand alone – The user is isolated from the grid either by choice or circumstance. The purpose is for remote applications and mobile units to supply electricity where needed.
Benefits and Obstacles: Distributed generation systems have small footprints, are modular and mobile making them very flexible in use. The systems provide benefits at the customer level, the supplier level, and the national level. Benefits to the customer include high power quality, improved reliability, and flexibility to react to electricity price spikes. Supplier benefits include avoiding investments in transmission and distribution (T&D) capacity upgrades by locating power where it is most needed and opening new markets in remote areas. At the national level, the market for distrib-uted generation establishes a new industry, boosting the economy. The improved efficiencies also reduce greenhouse gas emissions. However, there are also a number of barriers and obstacles to overcome before distributed generation can become a mainstream service. These barriers include technical, economic, institutional, and regulatory issues. Many of the proposed technologies have not yet entered the market and will need to meet performance and pricing targets before entry. Questions have also risen on requirements for connection to the grid. Lack of standardized procedures creates delays and discourages customer-owned projects. Siting, permitting, and environmental regulations can also delay and increase the costs of distributed generation projects. In 1998, the Department of Energy created a Distributed Power Program to focus on market barriers and other issues, which are prohibiting the growth of distributed generation systems. Under the leadership of the National Renewable Energy Laboratory (NREL), a collaboration of national laboratories and industry partners have been creating new standards and identifying and
1-24
removing regulatory barriers. The goals of the program include 1) Strategic research, 2) System Integration, and 3) Mitigation of regulatory and institutional barriers (24). Fuel Cells: Fuel cells, one of the emerging technologies in distributed generation, have been hindered by high initial costs. However, costs are expected to decline as manufacturing capacity and capability increase and designs and integration improve. The fuel cell systems offer many potential benefits as a distributed generation system. They are small and modular, and capital costs are relatively insensitive to scale. This makes them ideal candidates for diverse applications where they can be matched to meet specific load requirements. The systems are unobtrusive with very low noise levels and have negligible air emissions. These qualities enable them to be placed close to the source of power demand. Fuel cells also offer higher efficiencies than conventional plants. The efficiencies can be enhanced by utilizing the quality waste heat derived from the fuel cell reactions for combined heat and power and combined-cycle applications. Phosphoric acid fuel cells have successfully been commercialized. Second generation fuel cells, including solid oxide fuel cells and molten carbonate fuel cells, are expected to make market entry by 2002. Research is ongoing in areas such as fuel options and new ceramic materials. Different manufacturing techniques are also being sought to help reduce capital costs. Proton exchange membrane fuel cells are still in the development and testing phase. Projects: There are currently several projects in the distributed generation market underway with various fuel cell developers and utility companies. These projects are helping to drive costs down and bring the fuel cells closer to commercialization. Below is a summary of some of the projects. IdaTech LLC (formerly Northwest Power Systems), of Bend, Oregon, an Idacorp subsidiary, delivered the first of 110 planned fuel cell systems to the Bonneville Power Administration (BPA), Portland, Oregon in June 2000. The BPA program is part of a fuel cell test and devel-opment phase intended to commercialize fuel cell systems for home and small commercial applications by 2003. Avista Labs, an affiliate of Avista Corp., of Spokane, Washington, received a U.S. patent in March 2000 that covers 162 claims for its modular, cartridge-based proton exchange membrane fuel cell. The fuel cell cartridges can be removed and replaced while the power system continues to operate. Additional elements of the patented system include proprietary designs that simplify the humidifying and cooling systems, resulting in lower manufacturing costs and higher efficiency. Currently, Avista has 75 fuel cells installed at 20 sites around the U.S. and Brazil. Bewag AG’s Treptow heating plant, located in Berlin, Germany received a 250 kW PEFC unit in April 2000 from Ballard Generation Systems, a subsidiary of Ballard Power System, of Burnaby, BC, Canada. Plug Power, Inc, of Latham, NY delivered more than 106 5-kW grid-parallel systems, through October 2001. Deliveries include 44 units to New York State Research & Development
1-25
Authority and 57 units to the Long Island Power Authority. Plug Power has also sent units to 1) Kubota, a diversified Japanese Manufacturing and distribution company, 2) Oak Ridge National Laboratory, 3) Vaillant GmbH in Germany, and 4) a 50-kW unit to Air Products and Chemicals. Energy USA, a subsidiary of NiSource Inc, of Merrillville, Ind formed a joint venture with Institute of Gas Technology called Mosiac Energy LLC. They designed fuel cells for the core of the home’s energy-generating system to be used in a Chesterton, Indiana housing development. Space heating and other household needs will be provided by the byproduct heat production. UTC Fuel Cells, of South Windsor, Connecticut, has the most commercially advanced fuel cell for electricity generation, the PC25, a 200-kW phosphoric acid fuel cell (PAFC). UTC Fuel Cells has over 250 fuel cells in 19 countries delivered around the world. Siemens Westinghouse, of Pittsburgh, PA has manufactured the largest tubular solid oxide fuel cell (SOFC) system. The Dutch/Danish consortium EDB/Elsam operates the system, which supplies 110 kW of electricity to the grid and 64 kW to the city of Westervoort, Netherlands district heating system. The efficiency is about 46% with exhaust gas values for NOX, SOX, CO and VHC under 1 ppm each. Commercial units ranging in size from 250 to 1000 kW are expected in 2004. Siemens Westingtonhouse installed a 250 kW unit at the National Fuel Cell Center. The Los Angeles Department of Water and Power (LADWP) is investing $1.5 million to develop and install a 250 kW molten carbonate fuel cell (MCFC) powerplant. FCE, of Danbury, Connecticut will supply the fuel cell. The goals of the project include testing and demonstrating the feasibility of the technology to generate electricity for the LADWP system. In early 2000, FCE’s DFC® went into a joint public/private development with NETL. This system uses internal conversion of the natural-gas fuel to hydrogen, as opposed to an external unit. This reduces costs and creates efficient use of excess heat. The DFC® system has already passed 8600 hours and a one-year milestone at FCE’s headquarters. In 2001, FCE delivered a 250 kW DFC® power plant to the Mercedes-Benz manufacturing facility in Tuscaloosa, AL. The fuel cell is tied into the existing power distribution system. MILITARY APPLICATIONS The Navy is studying the concept of all electric ships. These new ships will not have a central engine room and long drive shafts. The ships will depend on redundancy of generator capacity for combat survival, rather than protection of a centralized engine room. 1.6.3 Vehicle Motive Power Since the late 1980s, there has been a strong push to develop fuel cells for use in light-duty and heavy-duty vehicle propulsion. A major drive for this development is the need for clean, effi-cient cars, trucks, and buses that can operate on conventional fuels (gasoline, diesel), as well as renewable and alternative fuels (hydrogen, methanol, ethanol, natural gas, and other hydro-carbons). With hydrogen as the on-board fuel, such vehicles would be zero emission vehicles. With on-board fuels other than hydrogen, the fuel cell systems would use an appropriate fuel

1-26
processor to convert the fuel to hydrogen, yielding vehicle power trains with very low acid gas emissions and high efficiencies. Further, such vehicles offer the advantages of electric drive and low maintenance because of the few critical moving parts. This development is being sponsored by various governments in North America, Europe, and Japan, as well as by major automobile manufacturers worldwide. Several fuel cell-powered cars, vans, and buses have operated on hydrogen and methanol. In the early 1970s, K. Kordesch modified a 1961 Austin A-40 two-door, four-passenger sedan to an air-hydrogen fuel cell/battery hybrid car (23). This vehicle used a 6-kW alkaline fuel cell in conjunction with lead acid batteries, and operated on hydrogen carried in compressed gas cylinders mounted on the roof. The car was operated on public roads for three years and about 21,000 km. In 1994 and 1995, H-Power (Belleville, New Jersey) headed a team that built three PAFC/battery hybrid transit buses (24,25). These 9 meter (30 foot), 25 seat (with space for two wheel chairs) buses used a 50 kW fuel cell and a 100 kW, 180 amp-hour nickel cadmium battery. The major activity in transportation fuel cell development has focused on the polymer electrolyte fuel cell (PEFC). In 1993, Ballard Power Systems (Burnaby, British Columbia, Canada) demonstrated a 10 m (32 foot) light-duty transit bus with a 120 kW fuel cell system, followed by a 200 kW, 12 meter (40 foot) heavy-duty transit bus in 1995 (26). These buses use no traction batteries. They operate on compressed hydrogen as the on-board fuel. In 1997, Ballard provided 205 kW (275 HP) PEFC units for a small fleet of hydrogen-fueled, full-size transit buses for demonstrations in Chicago, Illinois, and Vancouver, British Columbia. Working in collaboration with Ballard, Daimler-Benz built a series of PEFC-powered vehicles, ranging from passenger cars to buses (27). The first such vehicles were hydrogen-fueled. A methanol-fueled PEFC A-class car unveiled by Daimler-Benz in 1997 has a 640 km (400 mile) range. Plans are to offer a commercial vehicle by 2004. A hydrogen-fueled (metal hydride for hydrogen storage), fuel cell/battery hybrid passenger car was built by Toyota in 1996, followed in 1997 by a methanol-fueled car built on the same (RAV4) platform (28). In February 2002, UTC Fuel Cells and Nissan signed an agreement to develop fuel cells and fuel cell components for vehicles. Renault, Nissan’s alliance partner, is also participating in the development projects. UTC Fuel Cells will provide proprietary ambient-pressure proton exchange membrane fuel cell technology. Ballard’s fuel cell engine powered DaimlerChrysler’s NECAR 5 fuel cell vehicle in a 13-day, 3,000-mile endurance test across the United States. The drive provided Ballard and DaimlerChrysler with testing experience in a variety of conditions. Toyota Motor Corp. and Honda Motor Co. have announced they will advance their initial vehicle introduction plans for fuel cell vehicles to late in 2002 from 2003. Honda achieved a significant milestone for its product launch by receiving both CARB and EPA certification of its zero emission FCX-V4 automobile. This is the first vehicle to receive such certification. Ballard’s fuel cell powered this Honda vehicle.
1-27
Other major automobile manufacturers, including General Motors, Volkswagen, Volvo, Chrysler, Nissan, and Ford, have also announced plans to build prototype polymer electrolyte fuel cell vehicles operating on hydrogen, methanol, or gasoline (29). IFC and Plug Power in the U.S., and Ballard Power Systems of Canada (15), are involved in separate programs to build 50 to 100 kW fuel cell systems for vehicle motive power. Other fuel cell manufacturers are involved in similar vehicle programs. Some are developing fuel cell-powered utility vehicles, golf carts, etc. (30,31). MILITARY APPLICATIONS The U.S. Army plans to reduce battlefield fuel consumption 75% by the year 2020. This will make supplying combat units easier, while also making it easier to protect supply lines. The future Army must reduce its vehicle exhaust emissions during peacetime. The Army owns a large number of vehicles equipped with non-emission controlled diesel engines, and will still own a significant number of these engines in 2020. One example of military-sponsored research is the all-electric tank with an electromagnetic rail gun. The gun would use a powerful magnetic field to propel a small armor-piercing projectile to hypersonic speeds. Such a vehicle would be fast, quiet, and capable of firing flurries of rounds at multiple targets. 1.6.4 Space and Other Closed Environment Power The application of fuel cells in the space program (1 kW PEFC in the Gemini program and 1.5 kW AFC in the Apollo program) was demonstrated in the 1960s. More recently, three 12 kW AFC units have been used for at least 87 missions with 65,000 hours flight time in the Space Shuttle Orbiter. In these space applications, the fuel cells use pure reactant gases. IFC has produced a H2/O2 30 kW unit for the Navy’s Lockheed Deep Quest vehicle. It operates at depths of 1500 meters (5000 feet). Ballard Power Systems has produced an 80 kW PEFC unit for submarine use (methanol fueled) and for portable power systems. 1.6.5 Fuel Cell Auxiliary Power Systems In addition to high-profile fuel cell applications such as automotive propulsion and distributed power generation, the use of fuel cells as auxiliary power units (APUs) for vehicles has received considerable attention (see Figure 1-9). APU applications may be an attractive market because it offers a true mass-market opportunity that does not require the challenging performance and low cost required for propulsion systems for vehicles. In this section, a discussion of the technical performance requirements for such fuel cell APUs, as well as the current status of the technology and the implications for fuel cell system configuration and cost is given.
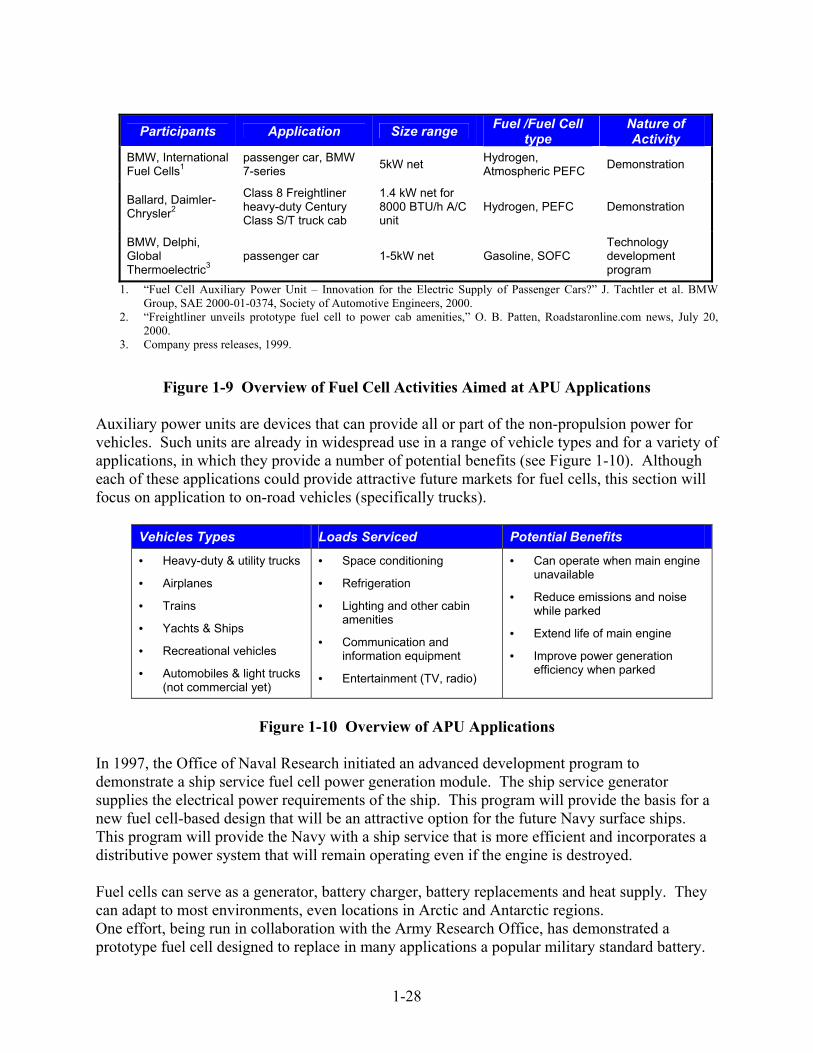
1-28
Participants Application Size range Fuel /Fuel Cell
type Nature of Activity
BMW, International Fuel Cells1
passenger car, BMW 7-series 5kW net Hydrogen,
Atmospheric PEFC Demonstration
Ballard, Daimler-Chrysler2
Class 8 Freightliner heavy-duty Century Class S/T truck cab
1.4 kW net for 8000 BTU/h A/C unit
Hydrogen, PEFC Demonstration
BMW, Delphi, Global Thermoelectric3
passenger car 1-5kW net Gasoline, SOFC Technology development program
1. “Fuel Cell Auxiliary Power Unit – Innovation for the Electric Supply of Passenger Cars?” J. Tachtler et al. BMW Group, SAE 2000-01-0374, Society of Automotive Engineers, 2000.
2. “Freightliner unveils prototype fuel cell to power cab amenities,” O. B. Patten, Roadstaronline.com news, July 20, 2000.
3. Company press releases, 1999.
Figure 1-9 Overview of Fuel Cell Activities Aimed at APU Applications Auxiliary power units are devices that can provide all or part of the non-propulsion power for vehicles. Such units are already in widespread use in a range of vehicle types and for a variety of applications, in which they provide a number of potential benefits (see Figure 1-10). Although each of these applications could provide attractive future markets for fuel cells, this section will focus on application to on-road vehicles (specifically trucks).
Vehicles Types Loads Serviced Potential Benefits • Heavy-duty & utility trucks
• Airplanes
• Trains
• Yachts & Ships
• Recreational vehicles
• Automobiles & light trucks (not commercial yet)
• Space conditioning
• Refrigeration
• Lighting and other cabin amenities
• Communication and information equipment
• Entertainment (TV, radio)
• Can operate when main engine unavailable
• Reduce emissions and noise while parked
• Extend life of main engine
• Improve power generation efficiency when parked
Figure 1-10 Overview of APU Applications
In 1997, the Office of Naval Research initiated an advanced development program to demonstrate a ship service fuel cell power generation module. The ship service generator supplies the electrical power requirements of the ship. This program will provide the basis for a new fuel cell-based design that will be an attractive option for the future Navy surface ships. This program will provide the Navy with a ship service that is more efficient and incorporates a distributive power system that will remain operating even if the engine is destroyed. Fuel cells can serve as a generator, battery charger, battery replacements and heat supply. They can adapt to most environments, even locations in Arctic and Antarctic regions. One effort, being run in collaboration with the Army Research Office, has demonstrated a prototype fuel cell designed to replace in many applications a popular military standard battery.

1-29
The target application is the Army's BA-5590 primary (i.e., use-once-and-dispose) lithium battery. The Army purchases approximately 350,000 of these batteries every year at a cost of approximately $100 per battery, including almost $30 per battery for disposal. Fuel cells, on the other hand, are not thrown away after each use but can be reused hundreds of times. Mission weight savings of factors of 10 or more are projected. The prototype fuel cell, which has the same size and delivers the same power as a battery, has been tested in all orientations and under simulated adverse weather conditions, and was enthusiastically received by Army senior management. System Performance Requirements A key reason for interest in fuel cell APU applications is that there may be a good fit between APU requirements and fuel cell system characteristics. Fuel cells could be efficient and quiet, and APUs do have the load following requirements and physical size and weight constraints associated with propulsion applications. However, in order to understand the system requirements for fuel cell APUs, it is critical to understand the required functionality (refer to Figure 1-10) as well as competing technologies. To provide the functionality of interest, and to be competitive with internal combustion engine (ICE) driven APUs, fuel cell APUs must meet various requirements; an overview is provided in Figure 1-11.
Key Parameter Typical Requirements Expected fuel cell performance
Power output 12 – 42 V DC is acceptable for most applications, 110 / 220 V AC may be desirable for powering power tools etc.
DC power output simplifies the power conditioning and control for fuel cells
System Capacity 1 – 5 kW for light duty vehicles and truck cabins
up to 15 kW for truck refrigeration
Fits expected range for PEFCs and probably also advanced SOFCs
System Efficiency More than 15-25% based on LHV Efficiency target should be achievable, even in smallest capacity range
Operating life and reliability Greater than about 5,000 hours stack life, with regular service intervals less than once every 1,000 hours
Insufficient data available to assess whether this is a challenge or not
Figure 1-11 Overview of typical system requirements
Fuel cell APUs will likely have to operate on gasoline, and for trucks preferably on diesel fuel, in order to match the infrastructure available, and preferably to be able to share on-board storage tanks with the main engine. The small amount of fuel involved in fueling APUs would likely not justify the establishment of a specialized infrastructure (e.g. a hydrogen infrastructure) for APUs alone. Similarly, fuel cell APUs should be water self-sufficient, as the need to carry water for the APU would be a major inconvenience to the operator, and would require additional space and associated equipment.
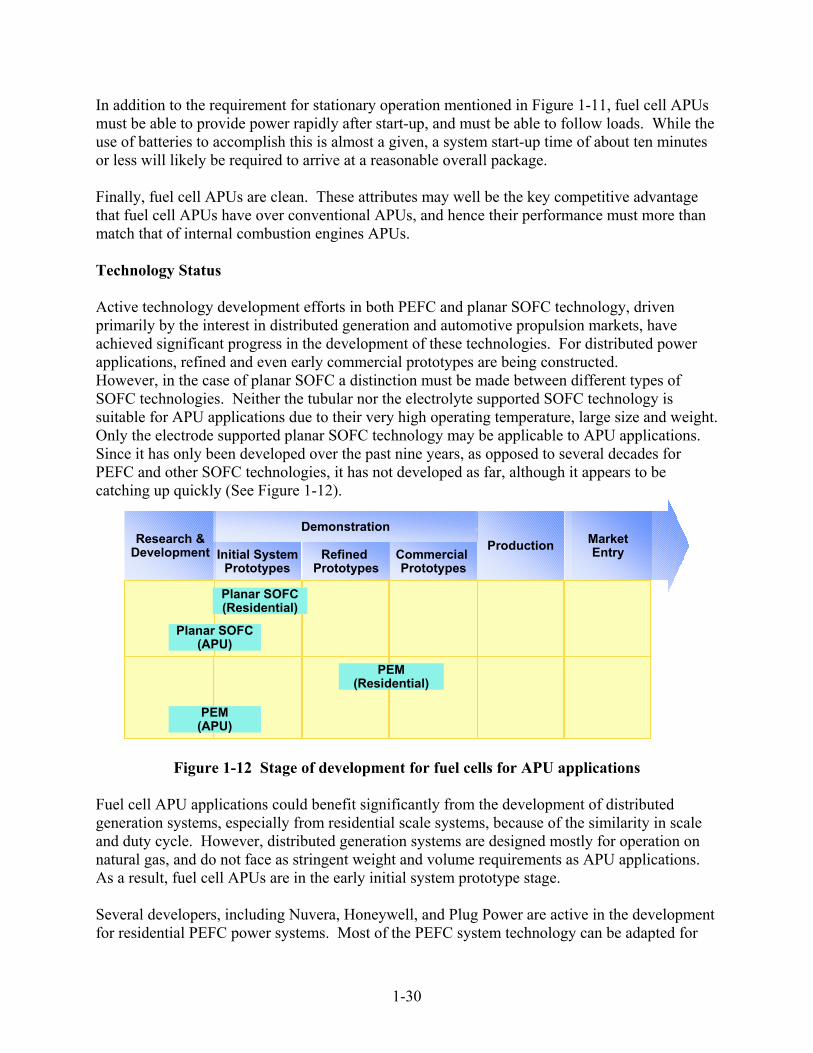
1-30
In addition to the requirement for stationary operation mentioned in Figure 1-11, fuel cell APUs must be able to provide power rapidly after start-up, and must be able to follow loads. While the use of batteries to accomplish this is almost a given, a system start-up time of about ten minutes or less will likely be required to arrive at a reasonable overall package. Finally, fuel cell APUs are clean. These attributes may well be the key competitive advantage that fuel cell APUs have over conventional APUs, and hence their performance must more than match that of internal combustion engines APUs. Technology Status Active technology development efforts in both PEFC and planar SOFC technology, driven primarily by the interest in distributed generation and automotive propulsion markets, have achieved significant progress in the development of these technologies. For distributed power applications, refined and even early commercial prototypes are being constructed. However, in the case of planar SOFC a distinction must be made between different types of SOFC technologies. Neither the tubular nor the electrolyte supported SOFC technology is suitable for APU applications due to their very high operating temperature, large size and weight. Only the electrode supported planar SOFC technology may be applicable to APU applications. Since it has only been developed over the past nine years, as opposed to several decades for PEFC and other SOFC technologies, it has not developed as far, although it appears to be catching up quickly (See Figure 1-12).
Research &Development Production Market
Entry
Demonstration
Initial SystemPrototypes
Refined Prototypes
Commercial Prototypes
Planar SOFC(Residential)
PEM(Residential)
Planar SOFC(APU)
PEM(APU)
Figure 1-12 Stage of development for fuel cells for APU applications
Fuel cell APU applications could benefit significantly from the development of distributed generation systems, especially from residential scale systems, because of the similarity in scale and duty cycle. However, distributed generation systems are designed mostly for operation on natural gas, and do not face as stringent weight and volume requirements as APU applications. As a result, fuel cell APUs are in the early initial system prototype stage. Several developers, including Nuvera, Honeywell, and Plug Power are active in the development for residential PEFC power systems. Most of the PEFC system technology can be adapted for
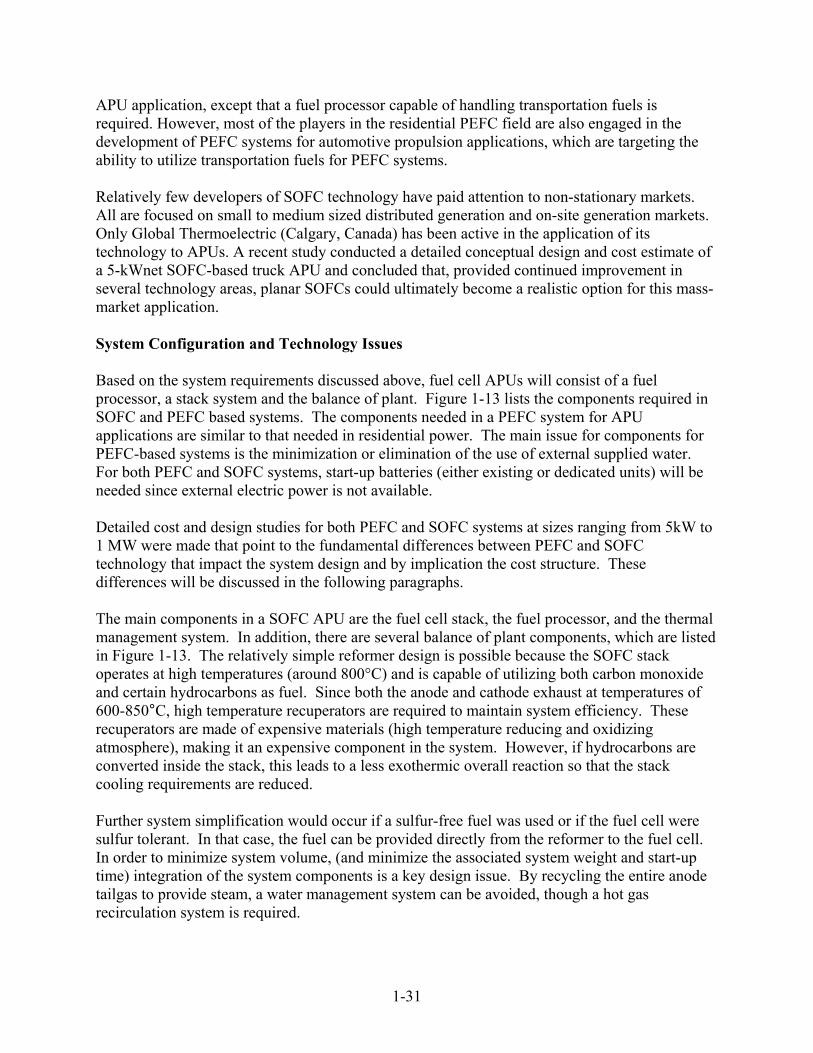
1-31
APU application, except that a fuel processor capable of handling transportation fuels is required. However, most of the players in the residential PEFC field are also engaged in the development of PEFC systems for automotive propulsion applications, which are targeting the ability to utilize transportation fuels for PEFC systems. Relatively few developers of SOFC technology have paid attention to non-stationary markets. All are focused on small to medium sized distributed generation and on-site generation markets. Only Global Thermoelectric (Calgary, Canada) has been active in the application of its technology to APUs. A recent study conducted a detailed conceptual design and cost estimate of a 5-kWnet SOFC-based truck APU and concluded that, provided continued improvement in several technology areas, planar SOFCs could ultimately become a realistic option for this mass-market application. System Configuration and Technology Issues Based on the system requirements discussed above, fuel cell APUs will consist of a fuel processor, a stack system and the balance of plant. Figure 1-13 lists the components required in SOFC and PEFC based systems. The components needed in a PEFC system for APU applications are similar to that needed in residential power. The main issue for components for PEFC-based systems is the minimization or elimination of the use of external supplied water. For both PEFC and SOFC systems, start-up batteries (either existing or dedicated units) will be needed since external electric power is not available. Detailed cost and design studies for both PEFC and SOFC systems at sizes ranging from 5kW to 1 MW were made that point to the fundamental differences between PEFC and SOFC technology that impact the system design and by implication the cost structure. These differences will be discussed in the following paragraphs. The main components in a SOFC APU are the fuel cell stack, the fuel processor, and the thermal management system. In addition, there are several balance of plant components, which are listed in Figure 1-13. The relatively simple reformer design is possible because the SOFC stack operates at high temperatures (around 800°C) and is capable of utilizing both carbon monoxide and certain hydrocarbons as fuel. Since both the anode and cathode exhaust at temperatures of 600-850°C, high temperature recuperators are required to maintain system efficiency. These recuperators are made of expensive materials (high temperature reducing and oxidizing atmosphere), making it an expensive component in the system. However, if hydrocarbons are converted inside the stack, this leads to a less exothermic overall reaction so that the stack cooling requirements are reduced. Further system simplification would occur if a sulfur-free fuel was used or if the fuel cell were sulfur tolerant. In that case, the fuel can be provided directly from the reformer to the fuel cell. In order to minimize system volume, (and minimize the associated system weight and start-up time) integration of the system components is a key design issue. By recycling the entire anode tailgas to provide steam, a water management system can be avoided, though a hot gas recirculation system is required.
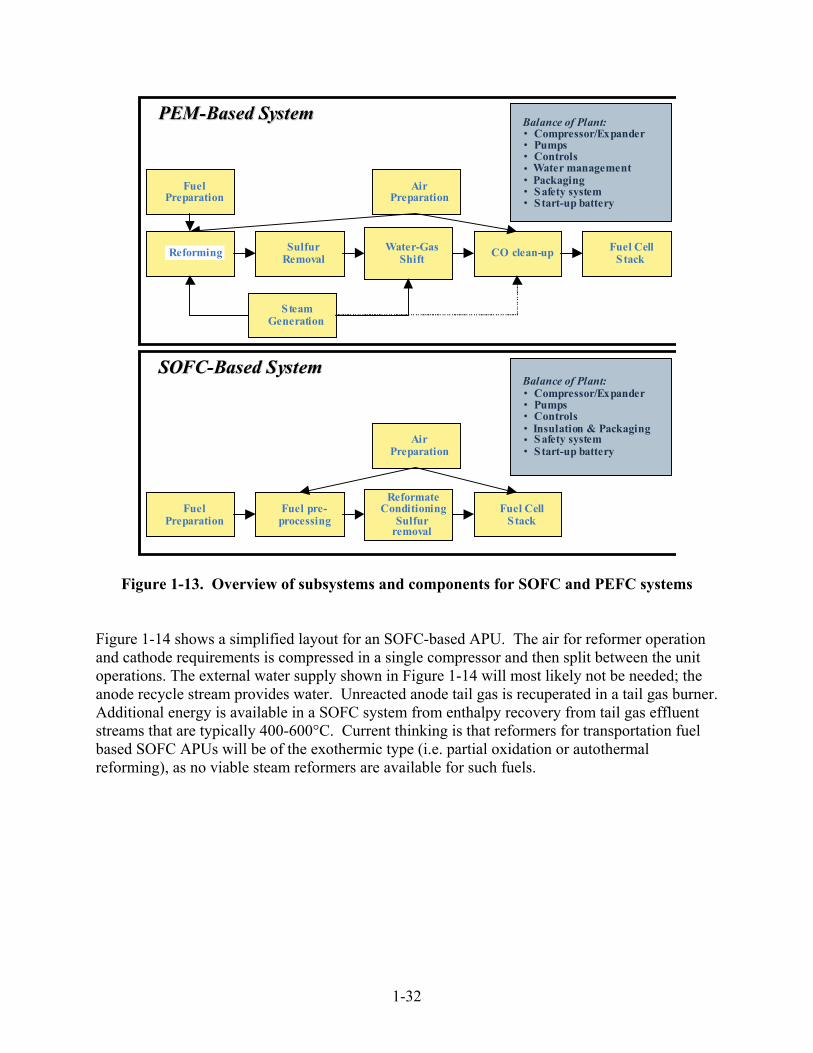
1-32
SOFC-Based System SOFC-Based System
Fuel Preparation
Fuel pre- processing
Reformate Conditioning
Sulfur removal
Fuel Cell Stack
Air Preparation
Balance of Plant: • Compressor/Expander • Pumps • Controls • Insulation & Packaging • Safety system • Start-up battery
PEM-Based System PEM-Based System
Fuel Preparation
Sulfur Removal
Water-Gas Shift CO clean-up Fuel Cell
Stack
Steam Generation
Air Preparation
Balance of Plant: • Compressor/Expander • Pumps • Controls • Water management • Packaging • Safety system • Start-up battery
Reforming
Figure 1-13. Overview of subsystems and components for SOFC and PEFC systems Figure 1-14 shows a simplified layout for an SOFC-based APU. The air for reformer operation and cathode requirements is compressed in a single compressor and then split between the unit operations. The external water supply shown in Figure 1-14 will most likely not be needed; the anode recycle stream provides water. Unreacted anode tail gas is recuperated in a tail gas burner. Additional energy is available in a SOFC system from enthalpy recovery from tail gas effluent streams that are typically 400-600°C. Current thinking is that reformers for transportation fuel based SOFC APUs will be of the exothermic type (i.e. partial oxidation or autothermal reforming), as no viable steam reformers are available for such fuels.
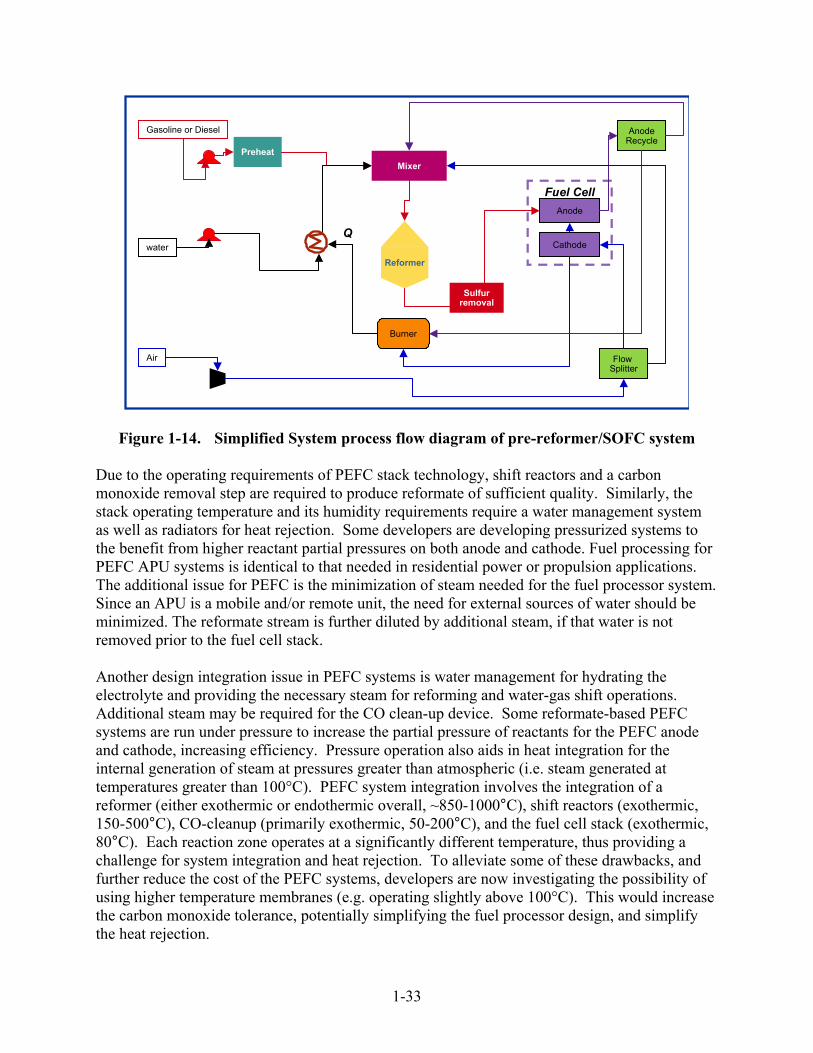
1-33
Fuel Cell
Reformer
Mixer
Gasoline or Diesel
Preheat
Air
water
Anode
Cathode
Burner
AnodeRecycle
Sulfurremoval
Q
Flow Splitter
Figure 1-14. Simplified System process flow diagram of pre-reformer/SOFC system Due to the operating requirements of PEFC stack technology, shift reactors and a carbon monoxide removal step are required to produce reformate of sufficient quality. Similarly, the stack operating temperature and its humidity requirements require a water management system as well as radiators for heat rejection. Some developers are developing pressurized systems to the benefit from higher reactant partial pressures on both anode and cathode. Fuel processing for PEFC APU systems is identical to that needed in residential power or propulsion applications. The additional issue for PEFC is the minimization of steam needed for the fuel processor system. Since an APU is a mobile and/or remote unit, the need for external sources of water should be minimized. The reformate stream is further diluted by additional steam, if that water is not removed prior to the fuel cell stack. Another design integration issue in PEFC systems is water management for hydrating the electrolyte and providing the necessary steam for reforming and water-gas shift operations. Additional steam may be required for the CO clean-up device. Some reformate-based PEFC systems are run under pressure to increase the partial pressure of reactants for the PEFC anode and cathode, increasing efficiency. Pressure operation also aids in heat integration for the internal generation of steam at pressures greater than atmospheric (i.e. steam generated at temperatures greater than 100°C). PEFC system integration involves the integration of a reformer (either exothermic or endothermic overall, ~850-1000°C), shift reactors (exothermic, 150-500°C), CO-cleanup (primarily exothermic, 50-200°C), and the fuel cell stack (exothermic, 80°C). Each reaction zone operates at a significantly different temperature, thus providing a challenge for system integration and heat rejection. To alleviate some of these drawbacks, and further reduce the cost of the PEFC systems, developers are now investigating the possibility of using higher temperature membranes (e.g. operating slightly above 100°C). This would increase the carbon monoxide tolerance, potentially simplifying the fuel processor design, and simplify the heat rejection.

1-34
The power requirements for auxiliary power applications require smaller fuel cell stack duties. The heat losses for a SOFC stack operating at a smaller power duty are a larger proportion of the gross rating than in a stationary power application. Insulation, required for specified system skin temperature requirements, could conceivably result in a large proportion of the total system volume. Integration of the high temperature components is important in order to reduce the system volume and insulation requirements. SOFC APU systems will require inexpensive high performance insulation materials to decrease both system volume and cost. System Cost Considerations As for any new class of product, total cost of ownership and operation of fuel cells will be a critical factor in their commercialization, along with the offered functionality and performance. This total cost of ownership typically has several components for power systems such as fuel cells. These components include fuel cost, other operating costs such as maintenance cost, and the first cost of the equipment. This first cost has a significant impact on fuel cells’ competitiveness. The main component of a fuel cell’s first cost is the manufacturing cost, which is strongly related to the physical configuration and embodiment of the system, as well as to the manufacturing methods used. System configuration and design in turn are directly related to the desired system functionality and performance, while the manufacturing methods used are strongly linked to the anticipated production volume. Arthur D. Little has carried out cost structure studies for a variety of fuel cell technologies for a wide range of applications, including SOFC tubular, planar, and PEFC technologies. Because phenomena at many levels of abstraction have a significant impact on performance and cost, they have developed a multi-level system performance and cost modeling approach (see Figure 1-15). At the most elementary level, it includes fundamental chemical reaction/reactor models for the fuel processor and fuel cell as one-dimensional systems.
Reformer model
M
O
M
O
C3H7 H
C3H8
ManufacturingCost Model
Fuel Cell Model
0.4
0.5
0.6
0.7
0.8
0.9
1
cell
pote
ntia
l (V)
0 0.2 0.4 0.6 0.8 1 1.2 1.4 current density (A/cm²)
NG2000 H2 NG3000 H2 NG2000 ref NG3000 ref
Thermodynamic System Model
ConceptualDesign and
Configuration
46"60"
53"
12
4
5
6 7
8
9
10
11
12
13
15
14
Illustra
tive
Tape Cast
AnodePowder Prep
VacuumPlasmaSpray
ElectrolyteSmall Powder
Prep
ScreenPrint
CathodeSmall Powder
Prep
Sinter in Air1400C Sinter in Air
Formingof
Interconnect
ShearInterconnect
VacuumPlasmaSpray
SlurrySpray
ScreenPrint
Slurry Spray
Slip Cast
Finish Edges
Note: Alternative production processes appear in gray to thebottom of actual production processes assumed
BrazePaint Braze
ontoInterconnect
Blanking /Slicing
QC LeakCheck
Interconnect
Fabrication
Electrolyte CathodeAnode
Stack Assembly
$/kW Figure 1-15 Multilevel system modeling approach.
Each of the detailed sub-models feed into the thermodynamic system model, and provides sizing information directly to the conceptual design and configuration. The thermodynamic system
1-35
model provides a technical hub for the multi-level approach. It provides inputs on the required flow rates and heat duties in the system. Sizing information, together with information from the thermodynamic model then flows to the conceptual design. SOFC System Cost Structure The main difference in SOFC stack cost structure as compared to PEFC cost relates to the simpler system configuration of the SOFC-based system. This is mainly due to the fact that SOFC stacks do not contain the type of high-cost precious metals that PEFCs contain. This is off-set in part by the relatively complex manufacturing process required for the manufacture of the SOFC electrode electrolyte plates and by the somewhat lower power density in SOFC systems. Low temperature operation (enabled with electrode supported planar configuration) enables the use of low cost metallic interconnects which can be manufactured with conventional metal forming operations. The balance of plant contains all the direct stack support systems, reformer, compressors, pumps, and the recuperating heat exchangers. Its cost is low by comparison to the PEFC because of the simplicity of the reformer. However, the cost of the recuperating heat exchangers partially offsets that. To provide some perspective on the viability of SOFCs in APU applications from a cost perspective, NETL sponsored an estimate of the cost structure of small-scale (5 kW), simple-cycle SOFC anode-supported system, operated on gasoline. The estimated manufacturing cost for such systems (see Figure 1-16) could well be close to that estimated for comparable PEFC systems, while providing somewhat higher system efficiency. While the stack, insulation and stack balance in this simple-cycle system is a key component, the balance of plant is also an important factor. The stack cost again mainly depends on the achievable power density. Small systems like these will likely not be operated under high pressure. While this simplifies the design and reduces cost for compressors and expanders (which are not readily available at low cost for this size range in any case) it might also negatively affect the power density achievable. One of the key challenges with small-scale SOFC systems is to overcome heat losses. The higher the heat losses are, the more recuperation is required to maintain the fuel cell within an acceptable operating temperature range and hence to ensure good performance. The large fraction of cost related to balance of plant issues is mainly due to the very small scale of this system, which results in a significant reverse economy of scale. While design work is still ongoing, it is anticipated that the cost structure of this system will change rapidly to reduce the cost of balance of plant further, and further improve the competitiveness of these systems.
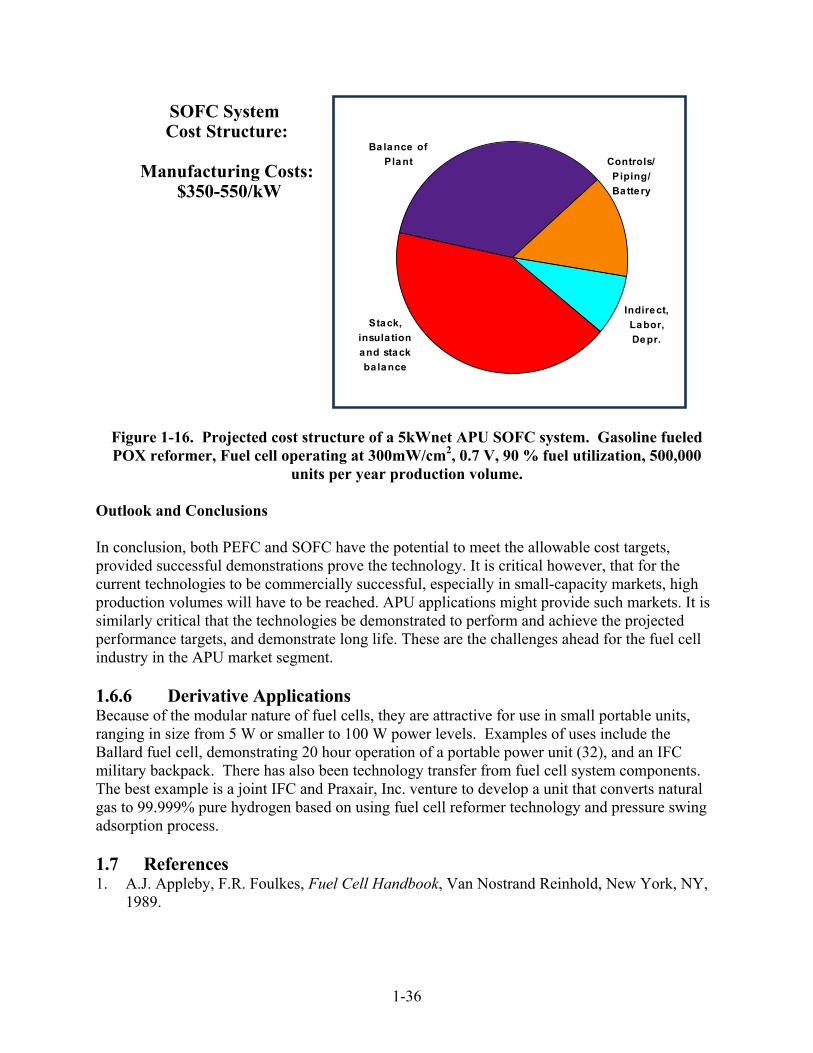
1-36
Controls/ Piping/ Battery
Indirect, Labor, Depr.
Ba lance of Plant
Stack, insula tion and stack ba lance
SOFC System Cost Structure:
Manufacturing Costs: $350-550/kW
Figure 1-16. Projected cost structure of a 5kWnet APU SOFC system. Gasoline fueled POX reformer, Fuel cell operating at 300mW/cm2, 0.7 V, 90 % fuel utilization, 500,000
units per year production volume. Outlook and Conclusions In conclusion, both PEFC and SOFC have the potential to meet the allowable cost targets, provided successful demonstrations prove the technology. It is critical however, that for the current technologies to be commercially successful, especially in small-capacity markets, high production volumes will have to be reached. APU applications might provide such markets. It is similarly critical that the technologies be demonstrated to perform and achieve the projected performance targets, and demonstrate long life. These are the challenges ahead for the fuel cell industry in the APU market segment. 1.6.6 Derivative Applications Because of the modular nature of fuel cells, they are attractive for use in small portable units, ranging in size from 5 W or smaller to 100 W power levels. Examples of uses include the Ballard fuel cell, demonstrating 20 hour operation of a portable power unit (32), and an IFC military backpack. There has also been technology transfer from fuel cell system components. The best example is a joint IFC and Praxair, Inc. venture to develop a unit that converts natural gas to 99.999% pure hydrogen based on using fuel cell reformer technology and pressure swing adsorption process. 1.7 References 1. A.J. Appleby, F.R. Foulkes, Fuel Cell Handbook, Van Nostrand Reinhold, New York, NY,
1989.
1-37
2. Report of the DOE Advanced Fuel-Cell Commercialization Working Group, Edited by S.S. Penner, DOE/ER/0643, prepared by the DOE Advanced Fuel Cell Working Group (AFC2WG) or the United States Department of Energy under Contract No. DEFG03-93ER30213, March 1995.
3. K. Kordesch, J. Gsellmann, S. Jahangir, M. Schautz, in Proceedings of the Symposium on Porous Electrodes: Theory and Practice, Edited by H.C. Maru, T. Katan, M.G. Klein, The Electrochemical Society, Inc., Pennington, NJ, p. 163, 1984.
4. A. Pigeaud, H.C. Maru, L. Paetsch, J. Doyon, R. Bernard, in Proceedings of the Symposium on Porous Electrodes: Theory and Practice, Edited by H.C. Maru, T. Katan, M.G. Klein, The Electrochemical Society, Inc., Pennington, NJ, p. 234, 1984.
5. J.M. King, N. Ishikawa, "Phosphoric Acid Fuel Cell Power Plant Improvements and Commercial Fleet Experience," Nov. 96 Fuel Cell Seminar.
6. www.utcfuelcells.com. 7. Communications with IFC, August 24, 2000. 8. K. Yokota, et al., "GOI 11 MW FC Plant Operation Interim Report," in Fuel Cell Program
and Abstracts, 1992 Fuel Cell Seminar, Tucson, AZ, November 29-December 2, 1992. 9. ONSI Press Release, "Fuel Cell Sets World Record; Runs 9,500 Hours Nonstop," May 20,
1997. 10. Northeast Utilities System Press Release, "Converting Landfill Gas into Electricity is an
Environmental Plus," June 24, 1996. 11. "Groton’s Tidy Machine," Public Power, March-April 1997. 12. ONSI Press Release, "World’s First Hydrogen Fueled Fuel Cell Begins Operation in
Hamburg, Germany," November 7, 1997. 13. "Anaerobic Gas Fuel Cell Shows Promise," Modern Power Systems, June 1997. 14. E.W. Hall, W.C. Riley, G.J. Sandelli, "PC25 Product and Manufacturing Experience,"
IFC, Fuel Cell Seminar, November 1996. 15. www.ballard.com, 1998. 16. www.fuelcellenergy.com. 17. Information supplied by ERC for the Fuel Cell Handbook. 18. M.M. Piwetz, J.S. Larsen, T.S. Christensen, "Hydrodesulfurization and Pre-reforming of
Logistic Fuels for Use in Fuel Cell Applications," Fuel Cell Seminar Program and Abstracts, Courtesy Associates, Inc., November 1996.
19. Westinghouse Electric Corporation, Bechtel Group, Inc., "Solid Oxide Fuel Cell Repowering of Highgrove Station Unit 1, Final Report," prepared for Southern California Edison Research Center, March 1992.
20. ERC, "Effects of Coal-Derived Trace Species on the Performance of Molten Carbonate Fuel Cells," topical report prepared for U.S. DOE/METC, DOE/MC/25009-T26, October 1991.
21. N. Maskalick, "Contaminant Effects in Solid Oxide Fuel Cells," in Agenda and Abstracts, Joint Contractors Meeting, Fuel Cells and Coal-Fired Heat Engines Conference, U.S. DOE/METC, August 3-5, 1993.
22. D.M. Rastler, C. Keeler, C.V. Chang, "Demonstration of a Carbonate on Coal Derived Gas," Report 15, in An EPRI/GRI Fuel Cell Workshop on Technology Research and Development. Stonehart Associates, Madison, CT, 1993.
23. Distributed Generation, Securing America’s Future with Reliable, Flexible Power,” U.S. Department of Energy, Office of Fossil Energy, National Energy Technology Center, October 1999.

1-38
24. U. S. Department of Energy’s Office of Energy Efficiency and Renewable Energy webpage, http://www.eren.doe.gov/distributedpower Giovando, CarolAnn, “Distributed resources carve out a niche in competitive markets,” Power, July/August 2000, pp. 46 – 57.
25. K.V. Kordesch, "City Car with H2-Air Fuel Cell and Lead Battery," 6th Intersociety Energy Conversion Engineering Conference, SAE Paper No. 719015, 1971.
26. A. Kaufman, "Phosphoric Acid Fuel Cell Bus Development," Proceedings of the Annual Automotive Technology Development Contractors' Coordination Meeting, Dearborn, MI, October 24-27, 1994, SAE Proceedings Volume P-289, pp. 289-293, 1995.
27. R.R. Wimmer, "Fuel Cell Transit Bus Testing & Development at Georgetown University," Proceedings of the Thirty Second Intersociety Energy Conversion Engineering Conference, July 27-August 1, 1997, Honolulu, HI, pp. 825-830, 1997.
28. N.C. Otto, P.F. Howard, "Transportation Engine Commercialization at Ballard Power Systems," Program and Abstracts 1996 Fuel Cell Seminar, November 17-20, 1996, Orlando, FL, pp. 559-562.
29. F. Panik, "Fuel Cells for Vehicle Application in Cars - Bringing the Future Closer," J. Power Sources, 71, 36-38, 1998.
30. S. Kawatsu, "Advanced PEFC Development for Fuel Cell Powered Vehicles," J. Power Sources, 71, 150-155, 1998.
31. Fuel-Cell Technology: Powering the Future, Electric Line, November/December 1996. 32. M. Graham, F. Barbir, F. Marken, M. Nadal, "Fuel Cell Power System for Utility Vehicle,"
Program and Abstracts 1996 Fuel Cell Seminar, November 17-20, 1996, Orlando, FL, pp. 571-574.
33. P.A. Lehman, C.E. Chamberlin, "Design and Performance of a Prototype Fuel Cell Powered Vehicle," Program and Abstracts 1996 Fuel Cell Seminar, November 17-20, 1996, Orlando, FL, pp. 567-570.
34. J. Leslie, "Dawn of the Hydrogen Age," Wired (magazine), October 1997
2-1
2. FUEL CELL PERFORMANCE
The purpose of this section is to describe the chemical and thermodynamic operation of fuel cells, i.e., how operating conditions affect the performance of fuel cells. The impact of variables such as temperature, pressure, and gas constituents on fuel cell performance must be assessed to predict how the cells operate to produce power. Understanding the impacts of these variables allows fuel cell developers to optimize their design of the modular units, and it allows process engineers to maximize the performance of systems applications. A logical first step in understanding the operation of a fuel cell is to define its ideal performance. Once the ideal performance is determined, parasitic losses can be calculated and then deducted from the ideal performance to describe the actual operation. 2.1 Gibbs Free Energy and Nernst Potential Total energy is composed of two types of energy: 1) free energy, G and 2) unavailable energy, TS. Free energy earns its name because it is energy that is available (or free) for conversion into usable work. The unavailable energy is lost due to the increased disorder, or entropy, of the system. The maximum electrical work (Wel) obtainable in a fuel cell operating at constant temperature and pressure is given by the change in (Gibbs) free energy (∆G) of the electrochemical reaction:
elW = G = n E∆ − F (2-1)
where n is the number of electrons participating in the reaction, F is Faraday's constant (96,487 coulombs/g-mole electron), and E is the ideal potential of the cell. For reactants and products in their standard states, then
°−°∆ EFn = G (2-2)
where the superscript represents standard state conditions (25°C or 298°K and 1 atm).

2-2
For a fuel cell, the maximum work available is related to the free energy of reaction, whereas the enthalpy (heat) of reaction is the pertinent quantity in the case of thermal conversion (such as a heat engine). For the state function
ST H G ∆−∆=∆ (2-3)
the difference between ∆G and ∆H is proportional to the change in entropy (∆S). The maximum amount of electrical energy available is ∆G, as mentioned above, and the total thermal energy available is ∆H. The amount of heat that is produced by a fuel cell operating reversibly is T∆S. Reactions in fuel cells that have negative entropy change generate heat, while those with positive entropy change may extract heat from their surroundings if the irreversible generation of heat is smaller than the reversible absorption of heat. The reversible potential of a fuel cell at temperature T is calculated from ∆G for the cell reaction at that temperature. This potential can be computed from the heat capacities (Cp) of the species involved as a function of T and from values of both ∆S° and ∆H° at the reference temperature, usually 298K. Empirically, the heat capacity of a species, as a function of T, can be expressed as
p2C = a + bT + cT (2-4)
where a, b, and c are empirical constants. The specific enthalpy for any species present during the reaction is given by
οii HH ∆= + dTC ip
T298∫ (2-5)
and, at constant pressure
+∆= οii SS dT
TC ipT
298∫ (2-6)
then it follows that
∑∑ −=∆i
iioutii
i HnHnH in (2-7)
and
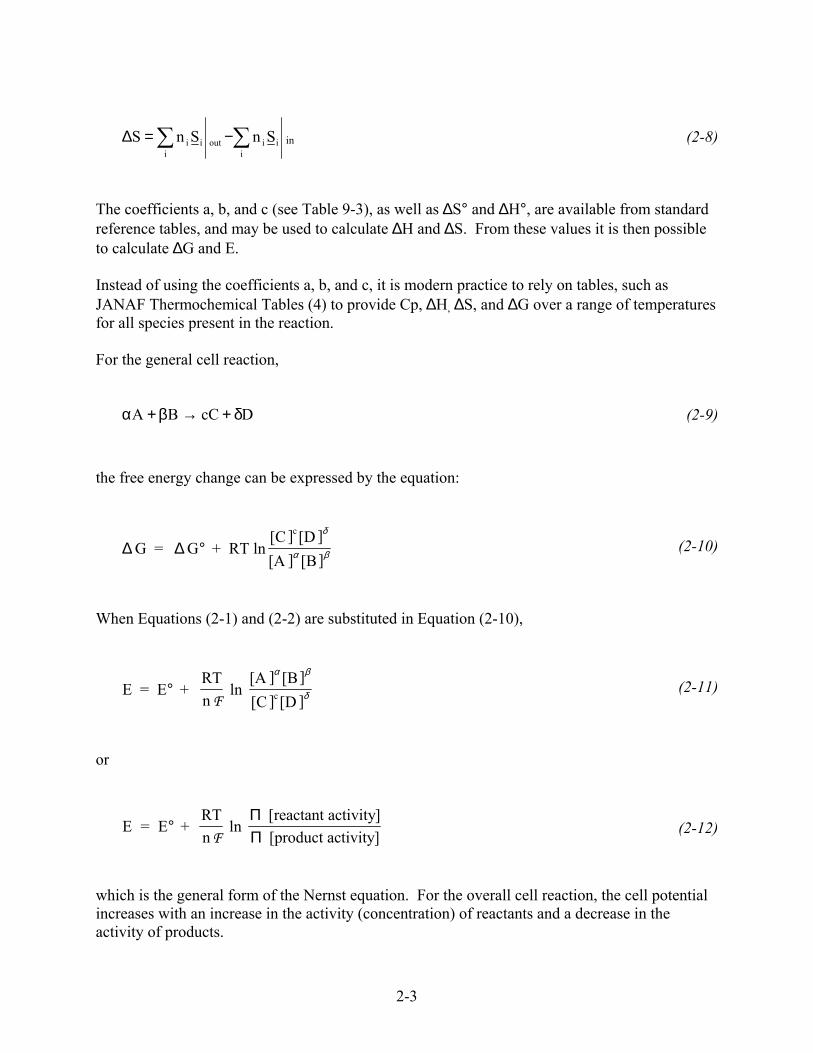
2-3
∑∑ −=∆i
iioutii
i SnSnS in (2-8)
The coefficients a, b, and c (see Table 9-3), as well as ∆S° and ∆H°, are available from standard reference tables, and may be used to calculate ∆H and ∆S. From these values it is then possible to calculate ∆G and E. Instead of using the coefficients a, b, and c, it is modern practice to rely on tables, such as JANAF Thermochemical Tables (4) to provide Cp, ∆H, ∆S, and ∆G over a range of temperatures for all species present in the reaction. For the general cell reaction,
DCcBA δ+→β+α (2-9)
the free energy change can be expressed by the equation:
∆ ∆G = G + RT ln[C ] [D ][A ] [B]
c
°δ
α β (2-10)
When Equations (2-1) and (2-2) are substituted in Equation (2-10),
E = E + RTn
ln [A ] [B][C ] [D ]c°
F
α β
δ (2-11)
or
E = E + RTn
ln [reactant activity] [product activity]
°F
ΠΠ
(2-12)
which is the general form of the Nernst equation. For the overall cell reaction, the cell potential increases with an increase in the activity (concentration) of reactants and a decrease in the activity of products.
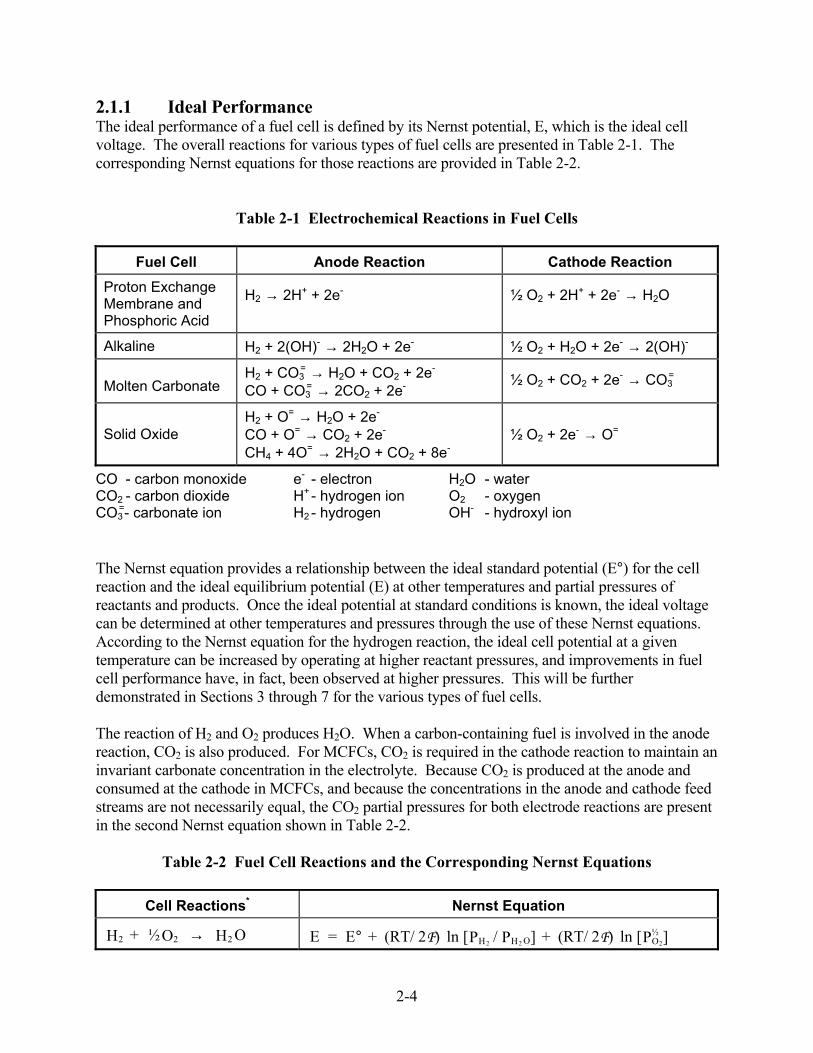
2-4
2.1.1 Ideal Performance The ideal performance of a fuel cell is defined by its Nernst potential, E, which is the ideal cell voltage. The overall reactions for various types of fuel cells are presented in Table 2-1. The corresponding Nernst equations for those reactions are provided in Table 2-2.
Table 2-1 Electrochemical Reactions in Fuel Cells
Fuel Cell Anode Reaction Cathode Reaction Proton Exchange Membrane and Phosphoric Acid
H2 → 2H+ + 2e- ½ O2 + 2H+ + 2e- → H2O
Alkaline H2 + 2(OH)- → 2H2O + 2e- ½ O2 + H2O + 2e- → 2(OH)-
Molten Carbonate H2 + CO3
= → H2O + CO2 + 2e- CO + CO3
= → 2CO2 + 2e- ½ O2 + CO2 + 2e- → CO3
=
Solid Oxide H2 + O= → H2O + 2e- CO + O= → CO2 + 2e- CH4 + 4O= → 2H2O + CO2 + 8e-
½ O2 + 2e- → O=
CO - carbon monoxide e- - electron H2O - water CO2 - carbon dioxide H+ - hydrogen ion O2 - oxygen CO3
=- carbonate ion H2 - hydrogen OH- - hydroxyl ion The Nernst equation provides a relationship between the ideal standard potential (E°) for the cell reaction and the ideal equilibrium potential (E) at other temperatures and partial pressures of reactants and products. Once the ideal potential at standard conditions is known, the ideal voltage can be determined at other temperatures and pressures through the use of these Nernst equations. According to the Nernst equation for the hydrogen reaction, the ideal cell potential at a given temperature can be increased by operating at higher reactant pressures, and improvements in fuel cell performance have, in fact, been observed at higher pressures. This will be further demonstrated in Sections 3 through 7 for the various types of fuel cells. The reaction of H2 and O2 produces H2O. When a carbon-containing fuel is involved in the anode reaction, CO2 is also produced. For MCFCs, CO2 is required in the cathode reaction to maintain an invariant carbonate concentration in the electrolyte. Because CO2 is produced at the anode and consumed at the cathode in MCFCs, and because the concentrations in the anode and cathode feed streams are not necessarily equal, the CO2 partial pressures for both electrode reactions are present in the second Nernst equation shown in Table 2-2.
Table 2-2 Fuel Cell Reactions and the Corresponding Nernst Equations
Cell Reactions* Nernst Equation
2 2 2H + O H O½ → E = E + (RT/ 2 ) ln [P / P ] + (RT/ 2 ) ln [P ]2 2 2H H O O° F F ½
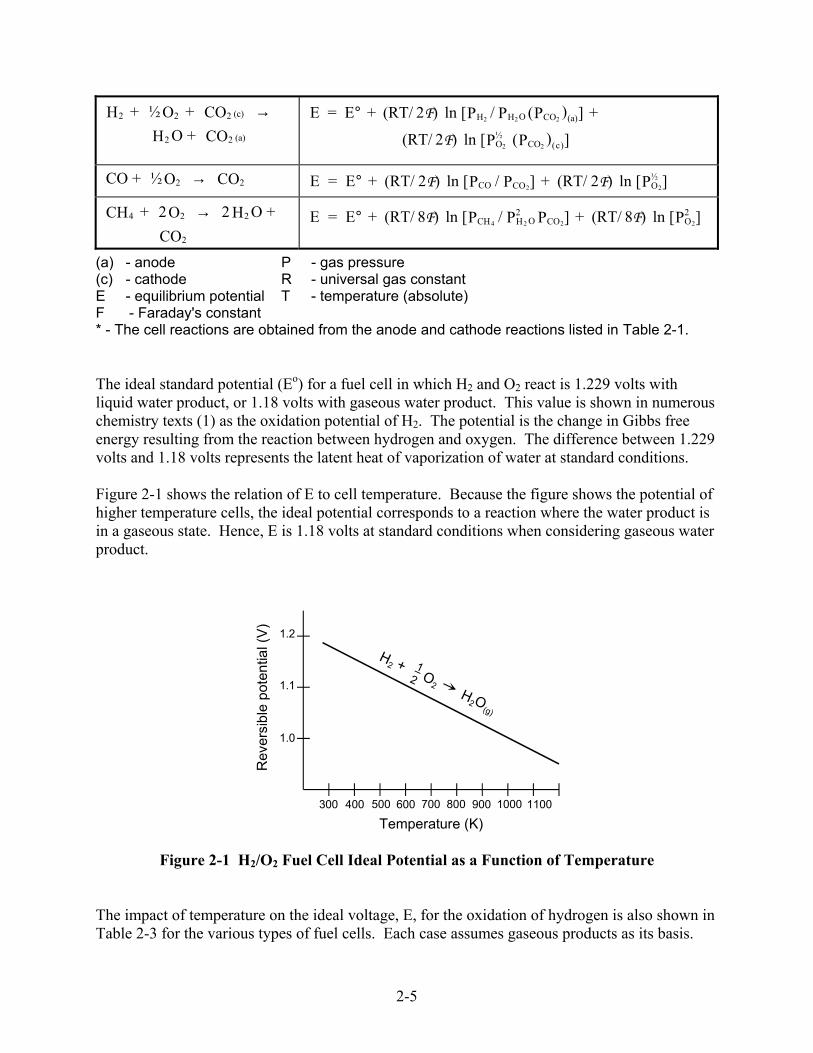
2-5
2 2 2 (c)
2 2 (a)
H + O + CO H O + CO
½ →
E = E + (RT/ 2 ) ln [P / P (P ) ] +
(RT/ 2 ) ln [P (P ) ]2 2 2
2 2
H H O CO (a)
O CO ( )
° F
F ½c
CO + O CO2 2½ → E = E + (RT/ 2 ) ln [P / P ] + (RT/ 2 ) ln [P ]CO CO O2 2° F F ½
4 2 2
2
CH + 2O 2 H O + CO
→
E = E + (RT/ 8 ) ln [P / P P ] + (RT/ 8 ) ln [P ]4 2 2 2CH H O2
CO O2° F F
(a) - anode P - gas pressure (c) - cathode R - universal gas constant E - equilibrium potential T - temperature (absolute) F - Faraday's constant * - The cell reactions are obtained from the anode and cathode reactions listed in Table 2-1. The ideal standard potential (Eo) for a fuel cell in which H2 and O2 react is 1.229 volts with liquid water product, or 1.18 volts with gaseous water product. This value is shown in numerous chemistry texts (1) as the oxidation potential of H2. The potential is the change in Gibbs free energy resulting from the reaction between hydrogen and oxygen. The difference between 1.229 volts and 1.18 volts represents the latent heat of vaporization of water at standard conditions. Figure 2-1 shows the relation of E to cell temperature. Because the figure shows the potential of higher temperature cells, the ideal potential corresponds to a reaction where the water product is in a gaseous state. Hence, E is 1.18 volts at standard conditions when considering gaseous water product.
1.0
1.1
1.2
Rev
ersi
ble
pote
ntia
l (V)
300 400 500 600 700 800 900 1000 1100
Temperature (K)
H2 + 1
2 O2
H2O
(g)
Figure 2-1 H2/O2 Fuel Cell Ideal Potential as a Function of Temperature The impact of temperature on the ideal voltage, E, for the oxidation of hydrogen is also shown in Table 2-3 for the various types of fuel cells. Each case assumes gaseous products as its basis.
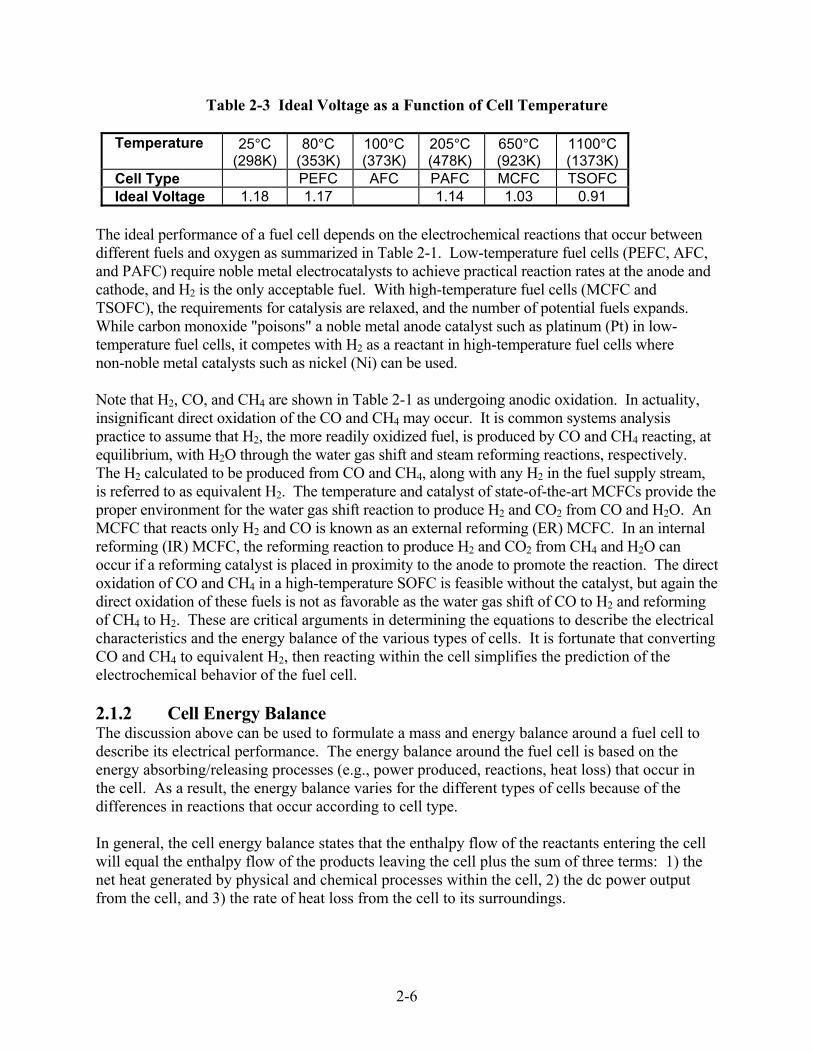
2-6
Table 2-3 Ideal Voltage as a Function of Cell Temperature
Temperature 25°C (298K)
80°C (353K)
100°C (373K)
205°C (478K)
650°C (923K)
1100°C (1373K)
Cell Type PEFC AFC PAFC MCFC TSOFC Ideal Voltage 1.18 1.17 1.14 1.03 0.91
The ideal performance of a fuel cell depends on the electrochemical reactions that occur between different fuels and oxygen as summarized in Table 2-1. Low-temperature fuel cells (PEFC, AFC, and PAFC) require noble metal electrocatalysts to achieve practical reaction rates at the anode and cathode, and H2 is the only acceptable fuel. With high-temperature fuel cells (MCFC and TSOFC), the requirements for catalysis are relaxed, and the number of potential fuels expands. While carbon monoxide "poisons" a noble metal anode catalyst such as platinum (Pt) in low-temperature fuel cells, it competes with H2 as a reactant in high-temperature fuel cells where non-noble metal catalysts such as nickel (Ni) can be used. Note that H2, CO, and CH4 are shown in Table 2-1 as undergoing anodic oxidation. In actuality, insignificant direct oxidation of the CO and CH4 may occur. It is common systems analysis practice to assume that H2, the more readily oxidized fuel, is produced by CO and CH4 reacting, at equilibrium, with H2O through the water gas shift and steam reforming reactions, respectively. The H2 calculated to be produced from CO and CH4, along with any H2 in the fuel supply stream, is referred to as equivalent H2. The temperature and catalyst of state-of-the-art MCFCs provide the proper environment for the water gas shift reaction to produce H2 and CO2 from CO and H2O. An MCFC that reacts only H2 and CO is known as an external reforming (ER) MCFC. In an internal reforming (IR) MCFC, the reforming reaction to produce H2 and CO2 from CH4 and H2O can occur if a reforming catalyst is placed in proximity to the anode to promote the reaction. The direct oxidation of CO and CH4 in a high-temperature SOFC is feasible without the catalyst, but again the direct oxidation of these fuels is not as favorable as the water gas shift of CO to H2 and reforming of CH4 to H2. These are critical arguments in determining the equations to describe the electrical characteristics and the energy balance of the various types of cells. It is fortunate that converting CO and CH4 to equivalent H2, then reacting within the cell simplifies the prediction of the electrochemical behavior of the fuel cell. 2.1.2 Cell Energy Balance The discussion above can be used to formulate a mass and energy balance around a fuel cell to describe its electrical performance. The energy balance around the fuel cell is based on the energy absorbing/releasing processes (e.g., power produced, reactions, heat loss) that occur in the cell. As a result, the energy balance varies for the different types of cells because of the differences in reactions that occur according to cell type. In general, the cell energy balance states that the enthalpy flow of the reactants entering the cell will equal the enthalpy flow of the products leaving the cell plus the sum of three terms: 1) the net heat generated by physical and chemical processes within the cell, 2) the dc power output from the cell, and 3) the rate of heat loss from the cell to its surroundings.
2-7
Component enthalpies are readily available on a per mass basis from data tables such as JANAF (4). Product enthalpy usually includes the heat of formation in published tables. A typical energy balance determines the cell exit temperature knowing the reactant composition, the feed stream temperatures, H2 and O2 utilization, the expected power produced, and a percent heat loss. The exit constituents are calculated from the fuel cell reactions as illustrated in Example 9-3, Section 9. 2.1.3 Cell Efficiency The thermal efficiency of an energy conversion device is defined as the amount of useful energy produced relative to the change in stored chemical energy (commonly referred to as thermal energy) that is released when a fuel reacts with an oxidant.
η = HEnergy Useful
∆ (2-13)
Hydrogen (a fuel) and oxygen (an oxidant) can exist in each other’s presence at room temperature, but given sufficient activation energy, they explode violently. This reaction occurs spontaneously at 580°C, but can be initiated below 580°C by providing a flame, such as in a heat engine. A catalyst and an electrolyte, such as in a fuel cell, can sustain reaction between H2 and O2 at temperatures lower than 580°C. Note that the rate of reaction is controlled and limited because the permeable electrolyte physically separates the fuel from the oxidant. The heat engine process is thermal; the fuel cell process is electrochemical. Differences in these two methods of producing useful energy are the reason for increased efficiency in the fuel cell. In the ideal case of an electrochemical converter, such as a fuel cell, the change in Gibbs free energy, ∆G, of the reaction is available as useful electric energy at the temperature of the conversion. The ideal efficiency of a fuel cell, operating reversibly, is then
η = ∆∆
GH
(2-14)
The most widely used efficiency of a fuel cell is based on the change in the standard free energy for the cell reaction
H2 + 1/2O2 → H2O(1) (2-15)
given by
2-8
οο
οολ
ο222
G21GGG H)(Hr −−=∆ ο
(2-16)
where the product water is in liquid form. At standard conditions of 25°C (298°K) and 1 atmosphere, the thermal energy ( H∆ ) in the hydrogen/oxygen reaction is 285.8 kJ/mole, and the free energy available for useful work is 237.1 kJ/mole. Thus, the thermal efficiency of an ideal fuel cell operating reversibly on pure hydrogen and oxygen at standard conditions would be: (2-17)
The efficiency of an actual fuel cell can be expressed in terms of the ratio of the operating cell voltage to the ideal cell voltage. The actual cell voltage is less than the ideal cell voltage because of losses associated with cell polarization and the iR loss, which will be discussed below. The thermal efficiency of the fuel cell can then be written in terms of the actual cell voltage:
η Useful Energy
HUseful Power
GVolts x Current
Volts x Current / 0.83(0.83)(V
Vactual
ideal
actual
ideal= = = =
∆ ∆( ))
/ .0 83 (2-18)
As mentioned previously, the ideal voltage of a cell operating reversibly on pure hydrogen and oxygen at 1 atm pressure and 25ºC is 1.229 V. Thus, the thermal efficiency of an actual fuel cell operating at a voltage of Vcell, based on the higher heating value of hydrogen, is given by
cellcell idealcellideal V x 675.0 229.1/V x 83.0 V/V x 83.0 ===η (2-19)
A fuel cell can be operated at different current densities, expressed as mA/cm2 or A/ft2. The corresponding cell voltage then determines the fuel cell efficiency. Decreasing the current density increases the cell voltage, thereby increasing the fuel cell efficiency. The trade-off is that as the current density is decreased, the active cell area must be increased to obtain the requisite amount of power. Thus, designing the fuel cell for higher efficiency increases the capital cost, but decreases the fuel cost. Two additional aspects of efficiency are of interest: 1) the effects of integrating a fuel cell into a complete system that accepts readily available fuels like natural gas and produces grid quality ac power (see Section 8), and 2) issues arising when comparing fuel cell efficiency with heat engine efficiency, which will be discussed next.
83.08.2851.237 ==idealη

2-9
2.1.4 Efficiency Comparison to Heat Engines If a fuel cell is compared to an equivalent efficiency heat engine, the fuel cell does not need to achieve the large temperature differential to achieve the same Carnot cycle efficiency as the heat engine (5). This is because of the added energy gained from Gibbs free energy as opposed to simply the thermal energy. The resulting freedom from large temperature differentials in the fuel cell provides a great benefit because it relaxes material temperature problems when trying to achieve comparable efficiency. 2.1.5 Actual Performance The actual cell potential is decreased from its equilibrium potential because of irreversible losses, as shown in Figure 2-22. Multiple phenomena contribute to irreversible losses in an actual fuel cell. The losses, which are called polarization, overpotential, or overvoltage (η), originate primarily from three sources: 1) activation polarization (ηact), 2) ohmic polarization (ηohm), and 3) concentration polarization (ηconc). These losses result in a cell voltage (V) that is less than its ideal potential, E (V = E - Losses).
Theoretical EMF or Ideal Voltage
Region of Activation Polarization(Reaction Rate Loss)
Total Loss
Current Density (mA/cm2)
0.5
0
1.0
Cel
l Vol
tage
Region of Ohmic Polarization(Resistance Loss)
Region ofConcentration Polarization
(Gas Transport Loss)
Operation Voltage, V, Curve
Figure 2-2 Ideal and Actual Fuel Cell Voltage/Current Characteristic The activation polarization loss is dominant at low current density. At this point, electronic barriers must be overcome prior to current and ion flow. Activation losses increase as current increases. Ohmic polarization (loss) varies directly with current, increasing over the entire range of current because cell resistance remains essentially constant. Gas transport losses occur over the entire range of current density, but these losses become prominent at high limiting currents where it becomes difficult to provide enough reactant flow to the cell reaction sites.
Activation Polarization: Activation polarization is present when the rate of an electrochemical reaction at an electrode surface is controlled by sluggish electrode kinetics. In other words, activation polarization is directly related to the rates of electrochemical reactions. There is a 2 Activation region and concentration region are more representative of low-temperature fuel cells.
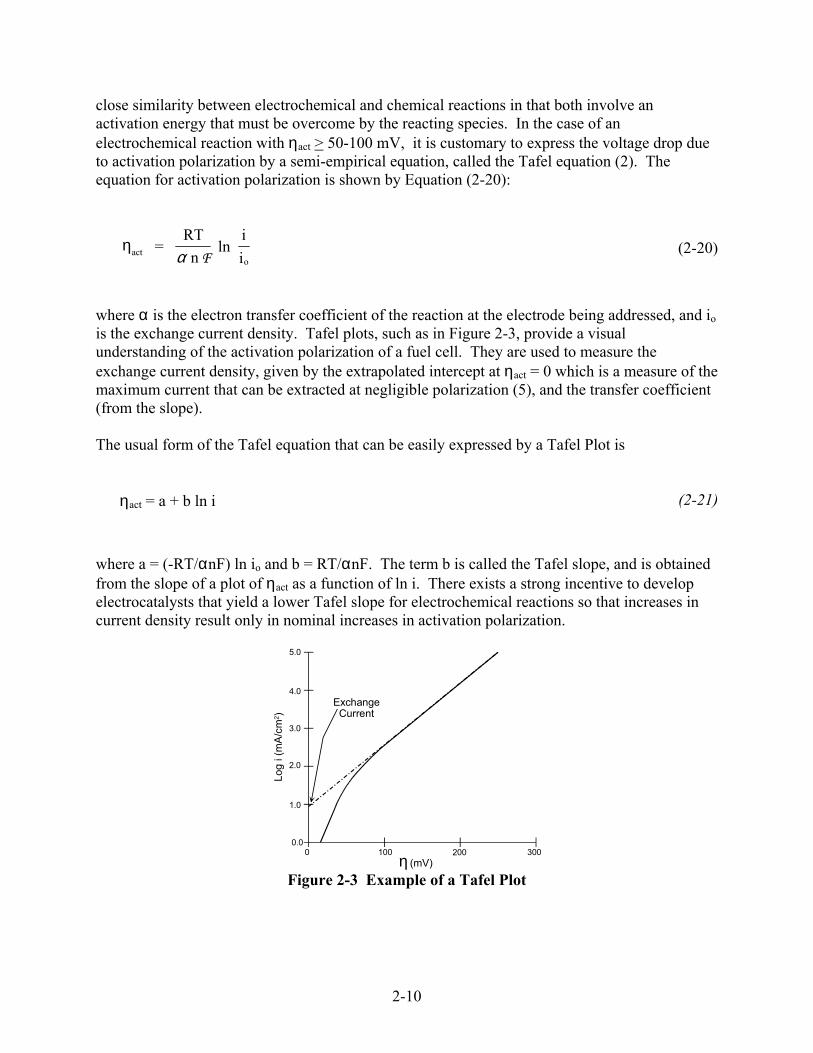
2-10
close similarity between electrochemical and chemical reactions in that both involve an activation energy that must be overcome by the reacting species. In the case of an electrochemical reaction with ηact > 50-100 mV, it is customary to express the voltage drop due to activation polarization by a semi-empirical equation, called the Tafel equation (2). The equation for activation polarization is shown by Equation (2-20):
acto
= RTn
ln ii
ηα F
(2-20)
where α is the electron transfer coefficient of the reaction at the electrode being addressed, and io is the exchange current density. Tafel plots, such as in Figure 2-3, provide a visual understanding of the activation polarization of a fuel cell. They are used to measure the exchange current density, given by the extrapolated intercept at ηact = 0 which is a measure of the maximum current that can be extracted at negligible polarization (5), and the transfer coefficient (from the slope). The usual form of the Tafel equation that can be easily expressed by a Tafel Plot is
ηact = a + b ln i (2-21)
where a = (-RT/αnF) ln io and b = RT/αnF. The term b is called the Tafel slope, and is obtained from the slope of a plot of ηact as a function of ln i. There exists a strong incentive to develop electrocatalysts that yield a lower Tafel slope for electrochemical reactions so that increases in current density result only in nominal increases in activation polarization.
5.0
4.0
3.0
2.0
1.0
0.00 100 200 300
(mV)
Log
i (m
A/cm
2 )
η
ExchangeCurrent
Figure 2-3 Example of a Tafel Plot
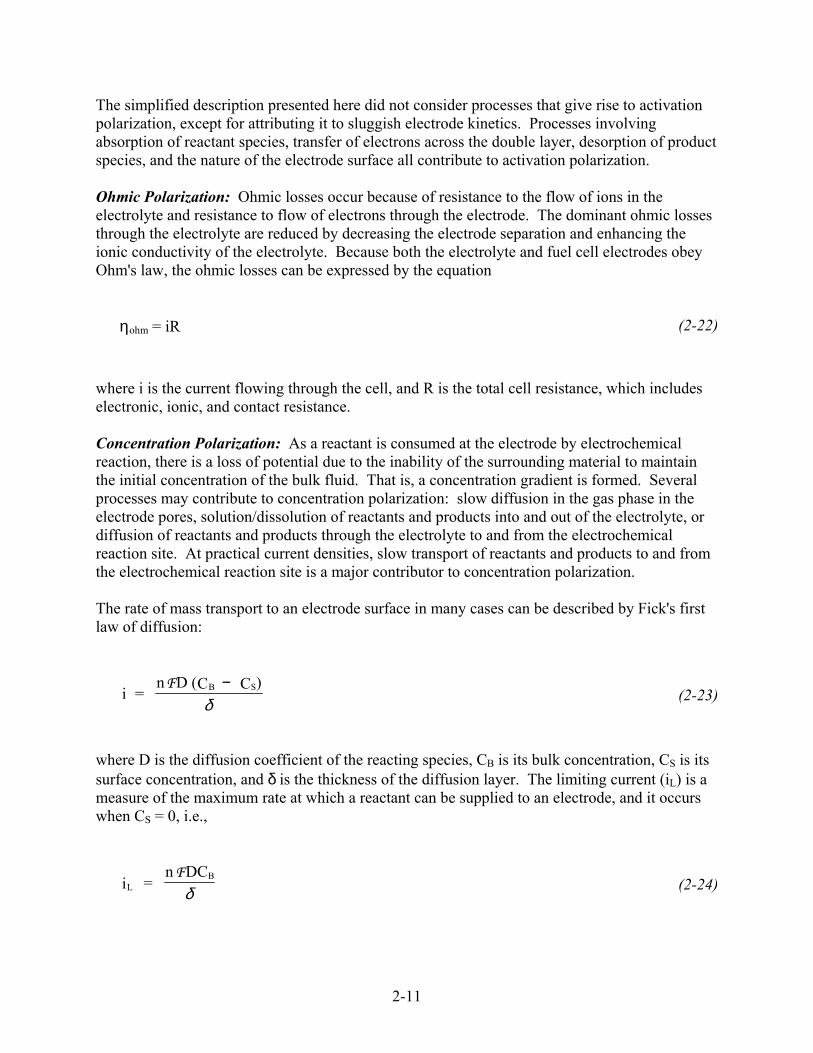
2-11
The simplified description presented here did not consider processes that give rise to activation polarization, except for attributing it to sluggish electrode kinetics. Processes involving absorption of reactant species, transfer of electrons across the double layer, desorption of product species, and the nature of the electrode surface all contribute to activation polarization. Ohmic Polarization: Ohmic losses occur because of resistance to the flow of ions in the electrolyte and resistance to flow of electrons through the electrode. The dominant ohmic losses through the electrolyte are reduced by decreasing the electrode separation and enhancing the ionic conductivity of the electrolyte. Because both the electrolyte and fuel cell electrodes obey Ohm's law, the ohmic losses can be expressed by the equation
ηohm = iR (2-22)
where i is the current flowing through the cell, and R is the total cell resistance, which includes electronic, ionic, and contact resistance. Concentration Polarization: As a reactant is consumed at the electrode by electrochemical reaction, there is a loss of potential due to the inability of the surrounding material to maintain the initial concentration of the bulk fluid. That is, a concentration gradient is formed. Several processes may contribute to concentration polarization: slow diffusion in the gas phase in the electrode pores, solution/dissolution of reactants and products into and out of the electrolyte, or diffusion of reactants and products through the electrolyte to and from the electrochemical reaction site. At practical current densities, slow transport of reactants and products to and from the electrochemical reaction site is a major contributor to concentration polarization. The rate of mass transport to an electrode surface in many cases can be described by Fick's first law of diffusion:
i = n D (C C )B SF −
δ (2-23)
where D is the diffusion coefficient of the reacting species, CB is its bulk concentration, CS is its surface concentration, and δ is the thickness of the diffusion layer. The limiting current (iL) is a measure of the maximum rate at which a reactant can be supplied to an electrode, and it occurs when CS = 0, i.e.,
LBi =
n DCFδ (2-24)
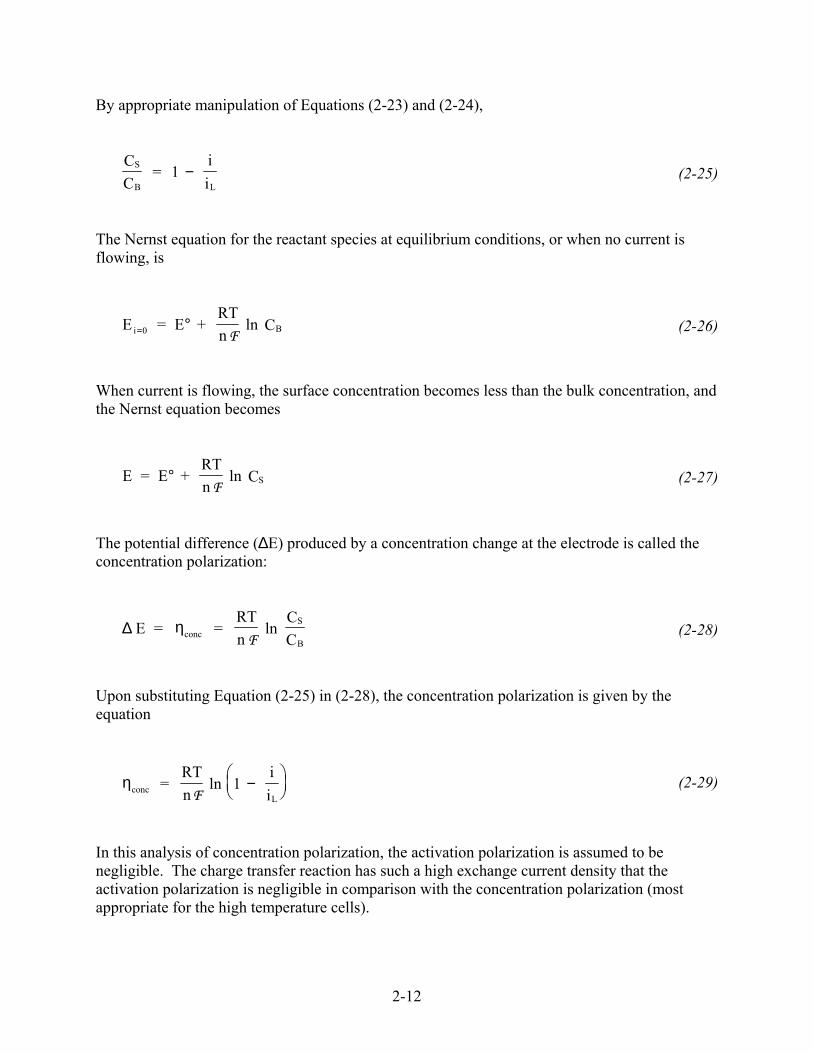
2-12
By appropriate manipulation of Equations (2-23) and (2-24),
S
B L
CC
= 1 ii
− (2-25)
The Nernst equation for the reactant species at equilibrium conditions, or when no current is flowing, is
E = E + RTn
ln CBi 0= °F
(2-26)
When current is flowing, the surface concentration becomes less than the bulk concentration, and the Nernst equation becomes
E = E + RTn
ln CS°F
(2-27)
The potential difference (∆E) produced by a concentration change at the electrode is called the concentration polarization:
∆ E = = RTn
ln CCconc
S
Bη
F (2-28)
Upon substituting Equation (2-25) in (2-28), the concentration polarization is given by the equation
concL
= RTn
ln 1 ii
ηF
−
(2-29)
In this analysis of concentration polarization, the activation polarization is assumed to be negligible. The charge transfer reaction has such a high exchange current density that the activation polarization is negligible in comparison with the concentration polarization (most appropriate for the high temperature cells).

2-13
Summing of Electrode Polarization: Activation and concentration polarization can exist at both the positive (cathode) and negative (anode) electrodes in fuel cells. The total polarization at these electrodes is the sum of ηact and ηconc, or
ηanode = ηact,a + ηconc,a (2-30)
and
ηcathode = ηact,c + ηconc,c (2-31)
The effect of polarization is to shift the potential of the electrode (Eelectrode) to a new value (Velectrode):
Velectrode = Eelectrode + ηelectrode (2-32)
For the anode,
Vanode = Eanode + ηanode (2-33)
and for the cathode,
Vcathode = Ecathode – ηcathode (2-34)
The net result of current flow in a fuel cell is to increase the anode potential and to decrease the cathode potential, thereby reducing the cell voltage. Figure 2-4 illustrates the contribution to polarization of the two half cells for a PAFC. The reference point (zero polarization) is hydrogen. These shapes of the polarization curves are typical of other types of fuel cells as well.
2-14
700
600
500
400
300
200
100
00 200 400 600 800
Cathode Loss (Air)
Electolyte IR Loss
Cathode Loss (O2)
Anode Loss (H2)Po
lariz
atio
n (m
V)
Current density (mA/cm2)
Figure 2-4 Contribution to Polarization of Anode and Cathode Summing of Cell Voltage: The cell voltage includes the contribution of the anode and cathode potentials and ohmic polarization:
Vcell = Vcathode – Vanode – iR (2-35)
When Equations (2-33) and (2-34) are substituted in Equation (2-35)
Vcell = Ecathode – ηcathode – (Eanode + ηanode ) – iR (2-36)
or
Vcell = ∆Ee – ηcathode – ηanode – iR (2-37)
where ∆Ee = Ecathode – Eanode. Equation (2-37) shows that current flow in a fuel cell results in a decrease in the cell voltage because of losses by electrode and ohmic polarizations. The goal of fuel cell developers is to minimize the polarization so that Vcell approaches ∆Ee. This goal is approached by modifications to fuel cell design (improvement in electrode structures, better electrocatalysts, more conductive electrolyte, thinner cell components, etc.). For a given cell design, it is possible to improve the cell performance by modifying the operating conditions (e.g., higher gas pressure, higher temperature, change in gas composition to lower the gas impurity concentration). However, for any fuel cell, compromises exist between achieving higher performance by operating at higher temperature or pressure and the problems associated with the stability/durability of cell components encountered at the more severe conditions. 2.1.6 Fuel Cell Performance Variables The performance of fuel cells is affected by operating variables (e.g., temperature, pressure, gas composition, reactant utilizations, current density) and other factors (impurities, cell life) that
2-15
influence the ideal cell potential and the magnitude of the voltage losses described above. Any number of operating points can be selected for application of a fuel cell in a practical system, as illustrated by Figure 2-5.
Figure 2-5 Flexibility of Operating Points According to Cell Parameters Figure 2-5 represents the characteristics of a fuel cell once its physical design is set. Changing the cell operating parameters (temperature and pressure) can have either a beneficial or a detrimental impact on fuel cell performance and on the performance of other system components. These effects may be offsetting. Changes in operating conditions may lower the cost of the cell, but increase the cost of the surrounding system. Usually, compromises in the operating parameters are necessary to meet the application requirements, obtain lowest system cost, and achieve acceptable cell life. Operating conditions are based on defining specific system requirements, such as power level, voltage, or system weight. From this and through interrelated systems studies, the power, voltage, and current requirements of the fuel cell stack and individual cells are determined. It is a matter of selecting a cell operating point (cell voltage and related current density) as shown by Figure 2-5 until the design requirements are satisfied (such as lowest cost, lightest unit, highest power density). For example, a design point at high current density will allow a smaller cell size at lower capital cost to be used for the stack, but a lower system efficiency results (because of the lower cell voltage) and attendant higher operating cost. This type of operating point would be typified by a vehicle application where light weight and small volume, as well as efficiency, are important drivers for cost effectiveness. Cells capable of higher current density would be of prime interest. Operating at a lower current density, but higher voltage (higher efficiency, lower operating cost) would be more suitable for stationary power plant operation. Operating at a higher pressure will increase cell performance and lower cost. However, there will be a higher parasitic power to compress the reactants, and the cell stack pressure vessel and piping will have to withstand the greater pressure. This adds cost. It is evident that the selection of the cell design point interacts with the application objectives. These will be discussed further in Section 8. Figure 2-6 presents the same information as Figure 2-5, but in a way to highlight another aspect of determining the cell design point. It would seem logical to design the cell to operate at the maximum power density that peaks at a higher current density (right of the figure). However,
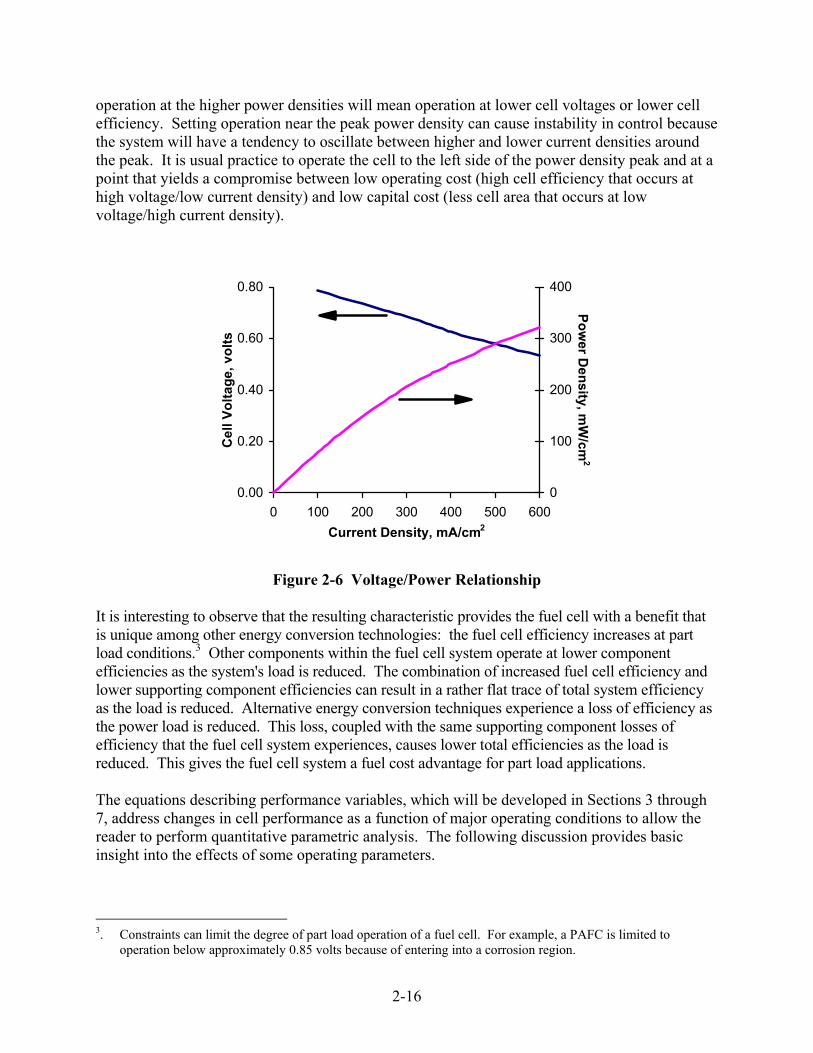
2-16
operation at the higher power densities will mean operation at lower cell voltages or lower cell efficiency. Setting operation near the peak power density can cause instability in control because the system will have a tendency to oscillate between higher and lower current densities around the peak. It is usual practice to operate the cell to the left side of the power density peak and at a point that yields a compromise between low operating cost (high cell efficiency that occurs at high voltage/low current density) and low capital cost (less cell area that occurs at low voltage/high current density).
0.00
0.20
0.40
0.60
0.80
0 100 200 300 400 500 600Current Density, mA/cm2
Cel
l Vol
tage
, vol
ts
0
100
200
300
400
Power D
ensity, mW
/cm2
Figure 2-6 Voltage/Power Relationship It is interesting to observe that the resulting characteristic provides the fuel cell with a benefit that is unique among other energy conversion technologies: the fuel cell efficiency increases at part load conditions.3 Other components within the fuel cell system operate at lower component efficiencies as the system's load is reduced. The combination of increased fuel cell efficiency and lower supporting component efficiencies can result in a rather flat trace of total system efficiency as the load is reduced. Alternative energy conversion techniques experience a loss of efficiency as the power load is reduced. This loss, coupled with the same supporting component losses of efficiency that the fuel cell system experiences, causes lower total efficiencies as the load is reduced. This gives the fuel cell system a fuel cost advantage for part load applications. The equations describing performance variables, which will be developed in Sections 3 through 7, address changes in cell performance as a function of major operating conditions to allow the reader to perform quantitative parametric analysis. The following discussion provides basic insight into the effects of some operating parameters.
3. Constraints can limit the degree of part load operation of a fuel cell. For example, a PAFC is limited to
operation below approximately 0.85 volts because of entering into a corrosion region.
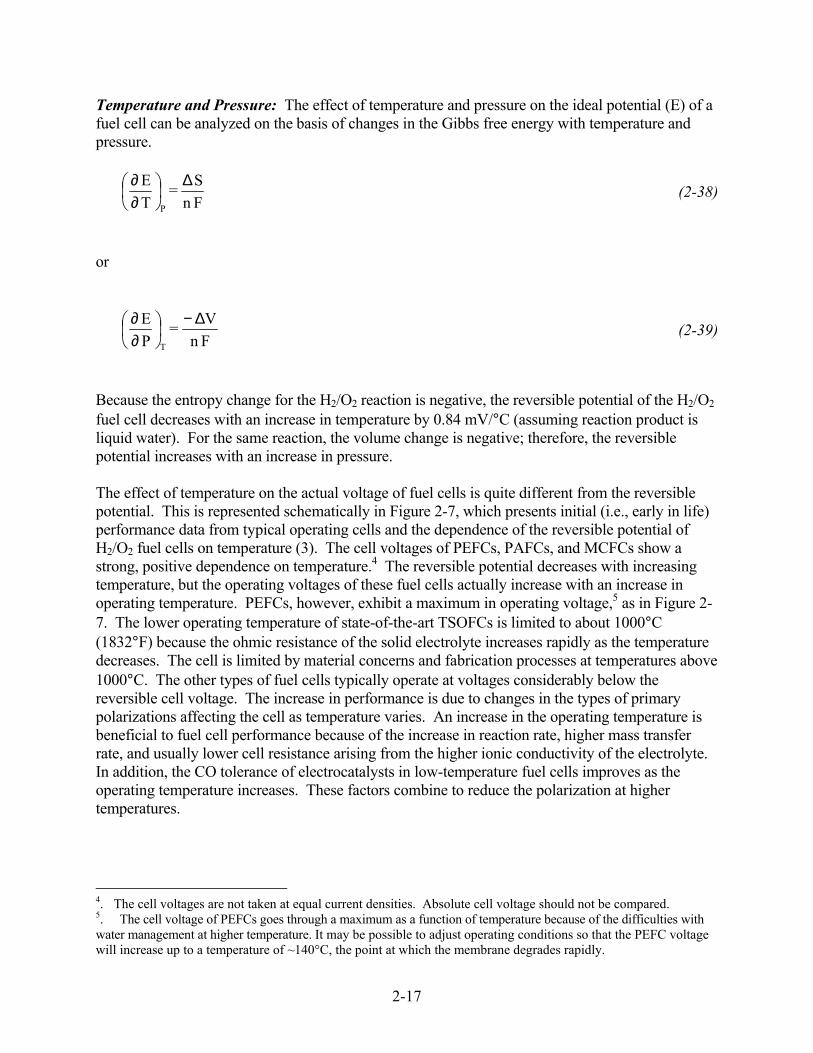
2-17
Temperature and Pressure: The effect of temperature and pressure on the ideal potential (E) of a fuel cell can be analyzed on the basis of changes in the Gibbs free energy with temperature and pressure.
FnS =
TE
P
∆
∂∂ (2-38)
or
FnV =
PE
T
∆−
∂∂ (2-39)
Because the entropy change for the H2/O2 reaction is negative, the reversible potential of the H2/O2 fuel cell decreases with an increase in temperature by 0.84 mV/°C (assuming reaction product is liquid water). For the same reaction, the volume change is negative; therefore, the reversible potential increases with an increase in pressure. The effect of temperature on the actual voltage of fuel cells is quite different from the reversible potential. This is represented schematically in Figure 2-7, which presents initial (i.e., early in life) performance data from typical operating cells and the dependence of the reversible potential of H2/O2 fuel cells on temperature (3). The cell voltages of PEFCs, PAFCs, and MCFCs show a strong, positive dependence on temperature.4 The reversible potential decreases with increasing temperature, but the operating voltages of these fuel cells actually increase with an increase in operating temperature. PEFCs, however, exhibit a maximum in operating voltage,5 as in Figure 2-7. The lower operating temperature of state-of-the-art TSOFCs is limited to about 1000°C (1832°F) because the ohmic resistance of the solid electrolyte increases rapidly as the temperature decreases. The cell is limited by material concerns and fabrication processes at temperatures above 1000°C. The other types of fuel cells typically operate at voltages considerably below the reversible cell voltage. The increase in performance is due to changes in the types of primary polarizations affecting the cell as temperature varies. An increase in the operating temperature is beneficial to fuel cell performance because of the increase in reaction rate, higher mass transfer rate, and usually lower cell resistance arising from the higher ionic conductivity of the electrolyte. In addition, the CO tolerance of electrocatalysts in low-temperature fuel cells improves as the operating temperature increases. These factors combine to reduce the polarization at higher temperatures. 4. The cell voltages are not taken at equal current densities. Absolute cell voltage should not be compared. 5. The cell voltage of PEFCs goes through a maximum as a function of temperature because of the difficulties with water management at higher temperature. It may be possible to adjust operating conditions so that the PEFC voltage will increase up to a temperature of ~140°C, the point at which the membrane degrades rapidly.
2-18
Figure 2-7 Dependence of the Initial Operating Cell Voltage of Typical Fuel Cells on Temperature (1)
On the negative side, materials problems related to corrosion, electrode degradation, electrocatalyst sintering and recrystallization, and electrolyte loss by evaporation are all accelerated at higher temperatures. An increase in operating pressure has several beneficial effects on fuel cell performance because the reactant partial pressure, gas solubility, and mass transfer rates are higher. In addition, electrolyte loss by evaporation is reduced at higher operating pressures. Increased pressure also tends to increase system efficiencies. However, there are compromises such as thicker piping and additional expense for pressurization. Section 7.2.1 addresses system aspects of pressurization. The benefits of increased pressure must be balanced against hardware and materials problems, as well as parasitic power costs. In particular, higher pressures increase material problems in MCFCs (see Section 6.1), pressure differentials must be minimized to prevent reactant gas leakage through the electrolyte and seals, and high pressure favors carbon deposition and methane formation in the fuel gas. Reactant Utilization and Gas Composition: Reactant utilization and gas composition have major impacts on fuel cell efficiency. It is apparent from the Nernst equations in Table 2-2 that fuel and oxidant gases containing higher partial pressures of electrochemical reactants produce a higher cell voltage. Utilization (U) refers to the fraction of the total fuel or oxidant introduced into a fuel cell that reacts electrochemically. In low-temperature fuel cells, determining the fuel utilization is relatively straightforward when H2 is the fuel, because it is the only reactant involved in the electrochemical reaction,6 i.e.
f2,in 2,out
2,in
2, consumed
2,inU =
H HH
= H
H−
(2-40)
6. Assumes no gas cross-over or leakage out of the cell.
2-19
where H2,in and H2,out are the flow rates of H2 at the inlet and outlet of the fuel cell, respectively. However, hydrogen can be consumed by various other pathways, such as by chemical reaction (i.e., with O2 and cell components) and loss via leakage out of the cell. These pathways increase the apparent utilization of hydrogen without contributing to the electrical energy produced by the fuel cell. A similar type of calculation is used to determine the oxidant utilization. For the cathode in MCFCs, two reactant gases, O2 and CO2, are utilized in the electrochemical reaction. The oxidant utilization should be based on the limiting reactant. Frequently O2, which is readily available from make-up air, is present in excess, and CO2 is the limiting reactant. A significant advantage of high-temperature fuel cells such as MCFCs is their ability to use CO as a fuel. The anodic oxidation of CO in an operating MCFC is slow compared to the anodic oxidation of H2; thus, the direct oxidation of CO is not favored. However, the water gas shift reaction
CO + H2O = H2 + CO2 (2-41)
reaches equilibrium rapidly in MCFCs at temperatures as low as 650°C (1200°F) to produce H2.7 As H2 is consumed, the reaction is driven to the right because both H2O and CO2 are produced in equal quantities in the anodic reaction. Because of the shift reaction, fuel utilization in MCFCs can exceed the value for H2 utilization, based on the inlet H2 concentration. For example, for an anode gas composition of 34% H2, 22% H2O, 13% CO, 18% CO2, and 12% N2, a fuel utilization of 80% (i.e., equivalent to 110% H2 utilization) can be achieved even though this would require 10% more H2 (total of 37.6%) than is available in the original fuel. The high fuel utilization is possible because the shift reaction provides the necessary additional H2 that is oxidized at the anode. In this case, the fuel utilization is defined by
f2, consumed
2,in inU =
HH + CO
(2-42)
where the H2 consumed originates from the H2 present at the fuel cell inlet (H2,in) and any H2 produced in the cell by the water gas shift reaction (COin). Gas composition changes between the inlet and outlet of a fuel cell, caused by the electrochemical reaction, lead to reduced cell voltages. This voltage reduction arises because the cell voltage adjusts to the lowest electrode potential given by the Nernst equation for the various gas compositions at the exit of the anode and cathode chambers. Because electrodes are usually good electronic conductors and isopotential surfaces, the cell voltage can not exceed the minimum (local) value of the Nernst potential. In the case of a fuel cell with the flow of fuel and oxidant in the same direction (i.e., co-flow), the minimum Nernst potential occurs at the cell outlet. When the
7. Example 9-5 in Section 9 illustrates how to determine the amount of H2 produced by the shift reaction.

2-20
gas flows are counterflow or crossflow, determining the location of the minimum potential is not straightforward. The MCFC provides a good example to illustrate the influence of the extent of reactant utilization on the electrode potential. An analysis of the gas composition at the fuel cell outlet as a function of utilization at the anode and cathode is presented in Example 9-5. The Nernst equation can be expressed in terms of the mole fraction of the gases (Xi) at the fuel cell outlet:
XXPXXX
ln 2FRT + E E
anode,COanodeO,H
½cathode,CO
½OHo
22
222= (2-43)
where P is the cell gas pressure. The second term on the right side of Equation (2-43), the so-called Nernst term, reflects the change in the reversible potential as a function of reactant utilization, gas composition, and pressure. Figure 2-8 illustrates the change in reversible cell potential calculated as a function of utilization using Equation (2-43).
Figure 2-8 The Variation in the Reversible Cell Voltage as a Function of Reactant Utilization
(Fuel and oxidant utilizations equal) in a MCFC at 650°C and 1 atm. Fuel gas: 80% H2/20% CO2 saturated with H2O at 25°C; oxidant gas: 60% CO2/30% O2/10% inert) The reversible potential at 650°C (1200°F) and 1 atmosphere pressure is plotted as a function of reactant utilization (fuel and oxidant utilizations are equal) for inlet gas compositions of 80% H2/20% CO2 saturated with H2O at 25°C (77°F) (fuel gas8) and 60% CO2/30% O2/10% inerts (oxidant gas); gas compositions and utilizations are listed in Table 2-4. Note that the oxidant 8. Anode inlet composition is 64.5% H2/6.4% CO2/13% CO/16.1% H2O after equilibration by water gas shift reaction.
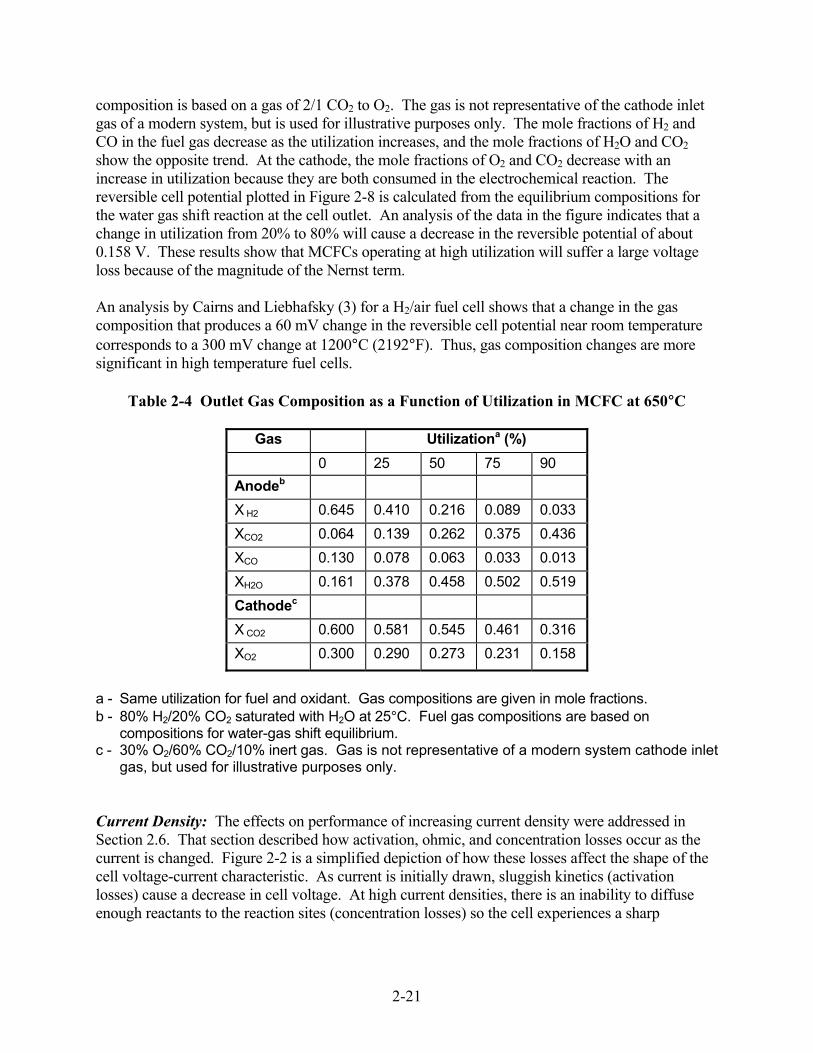
2-21
composition is based on a gas of 2/1 CO2 to O2. The gas is not representative of the cathode inlet gas of a modern system, but is used for illustrative purposes only. The mole fractions of H2 and CO in the fuel gas decrease as the utilization increases, and the mole fractions of H2O and CO2 show the opposite trend. At the cathode, the mole fractions of O2 and CO2 decrease with an increase in utilization because they are both consumed in the electrochemical reaction. The reversible cell potential plotted in Figure 2-8 is calculated from the equilibrium compositions for the water gas shift reaction at the cell outlet. An analysis of the data in the figure indicates that a change in utilization from 20% to 80% will cause a decrease in the reversible potential of about 0.158 V. These results show that MCFCs operating at high utilization will suffer a large voltage loss because of the magnitude of the Nernst term. An analysis by Cairns and Liebhafsky (3) for a H2/air fuel cell shows that a change in the gas composition that produces a 60 mV change in the reversible cell potential near room temperature corresponds to a 300 mV change at 1200°C (2192°F). Thus, gas composition changes are more significant in high temperature fuel cells.
Table 2-4 Outlet Gas Composition as a Function of Utilization in MCFC at 650°C
Gas Utilizationa (%) 0 25 50 75 90 Anodeb X H2 0.645 0.410 0.216 0.089 0.033 XCO2 0.064 0.139 0.262 0.375 0.436 XCO 0.130 0.078 0.063 0.033 0.013 XH2O 0.161 0.378 0.458 0.502 0.519 Cathodec X CO2 0.600 0.581 0.545 0.461 0.316 XO2 0.300 0.290 0.273 0.231 0.158
a - Same utilization for fuel and oxidant. Gas compositions are given in mole fractions. b - 80% H2/20% CO2 saturated with H2O at 25°C. Fuel gas compositions are based on
compositions for water-gas shift equilibrium. c - 30% O2/60% CO2/10% inert gas. Gas is not representative of a modern system cathode inlet
gas, but used for illustrative purposes only. Current Density: The effects on performance of increasing current density were addressed in Section 2.6. That section described how activation, ohmic, and concentration losses occur as the current is changed. Figure 2-2 is a simplified depiction of how these losses affect the shape of the cell voltage-current characteristic. As current is initially drawn, sluggish kinetics (activation losses) cause a decrease in cell voltage. At high current densities, there is an inability to diffuse enough reactants to the reaction sites (concentration losses) so the cell experiences a sharp

2-22
performance decrease through reactant starvation. There also may be an associated problem of diffusing the reaction products from the cell. Ohmic losses predominate in normal fuel cell operation. These losses can be expressed as iR losses where i is the current and R is the summation of internal resistances within the cell, Equation (2-22). As is readily evident from the equation, the ohmic loss and hence voltage change is a direct function of current (current density multiplied by cell area). 2.2 Computer Models Computer models are useful for conducting tests at various operating conditions and involving various materials in a search for optimal design performance. Computer models enable preliminary investigations without the need to construct and operate demonstration-scale equipment, which is both costly and time-consuming. They enable researchers to predict cell performance as multiple operating conditions are changed, such as temperature, pressure, and gas composition. The constitutive equations presented in the previous sections represent the backbone of these computer models. Systems models vs. mechanistic models Depending on the needs of the researcher, either a systems model or a mechanistic model can be used to investigate a technology development issue. Systems models are typically macroscopic in nature and use basic design parameters and operating conditions to compute overall performance. These models solve mass and energy balances at various temperatures, pressures, fuel compositions, and other design setpoints from which the overall voltage, power output, and area can be calculated. This information can then be used to optimize performance characteristics such as thermal efficiency or cost. Mechanistic models, on the other hand, are formulated to investigate minute details of fuel cell operation to address particular design issues. These design issues may include thermal transients during start-up or shut-down, mass transport through the electrolyte and electrodes, or effects of cell geometry. Mechanistic models are much more complex than systems models, requiring additional physical dimensions of the cell, additional physical properties, and generally the solution to systems of partial differential equations. Large, complex computer codes, often proprietary, have been written to simulate fuel cell performance for both systems studies and mechanistic models. A brief overview of very few of the publicly-available codes, developed through government support, is provided in the following paragraphs. This discussion is not meant to endorse any software, but rather to provide a flavor of representative applications of software to design issues. 2.2.1 System Models Unit Operations Models for Process Analysis using ASPEN DOE's National Energy Technology Laboratory has been engaged in the development of systems models for fuel cells for over 15 years. The models were originally intended for use in applications of stationary power generation designs to optimize process performance and to evaluate process alternatives. Hence, the models were designed to work within DOE’s ASPEN
2-23
process simulator and later ported to the commercial version of this product, ASPEN Plus. ASPEN is a sophisticated software application developed to model a wide variety of chemical processes. It contains a library of unit operations models that simulate process equipment and processing steps, and it has a chemical component data bank that contains physical property parameters that are used to compute thermodynamic properties, including phase and chemical equilibrium. The first general purpose fuel cell model was a Nernst-limited model designed to compute the maximum attainable fuel cell voltage as a function of the cell operating conditions, inlet stream compositions, and desired fuel utilization. Subsequently, customized unit operations models were developed to simulate the operation of solid oxide (internal reforming), molten carbonate (both external and internal reforming), phosphoric acid, and proton exchange fuel cell (PEFC). These fuel cell models are lumped parameter models based on empirical performance equations. As operation deviates from the setpoint conditions at a "reference" state, a voltage adjustment is applied to account for perturbations. Separate voltage adjustments are applied for current density, temperature, pressure, fuel utilization, fuel composition, oxidant utilization, oxidant composition, cell lifetime, and production year. These models were developed in a collaborative effort by DOE's National Energy Technology Laboratory and the National Renewable Energy Laboratory. Stand-alone fuel cell power systems have been investigated, as well as hybrid systems using a wide variety of fuels and process configurations. Some of the systems analysis studies that have been conducted using these fuel cell models are described in Section 8. Argonne's GCTool Argonne National Laboratory developed the General Computational Toolkit (GCTool) specifically for designing, analyzing, and comparing fuel cell systems and other power plant configurations, including automotive, space-based, and stationary power systems. A library of models for subcomponents and physical property tables is available, and users can add empirical models of subcomponents as needed. Four different types of fuel cell models are included: proton exchange, molten carbonate, phosphoric acid, and solid oxide. Other process equipment models include heat exchangers, reactors (including reformers), and vehicle systems. The physical property models include multiphase chemical equilibrium. Mathematical utilities include a nonlinear equation solver, a constrained nonlinear optimizer, an integrator, and an ordinary differential equation solver. GCTool has been used to analyze a variety of PEFC systems using different fuels, fuel storage methods, and fuel processing techniques. Examples include compressed hydrogen, metal hydride, glass microsphere, and sponge-iron hydrogen storage systems. Fuel processing alternatives have included reformers for methanol, natural gas, and gasoline using either partial oxidation or steam reforming. Researchers have examined atmospheric and pressurize PEFC automotive systems. These analyses included the identification of key constraints and operational analysis for off-design operation, system dynamic and transient performance, and the effects of operation at extreme temperatures.
2-24
NREL's Advisor 2002 The National Renewable Energy Laboratory created ADVISOR (Advanced VehIcle SimulatOR) to analyze transportation applications. The model assesses the performance and fuel economy of conventional, electric, hybrid, and fuel cell vehicles. The user can evaluate component and vehicle specifications such as electric motors, batteries, engines, and fuel cells. ADVISOR simulates the vehicle's performance under different driving conditions. Industry partnerships contributed state-of-the-art algorithms to ensure the accuracy of the model. For example, detailed electrical analysis is made possible by co-simulation links to Avant's Saber and Ansoft's SIMPLORER. Transient air conditioning analysis is possible by co-simulation with C&R Technologies' SINDA/FLUINT. Michelin provided data for a tire rolling resistance model, and Maxwell provided data for an ultracapacitor energy storage model. 2.2.2 Mechanistic Models NETL's 3-D Analysis The National Energy Technology Laboratory (NETL) developed an accurate, 3-dimensional computational fluid dynamics (CFD) model to simulate the performance of fuel cells so that design advances can proceed rapidly without the need for time-consuming build-and-test efforts. As opposed to systems models, 3-dimensional CFD models can address critical issues such as thermal stress distribution, an important consideration related to cell life. Such a model accounts for the distribution of fuel consumption throughout the cell; distribution which, in turn, depends upon the complex flow patterns within the cell. CFD analysis computes local fluid velocity, pressure, and temperature throughout the region of interest for problems with complex geometries and boundary conditions. By coupling the CFD-predicted fluid flow behavior with the electrochemistry and accompanying thermodynamics occurring in fuel cells, detailed predictions are possible. Improved knowledge of temperature and flow conditions at all points in the fuel cell lead to improved design and performance of the unit. Based on the successful initial validation with established 1-dimensional codes, NETL researchers now perform sophisticated 3-dimensional simulations using FLUENT, a commercially available product . One configuration studied was tubular solid oxide fuel cell (TSOFC) technology, including a support tube on the cathode side of the cell. Six chemical species were tracked in the simulation: H2, CO2, CO, O2, H2O, and N2. Fluid dynamics, heat transfer, electrochemistry, and the potential field in electrode and interconnect regions were all simulated. Voltage losses due to chemical kinetics, ohmic conduction, and diffusion were accounted for in the model.
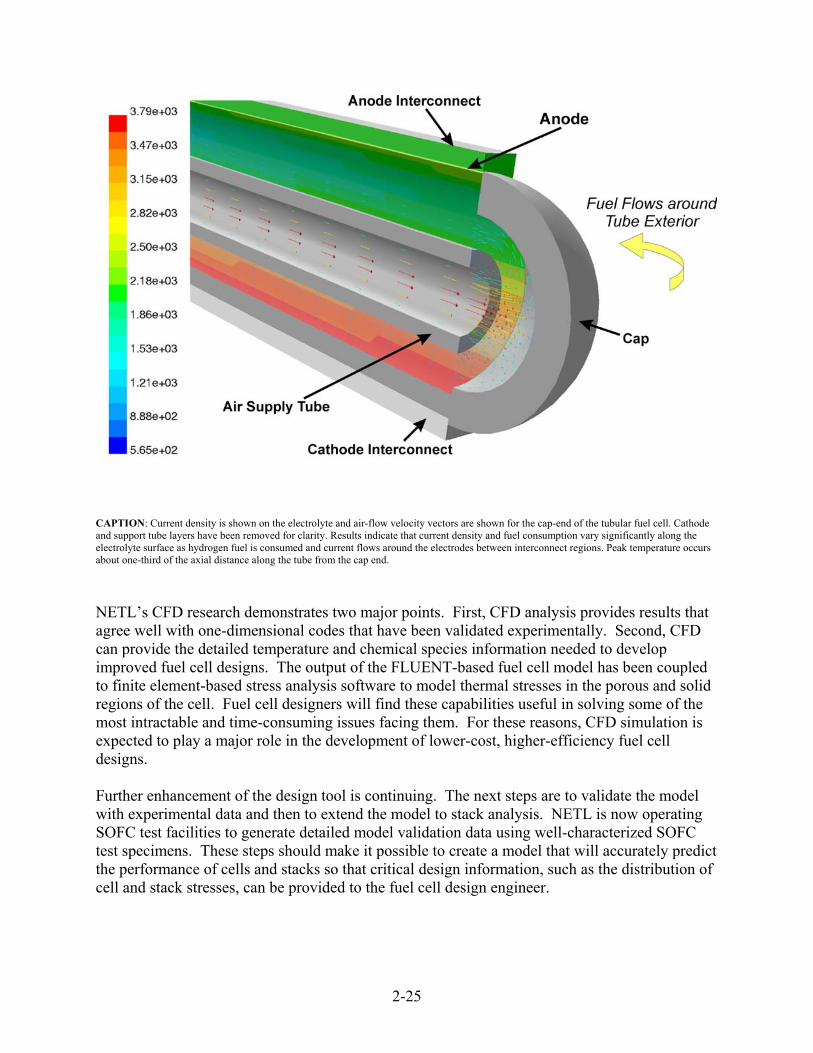
2-25
CAPTION: Current density is shown on the electrolyte and air-flow velocity vectors are shown for the cap-end of the tubular fuel cell. Cathode and support tube layers have been removed for clarity. Results indicate that current density and fuel consumption vary significantly along the electrolyte surface as hydrogen fuel is consumed and current flows around the electrodes between interconnect regions. Peak temperature occurs about one-third of the axial distance along the tube from the cap end. NETL’s CFD research demonstrates two major points. First, CFD analysis provides results that agree well with one-dimensional codes that have been validated experimentally. Second, CFD can provide the detailed temperature and chemical species information needed to develop improved fuel cell designs. The output of the FLUENT-based fuel cell model has been coupled to finite element-based stress analysis software to model thermal stresses in the porous and solid regions of the cell. Fuel cell designers will find these capabilities useful in solving some of the most intractable and time-consuming issues facing them. For these reasons, CFD simulation is expected to play a major role in the development of lower-cost, higher-efficiency fuel cell designs. Further enhancement of the design tool is continuing. The next steps are to validate the model with experimental data and then to extend the model to stack analysis. NETL is now operating SOFC test facilities to generate detailed model validation data using well-characterized SOFC test specimens. These steps should make it possible to create a model that will accurately predict the performance of cells and stacks so that critical design information, such as the distribution of cell and stack stresses, can be provided to the fuel cell design engineer.

2-26
2.3 References 1. P.W. Atkins, “Physical Chemistry,” 3rd Edition, W.H. Freeman and Company, New York,
NY, 1986. 2. S.N. Simons, R.B. King and P.R. Prokopius, in Symposium Proceedings Fuel Cells
Technology Status and Applications, Figure 1, p. 46, Edited by E.H. Camara, Institute of Gas Technology, Chicago, IL, 45, 1982.
3. E.J. Cairns and H.A. Liebhafsky, Energy Conversion, p. 9, 63, 1969. 4. M.W. Chase, et al., “JANAF Thermochemical Tables,” Third Edition, American Chemical
Society and the American Institute of Physics for the National Bureau of Standards (now National Institute of Standards and Technology), 1985.
5. “Fuel Cell Handbook,” J. Appleby and F. Foulkes, Texas A&M University, Van Nostrand Reinhold, New York (out of print),republished by Krieger Publishing Co., Melbourne, FL, 1989.
6. W. Stanley Angrist, “Direct Energy Conversion,” Third Edition, Allyn and Bacon, Inc. Boston, MA, date of publication unknown.

3-1
3. POLYMER ELECTROLYTE FUEL CELLS
Polymer electrolyte membrane fuel cells (PEFC)9 are able to efficiently generate high power densities, thereby making the technology attractive for motive and stationary applications. Specifically, the weight, volume, and ultimately cost are the primary factors for acceptance. PEFC technology differentiates itself from other fuel cell technologies in that a solid phase polymer membrane is used as the cell separator/electrolyte. Because the cell separator is a polymer film, issues such as sealing, assembly, and handling are less complex than most other fuel cell systems. The need to handle liquids, including corrosive acids and bases, are eliminated in this system. Furthermore, the site responsible for proton transport is chemically bonded to the polymer itself, thereby eliminating materials issues. PEFCs typically operate at low temperatures (60o - 80o C), allowing for faster startup and immediate response to changes in the demand for power. The PEFC is attractive for transportation applications, and is a major competitor for stationary power applications less than 100kW. References (1) and (2) provide excellent overviews and more technical information for PEFCs. 3.1 Cell Components Typical cell components within a PEFC stack include: 1) the ion exchange membrane; 2) an electrically conductive porous backing layer; 3) a catalyst layer (the electrodes) sandwiched between the backing layer and the membrane, and 4) cell plate hardware shown in a double sided (bi-polar) configuration that delivers the fuel and oxidant to the reactive sites via flow channels, see Figures 3-1a and 3-1b. Typically, the electrodes can be cast as thin films that can be either transferred to the membrane or applied directly to the membrane. Alternatively, the catalyst-electrode layer may be deposited onto the backing layer, then bonded to the membrane.
9. Polymer electrolyte fuel cells are referred to by several acronyms; a common one is PEFC.
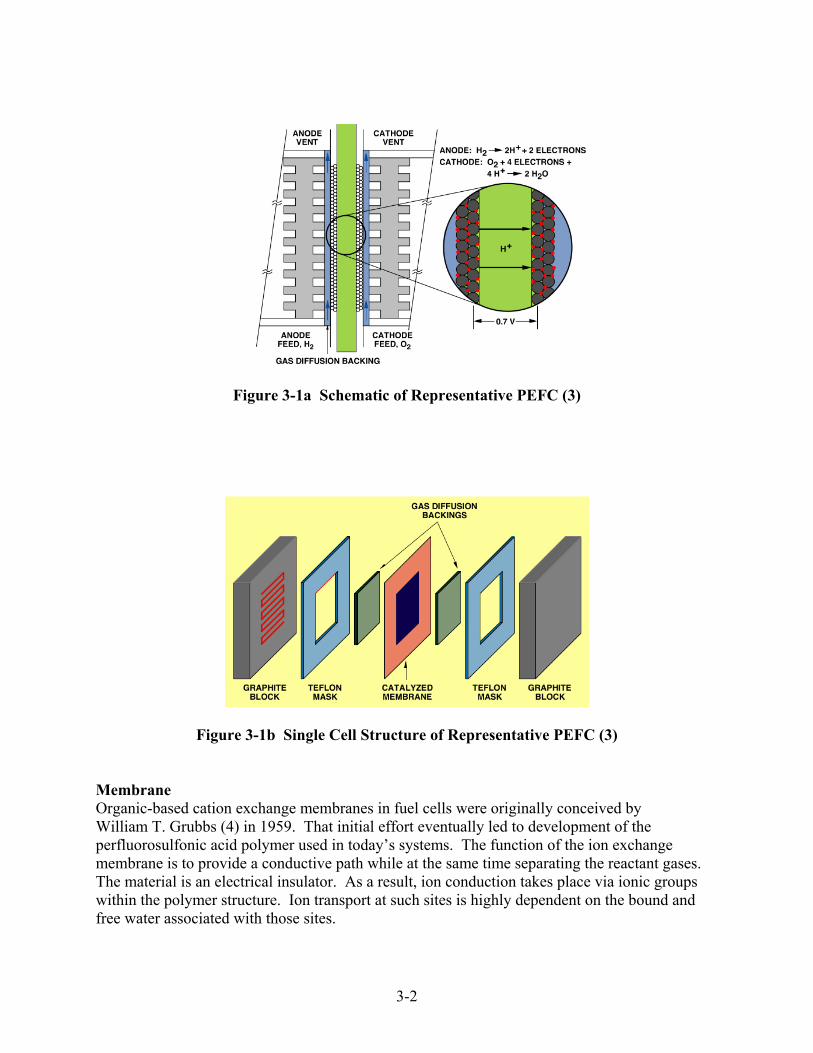
3-2
Figure 3-1a Schematic of Representative PEFC (3)
Figure 3-1b Single Cell Structure of Representative PEFC (3) Membrane Organic-based cation exchange membranes in fuel cells were originally conceived by William T. Grubbs (4) in 1959. That initial effort eventually led to development of the perfluorosulfonic acid polymer used in today’s systems. The function of the ion exchange membrane is to provide a conductive path while at the same time separating the reactant gases. The material is an electrical insulator. As a result, ion conduction takes place via ionic groups within the polymer structure. Ion transport at such sites is highly dependent on the bound and free water associated with those sites.

3-3
A commonly used material, Nafion®10 is a polymer that falls within the perfluorosulfonic acid family. It is characterized by a backbone structure that is Teflon®-like, i.e., polytetrafluoroethylene, and which has bonded to it a perfluorinated side chain that has a terminal sulfonic acid group (SO3
-). It is through the regular repeating of the sulfonic acid sites on the side chains that ionic transport characteristics are attained. For the most part, the number of sulfonic acid sites dictates the ionic conductivity of such systems. Even though the bulk of the polymer is fluorinated, imparting a highly hydrophobic character to the bulk of the membrane, the sulfonic acid sites are hydrophyllic. The degree of water content a membrane can attain is proportional to the ionic sites and, as a result, the significant properties of the membrane (conductivity, gas permeability, and mechanical properties) are dictated by water content (5). Porous Backing Layer The polymer membrane is sandwiched between two sheets of porous backing media. The function of the backing layer11 is to: 1) act as a gas diffuser; 2) provide mechanical support, and 3) provide an electrical pathway for electrons. The backing layer is typically carbon-based, and may be in cloth form, a non-woven pressed carbon fiber configuration, or simply a felt-like material. The layer incorporates a hydrophobic material, such as polytetrafluoroethylene. The function of polytetrafluoroethylene is to prevent water from “pooling” within the pore volume of the backing layer so that gases freely contact the catalyst sites. Furthermore, it facilitates product water removal on the cathode as it creates a non-wetting surface within the passages of the backing material. Electrode-Catalyst Layer In intimate contact with the membrane and the backing layer is a catalyst layer. This catalyst layer, integral with its binder, forms the electrode. The catalyst and binder electrode structure is either applied to the membrane or else applied to the backing layer. In either case, the degree of intimacy of the catalyst particles and the membrane is critical for optimal proton mobility. The binder performs multiple functions. In one case, it “fixes” the catalyst particles within a layered structure, while a second function is to contribute to the overall architecture of the electrode. This architecture has a direct bearing on performance. There are two schools of thought on the electrode composition, in particular, the binder. In the original hydrophobic, porous, gaseous electrodes developed by Union Carbide and later advanced by General Electric, the Dow Chemical Company, and others, the binder was polytetrafluoroethylene: a non-wetting component within the electrode itself. The second school of electrode science developed a hydrophyllic electrode in which the binder is perfluorosulfonic acid. The driver for this development was to enhance the membrane/catalyst contact to minimize the platinum loading requirements (6). The catalyst is platinum-based for both the anode and cathode. To promote hydrogen oxidation, the anode uses either pure platinum metal catalyst or a supported platinum catalyst, typically on carbon or graphite for pure hydrogen feed streams. For other fuels, such as a reformate (containing H2, CO2, CO, and N2), the desired catalyst is an alloy of platinum containing
10. Nafion is a registered trademark of the E.I. DuPont Company. 11. Commonly referred to as the gas diffusion layer (GDL) even though it has additional functions.
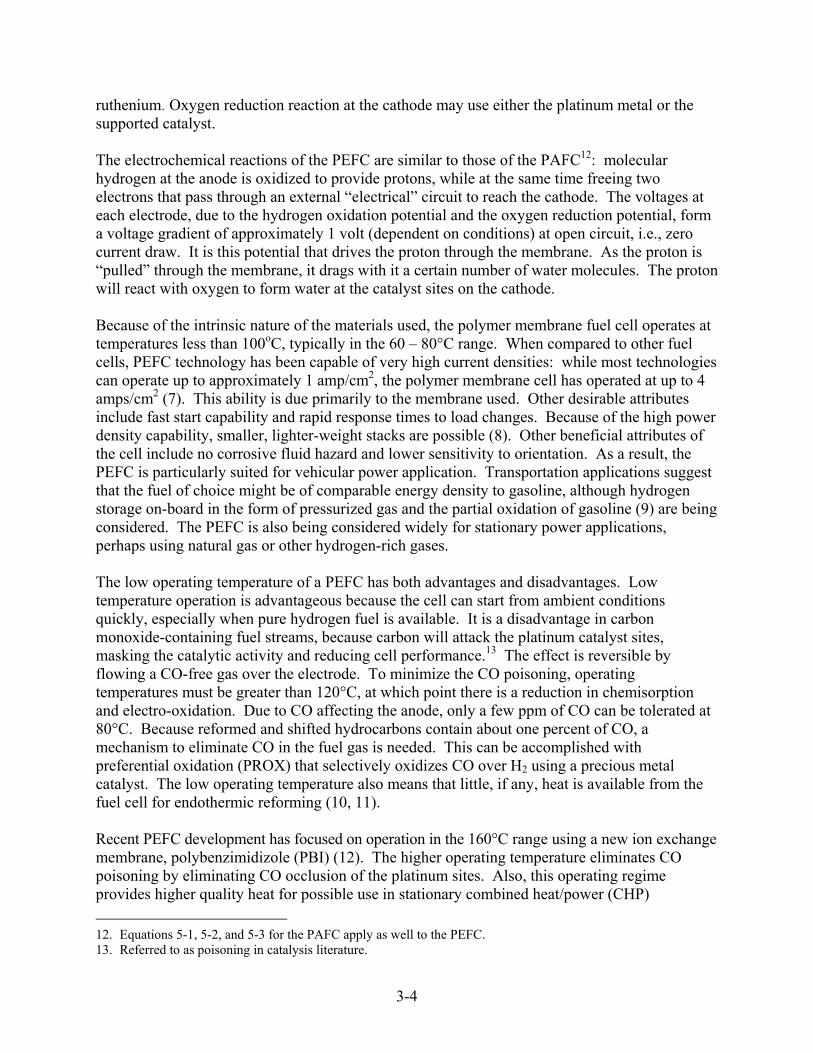
3-4
ruthenium. Oxygen reduction reaction at the cathode may use either the platinum metal or the supported catalyst. The electrochemical reactions of the PEFC are similar to those of the PAFC12: molecular hydrogen at the anode is oxidized to provide protons, while at the same time freeing two electrons that pass through an external “electrical” circuit to reach the cathode. The voltages at each electrode, due to the hydrogen oxidation potential and the oxygen reduction potential, form a voltage gradient of approximately 1 volt (dependent on conditions) at open circuit, i.e., zero current draw. It is this potential that drives the proton through the membrane. As the proton is “pulled” through the membrane, it drags with it a certain number of water molecules. The proton will react with oxygen to form water at the catalyst sites on the cathode. Because of the intrinsic nature of the materials used, the polymer membrane fuel cell operates at temperatures less than 100oC, typically in the 60 – 80°C range. When compared to other fuel cells, PEFC technology has been capable of very high current densities: while most technologies can operate up to approximately 1 amp/cm2, the polymer membrane cell has operated at up to 4 amps/cm2 (7). This ability is due primarily to the membrane used. Other desirable attributes include fast start capability and rapid response times to load changes. Because of the high power density capability, smaller, lighter-weight stacks are possible (8). Other beneficial attributes of the cell include no corrosive fluid hazard and lower sensitivity to orientation. As a result, the PEFC is particularly suited for vehicular power application. Transportation applications suggest that the fuel of choice might be of comparable energy density to gasoline, although hydrogen storage on-board in the form of pressurized gas and the partial oxidation of gasoline (9) are being considered. The PEFC is also being considered widely for stationary power applications, perhaps using natural gas or other hydrogen-rich gases. The low operating temperature of a PEFC has both advantages and disadvantages. Low temperature operation is advantageous because the cell can start from ambient conditions quickly, especially when pure hydrogen fuel is available. It is a disadvantage in carbon monoxide-containing fuel streams, because carbon will attack the platinum catalyst sites, masking the catalytic activity and reducing cell performance.13 The effect is reversible by flowing a CO-free gas over the electrode. To minimize the CO poisoning, operating temperatures must be greater than 120°C, at which point there is a reduction in chemisorption and electro-oxidation. Due to CO affecting the anode, only a few ppm of CO can be tolerated at 80°C. Because reformed and shifted hydrocarbons contain about one percent of CO, a mechanism to eliminate CO in the fuel gas is needed. This can be accomplished with preferential oxidation (PROX) that selectively oxidizes CO over H2 using a precious metal catalyst. The low operating temperature also means that little, if any, heat is available from the fuel cell for endothermic reforming (10, 11). Recent PEFC development has focused on operation in the 160°C range using a new ion exchange membrane, polybenzimidizole (PBI) (12). The higher operating temperature eliminates CO poisoning by eliminating CO occlusion of the platinum sites. Also, this operating regime provides higher quality heat for possible use in stationary combined heat/power (CHP) 12. Equations 5-1, 5-2, and 5-3 for the PAFC apply as well to the PEFC. 13. Referred to as poisoning in catalysis literature.

3-5
applications. Because PBI requires significantly lower water content to facilitate proton transport, an additional benefit is that water management is dramatically simplified (13, 14). Both temperature and pressure have a significant influence on cell performance. Present cells operate at 80°C over a range of 0.0010 - 1.0 MPa (~0.1 - 150 psig). Nominally, 0.285 MPa (25 psig) (8) is used for some transportation applications. Using appropriate current collectors and supporting structure, polymer electrolyte fuel cells and electrolysis cells should be capable of operating at pressures up to 3000 psi and differential pressures up to 500 psi (15). Water Management Due to operation at less than 100°C and atmospheric pressure, water is produced as a liquid. A critical requirement is to maintain high water content in the electrolyte to ensure high ionic conductivity. Maintaining high water content is particularly critical when operating at high current densities (approximately 1 A/cm2) because mass transport issues associated with water formation and distribution limit cell output. The ionic conductivity of the electrolyte is higher when the membrane is fully saturated: this impacts the overall efficiency of the fuel cell. Without adequate water management, an imbalance will occur between water production and water removal from the cell. Water content is determined by the balance of water14 during operation. Contributing factors to water transport are the water drag through the cell, back-diffusion from the cathode, and the diffusion of water in the fuel stream through the anode. Water transport is not only a function of the operating conditions14 but a function of the characteristics of the membrane and the electrodes. Water drag refers to the amount of water that is pulled by osmotic action along with the proton (16). One estimate is that between 1 - 2.5 molecules are dragged with each proton (17). As a result, transported water can be envisioned as a hydrated proton, H(H2O)n. During operation, a concentration gradient may form whereby the anode is drier than the cathode. Under these conditions, there is a back-diffusion of water from the cathode to the anode. Membrane thickness is also a factor in that the thinner the membrane, the greater the transport of water back to the anode. Under ideal conditions, there should be a net zero (17, 18) water exchange. References (19) and (20) can be reviewed for specific modeling information, but suffice it to say that if too much water is available, the electrodes may be flooded and reactants may be diluted; while if too little, the membrane may be dehydrated. Adherence of the membrane to the electrode will be adversely affected if dehydration occurs. Intimate contact between the electrodes and the electrolyte membrane is important because there is no free liquid electrolyte to form a conducting bridge. Operation under dry conditions will severely impact membrane lifetime (21). Reliable forms of water management have been developed based on continuous flow field design and appropriate operating adjustments. If more water is exhausted than produced, then humidification of the incoming anode gas becomes important (19). If there is too much humidification, however, the electrode floods, which causes problems with gas diffusion to the electrode. A temperature rise between the inlet and outlet of the flow field increases evaporation
14. A smaller current, larger reactant flow, lower humidity, higher temperature, or lower pressure will result in a
water deficit. A higher current, smaller reactant flow, higher humidity, lower temperature, or higher pressure will lead to a water surplus.

3-6
to maintain water content in the cell. There also have been attempts to control the water in the cell using external wicking connected to the membrane to either drain or supply water by capillary action. One PEFC developer (22) devised an alternative plate structure that provides passive water control. Product water is removed by two mechanisms: 1) transport of liquid water through the porous bipolar plate into the coolant, and 2) evaporation into the reactant gas streams. The cell is similar in basic design to other PEFCs with membrane, catalysts, substrates, and bipolar plate components. However, there is a difference in construction and composition of the bipolar plate: it is made of porous graphite. During operation, the pores are filled with liquid water that communicates directly with the coolant stream. Product water flows from the cathode through the pores into the coolant stream (a small pressure gradient between reactant and the coolant stream is needed). The water in the coolant stream is then routed to a reservoir. Removal of water by the porous membrane results in the reactant flow stream being free of any obstructions (liquid water). The flooded pores serve a second purpose of supplying water to the incoming reactant gases and humidifying those gases. This prevents drying of the membrane, a common failure mode, particularly at the anode. Control of the amount of area used to humidify the inlet gases has eliminated the need to pre-humidify the reactant gases. Reasons for removing the water through the porous plate are: 1) there is less water in the spent reactant streams; 2) this approach reduces parasitic power needs of the oxidant exhaust condenser; 3) the cell can operate at high utilizations that further reduce water in the reactant streams; 4) higher temperatures can be used with higher utilizations so that the radiator can be smaller,15 and 5) the control system is simplified. 3.1.1 State-of-the-Art Components An accelerated interest in polymer electrolyte fuel cells within the decade has led to improvements in both cost and performance. Development has reached the point where both motive and stationary power applications are nearing an acceptable cost for commercial markets. PEFC operation at ambient pressure has been validated by more than 25,000 hours with a six-cell stack without forced air flow, humidification, or active cooling (23). Complete fuel cell systems have been demonstrated for a number of transportation applications including public transit buses and passenger automobiles. For stationary applications, a factory-produced residential power system has operated unattended for over 1,000,000 kWhrs (24). Recent development has focused on cost reduction and high-volume manufacture for the catalyst, membranes, and bipolar plates. This coincides with ongoing research to increase power density, improve water management, operate at ambient conditions, tolerate reformed fuel, and extend stack life. Manufacturing details of the Plug Power cell and stack design are proprietary, but the literature provides some information on the cell and stack design. Example schematics for the cross-section and a current collecting plate are shown in Figure 3-2 (25, 26). An approach for sealing the cell with flat gaskets is shown (Label 402) but there are many alternatives with gaskets and plates having different shapes and grooves, respectively. The plate shows the flow path for one of 15. Higher average temperature operaton is possible because of the reduction of hot spots within the cell. Water
will evaporate through the porous plate in the vicinity of a hot spot. Conversely, a local cool spot can produce a concentration of water. This water is quickly removed through the porous plate.
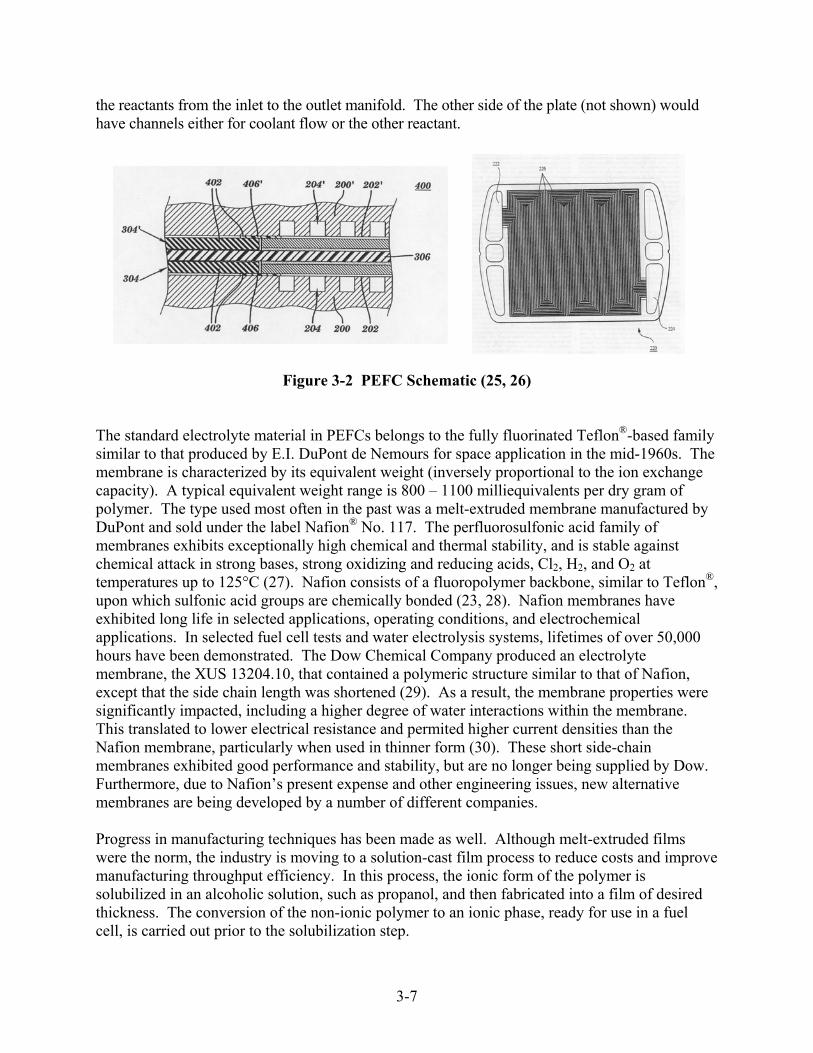
3-7
the reactants from the inlet to the outlet manifold. The other side of the plate (not shown) would have channels either for coolant flow or the other reactant.
Figure 3-2 PEFC Schematic (25, 26)
The standard electrolyte material in PEFCs belongs to the fully fluorinated Teflon®-based family similar to that produced by E.I. DuPont de Nemours for space application in the mid-1960s. The membrane is characterized by its equivalent weight (inversely proportional to the ion exchange capacity). A typical equivalent weight range is 800 – 1100 milliequivalents per dry gram of polymer. The type used most often in the past was a melt-extruded membrane manufactured by DuPont and sold under the label Nafion® No. 117. The perfluorosulfonic acid family of membranes exhibits exceptionally high chemical and thermal stability, and is stable against chemical attack in strong bases, strong oxidizing and reducing acids, Cl2, H2, and O2 at temperatures up to 125°C (27). Nafion consists of a fluoropolymer backbone, similar to Teflon®, upon which sulfonic acid groups are chemically bonded (23, 28). Nafion membranes have exhibited long life in selected applications, operating conditions, and electrochemical applications. In selected fuel cell tests and water electrolysis systems, lifetimes of over 50,000 hours have been demonstrated. The Dow Chemical Company produced an electrolyte membrane, the XUS 13204.10, that contained a polymeric structure similar to that of Nafion, except that the side chain length was shortened (29). As a result, the membrane properties were significantly impacted, including a higher degree of water interactions within the membrane. This translated to lower electrical resistance and permited higher current densities than the Nafion membrane, particularly when used in thinner form (30). These short side-chain membranes exhibited good performance and stability, but are no longer being supplied by Dow. Furthermore, due to Nafion’s present expense and other engineering issues, new alternative membranes are being developed by a number of different companies. Progress in manufacturing techniques has been made as well. Although melt-extruded films were the norm, the industry is moving to a solution-cast film process to reduce costs and improve manufacturing throughput efficiency. In this process, the ionic form of the polymer is solubilized in an alcoholic solution, such as propanol, and then fabricated into a film of desired thickness. The conversion of the non-ionic polymer to an ionic phase, ready for use in a fuel cell, is carried out prior to the solubilization step.
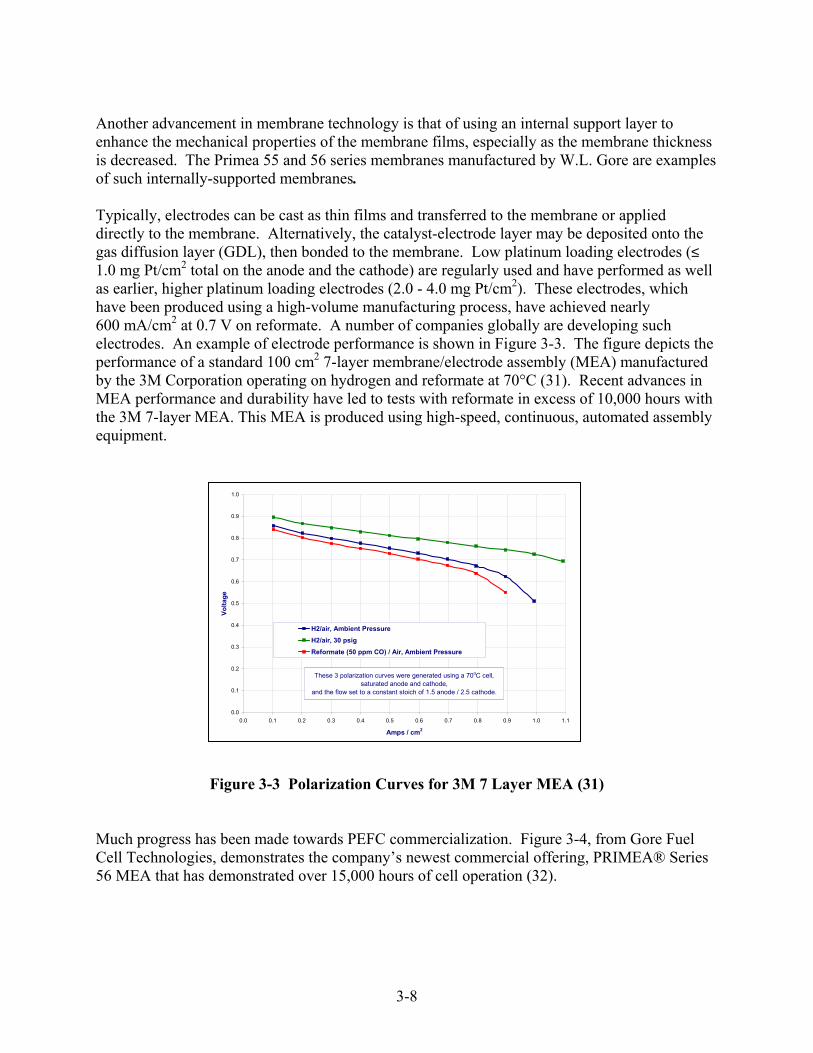
3-8
Another advancement in membrane technology is that of using an internal support layer to enhance the mechanical properties of the membrane films, especially as the membrane thickness is decreased. The Primea 55 and 56 series membranes manufactured by W.L. Gore are examples of such internally-supported membranes. Typically, electrodes can be cast as thin films and transferred to the membrane or applied directly to the membrane. Alternatively, the catalyst-electrode layer may be deposited onto the gas diffusion layer (GDL), then bonded to the membrane. Low platinum loading electrodes (≤1.0 mg Pt/cm2 total on the anode and the cathode) are regularly used and have performed as well as earlier, higher platinum loading electrodes (2.0 - 4.0 mg Pt/cm2). These electrodes, which have been produced using a high-volume manufacturing process, have achieved nearly 600 mA/cm2 at 0.7 V on reformate. A number of companies globally are developing such electrodes. An example of electrode performance is shown in Figure 3-3. The figure depicts the performance of a standard 100 cm2 7-layer membrane/electrode assembly (MEA) manufactured by the 3M Corporation operating on hydrogen and reformate at 70°C (31). Recent advances in MEA performance and durability have led to tests with reformate in excess of 10,000 hours with the 3M 7-layer MEA. This MEA is produced using high-speed, continuous, automated assembly equipment.
Figure 3-3 Polarization Curves for 3M 7 Layer MEA (31) Much progress has been made towards PEFC commercialization. Figure 3-4, from Gore Fuel Cell Technologies, demonstrates the company’s newest commercial offering, PRIMEA® Series 56 MEA that has demonstrated over 15,000 hours of cell operation (32).
0.0
0.1
0.2
0.3
0.4
0.5
0.6
0.7
0.8
0.9
1.0
0.0 0.1 0.2 0.3 0.4 0.5 0.6 0.7 0.8 0.9 1.0 1.1
Amps / cm2
Volta
ge
H2/air, Ambient PressureH2/air, 30 psigReformate (50 ppm CO) / Air, Ambient Pressure
These 3 polarization curves were generated using a 70oC cell, saturated anode and cathode,
and the flow set to a constant stoich of 1.5 anode / 2.5 cathode.
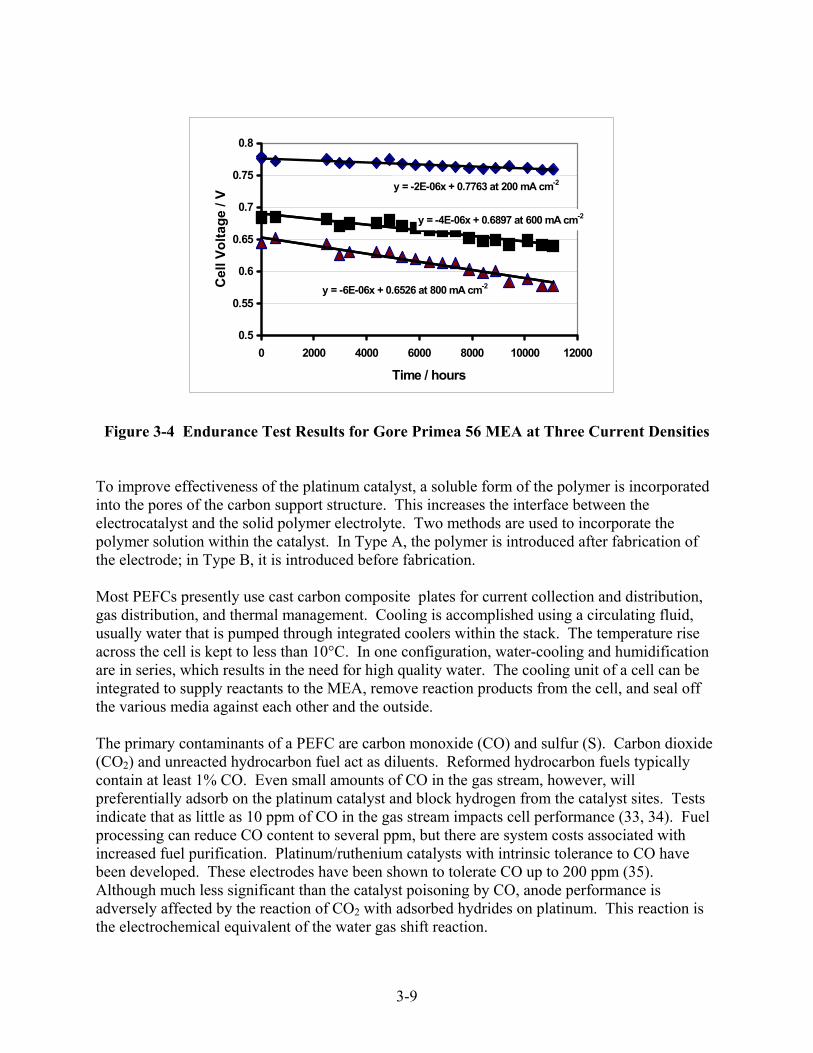
3-9
y = -2E-06x + 0.7763 at 200 mA cm-2
y = -4E-06x + 0.6897 at 600 mA cm-2
y = -6E-06x + 0.6526 at 800 mA cm-2
0.5
0.55
0.6
0.65
0.7
0.75
0.8
0 2000 4000 6000 8000 10000 12000
Time / hours
Cel
l Vol
tage
/ V
Figure 3-4 Endurance Test Results for Gore Primea 56 MEA at Three Current Densities To improve effectiveness of the platinum catalyst, a soluble form of the polymer is incorporated into the pores of the carbon support structure. This increases the interface between the electrocatalyst and the solid polymer electrolyte. Two methods are used to incorporate the polymer solution within the catalyst. In Type A, the polymer is introduced after fabrication of the electrode; in Type B, it is introduced before fabrication. Most PEFCs presently use cast carbon composite plates for current collection and distribution, gas distribution, and thermal management. Cooling is accomplished using a circulating fluid, usually water that is pumped through integrated coolers within the stack. The temperature rise across the cell is kept to less than 10°C. In one configuration, water-cooling and humidification are in series, which results in the need for high quality water. The cooling unit of a cell can be integrated to supply reactants to the MEA, remove reaction products from the cell, and seal off the various media against each other and the outside. The primary contaminants of a PEFC are carbon monoxide (CO) and sulfur (S). Carbon dioxide (CO2) and unreacted hydrocarbon fuel act as diluents. Reformed hydrocarbon fuels typically contain at least 1% CO. Even small amounts of CO in the gas stream, however, will preferentially adsorb on the platinum catalyst and block hydrogen from the catalyst sites. Tests indicate that as little as 10 ppm of CO in the gas stream impacts cell performance (33, 34). Fuel processing can reduce CO content to several ppm, but there are system costs associated with increased fuel purification. Platinum/ruthenium catalysts with intrinsic tolerance to CO have been developed. These electrodes have been shown to tolerate CO up to 200 ppm (35). Although much less significant than the catalyst poisoning by CO, anode performance is adversely affected by the reaction of CO2 with adsorbed hydrides on platinum. This reaction is the electrochemical equivalent of the water gas shift reaction.

3-10
A number of approaches can be used to purify reformate fuel. These include pressure swing adsorption, membrane separation, methanation, and selective oxidation. Although selective oxidation does not remove CO2, it is usually the preferred method for CO removal because of the parasitic system loads and energy required by other methods. In selective oxidation, the reformed fuel is mixed with air or oxygen either before the fuel is fed to the cell or within the stack itself. Current selective oxidation technology can reduce CO levels to <10 ppm. Another approach involves the use of a selective oxidation catalyst that is placed between the fuel stream inlet and the anode catalyst. Introducing an air bleed to the fuel stream, however, appears to be the most effective way to reduce CO to an acceptable level. Research to find approaches and materials that better tolerate impurities in the fuel continues today. A number of technical and cost issues face polymer electrolyte fuel cells at the present stage of development (33, 36, 37, 38, 39). These concern the cell membrane, cathode performance, and cell heating limits. The membranes used in present cells are expensive, and available only in limited ranges of thickness and specific ionic conductivity. Lower-cost membranes that exhibit low resistivity are needed. This is particularly important for transportation applications characterized by high current density operation. Less expensive membranes promote lower-cost PEFCs, and thinner membranes with lower resistivities could contribute to power density improvement (39). It is estimated that the present cost of membranes could fall (by one order of magnitude) if market demand increased significantly (by two orders of magnitude) (22). There is some question of whether higher catalyst effectiveness is needed even though new research has resulted in loading being reduced to less than 1 mg/cm2. Some researchers cite a need for higher catalyst effectiveness, while others state that because only 10% of the cell material cost is tied up in catalyst, it is better to maintain high catalyst loading and instead concentrate on the design of an effective MEA (40). Improved cathode performance, when operating on air at high current densities, is needed. At high current densities, there is a limiting gas permeability and ionic conductivity within the catalyst layer. A nitrogen blanket forming on the gas side of the cathode is suspected of creating additional limitations (3). There is a need to develop a cathode that lessens the impact of the nitrogen blanket, allows an increase in cell pressure of the cell, and increases the ionic conductivity. Local heat dissipation problems limit stack operation with air at a current density of approximately 2 A/cm2. Single cells have shown the capability to operate at higher current densities on pure oxygen. It may be possible to increase current density and power density through better cooling schemes. Although not an individual cell technology issue, one developer (41) uses hot, swappable, modular power cartridge architecture. This patented technology is claimed to be more reliable because servicing can be accomplished quickly and easily by simply swapping out one cell cartridge for another, while the stack continues to create power. In addition to providing superior reliability and ease of use, the cartridge-based architecture tends to minimize the vulnerability of damage to the proton exchange membranes. The inherent advantages of this design include self-hydration, air cooling, and the ability to operate at low pressure.
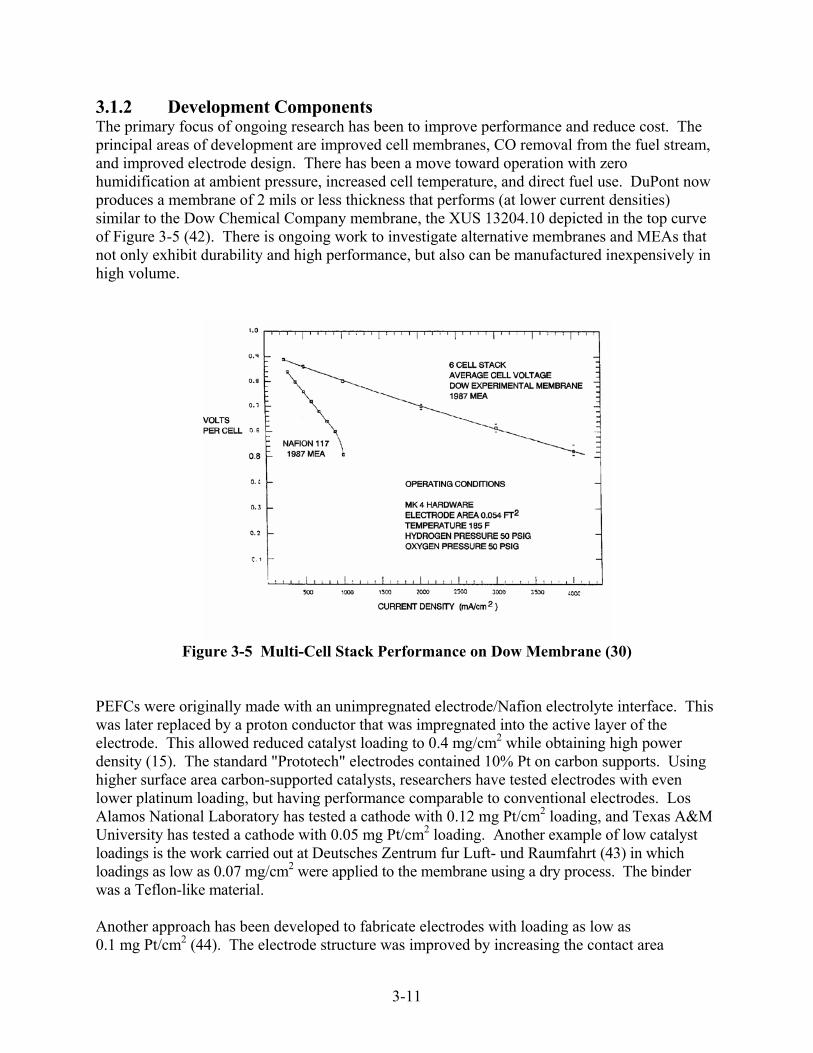
3-11
3.1.2 Development Components The primary focus of ongoing research has been to improve performance and reduce cost. The principal areas of development are improved cell membranes, CO removal from the fuel stream, and improved electrode design. There has been a move toward operation with zero humidification at ambient pressure, increased cell temperature, and direct fuel use. DuPont now produces a membrane of 2 mils or less thickness that performs (at lower current densities) similar to the Dow Chemical Company membrane, the XUS 13204.10 depicted in the top curve of Figure 3-5 (42). There is ongoing work to investigate alternative membranes and MEAs that not only exhibit durability and high performance, but also can be manufactured inexpensively in high volume.
Figure 3-5 Multi-Cell Stack Performance on Dow Membrane (30)
PEFCs were originally made with an unimpregnated electrode/Nafion electrolyte interface. This was later replaced by a proton conductor that was impregnated into the active layer of the electrode. This allowed reduced catalyst loading to 0.4 mg/cm2 while obtaining high power density (15). The standard "Prototech" electrodes contained 10% Pt on carbon supports. Using higher surface area carbon-supported catalysts, researchers have tested electrodes with even lower platinum loading, but having performance comparable to conventional electrodes. Los Alamos National Laboratory has tested a cathode with 0.12 mg Pt/cm2 loading, and Texas A&M University has tested a cathode with 0.05 mg Pt/cm2 loading. Another example of low catalyst loadings is the work carried out at Deutsches Zentrum fur Luft- und Raumfahrt (43) in which loadings as low as 0.07 mg/cm2 were applied to the membrane using a dry process. The binder was a Teflon-like material. Another approach has been developed to fabricate electrodes with loading as low as 0.1 mg Pt/cm2 (44). The electrode structure was improved by increasing the contact area
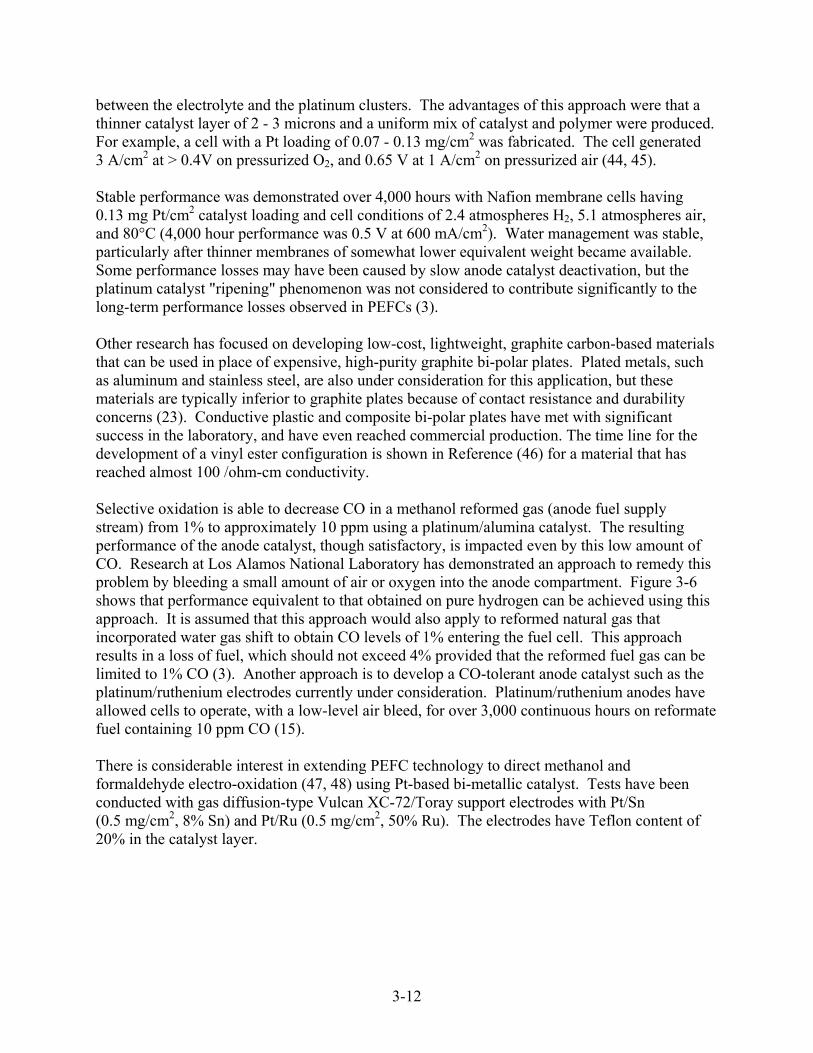
3-12
between the electrolyte and the platinum clusters. The advantages of this approach were that a thinner catalyst layer of 2 - 3 microns and a uniform mix of catalyst and polymer were produced. For example, a cell with a Pt loading of 0.07 - 0.13 mg/cm2 was fabricated. The cell generated 3 A/cm2 at > 0.4V on pressurized O2, and 0.65 V at 1 A/cm2 on pressurized air (44, 45). Stable performance was demonstrated over 4,000 hours with Nafion membrane cells having 0.13 mg Pt/cm2 catalyst loading and cell conditions of 2.4 atmospheres H2, 5.1 atmospheres air, and 80°C (4,000 hour performance was 0.5 V at 600 mA/cm2). Water management was stable, particularly after thinner membranes of somewhat lower equivalent weight became available. Some performance losses may have been caused by slow anode catalyst deactivation, but the platinum catalyst "ripening" phenomenon was not considered to contribute significantly to the long-term performance losses observed in PEFCs (3). Other research has focused on developing low-cost, lightweight, graphite carbon-based materials that can be used in place of expensive, high-purity graphite bi-polar plates. Plated metals, such as aluminum and stainless steel, are also under consideration for this application, but these materials are typically inferior to graphite plates because of contact resistance and durability concerns (23). Conductive plastic and composite bi-polar plates have met with significant success in the laboratory, and have even reached commercial production. The time line for the development of a vinyl ester configuration is shown in Reference (46) for a material that has reached almost 100 /ohm-cm conductivity. Selective oxidation is able to decrease CO in a methanol reformed gas (anode fuel supply stream) from 1% to approximately 10 ppm using a platinum/alumina catalyst. The resulting performance of the anode catalyst, though satisfactory, is impacted even by this low amount of CO. Research at Los Alamos National Laboratory has demonstrated an approach to remedy this problem by bleeding a small amount of air or oxygen into the anode compartment. Figure 3-6 shows that performance equivalent to that obtained on pure hydrogen can be achieved using this approach. It is assumed that this approach would also apply to reformed natural gas that incorporated water gas shift to obtain CO levels of 1% entering the fuel cell. This approach results in a loss of fuel, which should not exceed 4% provided that the reformed fuel gas can be limited to 1% CO (3). Another approach is to develop a CO-tolerant anode catalyst such as the platinum/ruthenium electrodes currently under consideration. Platinum/ruthenium anodes have allowed cells to operate, with a low-level air bleed, for over 3,000 continuous hours on reformate fuel containing 10 ppm CO (15). There is considerable interest in extending PEFC technology to direct methanol and formaldehyde electro-oxidation (47, 48) using Pt-based bi-metallic catalyst. Tests have been conducted with gas diffusion-type Vulcan XC-72/Toray support electrodes with Pt/Sn (0.5 mg/cm2, 8% Sn) and Pt/Ru (0.5 mg/cm2, 50% Ru). The electrodes have Teflon content of 20% in the catalyst layer.
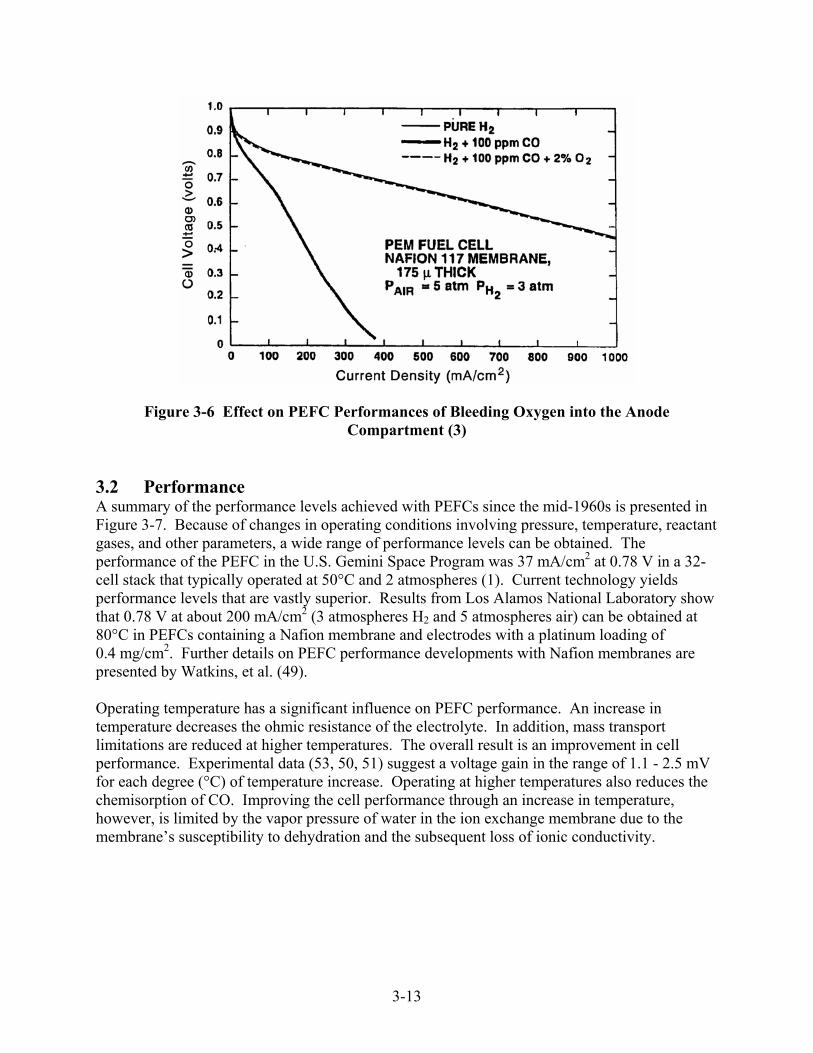
3-13
Figure 3-6 Effect on PEFC Performances of Bleeding Oxygen into the Anode Compartment (3)
3.2 Performance A summary of the performance levels achieved with PEFCs since the mid-1960s is presented in Figure 3-7. Because of changes in operating conditions involving pressure, temperature, reactant gases, and other parameters, a wide range of performance levels can be obtained. The performance of the PEFC in the U.S. Gemini Space Program was 37 mA/cm2 at 0.78 V in a 32- cell stack that typically operated at 50°C and 2 atmospheres (1). Current technology yields performance levels that are vastly superior. Results from Los Alamos National Laboratory show that 0.78 V at about 200 mA/cm2 (3 atmospheres H2 and 5 atmospheres air) can be obtained at 80°C in PEFCs containing a Nafion membrane and electrodes with a platinum loading of 0.4 mg/cm2. Further details on PEFC performance developments with Nafion membranes are presented by Watkins, et al. (49). Operating temperature has a significant influence on PEFC performance. An increase in temperature decreases the ohmic resistance of the electrolyte. In addition, mass transport limitations are reduced at higher temperatures. The overall result is an improvement in cell performance. Experimental data (53, 50, 51) suggest a voltage gain in the range of 1.1 - 2.5 mV for each degree (°C) of temperature increase. Operating at higher temperatures also reduces the chemisorption of CO. Improving the cell performance through an increase in temperature, however, is limited by the vapor pressure of water in the ion exchange membrane due to the membrane’s susceptibility to dehydration and the subsequent loss of ionic conductivity.
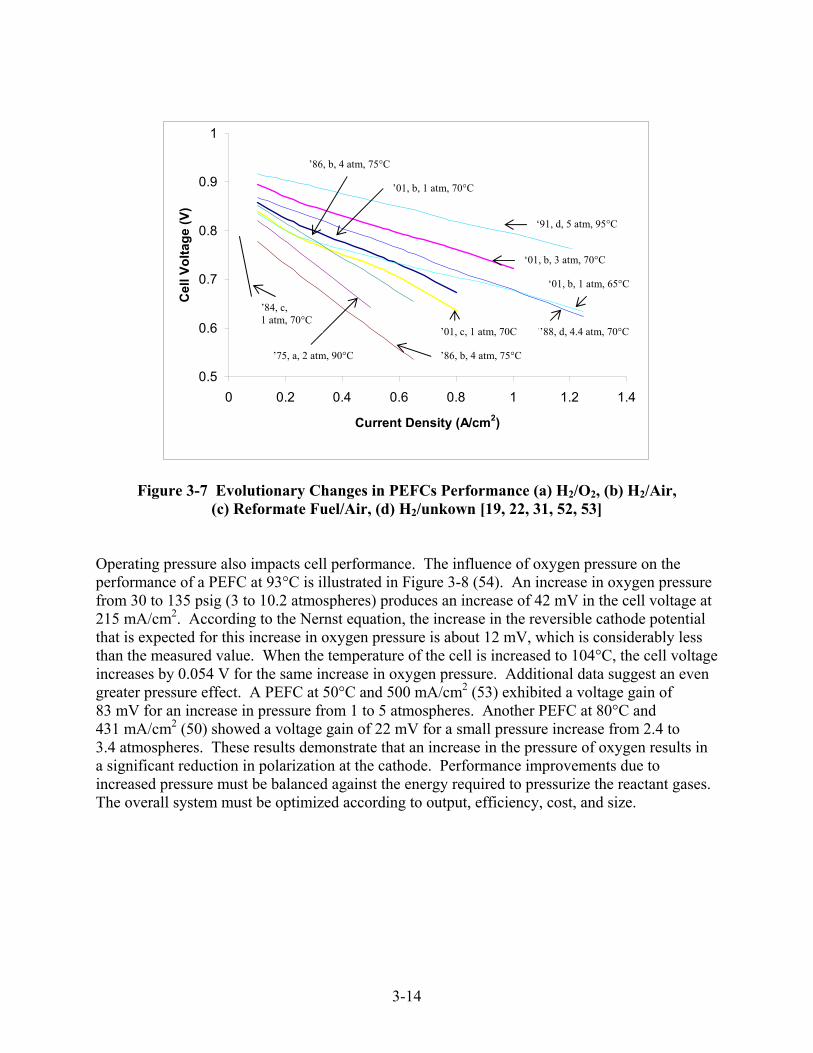
3-14
Figure 3-7 Evolutionary Changes in PEFCs Performance (a) H2/O2, (b) H2/Air, (c) Reformate Fuel/Air, (d) H2/unkown [19, 22, 31, 52, 53]
Operating pressure also impacts cell performance. The influence of oxygen pressure on the performance of a PEFC at 93°C is illustrated in Figure 3-8 (54). An increase in oxygen pressure from 30 to 135 psig (3 to 10.2 atmospheres) produces an increase of 42 mV in the cell voltage at 215 mA/cm2. According to the Nernst equation, the increase in the reversible cathode potential that is expected for this increase in oxygen pressure is about 12 mV, which is considerably less than the measured value. When the temperature of the cell is increased to 104°C, the cell voltage increases by 0.054 V for the same increase in oxygen pressure. Additional data suggest an even greater pressure effect. A PEFC at 50°C and 500 mA/cm2 (53) exhibited a voltage gain of 83 mV for an increase in pressure from 1 to 5 atmospheres. Another PEFC at 80°C and 431 mA/cm2 (50) showed a voltage gain of 22 mV for a small pressure increase from 2.4 to 3.4 atmospheres. These results demonstrate that an increase in the pressure of oxygen results in a significant reduction in polarization at the cathode. Performance improvements due to increased pressure must be balanced against the energy required to pressurize the reactant gases. The overall system must be optimized according to output, efficiency, cost, and size.
0.5
0.6
0.7
0.8
0.9
1
0 0.2 0.4 0.6 0.8 1 1.2 1.4
Current Density (A/cm2)
Cel
l Vol
tage
(V)
‘91, d, 5 atm, 95°C
‘01, b, 3 atm, 70°C
‘01, b, 1 atm, 65°C
’’88, d, 4.4 atm, 70°C
’01, b, 1 atm, 70°C
’01, c, 1 atm, 70C
’86, b, 4 atm, 75°C ’75, a, 2 atm, 90°C
’84, c, 1 atm, 70°C
’86, b, 4 atm, 75°C

3-15
Figure 3-8 Influence of O2 Pressure on PEFCs Performance (93°C, Electrode Loadings of
2 mg/cm2 Pt, H2 Fuel at 3 Atmospheres) [(54) Figure 29, p. 49] Lifetime performance degradation is a key performance parameter in a fuel cell, but the causes of degradation are not fully understood. The sources of voltage decay are kinetic (or activation) loss, ohmic (or resistive) loss, loss of mass transport, and loss of reformate tolerance (23). Presently, the major focus of R&D on PEFC technology is to develop a fuel cell for terrestrial transportation, which requires the development of low-cost cell components. Reformed methanol is expected to be a major fuel source for PEFCs in transportation applications. Because the operating temperature of PEFCs is much lower than that of PAFCs, poisoning of the anode electrocatalyst by CO from steam reformed methanol is a concern. The performance achieved with a proprietary anode in a PEFC with four different concentrations of CO in the fuel gas is shown in Figure 3-9. The graph shows that at higher current densities, the poisoning effect of CO is increased. At these higher current densities, the presence of CO in the fuel causes the cell voltage to become unstable and cycle over a wide range. Additional data (34) have suggested that the CO tolerance of a platinum electrocatalyst can be enhanced by increasing either the temperature or the pressure.

3-16
Figure 3-9 Cell Performance with Carbon Monoxide in Reformed Fuel (54) 3.3 Direct Methanol Proton Exchange Fuel Cell The large potential market for fuel cell vehicle applications has generated a strong interest in a fuel cell that can run directly on methanol. Operation on liquid fuel would assist in rapid introduction of fuel cell technology into commercial markets, because it would greatly simplify the on-board system as well as the infrastructure needed to supply fuel to passenger cars and commercial fleets. Performance levels achieved with a direct methanol PEFC using air are now in the range of 180 - 250 mA/cm2 (23). Problems with methanol crossover and high overpotentials still inhibit performance. Research has focused on finding more advanced electrolyte materials to combat fuel crossover and more active anode catalysts to promote methanol oxidation. Significant progress has been made over the past few years in both of these key areas. Improvements in solid polymer electrolyte materials have extended the operating temperature of direct methanol PEFCs from 60°C to almost 100oC. Electro-catalyst developments have focused on materials with higher activity. Researchers at the University of Newcastle upon Tyne have reported over 200 mA/cm2 at 0.3 V at 80°C with platinum/ruthenium electrodes having platinum loading of 3.0 mg/cm2. The Jet Propulsion Laboratory in the U.S. has reported over 100 mA/cm2 at 0.4 V at 60oC with platinum loading of 0.5 mg/cm2. Recent work at Johnson Matthey has clearly shown that platinum/ruthenium materials possess substantially higher activity than platinum alone (55).

3-17
All fuel cells exhibit kinetic losses that cause the electrode reactions to deviate from their theoretical ideal. This is particularly true for a direct methanol PEFC. Eliminating the need for a fuel reformer, however, makes methanol and air PEFCs an attractive alternative to PEFCs that require pure hydrogen as a fuel. The minimum performance goal for direct methanol PEFC commercialization is approximately 200 mW/cm2 at 0.5 to 0.6 V. Figure 3-10 summarizes the performance recently achieved by developers.
Figure 3-10 Single Cell Direct Methanol Fuel Cell Data (55)
3.4 References 1. A.J. Appleby, E.B. Yeager, Energy, pg. 11, 137, 1986. 2. S. Gottesfeld, T. Zawodzinski, PEFC Chapter in Advances in Electrochemical Science and
Engineering, Volume 5, edited by R. Alkire, H. Gerischer, D. Kolb, C. Tobias, pp. 197-301, 1998.
3. S. Gottesfeld, “The Polymer Electrolyte Fuel Cell: Materials Issues in a Hydrogen Fueled Power Source,” LANL, undated.
4. W.T. Grubb, Proceedings of the 11th Annual Battery Research and Development Conference, PSC Publications Committee, Red Bank, NJ, p. 5, 1957; U.S. Patent No. 2,913,511, 1959.
5. G.A. Eisman, Abstracts, “Fuel Cell Technology and Applications,” International Seminar, The Netherlands, p. 287, 1987.
6. Peter M. Schutz, A Preliminary Investigation of Radiation Catalysts in Fuel Cells, Master of Science Thesis, Virginia Polytechnic University, Blacksburg, Va., August, 1979 Pg. 59.
3-18
7. D. S. Watkins, et al., Abstracts 37th International Power Sources Symposium (The Electrochemical Society) p. 782, 1988.
8. J. C. Amphlett, M. Farahani, R. F. Mann, B. A. Peppley, P. R. Roberge, in Proceedings of the 26th Intersociety Energy Conversion Engineering Conference, August 4-9, 1991, Volume 3, Conversion Technologies/Electrochemical Conversion, American Nuclear Society, La Grange, Illinois, p. 624, 1991.
9. W. Teagan, J. Bentley, "Status: ADL/EPYX Fuel Processing Technology," Joint DOE/EPRI/GRI Workshop on Fuel Cell Technology, San Francisco, CA, May 18-20, 1998.
10. M. Krumpelt, K. M. Myles, No. 8, An EPRI/GRI Fuel Cell Workshop on Technology Research and Development, April 13-14, 1993, Stonehart Associates, Madison, Connecticut, 1993.
11. M. Krumpelt, R. Kumar, J. Miller, C. Christianson, in 1992 Fuel Cell Seminar Program and Abstracts, The Fuel Cell Seminar Organizing Committee, November 29 - December 2, 1992, Tucson, Arizona, p. 35, 1992.
12. R. F. Savinell, J. S. Wainright, M. Litt, “High Temperature Polymer Electrolyte Fuel Cells,” The Electrochemical Society, Journal 98-27, p.81.
13. W.D. Ernst, ”PEM Technology Development at Plug Power,” 2000 Fuel Cell Seminar Program and Abstracts, Portland Oregon, sponsored by Fuel Cell Seminar Organizing Committee, October 30 – November 2, 2000.
14. Gordon Research Conference, Rhode Island, July 29 - August 3, 2001. 15. T.G. Coker, A.B. LaConti, L.J. Nuttall, in Proceedings of the Symposium on Membranes and
Ionic and Electronic Conducting Polymers, edited by E.G. Yeager, B. Schumm, K. Mauritz, K. Abbey, D. Blankenship, J. Akridge, The Electrochemical Society, Inc., Pennington, NJ, p. 191, 1983.
16. N. Giordano, et al., in Proceedings 26th Intersociety Energy Conversion Engineering Conference, August 4-9, 1991, Volume 3, Conversion Technologies/Electrochemical Conversion, American Nuclear Society, La Grange, Illinois, p. 624, 1991.
17. T.A. Zawodzinski, et al., Journal of Electrochemical Society, p. 140, 1042, 1993. 18. T.E. Springer, et al., Journal of Electrochemical Society, p. 138, 2335, 1991. 19. D.M. Bernardi, Journal of Electrochemical Society, p. 137, 3344, 1990. 20. T.E. Springer, M. S. Wilson, S. Gottesfeld, "Modeling and Experimental Diagnostics in
Polymer Electrolyte Fuel Cells," submitted to J. ElectroChem. Soc., LA-UR-93-1469 Los Alamos National Laboratory, New Mexico, 1993.
21. R. Baldwin, M. Pham, A. Leonida, J. McElroy, and T. Nalette, Hydrogen-Oxygen Proton Exchange Membrane Fuel Cells and Electrolyzers, Proceedings of the Space Electrochemical Research and Technology (SERT), NASA LEWIS Research Center, Cleveland, Ohio, April, 1989.
22. D.J. Wheeler, J.S. Yi, R. Fredley, D. Yang, T. Patterson Jr., L. VanDine, “Advacements in Fuel cell Stack Technology at International Fuel Cells,” International Fuel Cells (now UTC Fuel Cells), Journal of New Materials for Electrochemical Systems, 4, 2001.
23. D. Wilkinson, A. Steck, "General Progress in the Research of Solid Polymer Fuel Cell Technology at Ballard," Proceedings of the Second International Symposium on New Materials for Fuel Cell and Modern Battery Systems, Montreal, Quebec, Canada, July 6-10, 1997.
24. Communication with Plug Power, August 2002. 25. W.D. Ernst, Patent No. 5,912,088, Plug Power Inc., June 15, 1999.

3-19
26. G.S. Eisman, et al., Patent No. 6,280,865, Plug Power Inc., August 28, 2001. 27. W.G.F. Grot, G.E. Munn, P.N. Walmsley, paper presented at the 141st National Meeting of
the Electrochemical Society, Inc., Abstract No. 154, Houston, TX, May 7-11, 1972. 28. T. Ralph, "Proton Exchange Membrane Fuel Cells: Progress in Cost Reduction of the Key
Components," Platinum Metals Review, 41, pp. 102-113, 1997. 29. B.R. Ezzell, B. Carl, and W. Mod, Ion Exchange Membranes for the Chlor Alkali Industry,
AIChE Symp. Series, Houston, TX, March 1985, Pg. 49 30. K. Prater, "The Renaissance of the Solid Polymer Fuel Cell," Ballard Power Systems, Inc.,
Journal of Power Sources, p. 29, 1990. 31. 3M Product Bulletin, date unknown. 32. S. Cleghorn, J. Kolde, W. Liu, “Catalyst Coated Composite Membranes,” Chapter 49, Fuel
Cell Reference Book, to be published, Wiley-VCH, 2002. 33. S. Gottesfeld, “Polymer Electrolyte Fuel Cells: Transportation and Stationary Application,”
No. 10, in An EPRI/GRI Fuel Cell Workshop on TechnologyResearch and Development, April 13-14, 1993, Stonehart Associates, Madison, Connecticut, 1993.
34. "Investigation of Design and Manufacturing Methods for Low-Cost Fabrication of High Efficiency, High Power Density PEM Fuel Cell Power Plant," prepared by International Fuel Cells, Final Report FCR-11320A, June 10, 1991.
35. D. Wilkinson, D. Thompsett, "Materials and Approaches for CO and CO2 Tolerance for Polymer Electrolyte Membrane Fuel Cells," Proceedings of the Second International Symposium on New Materials for Fuel Cell and Modern Battery Systems, pp. 266-285, (Montreal, Quebec, Canada, July 6-10, 1997).
36. “Information Sheet,” prepared by the U.S. Department of Energy, Office of Propulsion Systems, Proton Exchange Membrane Fuel Cell Program, DE93000009, November 1992.
37. K. Sikairi, K. Tsurumi, S. Kawaguchi, M. Watanabe, P. Stonehart, in 1992 Fuel Cell Seminar Program and Abstracts, Tucson, AZ, November 29 - December 2, 1992, sponsored by Fuel Cell Organizing Committee, p. 153, 1992.
38. S. Srinivasan, O.A. Velev, A. Parthasarathy, A.C. Ferriera, S. Mukerjee, M. Wakizoe, Y.W. Rho, Y.T. Kho, A.J. Appleby, in 1992 Fuel Cell Seminar Program and Abstracts, Tucson, Arizona November 29 - December 2, 1992, sponsored by Fuel Cell Organizing Committee, p. 619, 1992.
39. F.N. Buchi, B. Gupta, M. Rouilly, P.C. Hauser, A. Chapiro, G.G. Scherer, in 27th Intersociety Energy Conversion Engineering Conference Proceedings, Volume 3, Conversion Technologies/Electrochemical Conversions, San Diego, CA, August 3-7, 1992, published by Society of Automotive Engineers, Inc., Warrendale, PA, 419, 1992.
40. S. Srinivasan, O.A. Velev, A. Partharasarathy, D.J. Manko, and A.J. Appleby, Journal of Power Sources, 36, 299, 1991.
41. Modular Cartridge Technology™ Fact Sheet, prepared for 6th Edition of the Fuel Cell Handbook, Avista Labs, a subsidiary of Avista Corp., August, 2002.
42. T.A. Zawodzinski, T.A. Springer, F. Uribe, S. Gottesfeld, "Characterization of Polymer Electrolytes for Fuel Cell Applications," Solid State Tonics 60, pp. 199-211, North-Holland, 1993.
43. E. Gulzow, M. Schulze, N. Wagner, et al., J. of Power Sources Vol. 86 pages 352-362, 2000. 44. M.S. Wilson, T.E. Springer, T.A. Zawodzinski, S. Gottesfeld, in 26th Intersociety Energy
Conversion Engineering Conference Proceedings, Volume 3, Conversion
3-20
Technologies/Electrochemical Conversion, Boston, Massachusetts, August 4-9, 1991, published by Society of Automotive Engineers, Inc., Warrendale, PA, 1991.
45. C. Derouin, T. Springer, F. Uribe, J. Valerio, M. Wilson, T. Zawodzinski, S. Gottesfeld, in 1992 Fuel Cell Seminar Program and Abstracts, Tucson AZ, November 29 - December 2, 1992, sponsored by Fuel Cell Organizing Committee, p. 615, 1992.
46. J.G. Clulow, F.E. Zappitelli, C.M. Carlstrom, J.L. Zemsky, D.M. Buskirk, M.S. Wilson, “Development of Vinyl Ester/ Graphite Composite Bipolar Plates,” Fuel Cell Technology: Opportunites and Challenges, 2002 AIChE Spring National Meeting, March 10-14, 2002.
47. P.D. Naylor, P.J. Mitchell, P.L. Adcock, in 1992 Fuel Cell Seminar Program and Abstracts, Tucson, AZ, November 29 - December 2, 1992, sponsored by Fuel Cell Organizing Committee, 575, 1992.
48. S.R. Narayanan, E. Vamos, H. Frank, S. Surampudi, G. Halpert, in 1992 Fuel Cell Seminar Program and Abstracts, Tucson, AZ, November 29 - December 2, 1992, sponsored by Fuel Cell Organizing Committee, p. 233, 1992.
49. D. Watkins, K. Dircks, E. Epp, A. Harkness, Proceedings of the 32nd International Power Sources Symposium, The Electrochemical Society, Inc., Pennington, NJ, p. 590, 1986.
50. J.C. Amphlett, et al., "The Operation of a Solid Polymer Fuel Cell: A Parametric Model," Royal Military College of Canada, no date.
51. K. Ledjeff, et al., "Low Cost Membrane Fuel Cell for Low Power Applications," Fraunhofer-Institute for Solar Energy Systems, Program and Abstracts, 1992 Fuel Cell Seminar.
52. J. R. Huff, "Status of Fuel Cell Technologies," Fuel Cell Seminar Abstracts, Fuel Cell Seminar, October 26-29, 1986, Tucson, AZ.
53. J. Srmivason, et al., "High Energy Efficiency and High Power Density Proton Exchange Membrane Fuel Cells - Electrode Kinetics and Mass Transport," Journal of Power Sources, p. 36, 1991
54. LaConti, G. Smarz, F. Sribnik, "New Membrane-Catalyst for Solid Polymer Electrolyte Systems," Final Report prepared by Electro-Chem Products, Hamilton Standard for Los Alamos National Laboratory under Contract No. 9-X53-D6272-1, 1986.
55. M. Hogarth, G. Hards, "Direct Methanol Fuel Cells: Technological Advances and Further Requirements," Platinum Metals Review, 40, pp. 150-159, 1996.
4-1
4. ALKALINE FUEL CELL
The Alkaline Fuel Cell (AFC) was one of the first modern fuel cells to be developed, beginning in 1960. The application at that time was to provide on-board electric power for the Apollo space vehicle. Desirable attributes of the AFC include excellent performance compared to other candidate fuel cells due to its active O2 electrode kinetics and flexibility to use a wide range of electrocatalysts. The AFC continues to be used: it now provides on-board power for the Space Shuttle Orbiter with cells manufactured by UTC Fuel Cells. The AFC developed for space application was based, in large part, on work initiated by F.T. Bacon (1) in the 1930s. By 1952, construction and performance testing of a 5-kW alkaline fuel cell, operating on H2 and O2, was completed. The fuel cell developed by Bacon operated at 200-240oC with 45% KOH electrolyte. Pressure was maintained at 40 to 55 atm to prevent the electrolyte from boiling. At this relatively high temperature and pressure, performance of the cell was quite good (0.78 volts at 800 mA/cm2). The anode consisted of a dual-porosity Ni electrode (two-layer structure with porous Ni of 16 µm maximum pore diameter on the electrolyte side and 30 µm pore diameter on the gas side). The cathode consisted of a porous structure of lithiated NiO. The three-phase boundary in the porous electrodes was maintained by a differential gas pressure across the electrode, since a wetproofing agent was not available at that time, i.e., PTFE (polytetrafluoroethylene) as a wetproofing material did not exist, and it would not have been stable in the high temperature alkaline solution (2). The kinetics of O2 reduction in alkaline electrolytes are more favorable than in phosphoric acid. Consider a Pt cathode (0.25 mg/cm2) in 30% KOH at 70°C and in 96% phosphoric acid at 165°C. The cathode potentials (vs. RHE - Reversible Hydrogen Electrode) at 100 mA/cm2 in these two electrolytes are 0.868 and 0.730 V, respectively, according to data reported by Appleby (Figure 2.15-1 in Reference 3). Various explanations have been advanced for the higher O2 reduction rates in alkaline electrolytes (4). The practical consequence of the higher performance of Pt cathodes in alkaline electrolytes is that AFCs are capable of higher efficiencies than PAFCs at a given current density, or higher power densities at the same efficiency. Bockris (2) estimates that the efficiency of AFCs fueled by pure H2 is about 60% HHV, and that of PAFCs is about 50% HHV. The high performance of the alkaline cell relative to phosphoric acid and other cells leads to the plausibility of developing the technology for terrestrial application. The leading developer of alkaline technology for space application, UTC Fuel Cells, investigated adaptating the
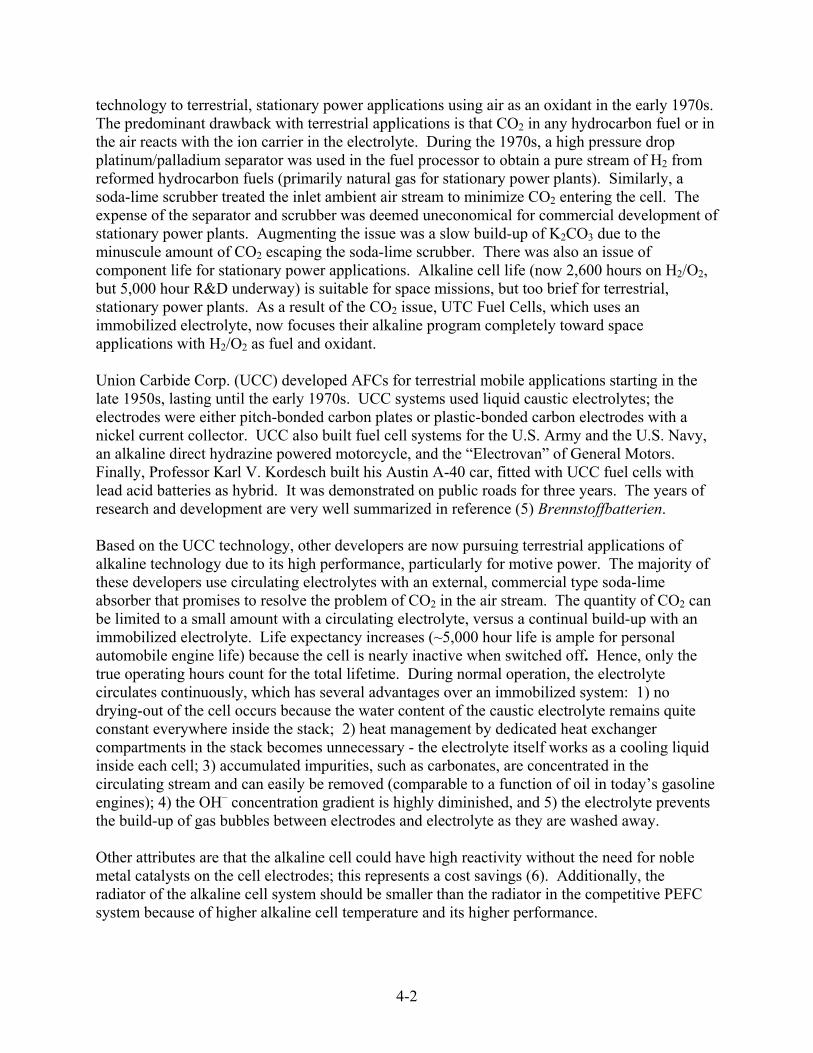
4-2
technology to terrestrial, stationary power applications using air as an oxidant in the early 1970s. The predominant drawback with terrestrial applications is that CO2 in any hydrocarbon fuel or in the air reacts with the ion carrier in the electrolyte. During the 1970s, a high pressure drop platinum/palladium separator was used in the fuel processor to obtain a pure stream of H2 from reformed hydrocarbon fuels (primarily natural gas for stationary power plants). Similarly, a soda-lime scrubber treated the inlet ambient air stream to minimize CO2 entering the cell. The expense of the separator and scrubber was deemed uneconomical for commercial development of stationary power plants. Augmenting the issue was a slow build-up of K2CO3 due to the minuscule amount of CO2 escaping the soda-lime scrubber. There was also an issue of component life for stationary power applications. Alkaline cell life (now 2,600 hours on H2/O2, but 5,000 hour R&D underway) is suitable for space missions, but too brief for terrestrial, stationary power plants. As a result of the CO2 issue, UTC Fuel Cells, which uses an immobilized electrolyte, now focuses their alkaline program completely toward space applications with H2/O2 as fuel and oxidant. Union Carbide Corp. (UCC) developed AFCs for terrestrial mobile applications starting in the late 1950s, lasting until the early 1970s. UCC systems used liquid caustic electrolytes; the electrodes were either pitch-bonded carbon plates or plastic-bonded carbon electrodes with a nickel current collector. UCC also built fuel cell systems for the U.S. Army and the U.S. Navy, an alkaline direct hydrazine powered motorcycle, and the “Electrovan” of General Motors. Finally, Professor Karl V. Kordesch built his Austin A-40 car, fitted with UCC fuel cells with lead acid batteries as hybrid. It was demonstrated on public roads for three years. The years of research and development are very well summarized in reference (5) Brennstoffbatterien. Based on the UCC technology, other developers are now pursuing terrestrial applications of alkaline technology due to its high performance, particularly for motive power. The majority of these developers use circulating electrolytes with an external, commercial type soda-lime absorber that promises to resolve the problem of CO2 in the air stream. The quantity of CO2 can be limited to a small amount with a circulating electrolyte, versus a continual build-up with an immobilized electrolyte. Life expectancy increases (~5,000 hour life is ample for personal automobile engine life) because the cell is nearly inactive when switched off. Hence, only the true operating hours count for the total lifetime. During normal operation, the electrolyte circulates continuously, which has several advantages over an immobilized system: 1) no drying-out of the cell occurs because the water content of the caustic electrolyte remains quite constant everywhere inside the stack; 2) heat management by dedicated heat exchanger compartments in the stack becomes unnecessary - the electrolyte itself works as a cooling liquid inside each cell; 3) accumulated impurities, such as carbonates, are concentrated in the circulating stream and can easily be removed (comparable to a function of oil in today’s gasoline engines); 4) the OH– concentration gradient is highly diminished, and 5) the electrolyte prevents the build-up of gas bubbles between electrodes and electrolyte as they are washed away. Other attributes are that the alkaline cell could have high reactivity without the need for noble metal catalysts on the cell electrodes; this represents a cost savings (6). Additionally, the radiator of the alkaline cell system should be smaller than the radiator in the competitive PEFC system because of higher alkaline cell temperature and its higher performance.
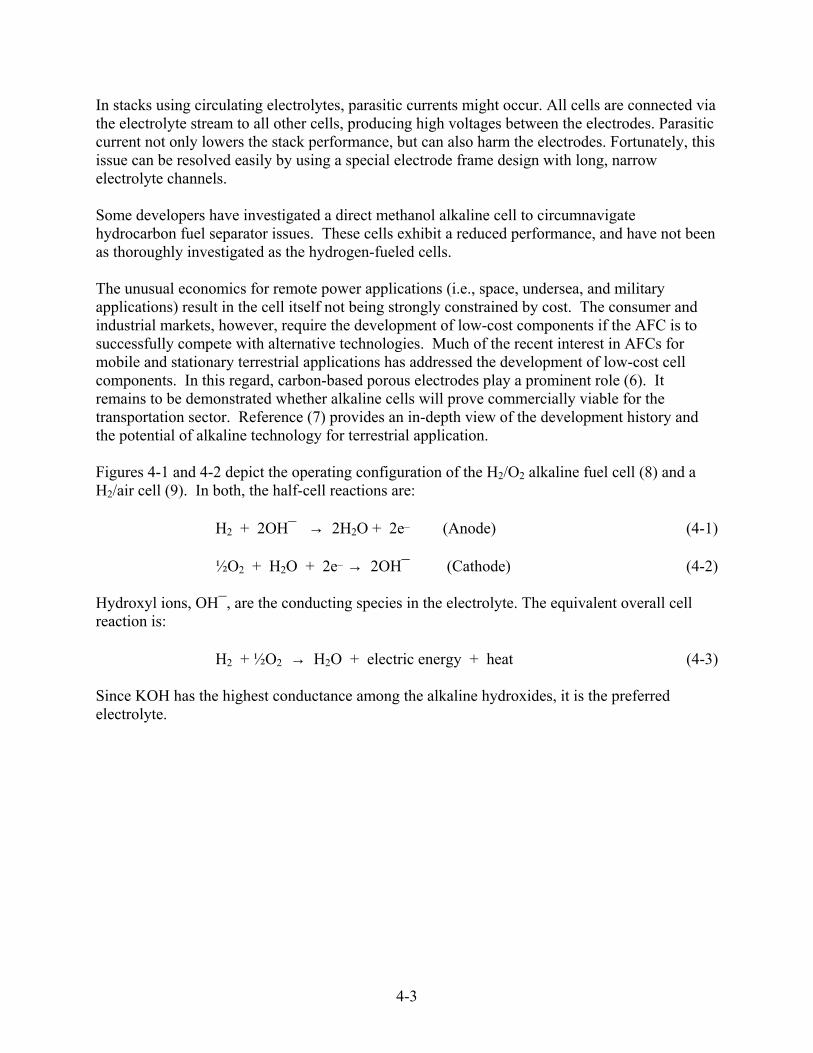
4-3
In stacks using circulating electrolytes, parasitic currents might occur. All cells are connected via the electrolyte stream to all other cells, producing high voltages between the electrodes. Parasitic current not only lowers the stack performance, but can also harm the electrodes. Fortunately, this issue can be resolved easily by using a special electrode frame design with long, narrow electrolyte channels. Some developers have investigated a direct methanol alkaline cell to circumnavigate hydrocarbon fuel separator issues. These cells exhibit a reduced performance, and have not been as thoroughly investigated as the hydrogen-fueled cells. The unusual economics for remote power applications (i.e., space, undersea, and military applications) result in the cell itself not being strongly constrained by cost. The consumer and industrial markets, however, require the development of low-cost components if the AFC is to successfully compete with alternative technologies. Much of the recent interest in AFCs for mobile and stationary terrestrial applications has addressed the development of low-cost cell components. In this regard, carbon-based porous electrodes play a prominent role (6). It remains to be demonstrated whether alkaline cells will prove commercially viable for the transportation sector. Reference (7) provides an in-depth view of the development history and the potential of alkaline technology for terrestrial application. Figures 4-1 and 4-2 depict the operating configuration of the H2/O2 alkaline fuel cell (8) and a H2/air cell (9). In both, the half-cell reactions are:
H2 + 2OH¯ → 2H2O + 2e¯ (Anode) (4-1)
½O2 + H2O + 2e¯ → 2OH¯ (Cathode) (4-2) Hydroxyl ions, OH¯, are the conducting species in the electrolyte. The equivalent overall cell reaction is:
H2 + ½O2 → H2O + electric energy + heat (4-3)
Since KOH has the highest conductance among the alkaline hydroxides, it is the preferred electrolyte.

4-4
ANODEMATRIX
CATHODE
O2 in
H2 recycle carryingproduct water
H2 FEED INLETS
Humidified H2 in
ELECTROLYTE RESERVOIR PLATE - ERP(POROUS NICKEL-SINTER)
ELECTRODECATALYST
Figure 4-1 Principles of Operation of H2/O2 Alkaline Fuel Cell, Immobilized Electrolyte (8)
Figure 4-2 Principles of Operation of H2/Air Alkaline Fuel Cell, Circulating Electrolyte (9)
4-5
4.1 Cell Components 4.1.1 State-of-the-Art Components The concentration of KOH in an immobilized electrolyte typically used in the space program varies from 35-50 wt% KOH for low temperature (<120°C) operation to 85 wt% KOH in cells designed for operation at high temperature (~260°C). The electrolyte is retained in a matrix (usually asbestos), and a wide range of electrocatalysts can be used (e.g., Ni, Ag, metal oxides, spinels, and noble metals) to promote reaction. The cylindrical AFC modules used in the U.S. Apollo Space Program had a 57 cm diameter, a 112 cm height, weighed about 110 kg, produced a peak power of 1.42 kW at 27-31 V, and operated at an average power of 0.6 kW. These cells operated on pure H2 and O2 and concentrated electrolyte (85% KOH) at a moderate pressure (4 atmospheres reactant gas pressure) without electrolyte boiling. With this concentrated electrolyte, cell performance was not as high as in the less-concentrated electrolyte; consequently, the operating temperature was increased to 260oC. The typical performance of this AFC cell was 0.85 V at 150 mA/cm2, comparing favorably to the performance of the Bacon cell operating at about 10 times higher pressure. The state-of-the-art alkaline fuel cell stacks in the Space Shuttle Orbiter are rectangular with a width of 38 cm, a length of 114 cm, and a height of 35 cm. They weigh 118 kg, produce a peak power of 12 kW at a minimum of 27.5 V (end of life), and operate at an average power of 7 kW. They operate in the same pressure range as the Apollo cells (4 atmospheres), but at a lower temperature (85 to 95°C) and higher current density (0.88 V at 470 mA/cm2; UTC Fuel Cells has demonstrated 3.4 W/cm2 at 0.8 V and 4,300 mA/cm2, Reference (8)). The electrodes contain high loadings of noble metals: 80% Pt - 20% Pd anodes are loaded at 10 mg/cm2 on Ag-plated Ni screen; 90% Au - 10% Pt cathodes are loaded at 20 mg/cm2 on Ag-plated Ni screen. Both are bonded with PTFE to achieve high performance at the lower temperature of 85-95oC. A wide variety of materials (e.g., potassium titanate, ceria, asbestos, zirconium phosphate gel) have been used in the micro-porous separators for AFCs. The electrolyte is 35% KOH and is replenished via a reservoir on the anode side. Gold-plated magnesium is used for the bipolar plates. Sheibley and Martin (10) provide a brief survey of the advanced technology components in AFCs for space applications. An advanced cell configuration for underwater application was developed using high surface area Raney nickel anodes loaded at 120 mg/cm2 (1-2% Ti) and Raney silver cathodes loaded at 60 mg/cm2 containing small amounts of Ni, Bi, and Ti (11). The efforts of Union Carbide Corporation has formed the basis for most of today’s terrestrial applications of AFCs with circulating liquid electrolytes. Companies like Da Capo Fuel Cell Ltd. (which bought ZeTek Power (formerly Zevco and Elenco)), Astris Energy, and Apollo Energy System Inc. are developing circulating electrolyte cells for motive and backup power primarily based on that technology. A typical configuration (Apollo, Figure 4-2) uses carbon-based plastic-bonded gas diffusion electrodes with a current collector (nickel) inside. Due to the ease of preparation, the electrodes in present stacks use noble metals loaded to less than 0.5mg/cm2. The 0.3 cm thick cells are stacked in a monopolar order and are commonly
4-6
connected in series via edge connectors. Neither membranes nor bipolar plates are needed. The stacks operate at 75°C, using a 9N KOH electrolyte. The gases are fed at ambient pressure; either pure hydrogen or cracked ammonia is used. Lifetime testing (12) has not been finished, but is >1,000 hours at intermittent operation (a few hours per day). Several types of catalysts are used or are being considered for the electrodes: 1) noble metals (expensive but simple, and acceptable for low volume stack preparation); 2) “classic” non-noble metals (Silver for the cathode and Raney Nickel for the anode), and 3) spinels and perovskites (often referred to as alternative catalysts, these are being developed because they cost less than the noble metal catalysts). 4.1.2 Development Components Immobilized electrolyte AFCs, used mostly in space or closed environments, and circulating electrolyte AFCs, used for terrestrial application, face separate and unique development challenges. H2/O2 alkaline technology using immobilized electrolytes is considered to be fully developed. Confidence in the present cell technology is best represented by the fact that there is no back-up electric power on the Space Shuttle Orbiter. Further improvement of the present H2/O2 design is not considered to be cost effective with one exception: maintenance cost can be decreased directly by increasing the cell stack life of the Orbiter power plant. The life-limiting event in the present Orbiter cell is KOH corrosion of the cell frame (cell support). Present stack life is 2,600 hours. The cell stacks have demonstrated capability to reach this life in 110 flights and a total of ~87,000 hours in the Orbiter (July 2002). Present practice is to refurbish the power unit at 2,600 hours by installing a new stack, and cleaning and inspecting the balance of equipment. The stack life is being improved to 5,000 hours by elongating the path length associated with KOH-induced corrosion of the cell frame. A 10 cell short stack has demonstrated the new 5,000 hours concept. The concept is now being qualified in a complete power plant, presently being tested (13). Electrode development in circulating electrolyte AFCs has concentrated on 1) multi-layered structures with porosity characteristics optimized for flow of liquid electrolytes and gases (H2 and air), and 2) catalyst development. Another area for concern is the instability of PTFE, which causes weeping of the electrodes. Most developers use noble metal catalysts; some use non-noble catalysts. Spinels and perovskites are being developed in an attempt to lower the cost of the electrodes. Development of low-cost manufacturing processes includes powder mixing and pressing of carbon-based electrodes, sedimentation and spraying, and high-temperature sintering. AFC electrolyte development has been restricted to KOH water solutions with concentrations ranging from 6-12N. Still, use of less expensive NaOH has been considered. Minimal cost advantages appear to be far outweighed by performance reductions due to wetting angle and lower conductivity. However, NaOH as an electrolyte increases the lifetime of electrodes when CO2 is present, because sodium carbonate, although less soluble than potassium carbonate, forms much smaller crystals, which do not harm the carbon pores.
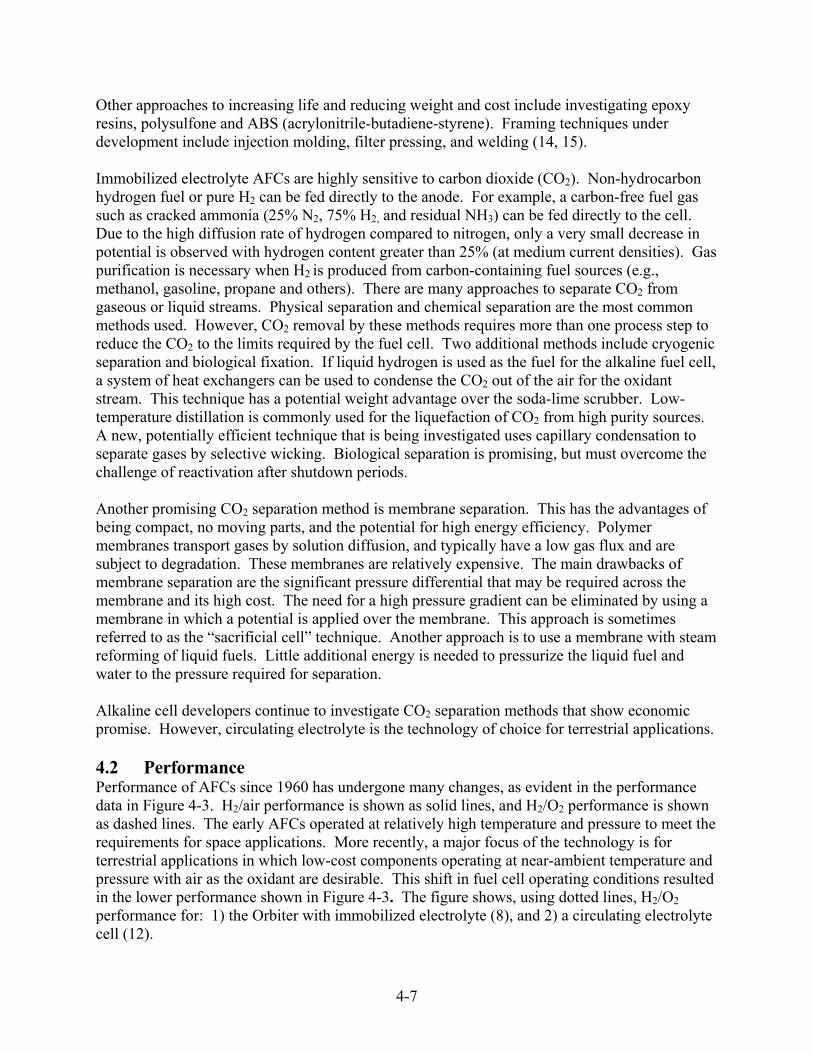
4-7
Other approaches to increasing life and reducing weight and cost include investigating epoxy resins, polysulfone and ABS (acrylonitrile-butadiene-styrene). Framing techniques under development include injection molding, filter pressing, and welding (14, 15). Immobilized electrolyte AFCs are highly sensitive to carbon dioxide (CO2). Non-hydrocarbon hydrogen fuel or pure H2 can be fed directly to the anode. For example, a carbon-free fuel gas such as cracked ammonia (25% N2, 75% H2, and residual NH3) can be fed directly to the cell. Due to the high diffusion rate of hydrogen compared to nitrogen, only a very small decrease in potential is observed with hydrogen content greater than 25% (at medium current densities). Gas purification is necessary when H2
is produced from carbon-containing fuel sources (e.g., methanol, gasoline, propane and others). There are many approaches to separate CO2 from gaseous or liquid streams. Physical separation and chemical separation are the most common methods used. However, CO2 removal by these methods requires more than one process step to reduce the CO2 to the limits required by the fuel cell. Two additional methods include cryogenic separation and biological fixation. If liquid hydrogen is used as the fuel for the alkaline fuel cell, a system of heat exchangers can be used to condense the CO2 out of the air for the oxidant stream. This technique has a potential weight advantage over the soda-lime scrubber. Low-temperature distillation is commonly used for the liquefaction of CO2 from high purity sources. A new, potentially efficient technique that is being investigated uses capillary condensation to separate gases by selective wicking. Biological separation is promising, but must overcome the challenge of reactivation after shutdown periods. Another promising CO2 separation method is membrane separation. This has the advantages of being compact, no moving parts, and the potential for high energy efficiency. Polymer membranes transport gases by solution diffusion, and typically have a low gas flux and are subject to degradation. These membranes are relatively expensive. The main drawbacks of membrane separation are the significant pressure differential that may be required across the membrane and its high cost. The need for a high pressure gradient can be eliminated by using a membrane in which a potential is applied over the membrane. This approach is sometimes referred to as the “sacrificial cell” technique. Another approach is to use a membrane with steam reforming of liquid fuels. Little additional energy is needed to pressurize the liquid fuel and water to the pressure required for separation. Alkaline cell developers continue to investigate CO2 separation methods that show economic promise. However, circulating electrolyte is the technology of choice for terrestrial applications. 4.2 Performance Performance of AFCs since 1960 has undergone many changes, as evident in the performance data in Figure 4-3. H2/air performance is shown as solid lines, and H2/O2 performance is shown as dashed lines. The early AFCs operated at relatively high temperature and pressure to meet the requirements for space applications. More recently, a major focus of the technology is for terrestrial applications in which low-cost components operating at near-ambient temperature and pressure with air as the oxidant are desirable. This shift in fuel cell operating conditions resulted in the lower performance shown in Figure 4-3. The figure shows, using dotted lines, H2/O2 performance for: 1) the Orbiter with immobilized electrolyte (8), and 2) a circulating electrolyte cell (12).
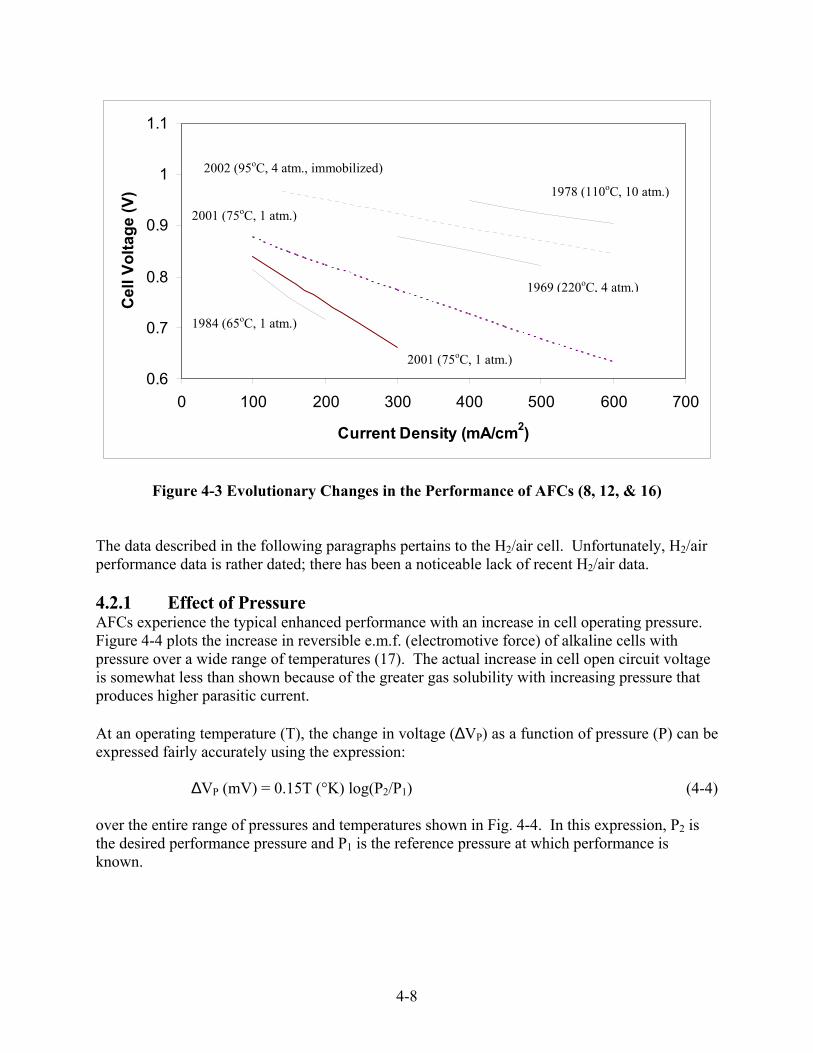
4-8
0.6
0.7
0.8
0.9
1
1.1
0 100 200 300 400 500 600 700
Current Density (mA/cm2)
Cel
l Vol
tage
(V)
1969 (220oC, 4 atm.)
1984 (65oC, 1 atm.)
1978 (110oC, 10 atm.)
2002 (95oC, 4 atm., immobilized)
2001 (75oC, 1 atm.)
2001 (75oC, 1 atm.)
Figure 4-3 Evolutionary Changes in the Performance of AFCs (8, 12, & 16) The data described in the following paragraphs pertains to the H2/air cell. Unfortunately, H2/air performance data is rather dated; there has been a noticeable lack of recent H2/air data. 4.2.1 Effect of Pressure AFCs experience the typical enhanced performance with an increase in cell operating pressure. Figure 4-4 plots the increase in reversible e.m.f. (electromotive force) of alkaline cells with pressure over a wide range of temperatures (17). The actual increase in cell open circuit voltage is somewhat less than shown because of the greater gas solubility with increasing pressure that produces higher parasitic current. At an operating temperature (T), the change in voltage (∆VP) as a function of pressure (P) can be expressed fairly accurately using the expression: ∆VP (mV) = 0.15T (°K) log(P2/P1) (4-4) over the entire range of pressures and temperatures shown in Fig. 4-4. In this expression, P2 is the desired performance pressure and P1 is the reference pressure at which performance is known.
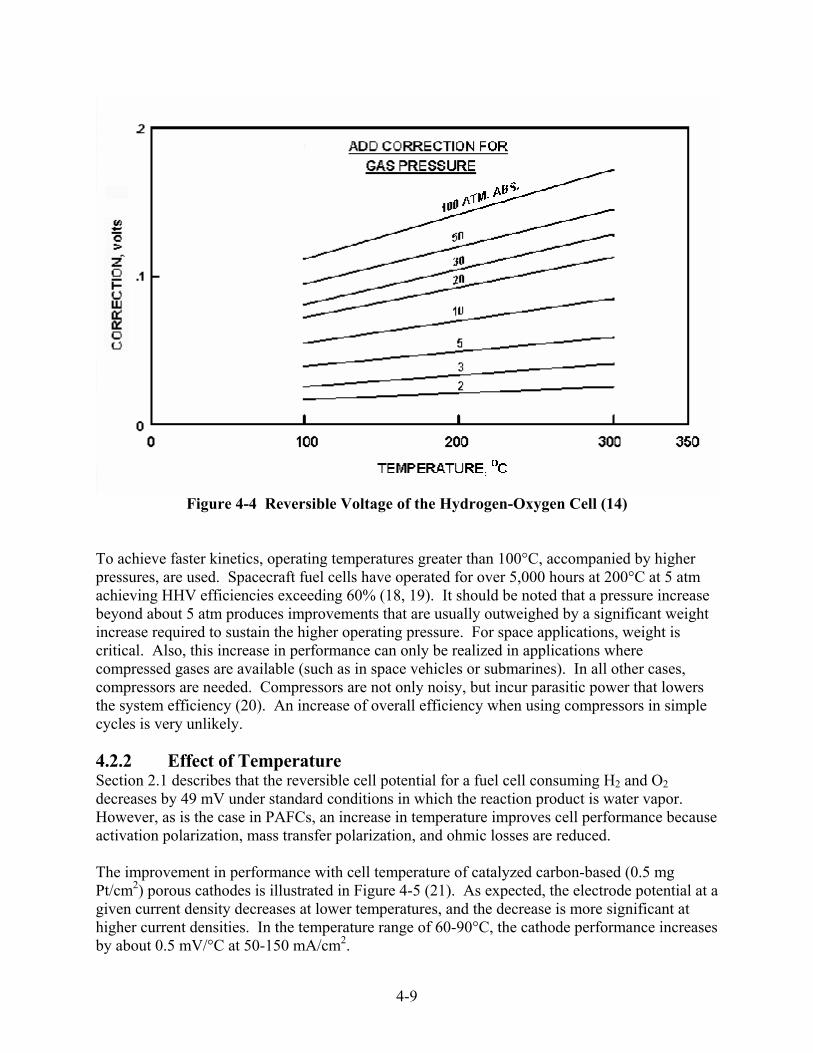
4-9
Figure 4-4 Reversible Voltage of the Hydrogen-Oxygen Cell (14) To achieve faster kinetics, operating temperatures greater than 100°C, accompanied by higher pressures, are used. Spacecraft fuel cells have operated for over 5,000 hours at 200°C at 5 atm achieving HHV efficiencies exceeding 60% (18, 19). It should be noted that a pressure increase beyond about 5 atm produces improvements that are usually outweighed by a significant weight increase required to sustain the higher operating pressure. For space applications, weight is critical. Also, this increase in performance can only be realized in applications where compressed gases are available (such as in space vehicles or submarines). In all other cases, compressors are needed. Compressors are not only noisy, but incur parasitic power that lowers the system efficiency (20). An increase of overall efficiency when using compressors in simple cycles is very unlikely. 4.2.2 Effect of Temperature Section 2.1 describes that the reversible cell potential for a fuel cell consuming H2 and O2 decreases by 49 mV under standard conditions in which the reaction product is water vapor. However, as is the case in PAFCs, an increase in temperature improves cell performance because activation polarization, mass transfer polarization, and ohmic losses are reduced. The improvement in performance with cell temperature of catalyzed carbon-based (0.5 mg Pt/cm2) porous cathodes is illustrated in Figure 4-5 (21). As expected, the electrode potential at a given current density decreases at lower temperatures, and the decrease is more significant at higher current densities. In the temperature range of 60-90°C, the cathode performance increases by about 0.5 mV/°C at 50-150 mA/cm2.

4-10
Figure 4-5 Influence of Temperature on O2, (air) Reduction in 12 N KOH.
Source: Fig. 10, p. 324, Reference (21). Early data by Clark, et al. (22) indicated a temperature coefficient for AFCs operating between 50-70°C of about 3 mV/°C at 50 mA/cm2, and cells with higher polarization had higher temperature coefficients under load. Later measurements by McBreen, et al. (23) on H2/air single cells (289 cm2 active area, carbon-based Pd anode and Pt cathode) with 50% KOH showed that the temperature coefficient above 60°C was considerably lower than that obtained at lower temperatures, as shown in Figure 4-6. The McBreen data suggest the following expressions for evaluating the change in voltage (∆VT) as a function of temperature (T) at 100 mA/cm2: ∆Vt (mV) = 4.0 (T2-T1) for T < 63°C (4-5) or ∆Vt (mV) = 0.7 (T2-T1) for T > 63°C (4-6) Alkaline cells exhibit reasonable performance when operating at low temperatures (room temperature up to about 70°C). This is because the conductivity of KOH solutions is relatively high at low temperatures. For instance, an alkaline fuel cell designed to operate at 70°C will reduce to only half power level when its operating temperature is reduced to room temperature (24).
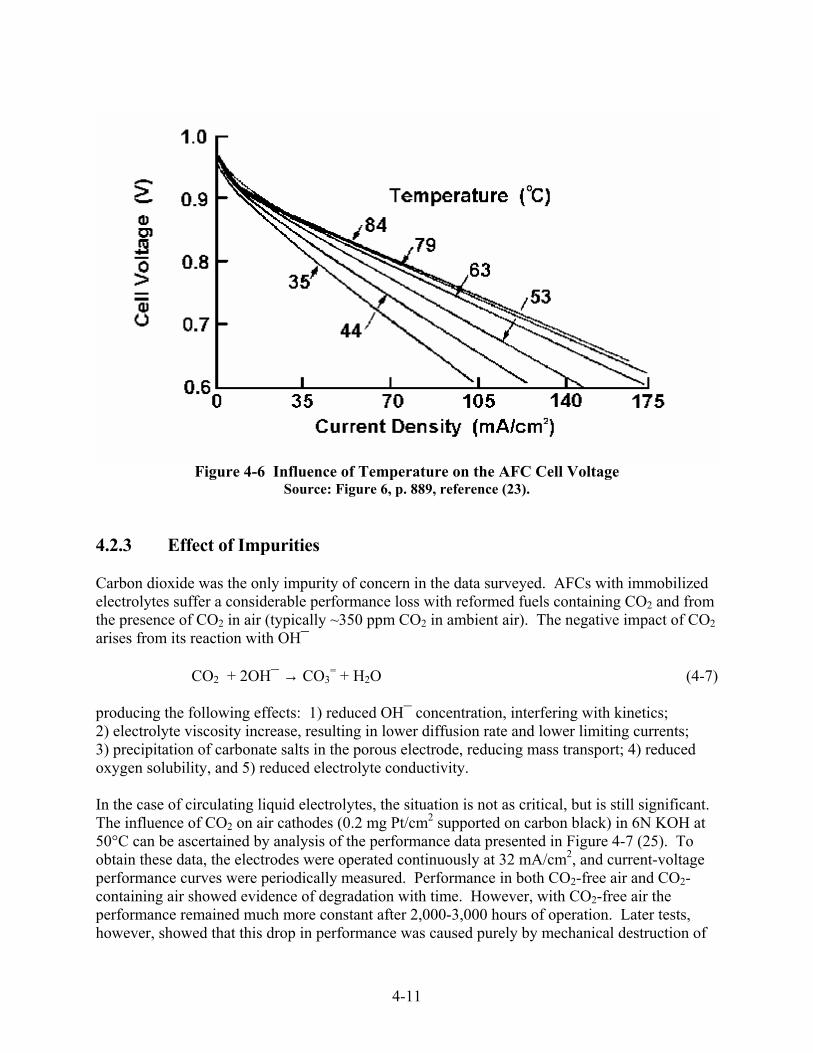
4-11
Figure 4-6 Influence of Temperature on the AFC Cell Voltage
Source: Figure 6, p. 889, reference (23). 4.2.3 Effect of Impurities Carbon dioxide was the only impurity of concern in the data surveyed. AFCs with immobilized electrolytes suffer a considerable performance loss with reformed fuels containing CO2 and from the presence of CO2 in air (typically ~350 ppm CO2 in ambient air). The negative impact of CO2 arises from its reaction with OH¯ CO2 + 2OH¯ → CO3
= + H2O (4-7) producing the following effects: 1) reduced OH¯ concentration, interfering with kinetics; 2) electrolyte viscosity increase, resulting in lower diffusion rate and lower limiting currents; 3) precipitation of carbonate salts in the porous electrode, reducing mass transport; 4) reduced oxygen solubility, and 5) reduced electrolyte conductivity. In the case of circulating liquid electrolytes, the situation is not as critical, but is still significant. The influence of CO2 on air cathodes (0.2 mg Pt/cm2 supported on carbon black) in 6N KOH at 50°C can be ascertained by analysis of the performance data presented in Figure 4-7 (25). To obtain these data, the electrodes were operated continuously at 32 mA/cm2, and current-voltage performance curves were periodically measured. Performance in both CO2-free air and CO2-containing air showed evidence of degradation with time. However, with CO2-free air the performance remained much more constant after 2,000-3,000 hours of operation. Later tests, however, showed that this drop in performance was caused purely by mechanical destruction of
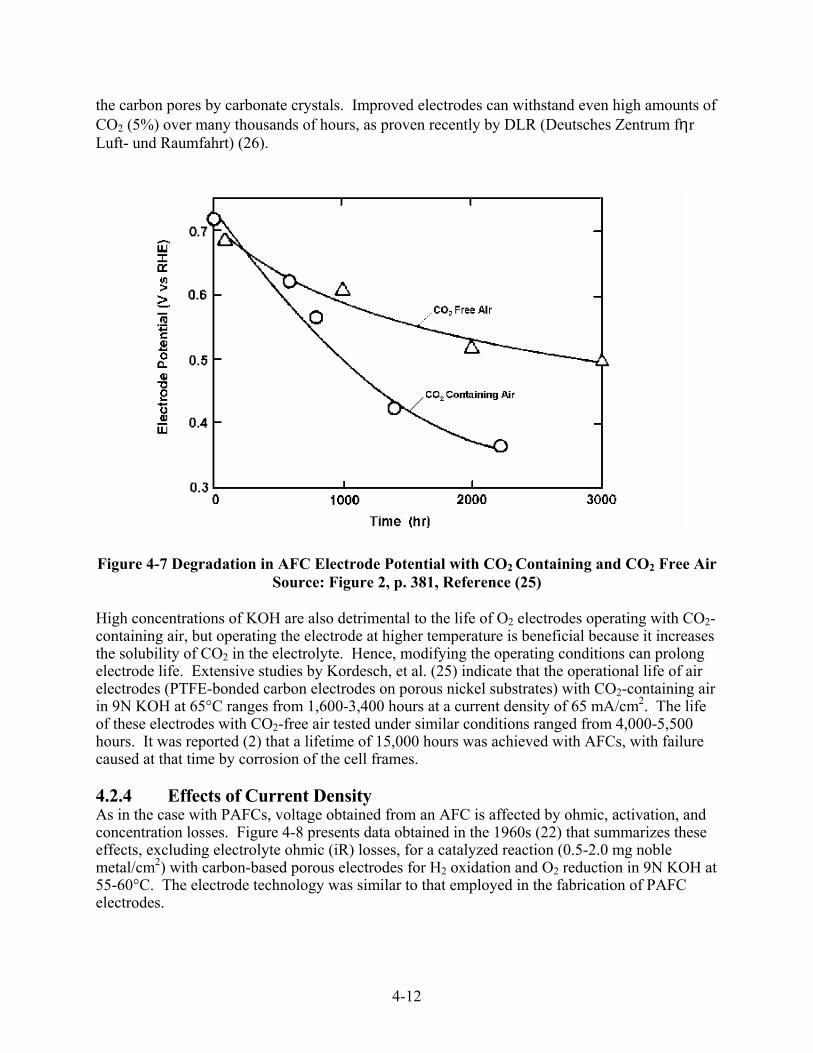
4-12
the carbon pores by carbonate crystals. Improved electrodes can withstand even high amounts of CO2 (5%) over many thousands of hours, as proven recently by DLR (Deutsches Zentrum fηr Luft- und Raumfahrt) (26).
Figure 4-7 Degradation in AFC Electrode Potential with CO2 Containing and CO2 Free Air
Source: Figure 2, p. 381, Reference (25) High concentrations of KOH are also detrimental to the life of O2 electrodes operating with CO2-containing air, but operating the electrode at higher temperature is beneficial because it increases the solubility of CO2 in the electrolyte. Hence, modifying the operating conditions can prolong electrode life. Extensive studies by Kordesch, et al. (25) indicate that the operational life of air electrodes (PTFE-bonded carbon electrodes on porous nickel substrates) with CO2-containing air in 9N KOH at 65°C ranges from 1,600-3,400 hours at a current density of 65 mA/cm2. The life of these electrodes with CO2-free air tested under similar conditions ranged from 4,000-5,500 hours. It was reported (2) that a lifetime of 15,000 hours was achieved with AFCs, with failure caused at that time by corrosion of the cell frames. 4.2.4 Effects of Current Density As in the case with PAFCs, voltage obtained from an AFC is affected by ohmic, activation, and concentration losses. Figure 4-8 presents data obtained in the 1960s (22) that summarizes these effects, excluding electrolyte ohmic (iR) losses, for a catalyzed reaction (0.5-2.0 mg noble metal/cm2) with carbon-based porous electrodes for H2 oxidation and O2 reduction in 9N KOH at 55-60°C. The electrode technology was similar to that employed in the fabrication of PAFC electrodes.

4-13
Figure 4-8 iR-Free Electrode Performance with O2 and Air in 9 N KOH at 55-60°C. Catalyzed (0.5 mg Pt/cm2 Cathode, 0.5 mg Pt-Rh/cm2 Anode) Carbon-based Porous
Electrodes (22) The results in Figure 4-8 yield the following current density equations for cells operating in 9N KOH at 55-60°C: ∆VJ (mV) = -0.18∆J for J = 40 - 100 mA/cm2 operating in O2 (4-8) or ∆VJ (mV) = -0.31∆J for J = 40 - 100 mA/cm2 operating in air (4-9) where J is in mA/cm2. The performance of a single cell with supported noble metal electrocatalyst (0.5 mg Pt-Rh/cm2 anode, 0.5 mg Pt/cm2 cathode) in 12N KOH at 65oC is shown in Figure 4-9 (21). These results, reported in 1986, are comparable to those obtained in 1965. The iR-free electrode potentials (vs. RHE) at 100 mA/cm2 in Figure 4-9 are 0.9 V with O2 and 0.85 V with air. One major difference between the early cathodes and the cathodes in current use is that the limiting current for O2 reduction from air has been improved (i.e., 100-200 mA/cm2 improved to >250 mA/cm2). These results yield the following equations for cells operating in 12N KOH at 65oC: ∆VJ (mV) = -0.25∆J for J = 50 - 200 mA/cm2 operating in O2 (4-10) or
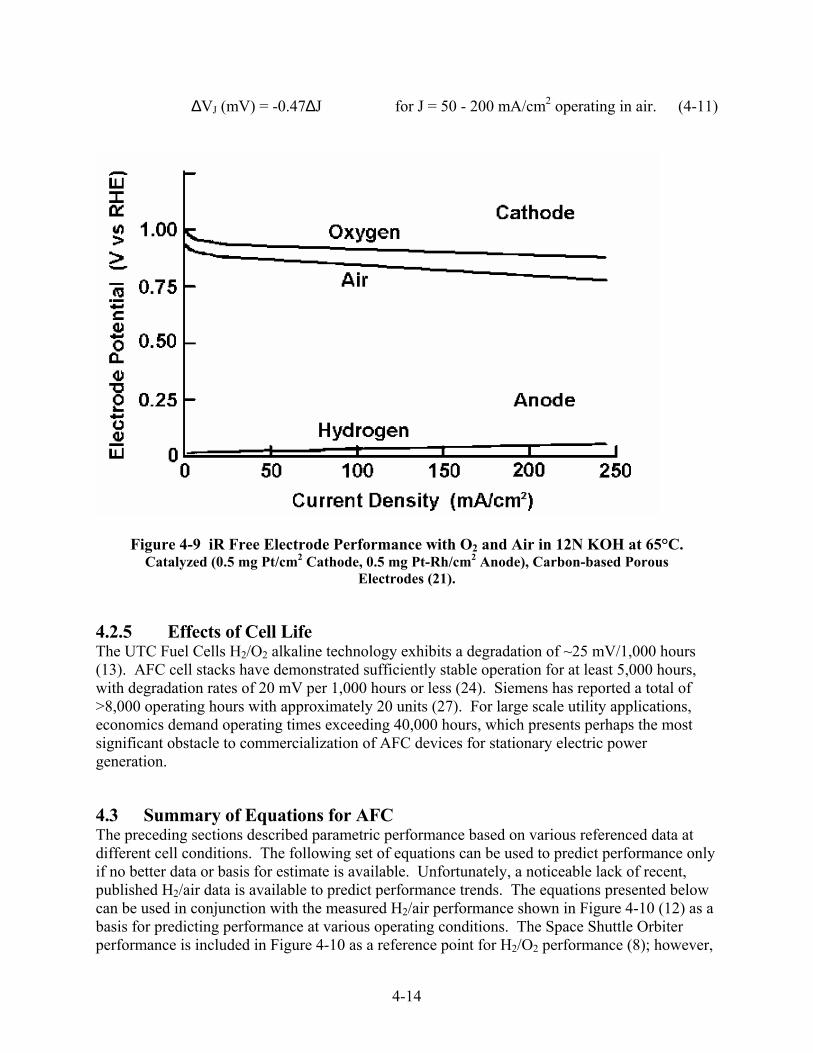
4-14
∆VJ (mV) = -0.47∆J for J = 50 - 200 mA/cm2 operating in air. (4-11)
Figure 4-9 iR Free Electrode Performance with O2 and Air in 12N KOH at 65°C. Catalyzed (0.5 mg Pt/cm2 Cathode, 0.5 mg Pt-Rh/cm2 Anode), Carbon-based Porous
Electrodes (21). 4.2.5 Effects of Cell Life The UTC Fuel Cells H2/O2 alkaline technology exhibits a degradation of ~25 mV/1,000 hours (13). AFC cell stacks have demonstrated sufficiently stable operation for at least 5,000 hours, with degradation rates of 20 mV per 1,000 hours or less (24). Siemens has reported a total of >8,000 operating hours with approximately 20 units (27). For large scale utility applications, economics demand operating times exceeding 40,000 hours, which presents perhaps the most significant obstacle to commercialization of AFC devices for stationary electric power generation. 4.3 Summary of Equations for AFC The preceding sections described parametric performance based on various referenced data at different cell conditions. The following set of equations can be used to predict performance only if no better data or basis for estimate is available. Unfortunately, a noticeable lack of recent, published H2/air data is available to predict performance trends. The equations presented below can be used in conjunction with the measured H2/air performance shown in Figure 4-10 (12) as a basis for predicting performance at various operating conditions. The Space Shuttle Orbiter performance is included in Figure 4-10 as a reference point for H2/O2 performance (8); however,

4-15
the trend equations should not be used for H2/O2 cells to predict operation at other conditions. Parameter Equation Comments Pressure ∆VP (mV) = 0.15 T (oK) log (P2/P1) 1 atm < P < 100 atm (4-4) 100 oC < T < 300 °C Temperature ∆VT (mV) = 4.0 (T2-T1) for T < 63°C, at 100 mA/cm2 (4-5) Temperature ∆VT (mV) = 0.7 (T2-T1) for T > 63°C, at 100 mA/cm2 (4-6) Current Density ∆VJ (mV) = -0.18∆J for J = 40-100 mA/cm2 operating in O2 (4-8) with 9N KOH at 55-60°C. ∆VJ (mV) = -0.31∆J for J = 40-100 mA/cm2 operating in air (4-9) with 9N KOH at 55-60°C. ∆VJ (mV) = -0.25∆J for J = 50-200 mA/cm2 operating in O2 (4-10) with 12N KOH at 65°C. ∆VJ (mV) = -0.047∆J for J = 50-200 mA/cm2 operating in air (4-11) with 12N KOH at 65°C. Life Effects ∆VLifetime (mV) = 20 µV per 1,000 hours or less (4-12)
0.6
0.7
0.8
0.9
1
1.1
0 100 200 300 400 500 600 700
Current Density (mA/cm2)
Cel
l Vol
tage
(V)
2002 (H2/O2, 95oC, 4 atm., immobilized, 35% KOH/65% H2O)
2001 (H2/air, 75oC, 1 atm.circulating, 12N KOH, 10%
Figure 4-10 Reference for Alkaline Cell Performance

4-16
4.4 References 1. F.T. Bacon, Electrochim. Acta, 14, 569, 1969. 2. J.O’M Bockris and A.J. Appleby, Energy, 11, 95, 1986. 3. A.J. Appleby, Energy, 11, 13, 1986. 4. K.F. Blurton and E. McMullin, Energy Conversion, 9, 141, 1969. 5. K.V. Kordesch, Brennstoffbatterien, Springer-Verlag, New York, 1984. 6. V. Hacker, P. Enzinger, M. Muhr, K. Kordesh, J. Gsellman, M. Cifrain, P. Prenninger, K.
Meitz, R. Aronsson, “Advantages of Alkaline Fuel Cell Systems for Mobile Applications,” 2000 Fuel Cell Seminar Program and Abstracts, Portland, OR; sponsored by the Fuel Cell Seminar Organizing Committee, October 30 – November 2, 2000.
7. G.F. McLean, T. Niet, S. Prince-Richard, N.Djilali, “An assessment of alkaline fuel cell technology,” University of Victoria, in International Journal of Hydrogen Energy, p. 507 –526, 27 (2002).
8. Communication with UTC Fuel Cells, July, 2002. 9. K. V. Kordesch, G. Simader, “Fuel Cells and Their Applications,“ Wiley, Weinheim – New
York – Tokyo 1996. 10. D.W. Sheibley and R.A. Martin, Prog. Batteries Solar Cells, 6, 155, 1987. 11. K. Strasser, J. Power Sources 29, 152-153, 1990. 12. M. Cifrain, K. Kordesch, J. Gsellmann, T. Hejze, R. R. Aronson, “Alkaline Fuel Cells with
Circulating Electrolytes,” Poster presented at Fuel Cell Seminar 2000, Portland, Oregon, October 30-November 2, 2000.
13. Meeting with UTC Fuel Cells, June 2002. 14. K. Strasser, J. Electrochem. Soc. 127, 2173-2177, 1980. 15. H. van den Broeck, G. van Bogaert, G. Vennekens, L. Vermeeren, F. Vlasselaer, J.
Lichtenberg, W. Schlösser, A. Blanchart, Proc. 22nd IECEC Meeting, 1005, Philadelphia, 1987.
16. J. Huff, paper presented at the 1986 "Status of Fuel Cell Technologies," Fuel Cell Seminar Abstracts, Fuel Cell Seminar, Tucson, AZ, October 26-29, 1986.
17. A.M. Adams, F.T. Bacon and R.G.H. Watson, Fuel Cells (W. Mitchell, ed.), Academic Press, New York, 138,1963.
18. S.S. Penner, ed., Assessment of Research Needs for Advanced Fuel Cells, DOE/ER/300.60-T1, US DOE, 1985.
19. Fuel Cell Seminar Abstracts, Long Beach, CA; sponsored by the National Fuel Cell Coordinating Group, October 23-26, 1988.
20. J. Larminie, A. Dicks, "Fuel Cell Systems Explained," Wiley, Chichester (GB) 2000. 21. K. Tomantschger, F. McClusky, L. Oporto, A. Reid and K. Kordesch, J. Power Sources, 18,
317, 1986. 22. M.B. Clark, W.G. Darland and K.V. Kordesch, Electrochem. Tech., 3, 166, 1965. 23. J. McBreen, G. Kissel, K.V. Kordesch, F. Kulesa, E.J. Taylor, E. Gannon and S. Srinivasan,
in Proceedings of the 15th Intersociety Energy Conversion Engineering Conference, Volume 2, American Institute of Aeronautics and Astronautics, New York, NY, 886, 1980.
24. J.M.J. Blomen and M.N. Mugerwa ed., Fuel Cell Systems, Plenum Press, New York and London, 251, 1993.

4-17
25. K. Kordesch, J. Gsellmann and B. Kraetschmer, in Power Sources, 9, Edited by J. Thompson, Academic Press, New York, NY, 379, 1983.
26. E. Guelzow, M. Schulze, “Long Time Operation of AFC Electrodes with CO2 Containing Gases,” 8th Ulm ElectroChemical Talks, Neu-Ulm, Germany, Abstracts p. 68, June 20-21, 2002.
27. K. Strasser, L. Blume and W. Stuhler, Fuel Cell Seminar Program and Abstracts, Long Beach, CA; sponsored by the National Fuel Cell Coordinating Group, October 23-26, 1988.


![Untitled-13 [courses.washington.edu]courses.washington.edu/nutr526/resources/ADAPregnancy.pdfTitle: Untitled-13 Created Date: 00000000000000Z](https://img.dokumen.tips/doc/110x75/5f7a5c71aa90ec1a0e56ce5a/-untitled-13-title-untitled-13-created-date-00000000000000z.jpg)