Embed Size (px)
DESCRIPTION
From Crisis to Recovery In A Multi-Polar World. IMF Regional Economic Outlook October 2010. Dr. Nasser Saidi, Chief Economist & Head of External Relations, DIFC Authority 24 th October 2010. Agenda. Decoupling: Moving ahead, but @ different speeds. - PowerPoint PPT Presentation
Citation preview

From Crisis to Recovery In A Multi-Polar WorldIMF Regional Economic Outlook October 2010
Dr. Nasser Saidi,Chief Economist & Head of External Relations, DIFC Authority
24th October 2010

Agenda
Decoupling: Moving ahead, but @ different speeds
Increasing links with Asia: Trade & Financial Linkages
New Economic Geography Necessitates Policy Reforms

Decoupling: Back to the Forefront• The Oct 2010 WEO forecasts emerging market
economies (EMEs) to grow at 7.1% compared to advanced economies 2.7%.
• Business cycles are becoming more closely linked intra industrial countries & EMEs.
• However, there is a decoupling of business cycles b/n the two groups (Kose, Otrok & Prasad, 2008).
• Decoupling has resulted from increased trade & financial flows between EMEs.
Stylised facts on EMEs:
• Fiscal consolidation + financial sector reforms in years preceding the crisis contributed to resilience to the Great Recession
• Felt the effects of the global crisis later than the advanced economies, but have also recovered more sharply.
• By 2030, Asian GDP is expected to exceed that of the G7 major industrial economies.
Source: IMF WEO, Oct 2010, Llaudes et.al (2010)
-4
-2
0
2
4
6
8
10
Advanced Eco's
MENA
Emerging&DevelopingEco's
Evident Divergence in Economic Growth
Increasing Links with Asia• Asia now accounts for about a third of the global economy, up from under just a fifth in 1980.
• Emerging Asia’s share of world trade has doubled and of world GDP tripled in the past two decades.
• On current trends, Asia will be about 50% larger than it is today (in purchasing-power-parity terms) and could be as large as the US and the EU combined by 2015.
• Post-crisis recovery in Asia is driven by two engines: exports and strong domestic demand. Strong domestic demand reflects in part policy stimulus, but resilient private demand is also a factor.
• GCC/ME recovery dependent on region’s strong Trade & Financial linkages with Asia
Source: IMF WEO Oct 2010, DIFC Economics, Singh (2010): “Asia Leading the Way”, Finance & Development, March 2010
0.0
5.0
10.0
15.0
20.0
25.0
30.0
35.0
1990 2000 2009 2010 2015
China India Other Asia
Asia's share of world GDPpercent
0.0
10.0
20.0
30.0
40.0
50.0
60.0
70.0
80.0
1990 2000 2009 2010 2015
Asia EU US
GDPtrillion dollars

GCC Increasing Links with Asia: Trade• Crisis led to sharp downturns in the more
export-oriented economies of Asia
• But, recent data (H1-2010) suggest that GCC-Asia trade has bounced back to pre-crisis levels (Q3 2008).
• Asia is currently the GCC’s largest trade partner in exports (23.5% of total GCC trade);
• Asia is second trade partner (26.3%) to EU (28%) in GCC imports.
• Within Asia, India and China have the largest share of trade with the GCC.
• Gulf countries increasingly integrated into Asia global supply chain: e.g. oil, gas, aluminum
• Increasingly important role of infrastructure & trade logistics in increasing connectedness & growing intra-industry trade
Source: IMF DOTS, DIFC Economics
0
5000
10000
15000
20000
25000
30000
35000
Q1
20
00
Q3
20
00
Q1
20
01
Q3
20
01
Q1
20
02
Q3
20
02
Q1
20
03
Q3
20
03
Q1
20
04
Q3
20
04
Q1
20
05
Q3
20
05
Q1
20
06
Q3
20
06
Q1
20
07
Q3
20
07
Q1
20
08
Q3
20
08
Q1
20
09
Q3
20
09
Q1
20
10
GCC: Rising Role of India & China
China India Korea
USD mn
0100002000030000400005000060000700008000090000
Q1
20
00
Q3
20
00
Q1
20
01
Q3
20
01
Q1
20
02
Q3
20
02
Q1
20
03
Q3
20
03
Q1
20
04
Q3
20
04
Q1
20
05
Q3
20
05
Q1
20
06
Q3
20
06
Q1
20
07
Q3
20
07
Q1
20
08
Q3
20
08
Q1
20
09
Q3
20
09
Q1
20
10
Asia EU US Japan
GCC's Growing Links with Asia

Major Trading Partners of the GCC - Exports
Asia, 14.1 Africa, 3.4Middle East exclu. Intra-
GCC, 2.2
EU, 11.3
US, 10.6Japan, 23.3
Other Advanced
Economies, 20.8
Others, 9.92000
Asia, 23.5
Africa, 3.0
Middle East exclu. Intra-
GCC, 4.2EU, 6.7
US, 6.8Japan, 17.9
Other Advanced
Economies, 20.4
Others, 10.92009
Asia’s rising share in exports
Source: IMF DOTS, DIFC Economics

Major Trading Partners of the GCC - Imports
Source: IMF DOTS, DIFC Economics
Asia, 14.2 Africa, 1.4
Middle East exclu. Intra-GCC, 11.7
EU, 33.2US, 13.0
Japan, 10.1
Other Advanced
Economies, 20.6
Others, 6.02000
Asia, 26.3
Africa, 1.2
Middle East exclu. Intra-
GCC, 2.9
EU, 28.0
US, 10.3
Japan, 6.2
Other Advanced
Economies, 17.2
Others, 5.9 2009
GCC’s Major Import Partners – the EU and Asia dominate
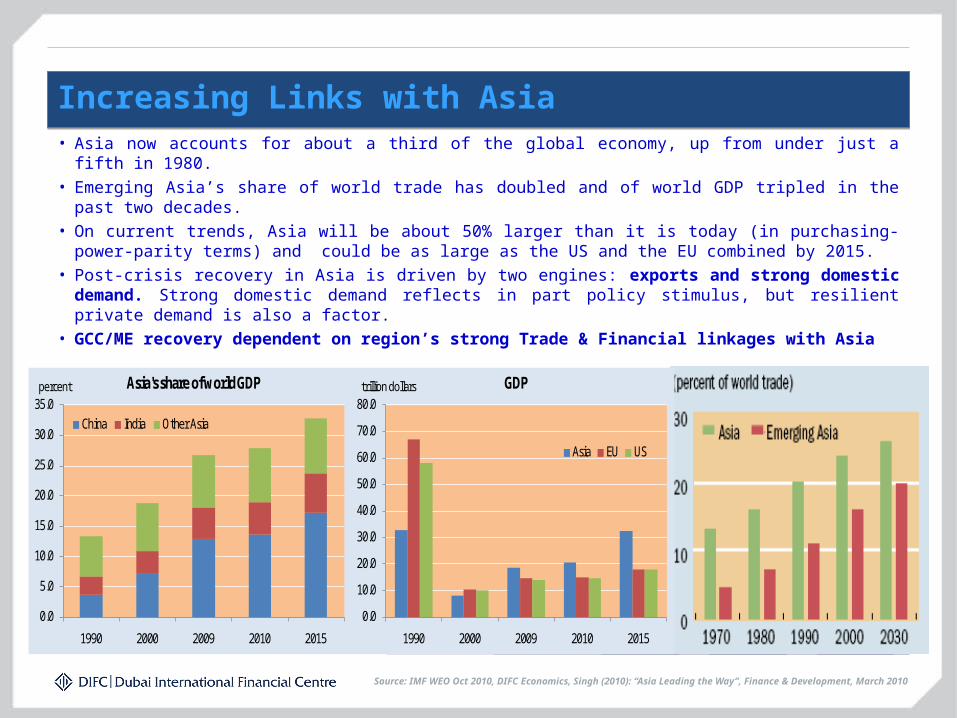
Composition of World Equity Markets: 1999-2010
Source: S&P, as of Sep 2010
1999 2000 2001 2002 2003 2004 2005 2006 2007 2008 2009 2010(E)
World Market Cap 100% 100% 100% 100% 100% 100% 100% 100% 100% 100% 100% 100%United States 46% 47% 50% 47% 45% 43% 39% 36% 31% 33% 31% 31%Rest of Developed 46% 45% 41% 42% 44% 44% 44% 44% 41% 41% 41% 39%Emerging Markets 8% 8% 9% 11% 12% 13% 16% 20% 28% 26% 28% 30%BRIC 2% 3% 3% 3% 4% 4% 6% 9% 17% 15% 17% 17%Rest of Emerging 6% 5% 6% 7% 7% 9% 11% 10% 11% 11% 11% 12%of which GCC 0.3% 0.3% 0.4% 0.9% 0.9% 1.3% 2.5% 1.3% 1.7% 2% 1% 1%
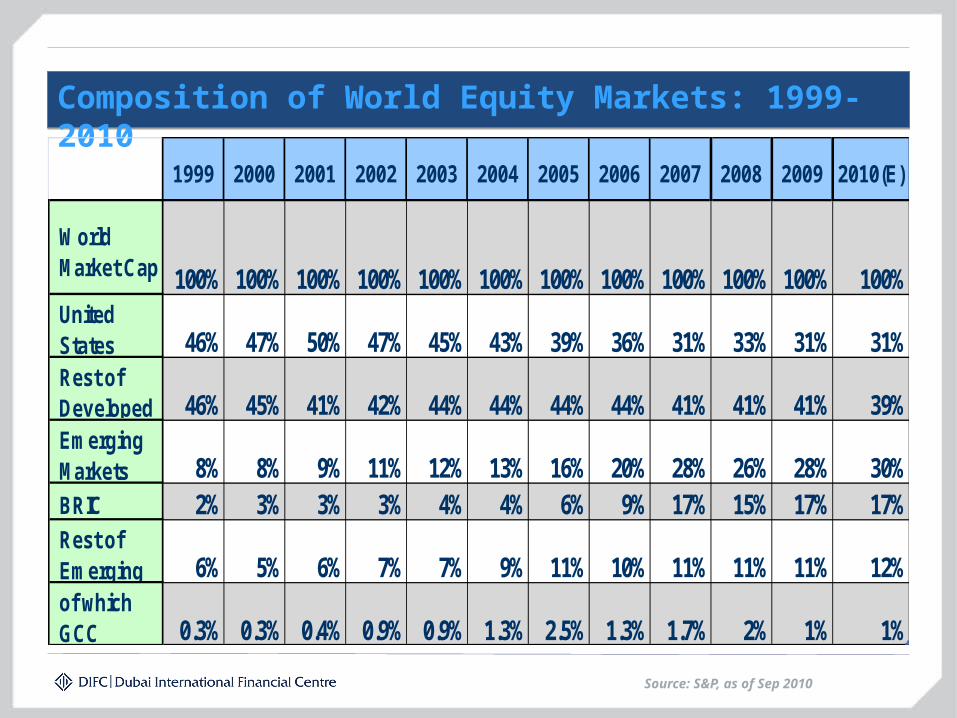
MENA needs to grow intra-industry trade & link with AsiaGrubel Lloyd Index of Intra-Industry Trade by Area

Policy Reform I: Re-Orient Trade & Investment Policies
•GCC/ME should re-orient Trade, Investment & Financial linkages towards Asia:• Free Trade & Investment Agreements with China, India, ASEAN• Chiang Mai Agreement
•Strengthen financial linkages by:• Linking Stock Exchanges• Integrating Payment systems• Regulatory & Supervisory Agreements: e.g. DFSA MRA with Malaysia
•DIFC signed MOU with Hong Kong Monetary Authority and currently in the process of developing close relations with major financial centres with EMEs in Asia, Africa. LATAM
•Move towards a ‘spider-web’ of financial markets away from ‘hub-spoke’ model
0%
10%
20%
30%
40%
50%
60%
70%
80%
90%
100%
European Union
United States
Japan Newly indus. Asia
Asia Western Hemi
MENA
Bank Assets Total Debt Securities Stock Market Capitalization
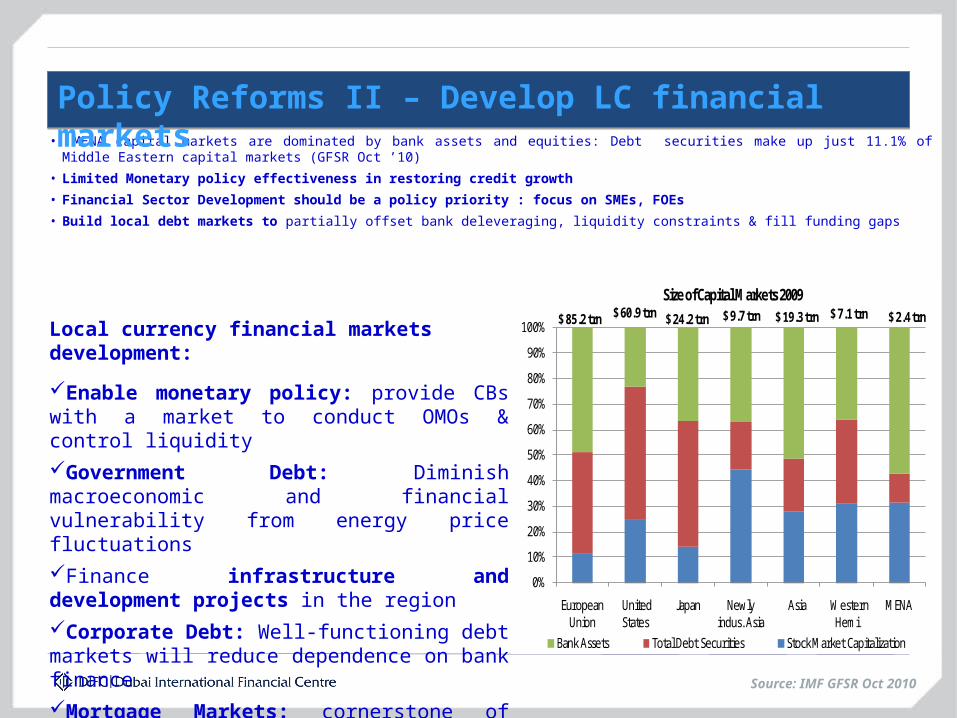
Size of Capital Markets 2009$ 85.2 trn $ 60.9 trn $ 24.2 trn $ 9.7 trn $ 19.3 trn $ 7.1 trn $ 2.4 trn
• MENA capital markets are dominated by bank assets and equities: Debt securities make up just 11.1% of Middle Eastern capital markets (GFSR Oct ’10)
• Limited Monetary policy effectiveness in restoring credit growth
• Financial Sector Development should be a policy priority : focus on SMEs, FOEs
• Build local debt markets to partially offset bank deleveraging, liquidity constraints & fill funding gaps
Source: IMF GFSR Oct 2010
Policy Reforms II – Develop LC financial markets
Local currency financial markets development:
Enable monetary policy: provide CBs with a market to conduct OMOs & control liquidity
Government Debt: Diminish macroeconomic and financial vulnerability from energy price fluctuations
Finance infrastructure and development projects in the region
Corporate Debt: Well-functioning debt markets will reduce dependence on bank finance
Mortgage Markets: cornerstone of housing finance
Expansionary Fiscal Policies: What next?
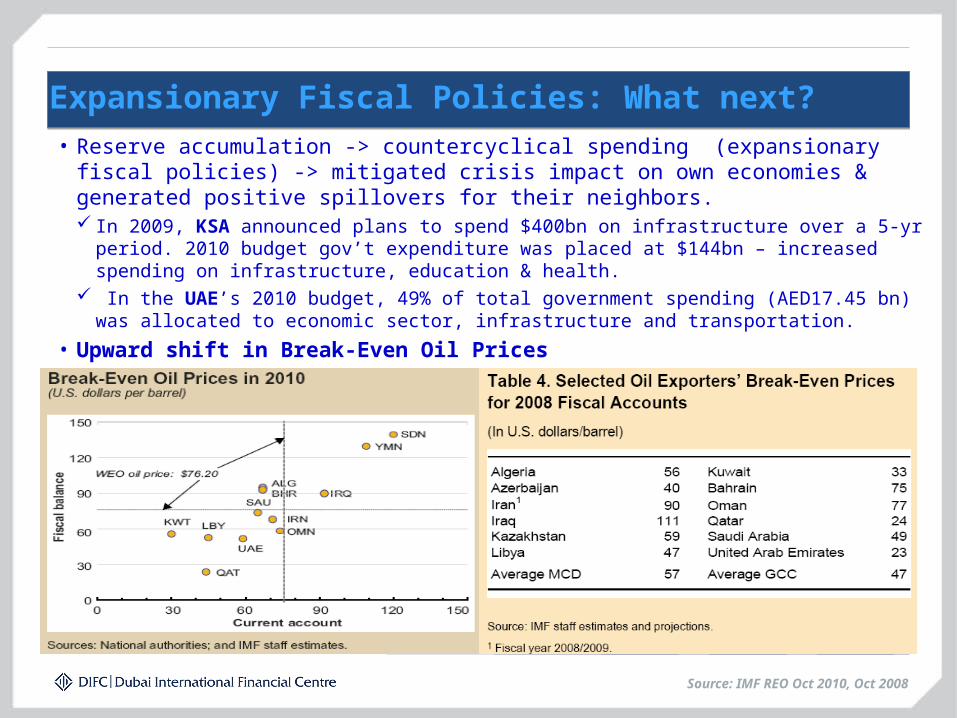
Source: IMF REO Oct 2010, Oct 2008
• Reserve accumulation -> countercyclical spending (expansionary fiscal policies) -> mitigated crisis impact on own economies & generated positive spillovers for their neighbors. In 2009, KSA announced plans to spend $400bn on infrastructure over a 5-yr period. 2010 budget
gov’t expenditure was placed at $144bn – increased spending on infrastructure, education & health. In the UAE’s 2010 budget, 49% of total government spending (AED17.45 bn) was allocated to
economic sector, infrastructure and transportation.
• Upward shift in Break-Even Oil Prices

Policy Reforms III: Rev. Diversification + Pvt Sec Participation
• Fiscal stimulus/counter-cyclical spending => major driver of recovery
• But: Increase in Structural Non-Oil Deficits
• Economic diversification dependent on increased private participation by SMEs and FOEs
• Policy reforms required including:
Fiscal policy focus on non-oil deficits
Review distorting fuel subsidies
Revenue diversification: GCC-wide VAT
Decrease Cost of Doing Business;
Attract private sector participation;
Infrastructure development (through PPPs).
Source: IMF REO, Oct 2010
2006 2007 2008 2009 2010f 2011fBH -28.3 -29.6 -31.9 -34.3 -34.8 -32.1KW -30.3 -27.7 -76.1 -69.8 -69.9 -70.6OM -54.5 -47.5 -54.8 -52 -58.1 -56.3QA -40.6 -30.7 -20.4 -9.3 -17.4 -23.4KSA -44.8 -51.3 -49.8 -63.4 -65.7 -61.2UAE -13.7 -14.2 -27.9 -37.3 -31.8 -22.9GCC -37.8 -39.9 -46.9 -53.5 -54.6 -51.1
General Government Non-Oil Fiscal Balance (% of non-oil GDP)
Policy Reforms IV: Structural Reforms
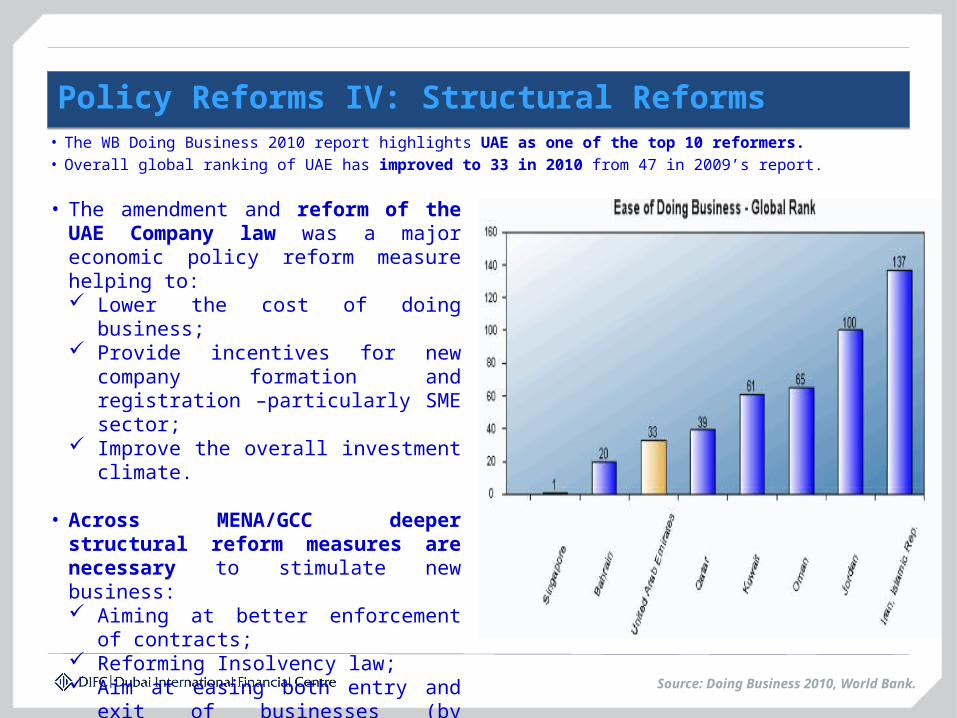
Source: Doing Business 2010, World Bank.
• The WB Doing Business 2010 report highlights UAE as one of the top 10 reformers.• Overall global ranking of UAE has improved to 33 in 2010 from 47 in 2009’s report.
• The amendment and reform of the UAE Company law was a major economic policy reform measure helping to: Lower the cost of doing business; Provide incentives for new company
formation and registration –particularly SME sector;
Improve the overall investment climate.
• Across MENA/GCC deeper structural reform measures are necessary to stimulate new business: Aiming at better enforcement of
contracts; Reforming Insolvency law; Aim at easing both entry and exit of
businesses (by reducing cost and minimizing uncertainty).
Summing Up: Policy Priorities to sustain recovery
New Silk Road requires shift in trade, investment & financial policies towards Asia and EMEs
Engage in design of new International Financial Architecture, Policy & Regulation
Develop Local Currency Financial Markets
Access to Finance for SMEs & FOEs
Fiscal Reform: Revenue diversification/ Expenditure rationalisation
Increased Private Sector Participation
Infrastructure Development through Public-Private Partnerships
Insolvency/ Bankruptcy & Creditor Rights frameworks

Thank You!